1. Introduction
During previous space atmospheric explorations, quadrupole mass spectrometry (QMS) was usually utilized for analyzing isotopic compositions and complicated compounds in the mixture. However, the inevitable ion scattering and drift during mass transfer, as well as the QMS attenuator loss, results in a relatively lower signal-to-noise ratio of the produced mass spectrum. In recent years, a novel mass spectrometer, called Orbitrap mass spectrometer (Orbitrap), has been gradually accepted and used because of its non-destructive detection ability, high mass resolution, and accuracy [
1]. The working principles and detection methods of Orbitrap and FTMS are similar, so their data acquisition systems are often interchangeable. When the mass number is very small, the signals generated in the Orbitrap have higher frequencies. The Orbitrap mass spectrometer utilizes electrostatic field excitation, while the FTMS uses magnetic field excitation. Therefore, the Orbitrap is more advantageous for compact integration, making it suitable for space exploration [
1].
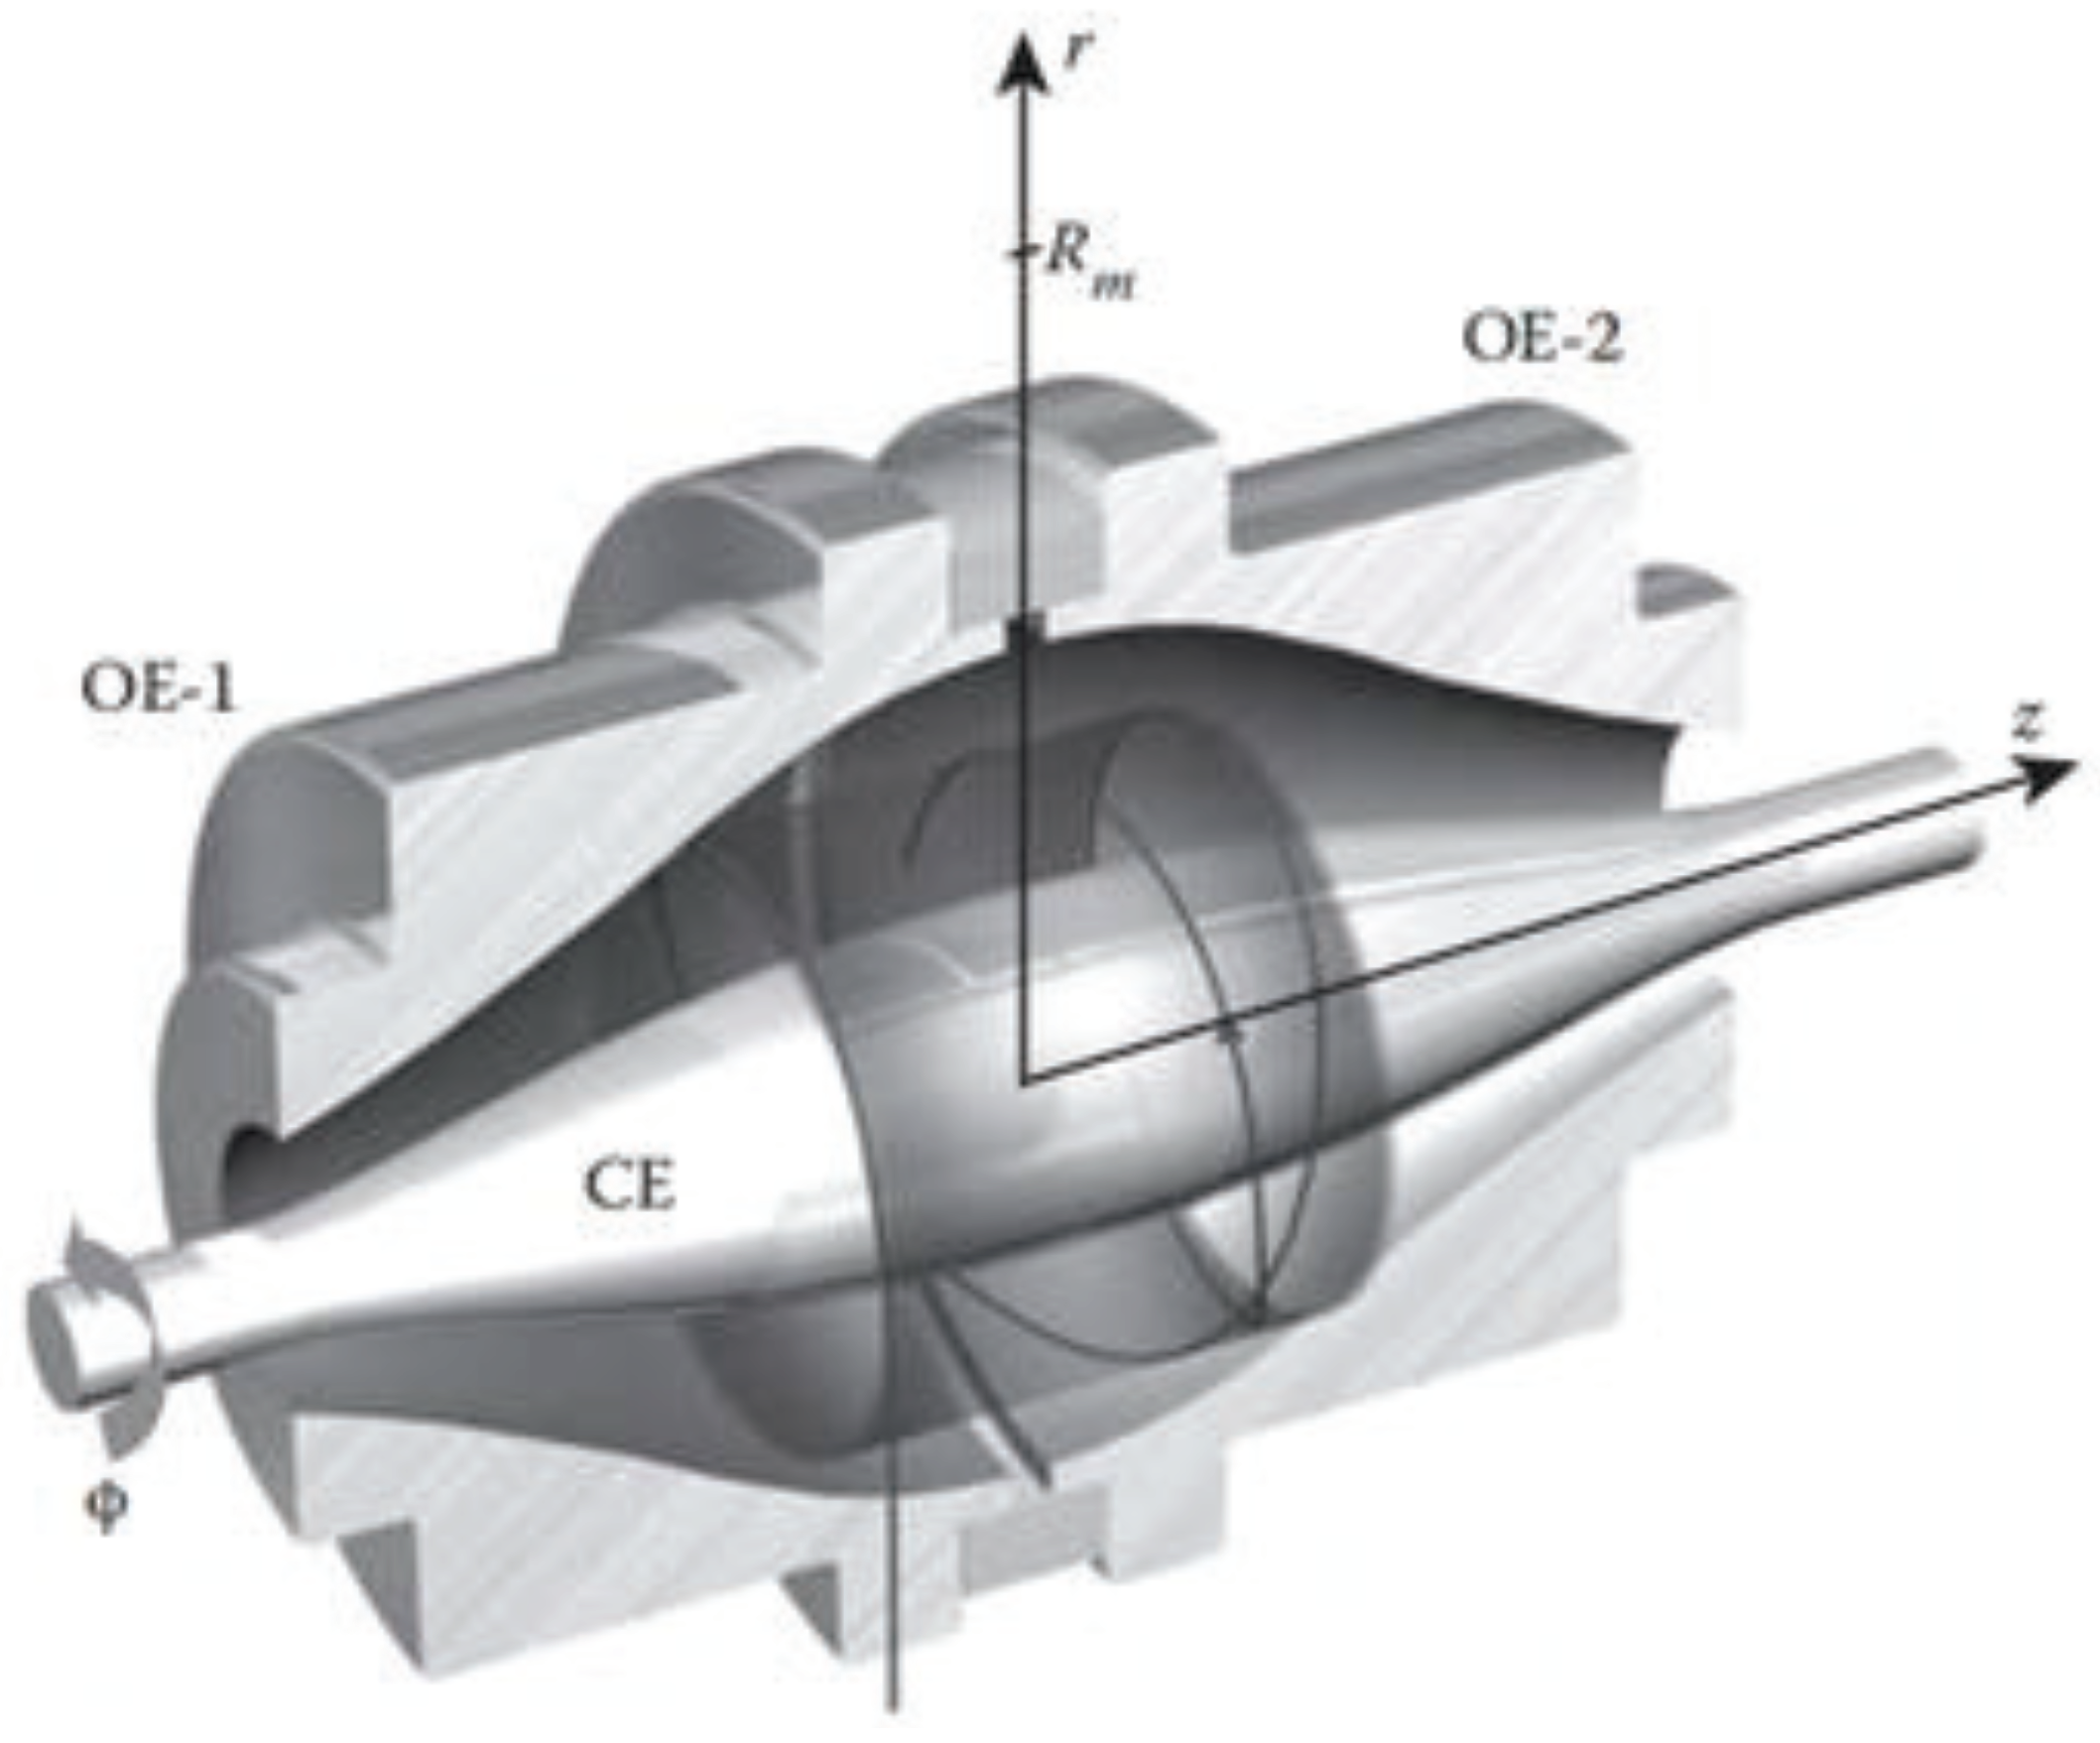
The following paragraph describes the ion detection method in Orbitrap. The Orbitrap analyzer is shown in
Figure 1. The motion of ions in an Orbitrap can be classified into three types of resonant motion: radial, axial, and azimuthal. Radial motion refers to the oscillation of ions confined between the center electrode and the outer half electrode, with a frequency of
. Azimuthal motion is the rotational motion of ions around the center electrode, with a frequency of
. Axial motion involves ions oscillating. In the axial direction, ions move back and forth along the center electrode, also known as resonant motion, with a frequency of
.
The axial frequency is independent of the initial velocities and coordinates of the ions and follows Equation (
1). The term k is related to the field curvature associated with the structure, and for a specific mass spectrometer, it is a constant that remains unchanged.
Ideally, the current signal produced by an ion with a single mass number would resemble a sine wave. Its magnitude can be calculated using the following Equation (
2). However, due to the presence of energy attenuation, it ultimately appears as an exponentially decaying sine wave. In situations where amplitude information is not of significant concern, or when the required sampling time is relatively short, it may be approximated as a sine wave.
The weak current signal generated by the Orbitrap needs to be linearly amplified before it can be collected by the data acquisition system. The operating voltage of the existing ADCs typically range from ±0.5 V to ±10 V, with the most common voltage range being ±1 V to ±2.5 V. The current signal from the Orbitrap mass analyzer needs to be amplified to a voltage within the range of the ADC’s operating voltage to be effectively detected without being overwhelmed by noise. The signal generated by the excitation of multiple gases is represented as a mixture of signals with different periods and amplitudes in the time domain [
1]. The amplitude of the induced current is related to the number of molecules or atoms, and the current increases with the number of molecules or atoms. An existing amplifier circuit can be adapted for use in the Orbitrap by appropriately modifying the resistance and capacitance values [
2]. Because this study focuses on the data acquisition system, it is assumed that the signal has been linearly amplified to a range of maximum ±5 V and minimum ±50 mV.
Atmospheric mass spectrometry detection generally focuses on detecting gases such as O
, N
, Rare Gases (e.g., He, Ne, Ar, Kr, Xe), H
O, CO, CO
, NO, and NO
[
3,
4,
5]. There are some possible ingredients for a mass range of 1–50 amu displayed in
Table 1, while amu is a unit of mass number that represents 1/12 of the mass of a carbon-12 isotope atom. After determining the frequency of the signal, we used Equation (
1) to calculate the corresponding mass-to-charge ratio. By referring to this table, we were able to infer the corresponding atmospheric component.
The standard Orbitrap mass analyzer typically has a frequency range of 0.1–7 MHz for ions that are trapped with m/z in the range of 1–4000. The oscillation frequencies of common gas molecules in the atmosphere, such as nitrogen, oxygen, and hydrogen, range from 0.8 MHz to 4.8 MHz [
6].
After amplification, the system undergoes analog-to-digital conversion (ADC) and is processed by the corresponding controller to complete data acquisition and processing. Both Orbitrap and FTMS are demanding techniques that require a high-performance data acquisition system, characterized by good real-time performance and anti-interference capability. Such systems enable efficient acquisition and processing of high-quality mass spectral data, which are crucial for accurate measurement and analysis of complex molecular structures [
7].
Compared to other types of mass spectrometers, the data acquisition systems of FTMS or Orbitrap require higher sampling rates, support for continuous signal acquisition and processing, higher precision and dynamic range, and close integration with Fourier transform and mass spectrometry analysis algorithms to meet the requirements of high-resolution and high-quality mass spectrometry signals. There are many applications for mass analysis using Orbitrap or FTMS, but they use existing instruments, and the instrument merely provides data that have been processed and denoized [
8,
9,
10,
11]. Existing commercial Orbitrap are all from Thermo Fisher Scientific Inc. Their commercial Orbitrap has many functions and has huge volume at the same time. The hardware scheme of its self-contained data acquisition system is not disclosed, but the data processing scheme shows that the data collected through the hardware is defined as mass spectrum RAW format, and it is subsequently further processed using Xcalibur, a supporting software [
12].
Access to the original data allows for the most informative and efficient data processing. Certain studies have already adopted an external data acquisition device, the FTMS Booster [
13,
14,
15,
16]. This comes in different versions, encapsulating functionalities such as signal amplification, storage, communication, and signal processing. The acquisition part utilizes a high-performance FPGA and ADC architecture. Moreover, the device includes an industrial control computer, programmed with software using python to facilitate data analysis and peak detections. Pieter C. Kooijmanr used the FTMS Booster X1 system to achieve signal collection using FPGA, data transmission through the PCIE bus, detection of start and stop times from the host computer using DSP algorithms in FPGA, and finally performed relevant data processing using a dedicated computer. The DSP algorithm was implemented using Xilinx synthesis tools and LabVIEW. This system successfully realized high-speed acquisition and transmission of FTMS signals [
17].
The CORALS (Characterization of Ocean Residues And Life Signatures) mass spectrometer is designed for the exploration of liquid water, carbon-rich materials, and biomolecules on Jupiter’s moon Europa. It is an Orbitrap capable of detecting components with a mass range of 23–900 u. A custom-made FPGA board was used for instrument control. Specially designed mechanisms and techniques are adopted to fulfill the data acquisition and Fourier transform requirements. The data acquisition process in the mentioned task is accomplished with the assistance of a National Instruments (NI) DAQ card. Meanwhile, the corresponding LabVIEW software is responsible for carrying out the fast Fourier transform (FFT) analysis [
6]. In some cases, it is necessary to design hardware for one’s own application. Currently, there are very few self-designed hardware circuit acquisition solutions for FTMS and Orbitrap. Dayu Li developed a dedicated system with a high sampling rate of 12 Million samples per second (Msps) and a high accuracy of 14 bits. The system operates with a Cyclone II series FPGA and an ADS850 ADC. The ADS850 includes a high-bandwidth track-and-hold that provides excellent spurious performance up to and beyond the Nyquist rate, and it has a good noise performance, with sufficient high bit depth. The system can perform good data acquisition for mass spectrum. After the data acquisition stage, the digital signals are transmitted and further processed on a computer with appropriate software packages integrated [
7].
Utilizing FPGA acceleration to implement preprocessing and conversion of mass spectrometry signals can improve the analysis speed and precision of mass spectrometry instruments [
18,
19,
20]. However, in order to meet the convenience of operation, the intuitiveness of display, and to achieve ultra-high resolution, previous studies have all been carried out through industrial computer software. The algorithms implemented in FPGAs are actually executed in a hardware-based manner [
18,
19,
20]. To meet the requirement of miniaturized integration of instruments for aerospace exploration, building on the foundations laid by previous researchers, a FPGA and ADC-based data acquisition system that can analyze down to a mass-to-charge ratio of 2 is proposed. This system aims to distinguish the frequency and relative magnitude of the induced electric signal of atmospheric gas ions at mass numbers below 50 and analyze the mass spectrometry signal through Fourier transform analysis using an FPGA instead of computer software. The system combines the actual needs of the measured components and does not pursue extremely high resolution, as the actual hardware resource requirements also need to be taken into account.
In this article, we first discuss the main signal characteristics of Orbitrap. Furthermore, we will discuss the relationship between quality resolution, sampling rate, and the number of FFT points, making the requirements more explicit. We will then give a detailed description of the designed system, including hardware design, signal processing algorithms, and data communication. To verify the system’s performance, a series of experiments, including signal acquisition and FFT verification, were conducted. The experimental results demonstrate that the designed data acquisition system effectively meets the performance requirements in atmospheric detection.
2. Related Work
In the measurement of signal frequencies, the frequency counting technique is commonly utilized; however, it is primarily suited to measuring a single signal frequency. A different method involves using variable or multiple band-pass filters for multiple filtering to determine the frequency of the signal [
21]. However, the implementation of this method presents significant challenges due to the wide frequency bandwidth required in the application scenario of this project. Therefore, this study utilizes the FFT method to decompose the signal into fundamental frequencies and multiple harmonics, thereby identifying potential frequency components of the signal [
22]. The frequency resolution is dependent on the duration of signal collection, with a higher resolution achieved through longer recording times but requiring greater storage capacity from the controller [
23]. The expression for frequency resolution is given by:
. Where
is the frequency resolution, Hz;
N is the number of points used for spectral resolution; and
is the sampling rate, Hz.
Analysis of periodic signals with finite length is equivalent to multiplying with a rectangular window in the time domain and convolution with a Sinc function in the frequency domain. When the two signals being measured satisfy the relationship as in Equation (
3), the main lobe region of the spectral graph centered on the two signals will not overlap, and both peaks can be distinguished completely [
24].
where
and
represent the frequencies of the two signals to be distinguished, Hz, and
T is the duration of the signal, seconds.
When the two signals satisfy the relationship in Equation (
4), their peaks will overlap to some extent, but they can still be distinguished. As the signal spacing decreases further, it will become increasingly difficult to distinguish two signals on the spectral graph.
The signal can be fully restored if the sampling frequency satisfies the Nyquist sampling theorem—that is, the sampling frequency must be greater than twice the highest frequency in the signal; otherwise, aliasing will occur [
25]. In practical engineering applications, the sampling rate is usually three to five times the highest frequency of the signal. In this study, we chose a sampling clock of 25 MHz.
For the gas component to be tested, we can draw from existing applications that the closest frequency interval is approximately 20 kHz [
6,
26]. In order to obtain a more accurate spectral graph and minimize overlap, the frequency resolution should be set to above 10 kHz when designing the spectral analysis system, that is, numerically less than 10 kHz according to Equation (
3). At least 2500 points are needed to achieve a resolution of 10 kHz. Because the FFT algorithm decomposes a long sequence into operations with smaller numbers of points through butterfly operations [
27], using the power-of-two-point calculation is more efficient. The selection of FFT points is related to the logical resources available on the chip. In FPGAs, the block RAM (BRAM) is a relatively scarce resource. In situations that require high resolution, external storage can be utilized to achieve optimal resource utilization. For lower resolution requirements, internal BRAM can be employed to improve processing speed while maintaining resource optimization. Only ion components with a mass number below 50 are analyzed in this study, with a required frequency resolution that is not highly demanding. To meet the resolution requirements while preserving resources in the pre-research stage, we have chosen the FFT algorithm with 4096 data points. This decision was made with regard to the compromise between the desired resolution and the available resources. To ensure the fastest processing speed, SDRAM was not adopted, and only BRAM was used as the internal storage, achieving a frequency spectrum resolution within 7 kHz.
4. Software Design
This design is written in Verilog language, and the Quartus II 18.1 software is used as the running software. The design employs a modular structure that enables the instantiation of various functional modules within the FPGA. The overall signal flowchart is shown in
Figure 5. First, the signal is sampled by an AD converter, which is driven by a clock generated by the FPGA, and it is then subjected to FFT for a predetermined number of points, resulting in the desired point results. Once the output meets the trigger signal, the data points are stored in the random access memory (RAM) and transmitted to Matlab via a Serial to USB interface circuit for advanced analysis and processing to obtain a spectrum. The process utilized is inherently fast, accurate, and wel-suited to many signal processing applications.
4.1. Clock Module
The PLL chip can achieve high-precision clock generation through its internal multiplication and division, as well as through the use of an internal oscillator and feedback circuitry. The PLL mainly generates a high-precision 25 MHz clock for the ADC. The quality of the ADC clock affects the quality of signal sampling.
4.2. AD Acquisition Module
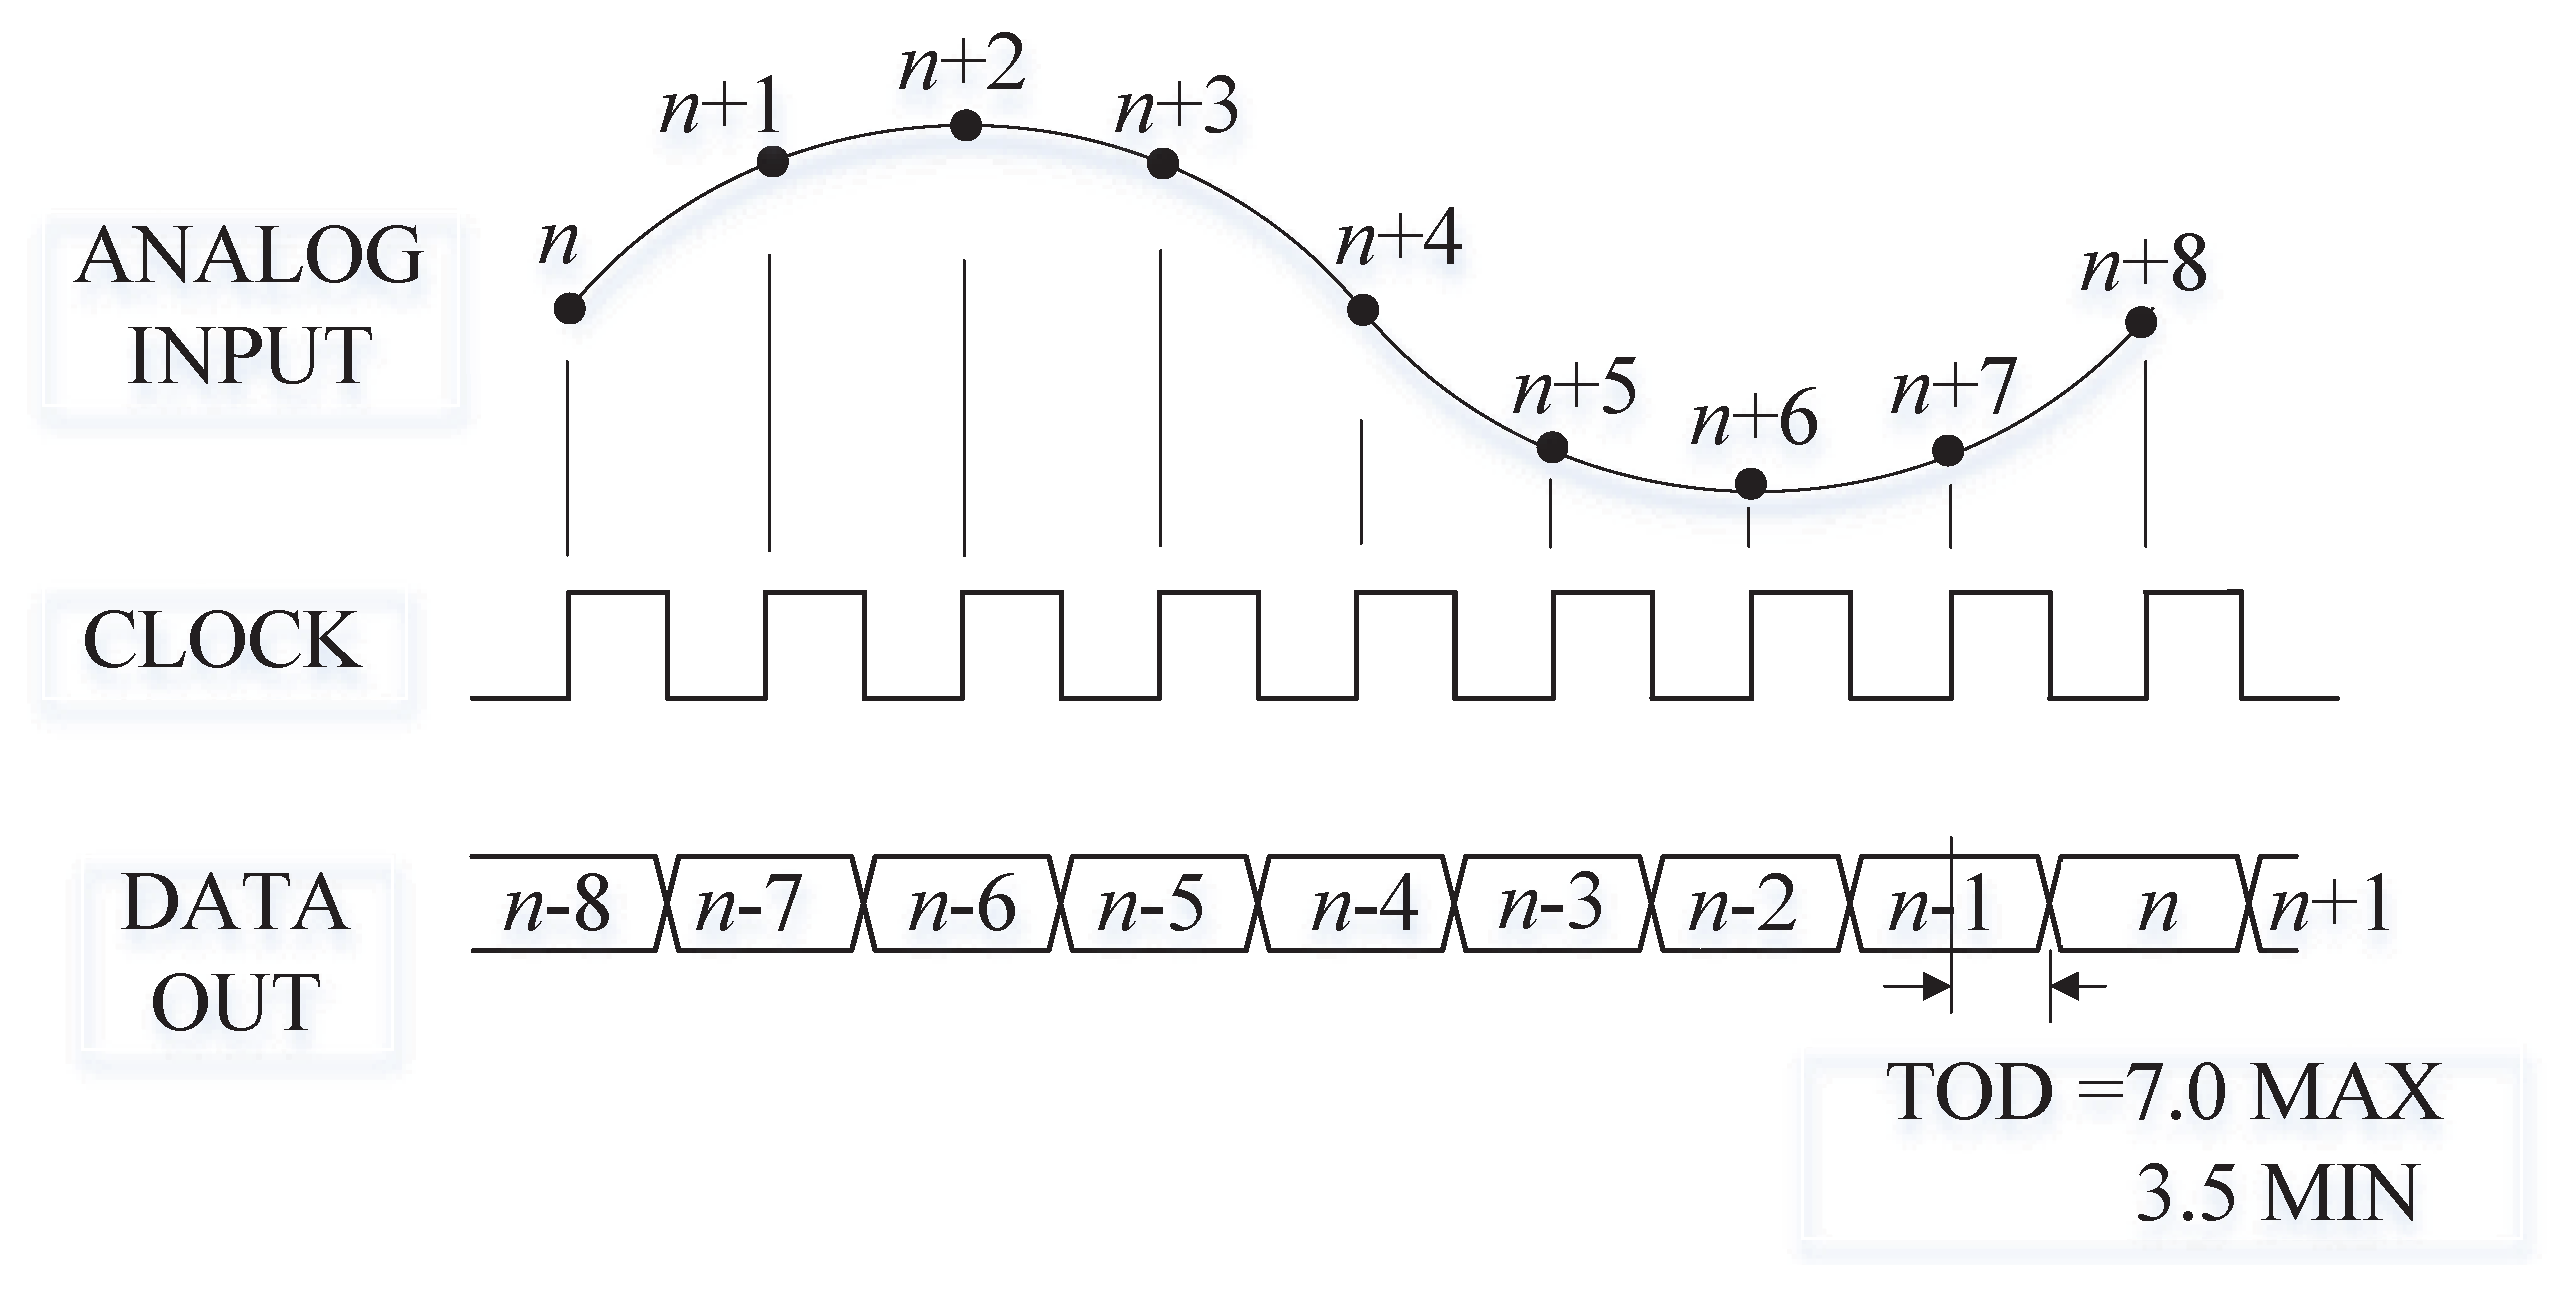
For AD9226, the data stored by the AD is acquired on the rising edge of the clock, and the acquired data is output through the data bus. The AD9226 requires no complex configuration. The timing diagram of AD9226 is shown in
Figure 6. Under the 25 MHz clock period generated by the PLL, AD9226 can generate one sampling data per cycle. After sampling begins, no valid data will be generated for up to approximately seven cycles.Therefore, there needs to be a certain delay in the program. The collected data is in direct binary code, while the binary complement is usually used in the digital signal processing algorithm of the FPGA, so corresponding conversion is necessary.
4.3. Frequency Domain Analysis Module
The frequency domain analysis module, which encompasses the control module of FFT, FFT kernel, and amplitude spectrum module, is at the core of this design. This paper utilizes the FFT IP core provided by Intel to calculate the FFT of the input signal. The IP core boasts superb performance and low latency, supporting FFT and IFFT with 2 to the power of N points (). Streaming mode can be continuously used to input data to the IP core for real-time dynamic detection requiring high response and refresh rates. In contrast, burst mode data flow format was used for mass spectrometry detection in this study because a high data rate was required. The calculation result is output to the downstream module only after the data loading is complete.
The burst I/O data flow FFT is shown as
Figure 7. The FFT control module is responsible for controlling the first and last input sink_sop and sink_eop provided to the IP core and determining the effective time sink_valid of the input signal. Additionally, it is in charge of generating the reset signal reset_n, as reported in [
18]; sink_ready is a signal that comes from the IP itself, indicating that it is ready to receive data. The IP will only receive data when both sink_valid and sink_ready is high. For the program design in this article, it is necessary to define a counting cycle signal that exceeds the sum of the FFT operation and delay time, which serves as a complete FFT cycle. The first and 4096th elements are selected as sink_sop and sink_eop, respectively. These control signals are combined with the instantiated FFT IP core. Full-phase Fourier transform should be utilized when phase order needs to be considered for signals collected by AD. This design does not need phase information and therefore directly assigns the imaginary part sink_imag of the input to FFT IP as 0 [
29], while sink_real comes from the AD module.
The output of FFT is also a complex signal, separated into real and imaginary parts. Due to the internal multiplication calculation by the IP core resulting in variation of bit width, an expansion of bit width would ultimately result in precision distortion. Floating point numbers require numerous resources for their exponents, hence block floating-point numbers are utilized in this calculation. In this case, a single data block shares one exponent, while the input data remain as fixed-point numbers, which guarantees superior signal-to-noise ratio and dynamic range throughout the entire operation process. The respective magnitudes of the real and imaginary signals obtained after the IP core produces the FFT result are then accordingly scaled. The top 12 bits are taken as the result corresponding to the input twelve-bit signal. To prevent overconsumption of resources, a multiplier and adder are utilized in obtaining the corresponding 24-bit power spectrum after the squared sum of the real and imaginary parts is calculated. This avoids direct square root calculations inside the FPGA.
4.4. Storage and Communication Module
The selection of serial port RS232 for computer communication was based on the requirements of data volume and communication rate. Pseudo-dual-port RAM was utilized for data buffering to ensure that the data were read in the order of their corresponding amplitude. The RAM provides two access ports for reading and writing. Because the spectrum result has symmetry, only half the length of the FFT point number needs to be stored. The signal is divided into three bytes, and a state machine is designed to complete the transmission at different time points. Serial communication follows the RS232 protocol: a baud rate of 115,200 with one start and stop bit and no parity bit.
4.5. Trigger Module
If real-time spectrum analysis is not performed continuously, then a trigger signal for triggering storage and communication is needed [
30]. Therefore, in this design, only upon each button press does the storage and transmission module store the corresponding point number after the next round of frequency domain analysis module is completed and transmits it through the serial port, thereby updating the frequency information of the signal. In subsequent practice, the button will be replaced by the signal for collecting and controlling the rocket or satellite sent out.
4.6. MATLAB-Based Upper Computer Method for Spectrum Graph Processing
The data sent by the FPGA are imported into the MATLAB serial tool for further processing. The incoming binary signal requires concatenation and binary conversion to retrieve the original 24-bit value. The value is then square rooted and corrected by dividing the amplitude by the transformation point number N following the principles of FFT. The abscissa of the frequency value can be obtained through Equation (
6). Typically, spectral graphs are represented using logarithmic coordinates.
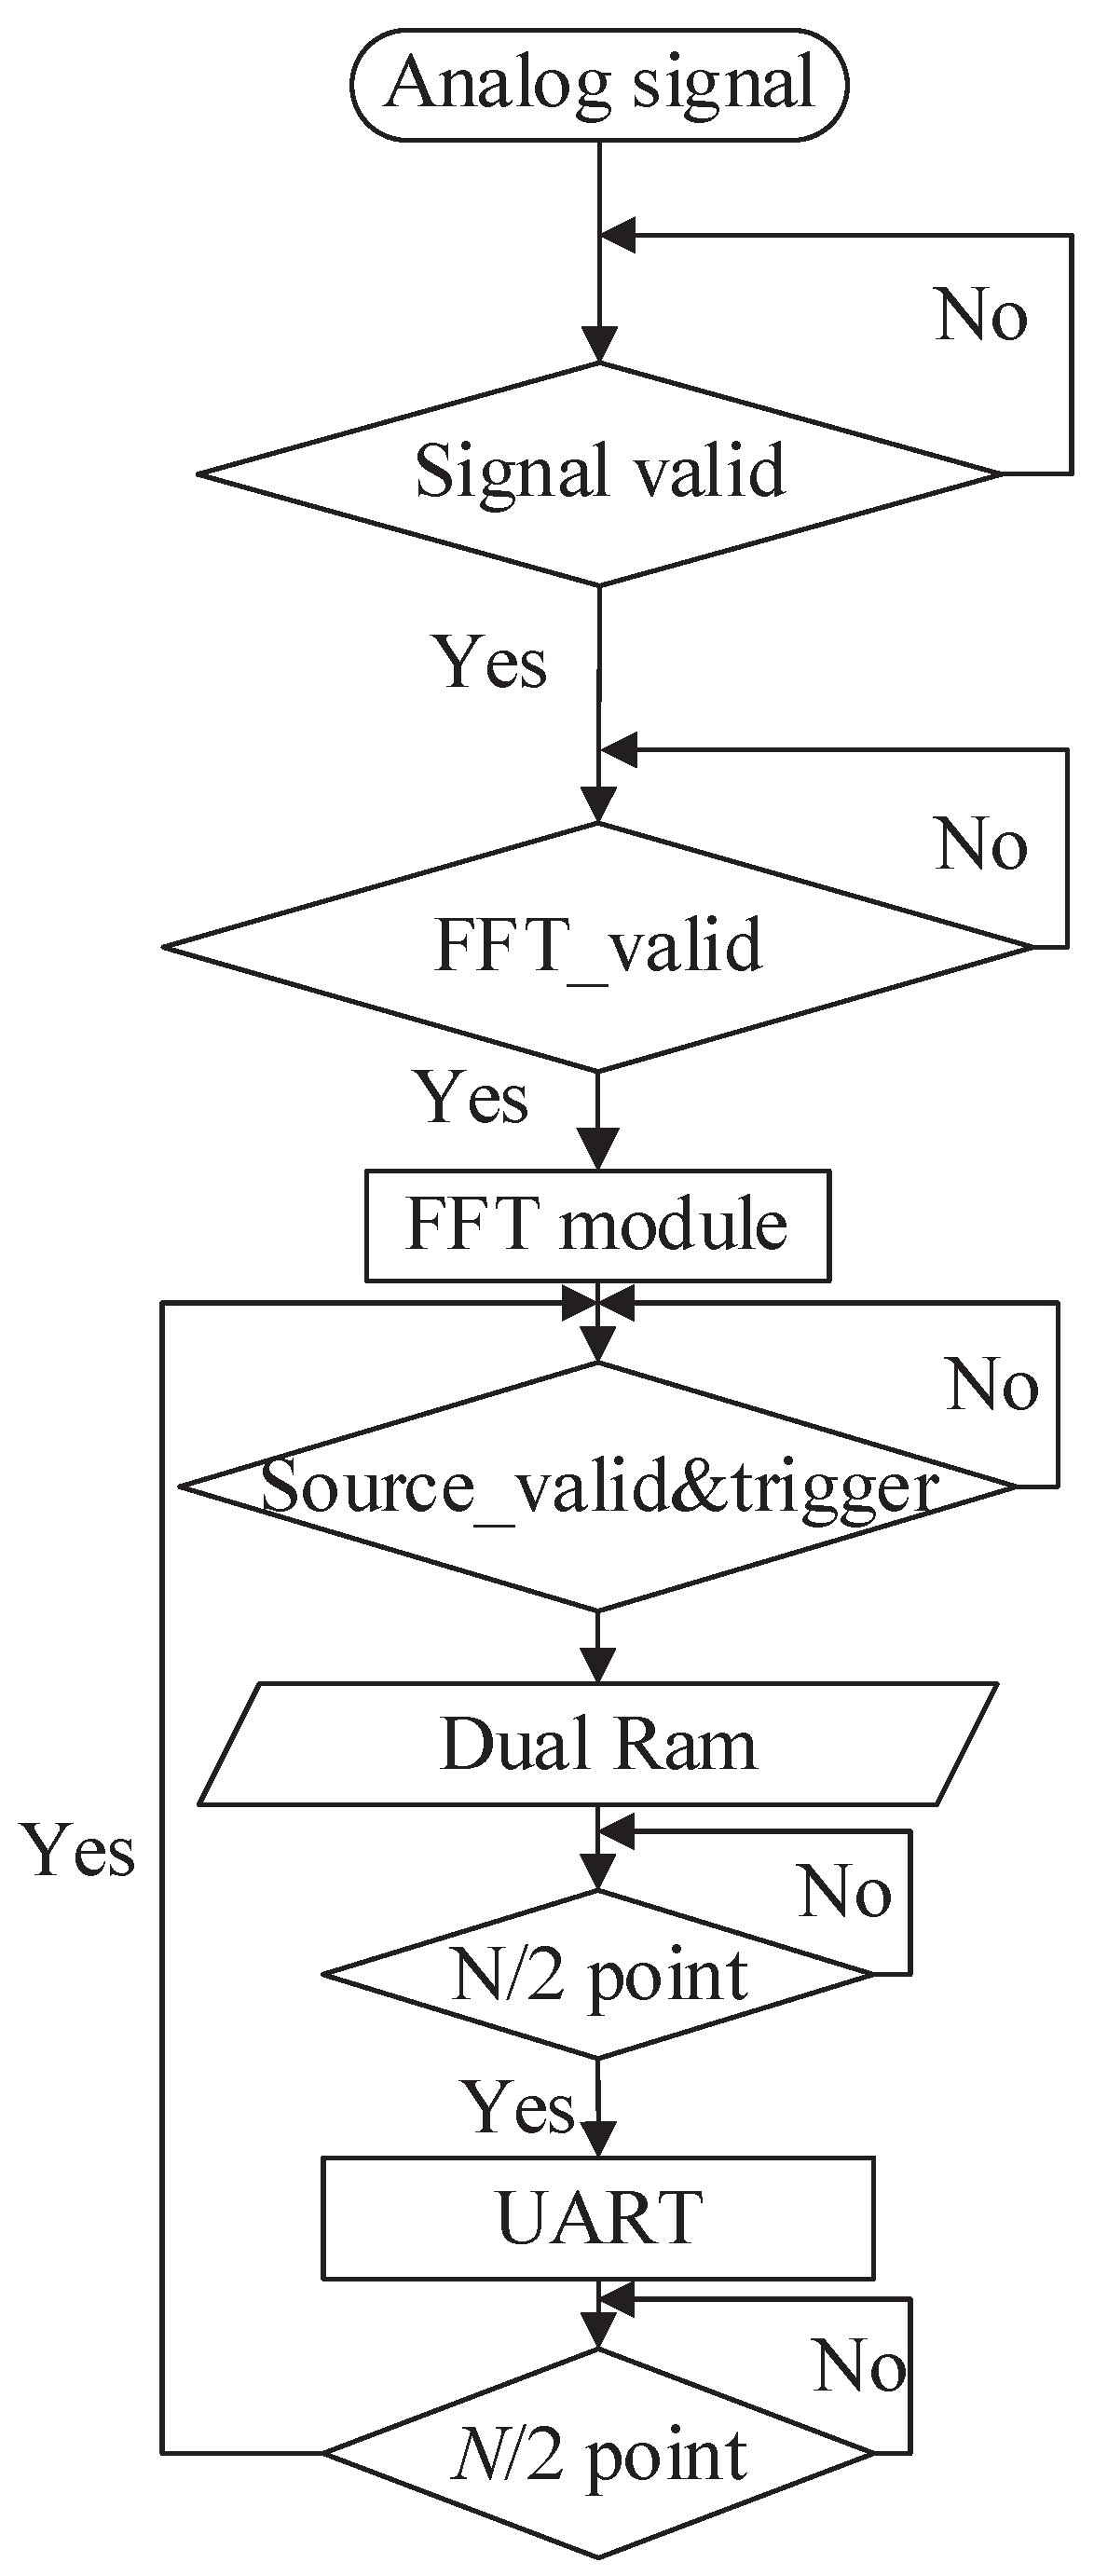
4.7. The Overall Signal Flow in the FPGA
The overall signal flowchart is shown in
Figure 8. After the input signal becomes valid and both “sink_valid” and “sink_ready” are active (i.e., when FFT_valid is high in the figure), the signal is fed into the FFT module. When there is an effective signal output and a trigger signal with a high level, the signal begins to be stored in the dual-port RAM for N/2 values. Once N/2 values have been stored, they are sent out via a serial port. The program then waits for the next output to become valid and for the trigger signal to become high.
5. Experimental Evaluation and Results
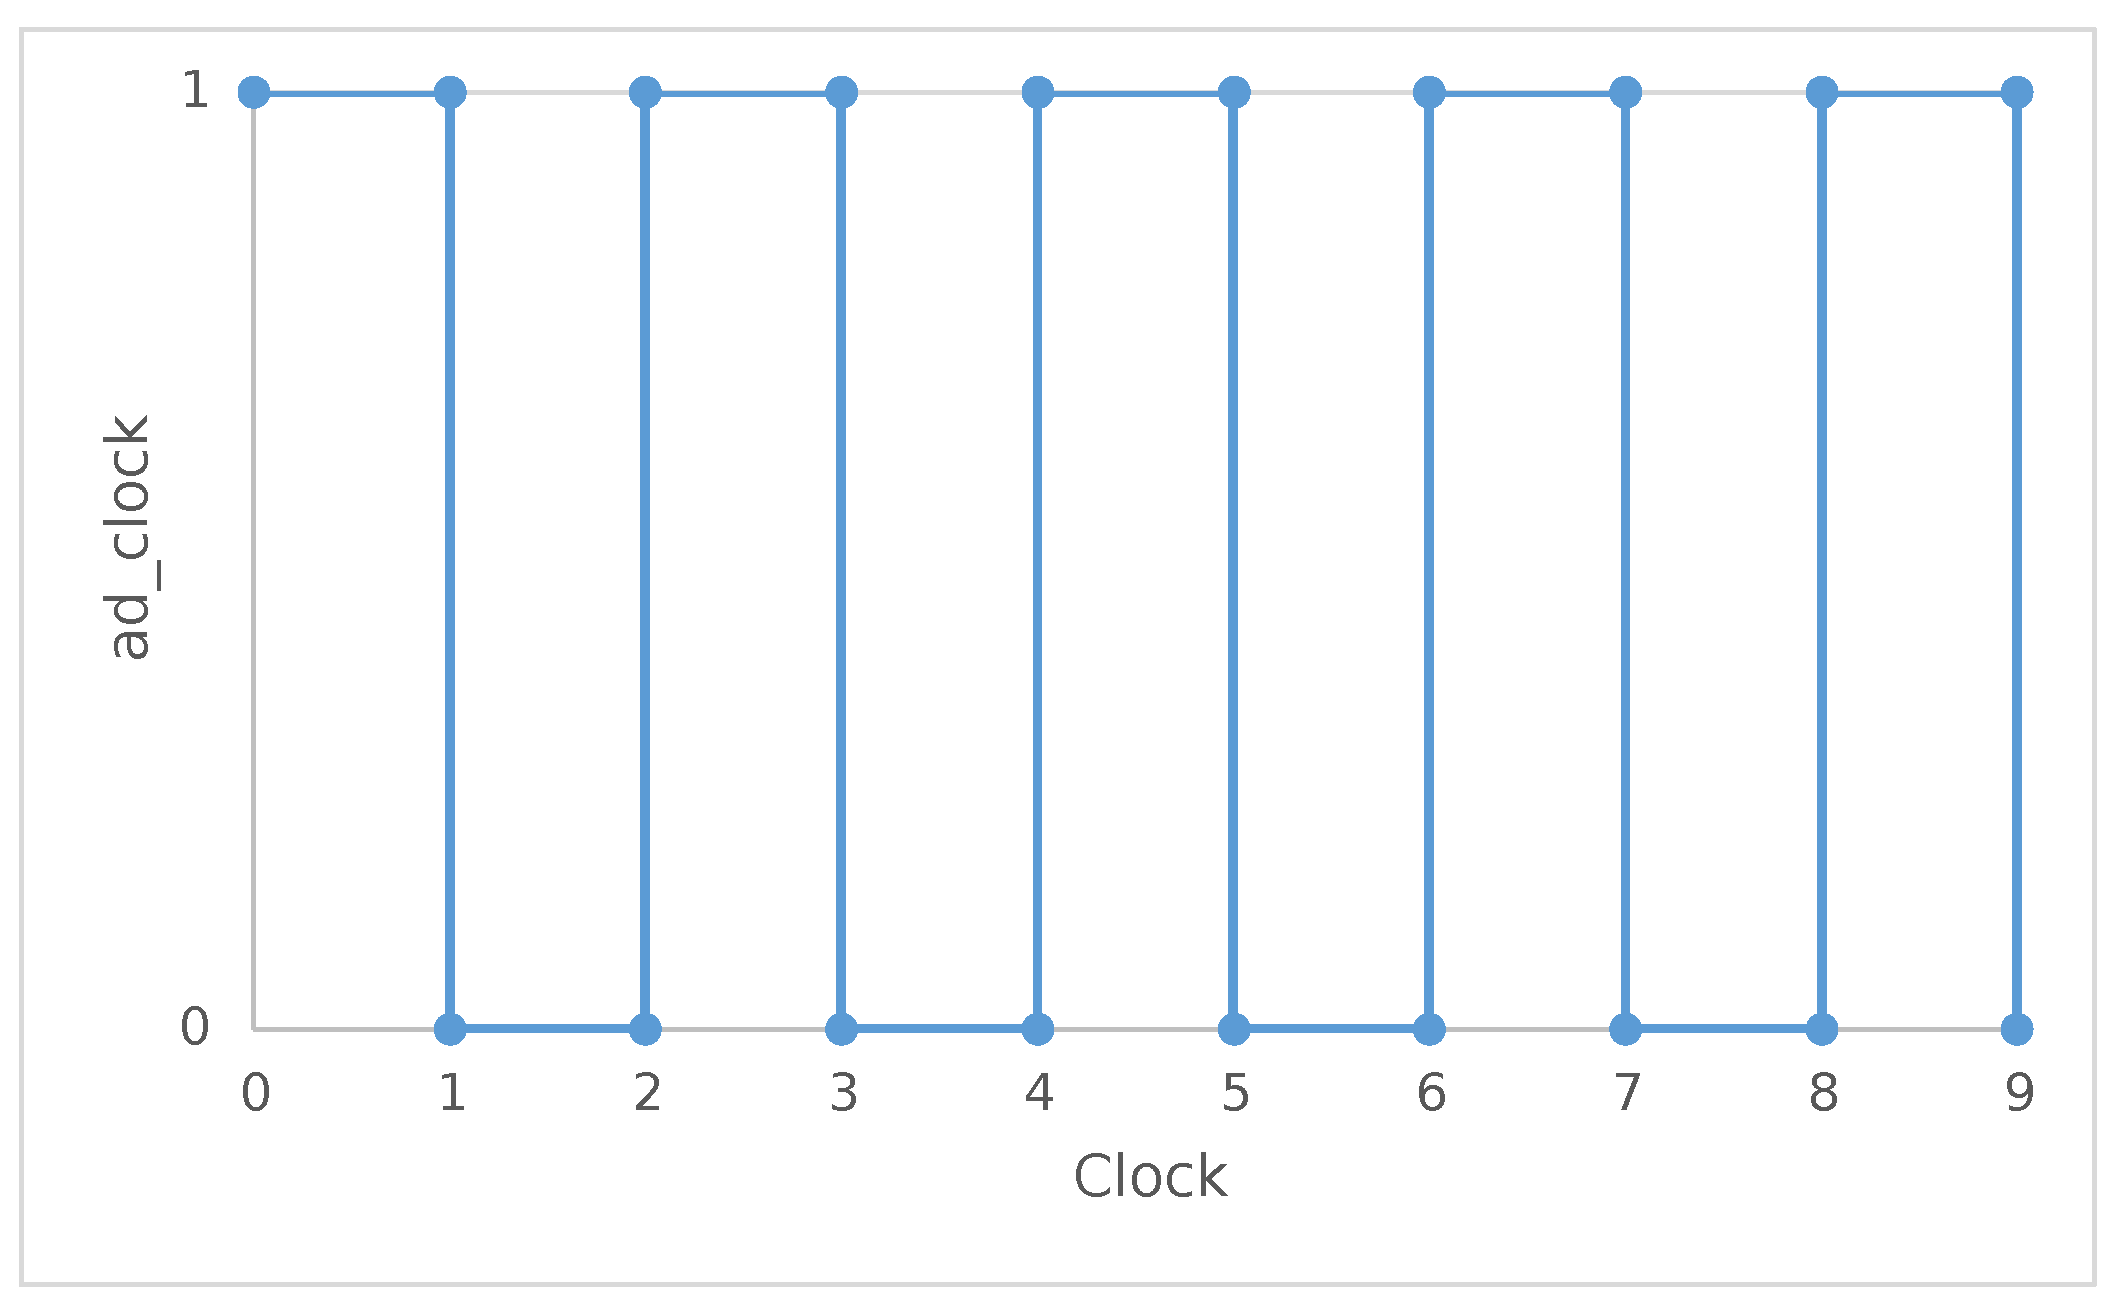
In order to verify whether the designed system can work properly, a series of experiments need to be conducted. After the designed acquisition board was prototyped and soldered through the PCB, its input signal line was led out through the SMA interface and connected to the signal generator line in ADALM2000. In the written program, the sampling rate was set to 25 MHz and the FFT points were set to 4096. The written program was then burned into the FPGA chip through Quartus II. The ADALM2000 Multifunctional Module was used as the signal generator, and its corresponding changes were observed through the online debugging tool Signaltap in Quartus. Initially, the clock provided by the FPGA to the ADC was checked, and this verification is shown in
Figure 9. This figure was drawn by importing data from the online logic analyzer into Excel. It is evident that the generated clock signal is 25 MHz as we use the system 50 MHz clock to observe.
A DC voltage of 5 V was applied, and the acquired value of 2047 matched the expected value for a 5 V signal in a 12-bit AD system. Under the application of a DC voltage of −5 V, the measured values ranged from −1991 to −2048. This can be attributed to the inherent DC bias in the AD acquisition process, as well as the instability of the input voltage.
Next, a single-frequency 500 k signal of 10V Vpp was applied to test the response of the AC signal. The acquired waveform takes 50 clock cycles under a 25 MHz clock. The maximum value of the waveform was 2047. However, due to DC bias, the minimum value was −1985, as seen in
Figure 10. This error does not affect the frequency measurement. From the figure, it can be seen that the frequency of the signal is 50 cycles under the current AD clock, corresponding to 500 kHz, verifying the correctness of the waveform acquisition by the FPGA and AD.
The frequency spectrum of this single-frequency signal, which was not corrected for amplitude, is shown in the
Figure 11. It is evident that the system recognizes the 500 kHz signal. The result is quite close to the frequency we gave.
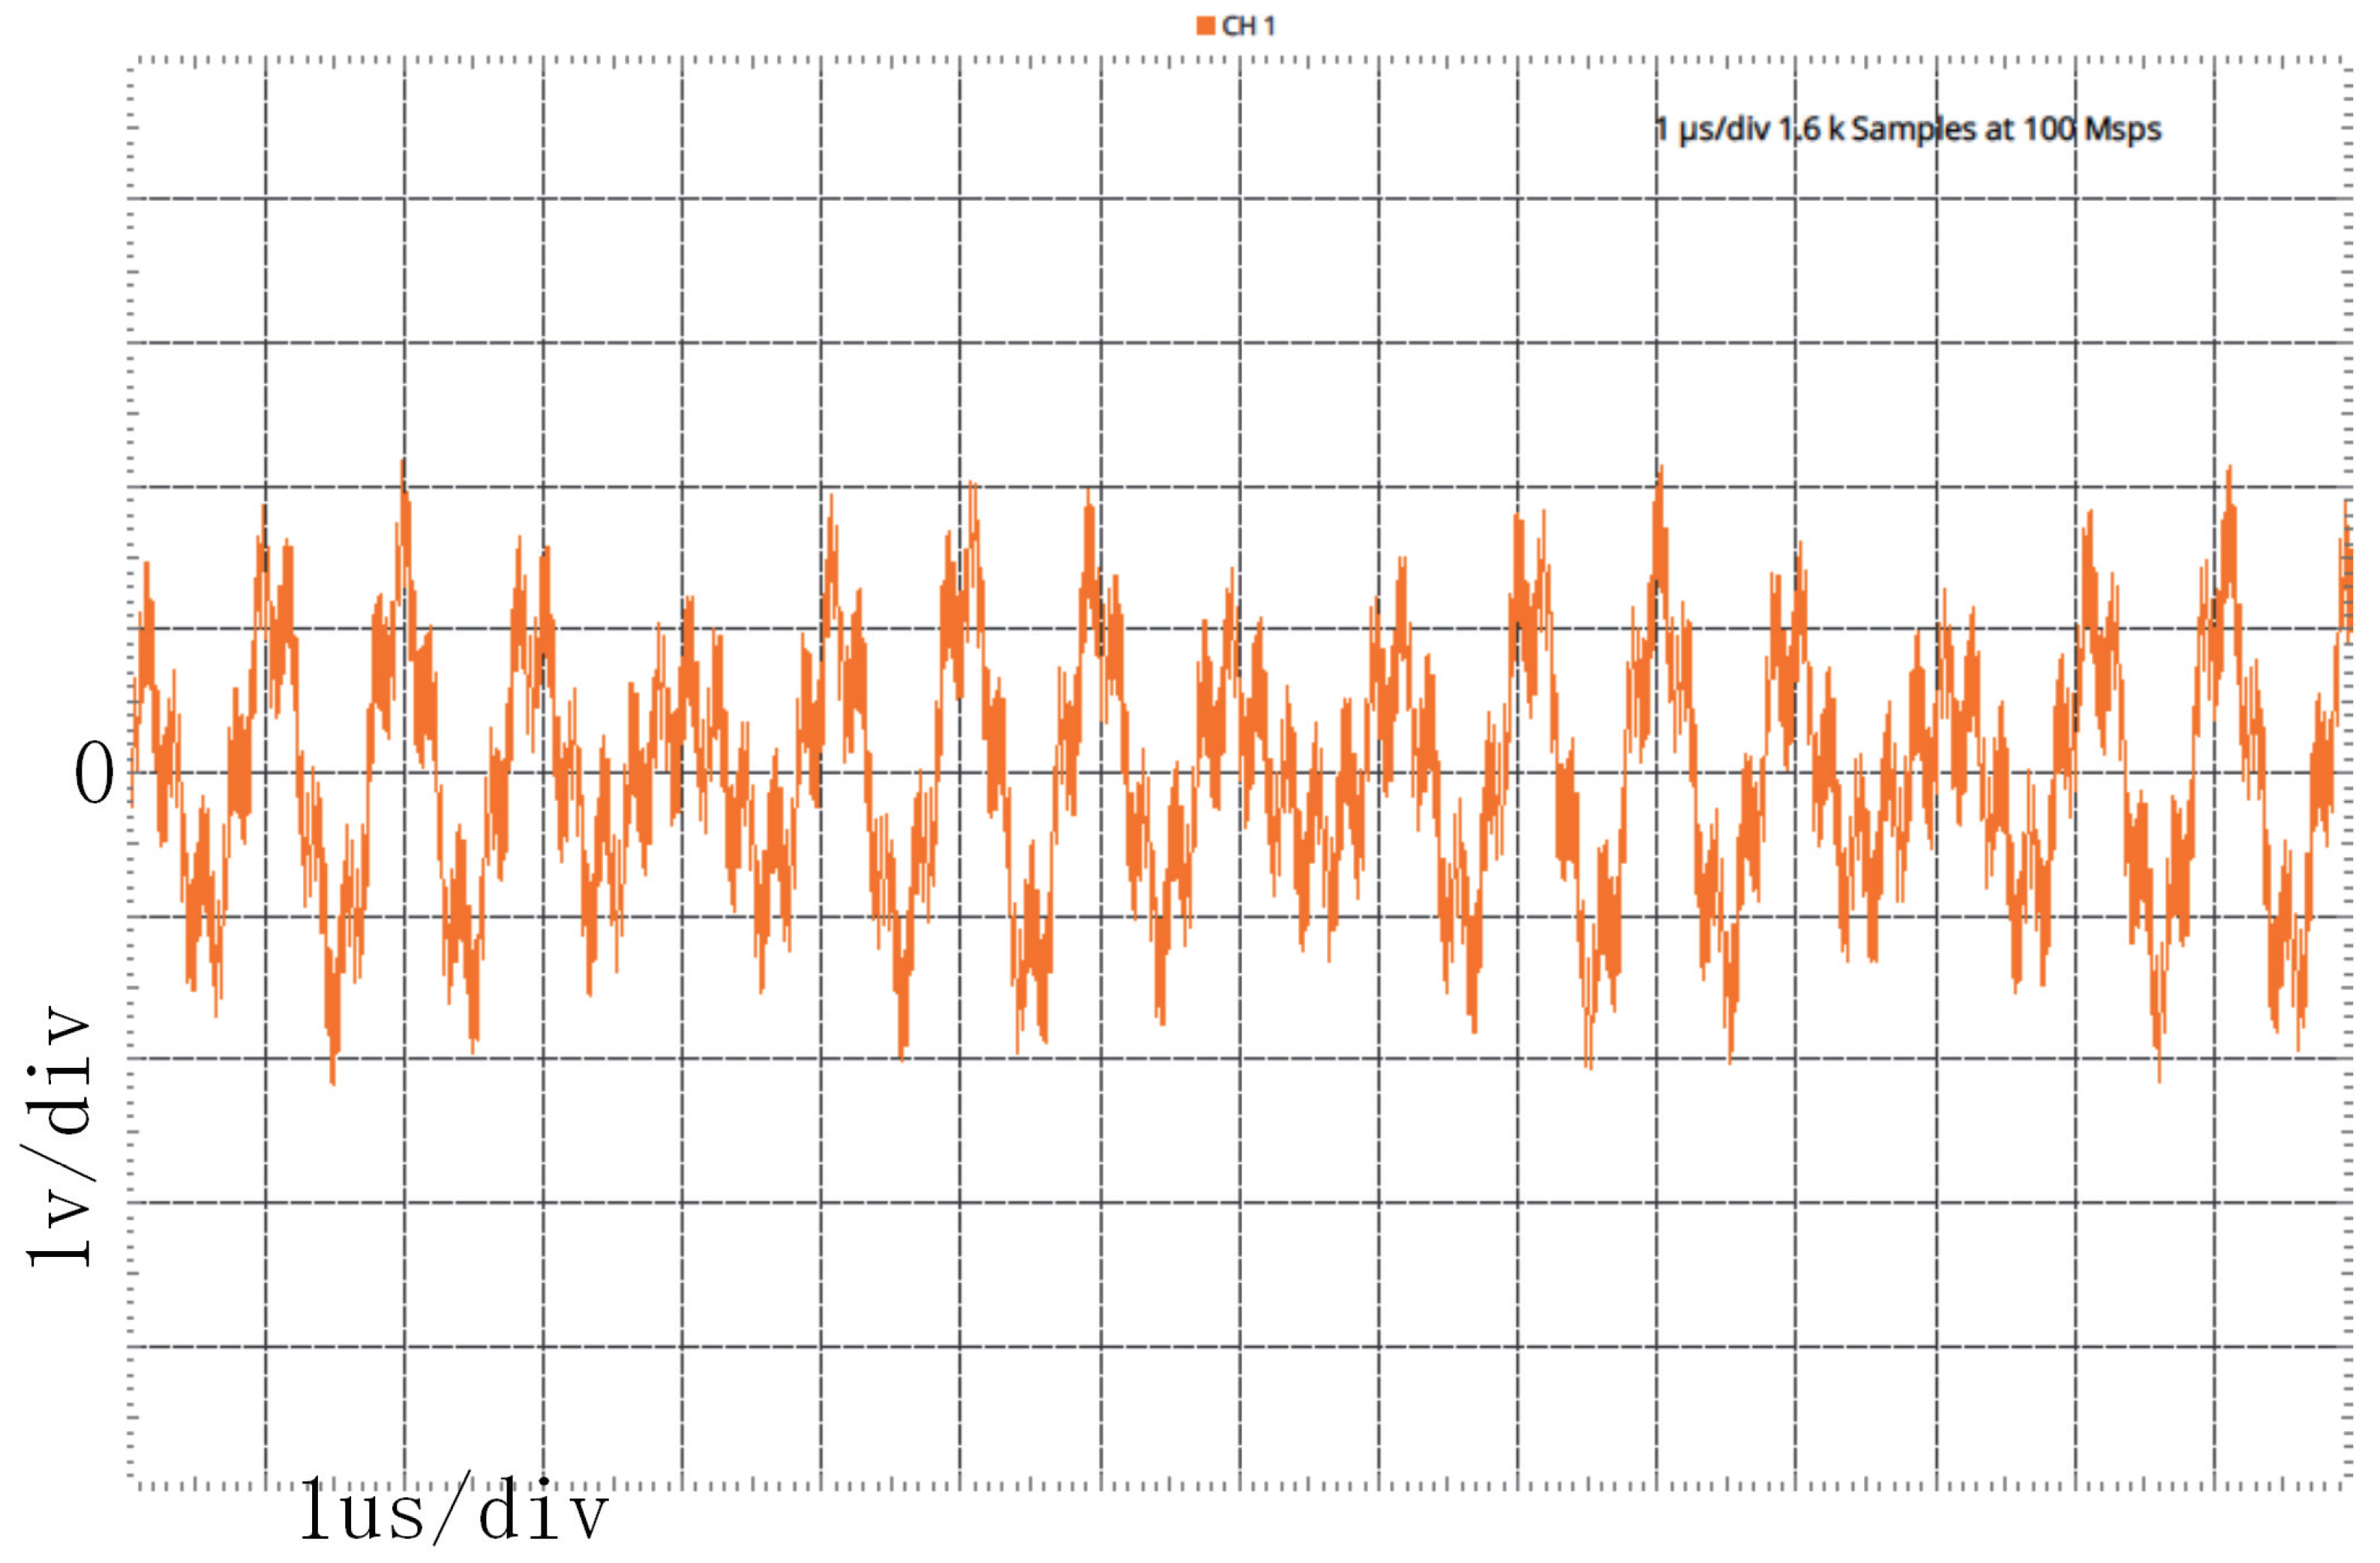
Next, the mixed frequency signal is tested by generating a composite signal of three different frequencies using an 8 bit DAC along with the FPGA. FPGAs are capable of generating digital signals on their own.To produce test signals for this experiment, the numerically controlled oscillator (NCO) IP core was employed to generate digital sine or cosine waveforms, which were subsequently converted into analog signals through a DAC module. The generated signals demonstrated high accuracy and stability, meeting the requirements of the experiment. In this experiment, three different frequencies were generated using the NCO IP core: 995 kHz representing Ozone, 1219 kHz representing Oxygen, and 4879 kHz representing Hydrogen. The signal generated at 995 kHz is adjusted to twice the amplitude of the other two and is used to verify the system’s ability to determine amplitude. The AD9708 module outputs the mixed frequency signal, as shown in
Figure 12. The signal is observed through the direct use of the oscilloscope in ADALM2000. The voltage is within the range of ±5 V. However, useful information cannot be obtained in the time domain.
The spectrum analyzer in ADALM2000 is utilized to analyze the generated mixed-frequency signal. ADALM2000 captures analog signals through its internal ADC and transmits them to its companion computer software, Scopy, via the USB interface. If the frequency spectrum analysis function is selected in Scopy, the software will automatically analyze the captured waveform. Peak detection can be achieved by using the peak detection function in the software and selecting the three highest peaks to obtain the corresponding frequency spectrum measurement results. The corresponding spectral graph is shown in
Figure 13, while the values of the peak points are shown in
Table 2. From the figure, it can be seen that the amplitude of the maximum background noise is more than 40 dB lower than the amplitude of the signal, which means the noise is less than one-thousandth of the signal. the results obtained using ADALM2000 were 1001 kHz, 1221 kHz, and 4883 kHz. The frequency measured by the ADALM2000 matches the frequency of the generated signal.
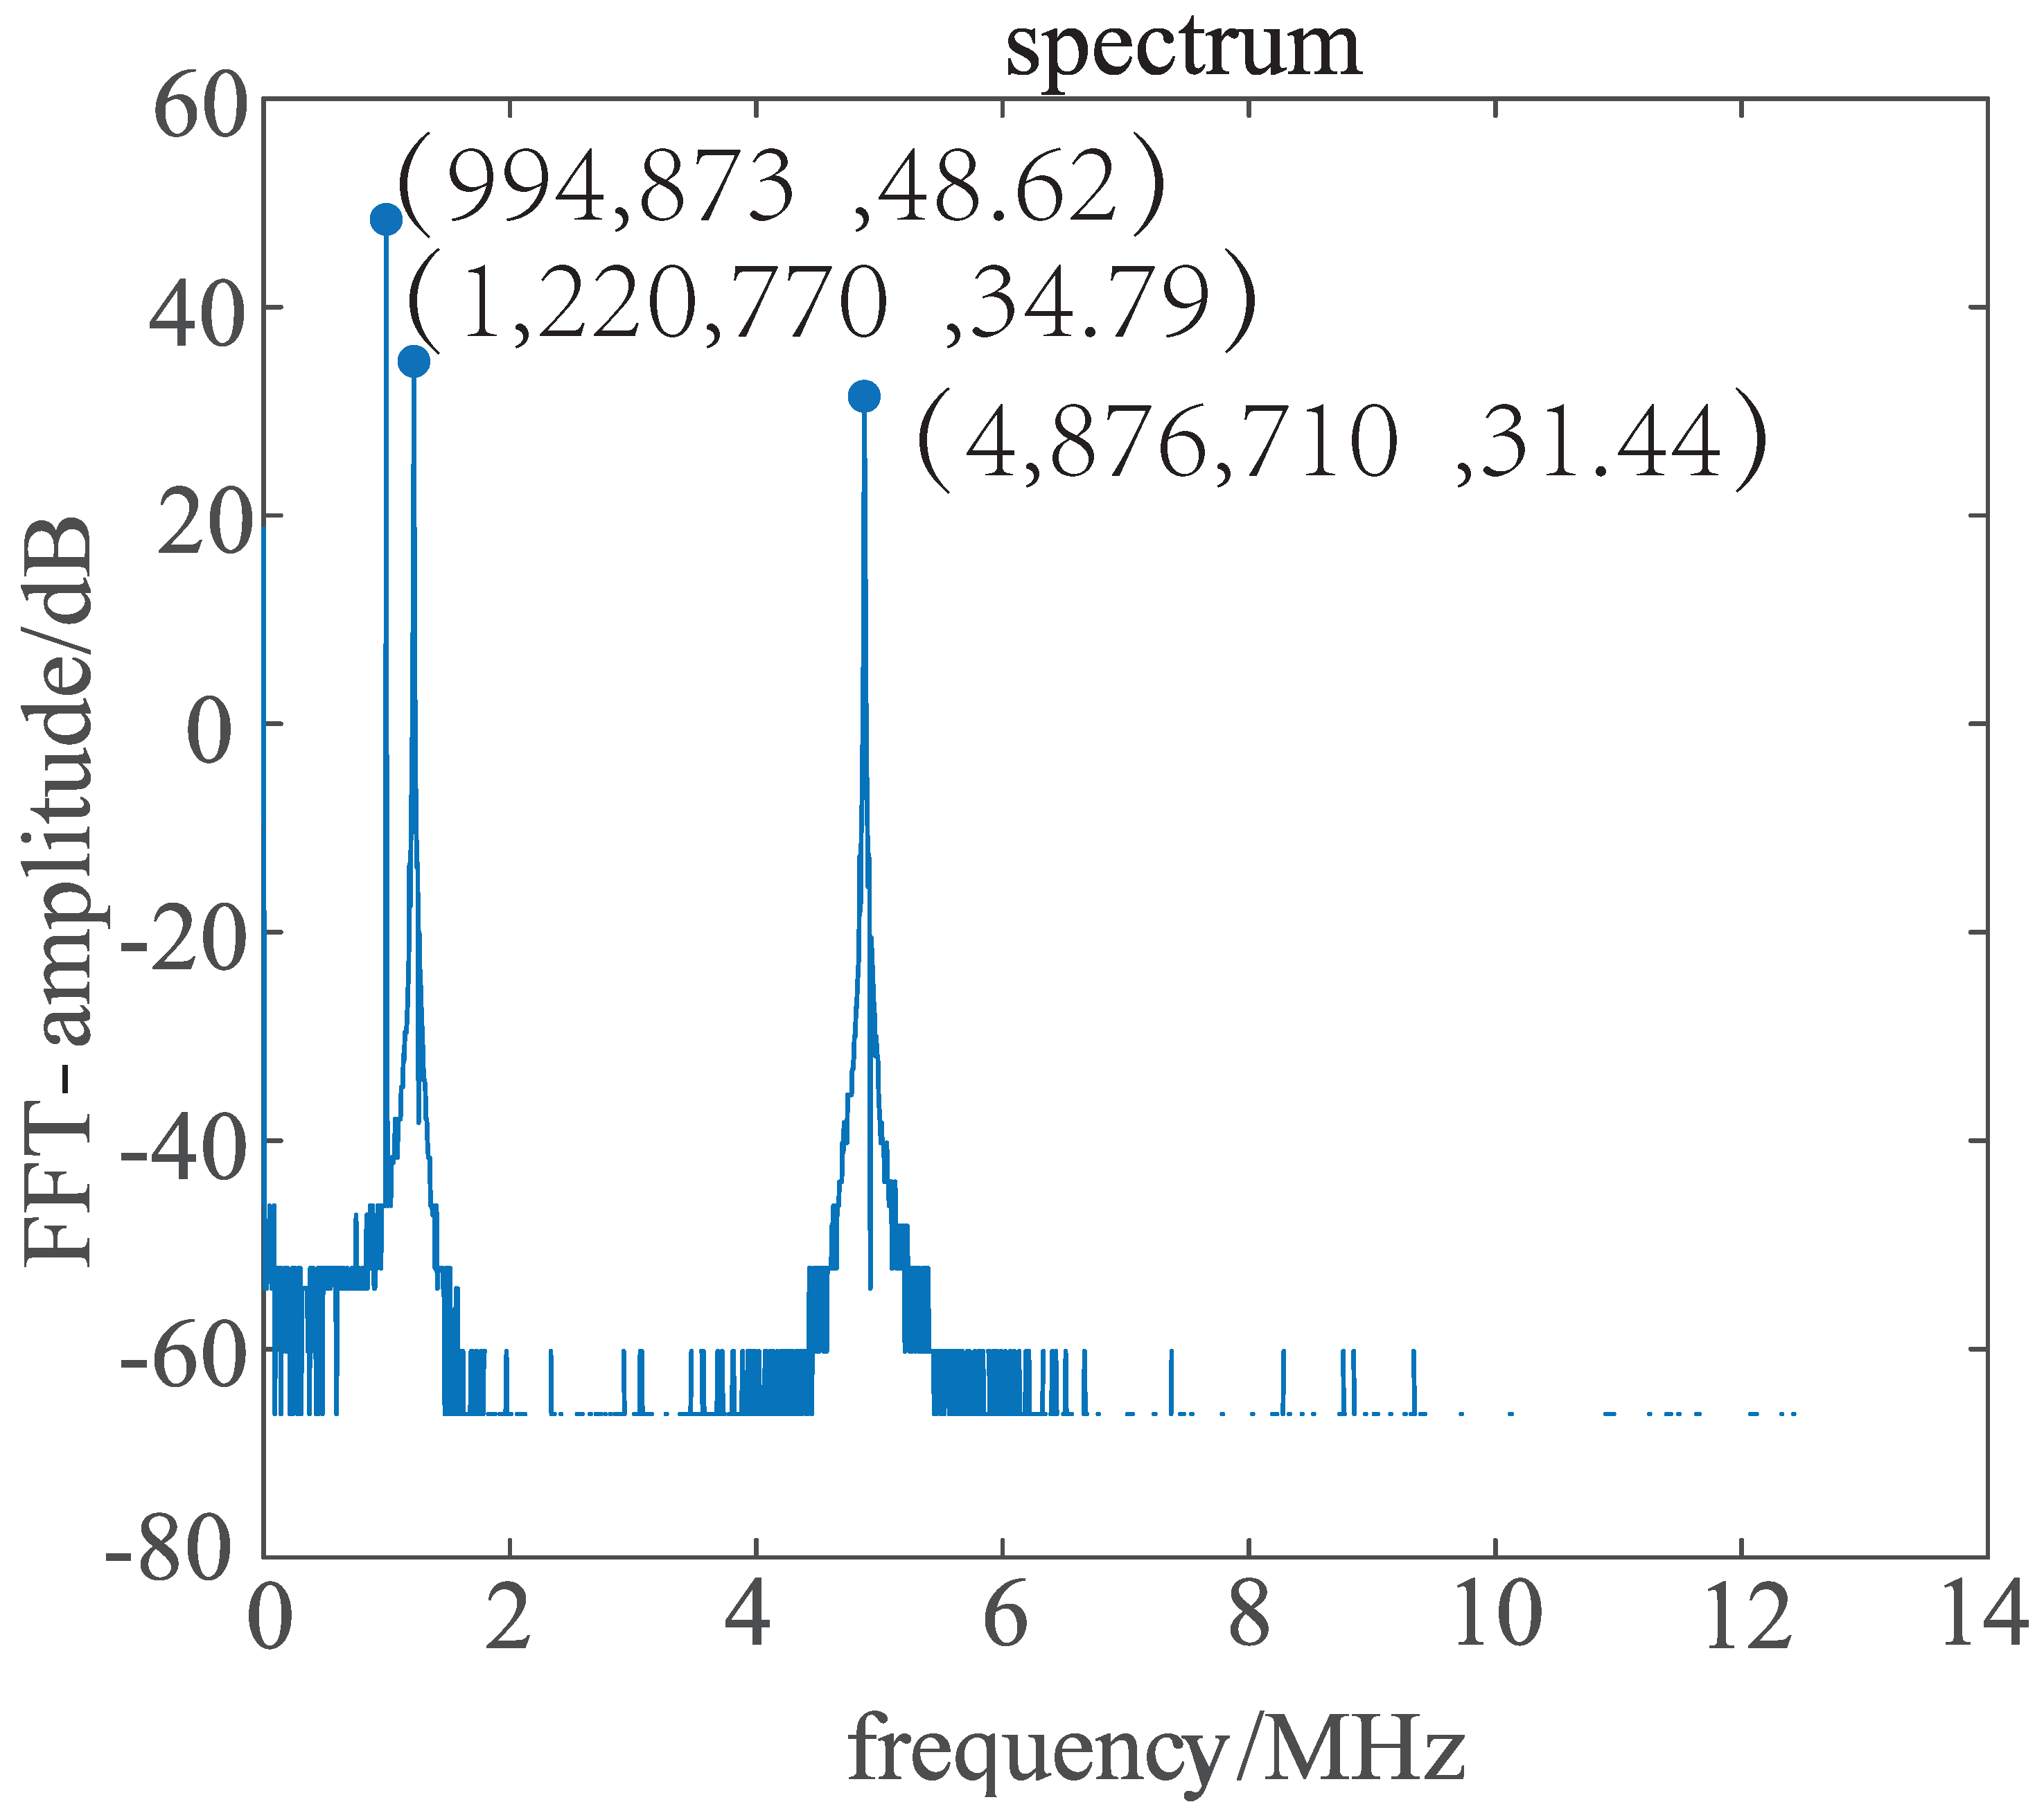
As for the system we designed, after being processed by the MATLAB host computer, the measured frequency signals (including some miscellaneous signals) in this article can be displayed. By manually selecting the three highest peak points, the frequency detection results of the data acquisition system can be obtained. The detected frequency signals of the acquisition system designed in this study were 995 kHz, 1221 kHz, and 4877 kHz, as shown in
Figure 14. Because the frequency was not known in advance, there is a certain degree of spectral leakage, which can affect the measured frequency and amplitude. The measurement results of both methods had a certain error, but both were within 7 kHz of error and were mostly consistent with the theoretical spectral values, with correct line positions and similar spectral waveforms. The relative amplitude sizes also conform to the input test conditions. As the present experiment did not require extensive emphasis on amplitude information but only relative comparisons of amplitude, we did not perform much amplitude calibration.
The experimental results indicate that the system is capable of effectively resolving the frequency of signals with a frequency resolution below 7 kHz. The data acquisition system of the FTMS mentioned earlier could achieve a maximum sampling rate of only 10 MHz [
7], but in this paper a sampling rate of 25 MHz has been achieved. As mentioned earlier, lower mass numbers have higher motion frequencies, so this paper can acquire signals of lower mass numbers. According to the report in Quartus II, implementing a 4096-point FFT in the FPGA in this design requires 13,421 clock cycles, which corresponds to approximately 0.5 ms. However, running a 12-bit, 4096-point FFT typically takes a few milliseconds on some high-end computers, while on lower-end computers, it may take several tens of milliseconds or longer to complete the same calculation. This means that the system has a certain speed advantage in terms of spectrum analysis.
6. Conclusions
This article introduces a frequency analysis system for atmospheric mass spectrometry based on an AD9226 chip and an FPGA. The data acquisition system, a low-cost solution with a conversion rate of 25 MHz and precision of 12 bits, primarily performs signal conditioning and frequency analysis on the input signal to obtain spectral information of the measured signal. The system utilizes the high accuracy and fast conversion time of the ADC, and the high performance and low latency characteristics of the FPGA for FFT processing. The system is capable of effectively resolving the frequency of signals below 5 MHz with a frequency resolution below 7 kHz. Due to the one-to-one correspondence between frequency and mass number, this suggests that the system can be applied to the data acquisition system of Orbitrap mass spectrometry for detecting and differentiating atmospheric components with mass numbers ranging from 2 to 50.
Incorporating the feature of fast frequency analysis into mass spectrometers facilitates faster scanning speeds, which can be highly beneficial in certain applications, such as real-time monitoring of atmospheric spectral components. The system meets all design requirements and provides a feasible smal-scale integrated data acquisition solution for in-situ atmospheric sensing via mass spectrometry. The effectiveness of this system has encouraged further development of Orbitrap instrument detection systems.
While the system has achieved its designed functions, there are still areas for research and improvement. One of the limitations of our research is that the dynamic range of the system is relatively low, which means that the range of mass numbers of the objects that can be detected is not large. The number of points used for FFT can be adjusted to have variable point number to meet different resolution needs. To achieve a balance between resources and performance, higher point numbers require more careful consideration. The sampling rate of the data can also be adjusted to be variable, thus achieving different resolutions for different detection targets according to different needs. When accurate quantification of atmospheric composition in Orbitrap mass spectral signals is necessary, better AD converters and detailed amplitude calibration should be employed.
The current outcome of our study involves spectrum analysis. Test signals come from a signal generator rather than a real Orbitrap mass spectrometer. In the near future, this system will be further tested in conjunction with the Orbitrap mass spectrometer developed for aerospace applications, which is currently under development. We will calibrate the system to ensure the reliability and accuracy of the data. By doing so, we will be able to determine the specific relationship between the spectrum and the mass spectrometric components, which will ultimately enable us to achieve complete mass spectrometric component analysis functions for atmospheric molecule identification.


