Abstract
Buildings and vegetation in the proximity of a terrestrial base station induce a significant additional loss, typically referred to as “clutter loss”, which sums up to free space loss and atmospheric attenuation. Clutter loss is essentially due to the radiowave reflection and diffraction caused by buildings and vegetation, and tends to reduce the interference between terrestrial systems, such as upper 6 GHz (U6G), and satellite systems operating in the same frequency bands. In fact, for example, at low elevation angles, the clutter loss could reach some tens of dB in the U6G band. A novel clutter loss model in urban and suburban environments for frequencies up to 10 GHz is proposed. The model relies on the Monte Carlo simulation approach presented in Report ITU-R P.2402-0, but some limitations have been removed to extend its applicability to more complex scenarios and possibly increase its accuracy for U6G systems. An analytical approach is also proposed to model the clutter loss statistics obtained by properly fitting the obtained statistics for the cities of London and Melbourne. Finally, the proposed model is validated by comparing its results to those obtained by a commercial ray tracer.
1. Introduction
Access to the mid-band spectrum (above 6 GHz) is of primary importance to boost the capacity of lower-band 5G systems. A recent study [1] performed by Coleago Con-sulting on mid-range frequency usage for 5G mobile service indicates that an additional band of 1.2 GHz is required to meet the International Mobile Telecommunications-2020 (IMT-2020) user-experienced data rates of 100 Mbit/s in downlink and 50 Mbit/s in uplink. There is a significant benefit when the 5.925–7.125 GHz band is accessible by IMT in support of 5G-NR (New Radio) and its evolution [1]. At the next World Radio Conference 2023 meeting (WRC-23), agenda item 1.2 will discuss the harmonization of the 6 GHz band in accordance with Resolution 245 (WRC-19) [2]. In fact, the harmonization of the IMT frequency and bands on a regional/global scale will provide economic benefits. In this scenario, the coexistence of IMT services above 6 GHz with GEO (geostationary Earth orbit) satellites with a C-band payload may represent a limiting factor for the allocation of the mid-band spectrum to the former. Fixed satellite services currently use the 6 GHz band to upload contents via gateways. In mid-2020, the Federal Communications Commission (FCC) resolved to allocate the mid-band to unlicensed users to maximize its usage while protecting incumbents from harmful interference [3].
The validation of the system coexistence is discussed at the global level among the ITU-R (Radiocommunication Sector of International Telecommunication Union) working groups. These technical teams are working towards the provision of models and parameters to be employed in the definition of coexistence simulations. The Working Party (WP) 5D, responsible for carrying out studies under WRC-23 agenda item 1.2, solicited WPs 3K and 3M to provide propagation models (clutter loss and building entry loss) to support sharing study [4].
This paper focuses on the prediction of clutter loss (which consists of additional losses due to ground objects, besides the ground itself) in terrestrial–satellite coexistence scenarios [5]. Clutter loss is one of the main impairments for a terrestrial communication system in urban and suburban environments, especially at low elevation angles, due to the shadowing effects induced by buildings and trees surrounding the base station. On the other hand, clutter loss can also represent an advantage in the case of interference between terrestrial and satellite systems operating in the same frequency band. Clutter loss in urban and suburban environments has been significantly investigated in the past, but the scarcity of available measurements has prevented a comprehensive testing activity. Some models have been developed empirically by fitting the data collected in specific scenarios: the Hata model [6], developed on the basis of Okumura’s inputs, is an example of this modeling approach [7]. Another example is provided by the prediction method adopted in Recommendation ITU-R P.2108 [8]. Empirically based models typically require simple and easily accessible inputs, at the expense of limited accuracy and applicability. On the contrary, other semideterministic models, founded on physical principles, usually provide more accurate predictions. This is the case of the Walfisch and Bertoni model [9], which assumes that the propagation over buildings can be modeled as a sequence of diffractions over half-space screens, ended by a final diffraction at the last roof edge. A succession of multiple random scatterers was proposed by Blaunstein [10] to quantify the propagation loss, while different physical optics techniques were exploited by Whitteker [5], which also consider the terrain effect. A more detailed procedure to calculate the clutter loss along the Earth satellite path is described in Report ITU-R P.2402 [11].
This paper presents a new model based on the ITU-R method [11], but with some differences to broaden its applicability and possibly enhance its accuracy for U6G sys-tems. The approach consists of launching a single ray for each generated random urban scenario, described by its statistics of buildings’ distances and heights. Each ray is subject to reflection and diffraction induced by buildings. The reflection loss is calculated as a function of the reflecting material, angle of incidence, frequency and wave polarization; the ground reflection, not considered in [11], is added to the model as it is relevant for U6G systems whose steerable antennas also point towards the users in the streets. The diffraction loss is calculated according to the knife-edge method [12]. Different combinations of reflections and diffractions are considered depending on the scenario. The clutter loss statistics are finally gathered from a number of simulated scenarios (a single ray is used for each scenario), which are sufficiently high to guarantee statistical reliability. A fitting procedure on the statistics obtained for London and Melbourne is finally proposed to derive an analytical model of more practical use and wider applicability in an urban environment.
The remainder of this paper is organized as follows. The rationale of the model is presented in Section 2. The simulated urban environment and its associated statistics (building distance and height) are illustrated in Section 3, while Section 4 describes how the reflection loss and diffraction loss are calculated. The proposed method for clutter loss calculation is summarized in Section 5, and the results obtained at 6 GHz for London and Melbourne are presented in Section 6, together with the derivation of an analytical model. The model validation is described in Section 7. Finally, Section 8 draws some conclusions.
2. Rationale of the Model
The method presented in this contribution to estimate the Earth-space clutter loss in an urban environment is underpinned by solid physical bases and relies on the approach described in Report ITU-R P.2402 [11]. The idea is to calculate the statistics of the propagation loss (due to the presence of buildings) for several rays of a base station towards the sky, in an urban area; the position and height of the buildings are randomly drawn from the local associated statistics. Compared to the model in [11], the new method features accurate (yet simplified) expressions to calculate the reflection loss, the possibility to consider an unlimited number of reflections (instead of a maximum of two reflections) and diffractions, variable incidence planes (instead of just that orthogonal to the building façade), different wave polarizations and the contribution of ground reflections. Furthermore, as in [11], the diffraction loss is calculated by treating each building like a knife-edge obstacle, but using the real building distance and height, instead of the effective value employed in [11].
3. The Urban Environment
The proposed clutter loss model has a mixed physical and statistical nature. On the one hand, it considers the main impairments affecting a wave propagating in an urban environment, i.e., reflections, refraction and diffraction (scattering due to the surface roughness is not considered, as it is of limited impact at frequencies up to 10 GHz). The rays emitted isotropically by the base station interact with the buildings under the plane wave assumption. On the other hand, the proposed methodology is far from being a complete ray-tracing approach, which requires a deterministic description of the urban environment: for each ray, the building distances and heights are randomly extracted from the associated statistics, which characterize a specific city.
In fact, the building height and distance statistics are gathered according to Report ITU-R P.2402 [11], which also includes the results obtained for two sample cities, namely, Melbourne (Australia) and London (United Kingdom).
Without describing all the details included in [11], the cumulative distribution functions (CDFs) are calculated for a number of survey points representative of the expected base station locations within the area (e.g., along the street central lines, the curb lines, the edges of pavements/sidewalks) on building façades (although the statistics do not change if the base station is on the building roof). As shown in Figure 1, from each of these points, for all horizontal radials at 10-degree intervals, the roof height at which the radial intersects the building façade (without considering any parts of the roof higher than this point) is recorded, as well as the horizontal distances to the first and second buildings. The second building may be part of the first: the key point in identifying it is that the ray travels over un-built-on ground before reaching it. The distance from the survey point to either the first or the second building is limited to 1000 m: if no building is met on the radial by such a distance, the first and second building distances are set to 500 m, and the building heights are set to 0 m. In this way, following the other criteria defined in [11], it is possible to build statistics of the building height and distance from the survey points, which can be achieved by resorting to any survey method: direct surveying, 3D models derived either from LIDAR or stereo photography, large-scale digital maps with building heights.
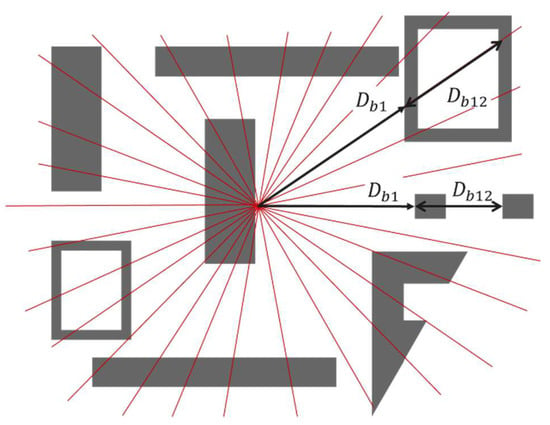
Figure 1.
Scheme used to calculate the urban statistics. Db1 represents, for each ray, the horizontal distance between the base station and the façade of the first building along the ray path; Db12 is the horizontal distance between the façade of the first building and that of the second building along the ray path. Db1 and Db12 are calculated for each ray leaving the base station (with a radial step of 10 degrees), which is placed in a number of survey points in the city close to a building façade and at a height of 5–6 m above the ground. The roof height, Hb1, at which the radial intersects the building façade is also recorded.
Figure 2 and Figure 3 depict the CDFs of the building distance and height, respectively, for London and Melbourne, derived from twelve survey points scattered across the considered area of each city [11]. It is evident that the statistics present marked discrepancies, due to the different planimetric and altimetric structures of the two cities. London is a typical business area with narrow streets and relatively close buildings, while Melbourne is laid out in a rectangular grid with wide main roads, but many narrow passages within the city blocks.
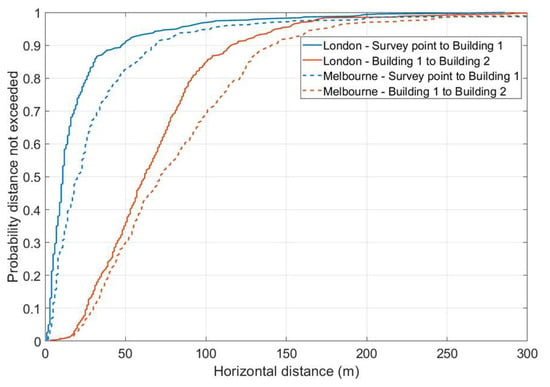
Figure 2.
CDFs of the building distance (Db1 and Db12) for London and Melbourne, extracted from [11].
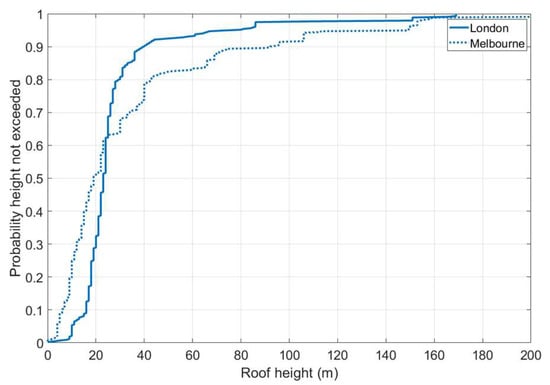
Figure 3.
CDFs of the building height (Hb1) for London and Melbourne, extracted from [11].
4. Reflection and Diffraction Loss
Although the concept of plane waves is largely theoretical, as the wave is associated with plane fronts that extend indefinitely orthogonally to the propagation direction, in practice, such a wave represents a satisfactory approximation of the reality when the observation point lies in the far-field region. Under these assumptions, the reflection and the diffraction (i.e., transmission) phenomena of a plane wave depend on the polarization, on the incident angle and on the electromagnetic features of the two materials separated by a planar interface.
Referring to Figure 4, let us consider a plane wave impinging on the discontinuity between two homogeneous and isotropic media with different electromagnetic properties (electric permittivity ε, magnetic permeability µ and conductivity σ). The electric () and magnetic () fields of the incident wave are identified by the subscript i, while those corresponding to the transmitted (refracted) and reflected waves are identified by subscripts t and r, respectively. Finally, represents the propagation vectors, all lying on the same (x, z) plane. The reflection and transmission mechanisms differ for the two orthogonal polarizations of the incident waves, i.e., the transverse electric (TE) component, for which is perpendicular to the (x, z) plane, and the transverse magnetic (TM) component, for which lies on the (x, z) plane.
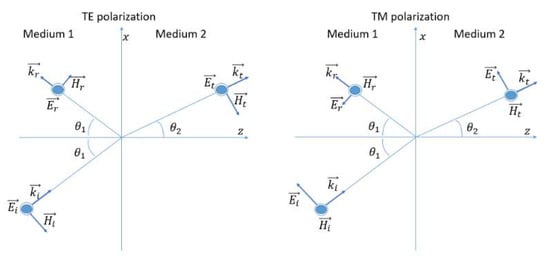
Figure 4.
Reflection and transmission of a plane wave at an interface between two isotropic and homogeneous media with different electromagnetic characteristics.
For both cases, the E-field reflection coefficient Γ is defined as the ratio of the reflected electric field to the corresponding incident electric field at the interface and is given by [13]
where
and are, respectively, the x-components of and , f is the frequency (Hz), is the incidence angle, is the refraction angle calculated using Snell’s law, is the electric permittivity, is the magnetic permeability, is the conductivity, is the propagation constant and is the intrinsic impedance of medium i.
For multiple slabs of different materials, the overall value of Γ results from the combination of the multiple reflections of the wave occurring within each slab [13].
4.1. Electromagnetic Properties of Ground and Building Materials
The electromagnetic properties vary considerably from material to material, and they also typically depend on the wave frequency f. The values of the relative dielectric permittivity (), the relative magnetic permeability () and the conductivity for several materials are provided in Recommendation ITU-R P.2040-1 [14].
Different materials are considered in this work for the cities of London and Mel-bourne: the reflections induced by the buildings are calculated both for the incidence from air into a structure consisting of a mix of concrete and bricks (common walls), and for the incidence from air into a glass slab (windows). The structures of these two types of interfaces are sketched in Figure 5. The interface between air and asphalt is considered to account for ground reflections, with the electromagnetic parameters of the dry asphalt being retrieved from [15] at microwave frequencies ( S/m, ).
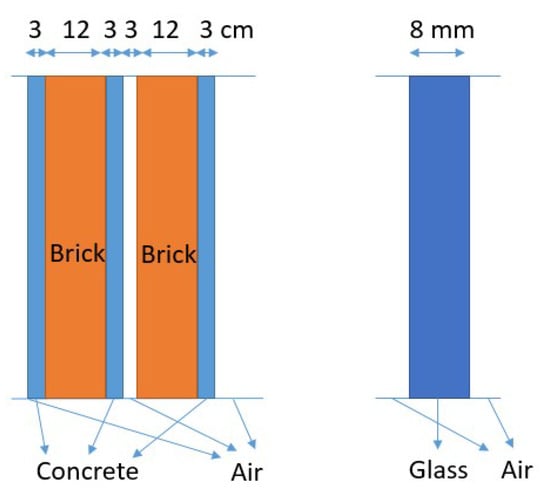
Figure 5.
Structure of the interfaces considered for building reflections: concrete/brick walls (on the left) and single glass slab (on the right).
4.2. Reflection and Diffraction Loss Calculation
As is clear from (1) and (2), the reflection coefficients are a function of the incidence angle, which, in turn, depends on the horizontal and vertical angles defined in Figure 6 (right side, depicting two examples of different horizontal angles). The left side of Figure 6 depicts the incidence geometry for two sample rays having the same elevation angle and different horizontal angles . Referring to the left side of Figure 6, where the building façade is parallel to the (x, z) plane, the incidence angle is given by
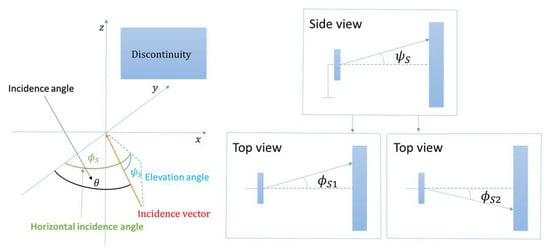
Figure 6.
Horizontal incidence angle, , elevation angle, , and incidence angle, , of a single ray (left) and example of two sample rays (right) having the same elevation angle, , and different azimuth angles, and .
Figure 7 depicts the trend of the absolute value of the reflection coefficients at 6 GHz, for both TM and TE polarizations, as a function of the incidence angle. Results are shown for reflection from buildings (air–concrete/brick wall and air–glass slab) and from the ground (air–dry asphalt). Overall, the TM component undergoes a lower reflection when compared to the TE polarization, especially around Brewster’s angle, for which the TM wave is (almost) totally transmitted [13].
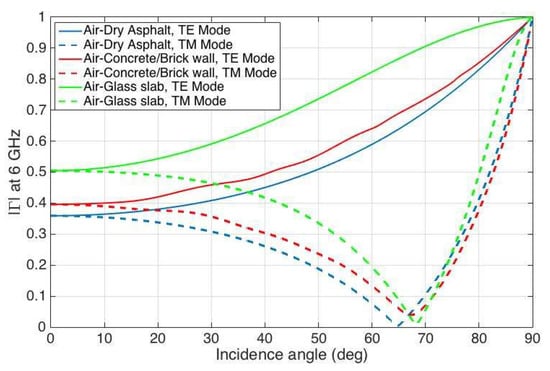
Figure 7.
Trend of the absolute value of the reflection coefficient (both TE and TM cases) at 6 GHz as a function of the incidence angle, for different discontinuities: air to ground (asphalt) and building (concrete/brick wall and glass slab).
For a single discontinuity, the reflection loss (in dB) is simply calculated as
The combination of multiple reflections is explained in Section 5.2.
Besides reflections, in an urban environment, diffraction from obstacles plays a key role in determining the overall loss of the wave on its way to the satellite. Following the method described in [11], the knife-edge model is implemented to consider the diffraction loss: an obstacle, such as a building, is approximated by a knife edge of negligible thickness.
The calculation of the diffraction loss requires evaluating Fresnel’s integral, which could be quite time consuming, so the proposed model uses the simple (yet effective and accurate) expression of the diffraction loss LD (in dB) described in Recommendation ITU- R P.526-15 [12]:
where
is the wavelength, represents the distance between the base station and the nearest vertex of the building and is the orthogonal distance between the wave propagation direction and the vertex, as shown in Figure 8. The choice of employing the knife edge approach to calculate the diffraction loss in the proposed model is associated with the goal of preserving a good balance between modeling accuracy and simplicity, as well as of reducing the calculation time to provide reliable results in a few minutes, especially if compared to the heavy computational load associated with raytracing methods. Future enhancements of the proposed model will consider refining the approach to model the diffraction loss.
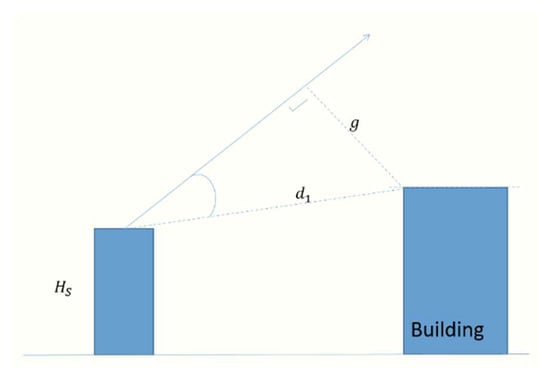
Figure 8.
Geometry of the knife-edge diffraction model.
5. Clutter Loss
The total clutter loss results from the combination of the total reflection loss, i.e., given by possible multiple wave reflections, and the total diffraction loss, i.e., given by possible multiple wave diffractions.
The first step to calculate the clutter loss statistics is to generate a random urban scenario for each ray leaving the base station. This is achieved by randomly drawing, from the corresponding statistics (see Figure 2), the distances from the base station and the first and second buildings, and between the buildings from the second to the last (the building causing no further reflection or diffraction loss). The height of the buildings is also drawn randomly according to the corresponding statistic (see Figure 3). More specifically:
- The height of all buildings is obtained from the unique CDF of the building height ;
- The distance between the base station and the first reflecting building is extracted from the statistic;
- The distance between the first reflecting building and the second one behind it is extracted from the statistic;
- For all possible reflections, from the first “reflective” building on, the distance between a façade and the next one is extracted again from the statistic;
- For all possible diffractions, the distance between a façade and the next one is extracted again from the statistic.
5.1. Combination of Reflection Loss and Diffraction Loss
Depending on the scenario, the clutter loss is obtained as a different combination of LR and LD.
Figure 9 depicts the Line-of-Sight case (LoS, no building reflections) for which the total clutter loss, L, is obtained by simply summing (in dB) the diffraction losses due to the overcome buildings B1, B2, Bd3, … until building BdP, with the diffraction loss of building d(P + 1) being equal to zero:
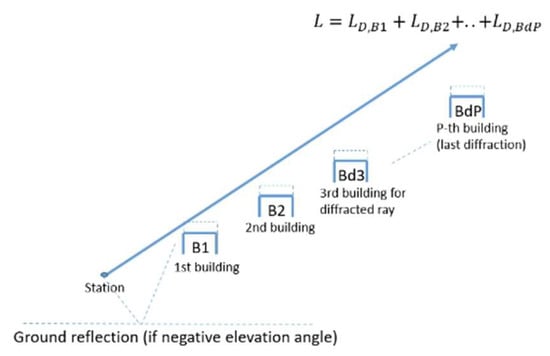
Figure 9.
Clutter loss calculation for the LoS scenario.
In the case of negative angles, the reflection loss of the ground is added in the calculation.
In the presence of reflections from buildings and/or the ground (NLoS─Non-Line-of-Sight case), the clutter loss calculation depends on the specific scenario; an example is shown in Figure 10. A key aspect is that two paths are considered whenever the ray hits either the first or second building. The first path is associated with the portion of the wave overcoming the first (or second) building (path S1, with total loss L1), which will be affected only by further diffraction (possibly) from other buildings, until building dP (with the diffraction loss of building d(P + 1) being equal to zero). The second path is associated with the reflected wave (path S2, with total loss L2), which will be (possibly) further reflected by other obstacles along its path to the satellite. In the latter case, L2 is calculated by summing (in dB) all the reflection losses and the diffraction losses given by the further overcome buildings, after the last reflection, until building rdN (with the diffraction loss of building rd(N + 1) being equal to zero). This is clarified in Figure 10, which shows an example of how L1 and L2 are calculated.
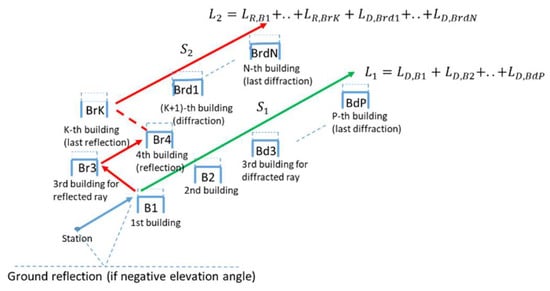
Figure 10.
Clutter loss calculation for a sample NLoS scenario.
A similar calculation is performed when negative elevation angles are considered: in this case, the additional reflection from the ground will be considered for both paths S1 and S2. The ground reflection loss is added to both .
The final step in the calculation of the total clutter loss consists of combining L1 and L2. In the following, l will indicate the unitless loss smaller than one. In principle, it should be referred to as gain, since the radiated power is multiplied, and not divided; nevertheless, we think that making reference to ‘reflection gain’ and/or ‘diffraction gain’ could be misleading. Referring to Figure 10, if the base station radiates the power , the power associated with path S1 (not in dB) is . The remaining power, , is associated with path S2. If we neglect the difference in the path lengths of S1 and S2, which is reasonable considering the geometry, the power reaching the satellite associated with paths S1 and S2 will, respectively, be
The total power PS reaching the satellite is
where l is the total clutter loss. From (8) and (9):
Expressing l in dB yields
Following the same approach for negative angles, the impact due to the ground reflection needs to be considered in both
According to this approach, the loss experienced by each ray (all of which build up the beam radiated by the 5G antenna) is calculated, and it contributes to the clutter loss statistics, which hence span from very low values, for example, in the case of LoS, to very large ones, for example, in the case of rays trapped among high buildings. It is worth noting that, in principle, the diffracted and reflected/diffracted rays should be combined in phase, which is a function of the path length (which can be easily taken into account) and of the reflection coefficients (more difficult to evaluate accurately). Nevertheless, the sum of the rays’ power at the satellite is a good compromise between the accuracy and simplicity of the proposed approach, even more at the statistical level. By combining the statistics of the total clutter loss and the base station radiated power, conditioned to the elevation angle, it is possible to calculate the power interfering with the satellite.
This is not possible with the traditional ray-tracing approach using isotropic receivers [16], for which all the radiated rays are combined at the receiver and the one affected by the lowest loss dominates; in this case, the range of possible clutter loss values is therefore limited. Measurements are expected to provide results closer to the ray-tracing approaches, as they typically use omnidirectional receivers on the ground (and directive transmitting antennas installed on a building), and therefore the total received power is also inherently calculated by combining all rays [17,18]. In fact, ray-tracing simulations and measurements sufficiently represent the behavior of conventional wireless systems, using static antenna radiation patterns, but not that of 5G systems, whose adaptive antennas (beam forming) radiate towards different single users in each instant.
To allow a fair assessment of the proposed model, a new ray-tracing methodology is presented in Section 7, based on a set of receiver nodes enabling the independent evaluation of all the rays transmitted from an omnidirectional antenna.
5.2. Analytical Model
A simple analytical model, dependent on the frequency and elevation angle, is definitely more easily applicable than the complete simulation outlined in Section 2. For this reason, the clutter loss statistics calculated by simulating the London, Melbourne and Milan scenarios were fitted by a mathematical expression that accurately approximates the statistics for low clutter loss values and time percentages (typically lower than 60–70%), i.e., the most important ones for interference applications. The resulting fitting parameters are not associated with a single city, but they are related to the local statistics of buildings’ height and the base station’s height, besides the elevation angle and frequency.
The clutter loss cumulative distributions produced at different frequencies between 1 and 30 GHz, considering the base height either uniformly distributed between 4 and 6 m or fixed at 18 m, for various elevation angles, were approximated using the following expression:
with
where is the elevation angle (degrees), p is the percentage of locations (%), 0 < p < 100, and is the median value of the building height (m).
If the base station height is randomly distributed between 4 and 6 m:
If the base station height is 18 m:
and
where f is the frequency between 2 and 10 GHz.
The curve fitting is achieved by minimizing the overall RMS (root mean square) difference from the generated cumulative distributions by weighting the low-percentage region of the curves more than the region with the highest percentage. A similar approach was used in [11], though, in that case, the parameters were manually adjusted to achieve a good fit for low clutter loss values (no details are provided). Table 1 lists the coefficients from to ; the coefficients from to are reported in Table 2, and Table 3 presents the coefficients from to .

Table 1.
Coefficients of the expression approximating the clutter loss statistics for Hs = 4–6 m and 18 m.

Table 2.
Coefficients of the expression approximating the clutter loss statistics for = 4–6 m.

Table 3.
Coefficients of the expression approximating the clutter loss statistics for = 18 m.
6. Model Results
As it is not possible to test the model against the few measurements available in the literature (as mentioned in Section 5.1, this is due to the lack of measurements with directive antenna receivers), the predictions of the analytical model, described in Section 5.2, are compared to the simulation results. Melbourne and London, considered in Report ITU-R P.2402, present different planimetric characteristics, both in terms of building height and distance. The clutter loss calculation methodology presented in Section 2, Section 3 and Section 4.1 is applied by simulating rays with TE polarization and rays with TM polarization, at 6 GHz. Asphalt is considered to model the ground, while, as for buildings, the probability of concrete/brick and glass walls is assumed to be equal to 90% and 10%, respectively. The results achieved with a uniform random horizontal incidence angle between 0° and 60° are presented in Figure 11 and Figure 12, respectively, for London and Melbourne, with the height of the base station uniformly distributed between 4 and 6 m. A horizontal incident angle between 0° and 60° has been chosen according to the steering capabilities of the transmitting antenna. In fact, in a three sectoral antenna, the allowed horizontal steering directions are between −60° and +60°. Therefore, transmitted rays can impact on a building in front of the antenna with an incident angle between 0° and 60°. Figure 13 and Figure 14 present the results obtained by fixing the base station height at 18 m in London and Melbourne. In each figure, the statistics from the Monte Carlo simulation presented in Section 5.1 are compared to the analytical model illustrated in Section 5.2, as well as the results obtained by simulations of Report ITU-R P.2402.
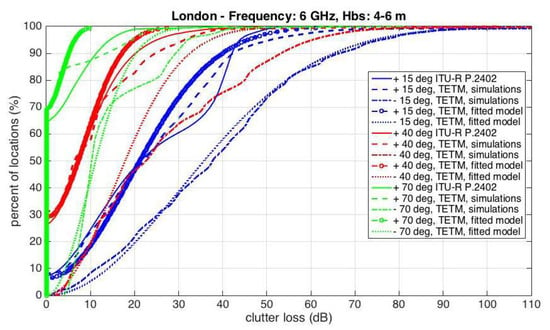
Figure 11.
Clutter loss cumulative distributions: comparison between the proposed model and the ITU-R P.2402 model, for elevation angles of 15, 40 and 70 degrees in London (base station height uniformly distributed between 4 and 6 m).
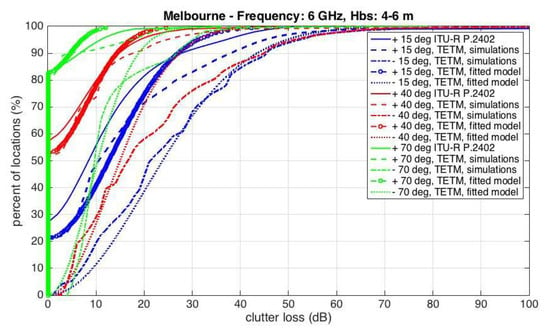
Figure 12.
Clutter loss cumulative distributions: comparison between the proposed model and the ITU-R P.2402 model, for elevation angles of 15, 40 and 70 degrees in Melbourne (base station height uniformly distributed between 4 and 6 m).
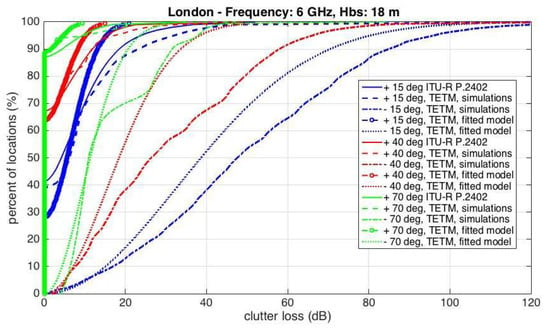
Figure 13.
Clutter loss cumulative distributions: comparison between the proposed model and the ITU-R P.2402 model, for elevation angles of 15, 40 and 70 degrees in London (base station height fixed at 18 m).
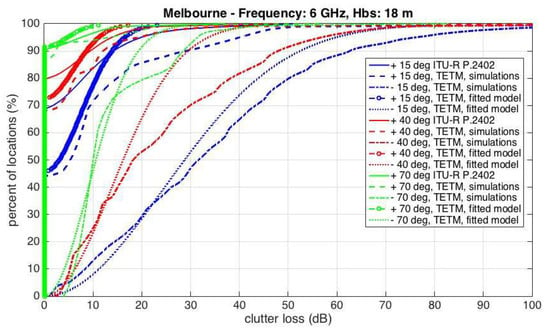
Figure 14.
Clutter loss cumulative distributions: comparison between the proposed model and the ITU-R P.2402 model, for elevation angles of 15, 40 and 70 degrees in Melbourne (base station height fixed at 18 m).
Figure 11, Figure 12, Figure 13 and Figure 14 show that the statistics from the proposed Monte Carlo simulation provide similar or larger clutter loss values if compared to the results obtained by the report ITU R P.2402 model, for elevation angles of +15° and +40°. The proposed Monte Carlo simulation yields lower values than the ITU-R approach in the low probability range, for the 70° elevation angle. These observations are even more evident for the antenna height of 18 m and for Melbourne, which is characterized by taller and more distant buildings (see Figure 2 and Figure 3). The reason behind the differences in the results highlighted above is likely due to the fact that, in the proposed Monte Carlo simulation, more realistic reflections coefficients are used, as well as an unlimited number of wave reflections and diffractions. As expected, for negative elevation angles, the clutter loss values are much larger; however, concerning frequency interference studies, this result is compensated by the usual larger power radiated by the base station towards the users on the ground. As expected, the analytical model described in Section 5.2 is close to the simulations results especially in the low probability range which is the most important for interference studies.
7. Model Validation
The commercial ray tracer SIRADEL© [19] is used to validate the proposed model. The chosen urban environment for validation is a square area with a lateral dimension of 1.2 km in the city of Hong Kong, which is deemed appropriate due to the high building density and the scarcity of vegetation. The statistics of buildings are obtained as detailed in Section 3 from the available SIRADEL© data by deploying 500 survey points. CDF curves of the clutter loss are obtained through ray tracing by deploying 15 antennas across the map, within the same region, as the survey points (see Figure 15), to serve as transmitting base stations, while a box of receivers is placed all around the map to collect outgoing rays (see Figure 16). Transmitting antennas are assumed to be omnidirectional, with a transmission power (total radiated power, TRP) of 60 dBm and a height of 18 m from the ground. The wave polarization is vertical. The box of receivers consists of a grid for each side, with receivers spaced 5 m along x, y and z. In this context, a “point receiver” is considered (without a physical dimensions), which collects the information of all rays reaching it: amplitude, delay, departing direction, arrival direction, etc. The box is designed to enclose all buildings, so the last grid point should be at a height , where is the maximum height of the buildings.
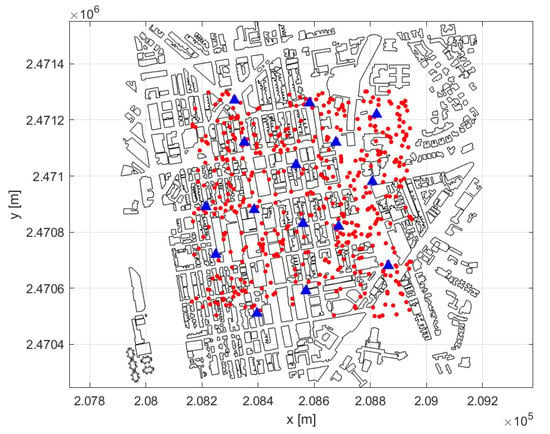
Figure 15.
Survey points (red dots) and BSs (blue triangles) simulated with the ray tracer.
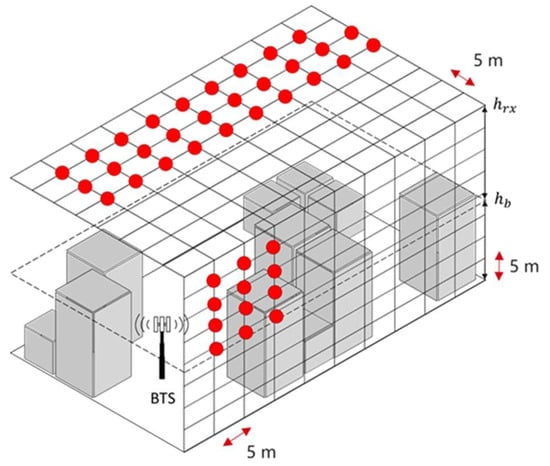
Figure 16.
Layout of receivers in the ray-tracing simulation. Notice that only some of the receivers are indicated in red.
The rationale for using only 15 antennas and a 5 m distance between the receivers in SIRADEL© is related to computational complexity: indeed, ray-tracing simulations are computationally intensive to run and, in addition, generate large amounts of data. Such parameters allow for achieving a very good trade-off between statistical relevance and computational complexity, both regarding simulations and data post-processing.
Once the output data are available from the ray-tracing simulation, the clutter loss experienced by each ray is evaluated as follows:
- For the i-th receiver, we collect:
- The power received from the j-th ray ;
- The time delay of the j-th ray .
- The length of the j-th ray path is computed as , where is the speed of light.
- The clutter loss experienced by the j-th ray at the i-th receiver is calculated in dB as
where the last term is the free space path loss.
For each positive elevation angle (i.e., the possible elevation of a satellite), the clutter loss CDF curve is built by collecting all values associated with each receiver and for the rays leaving the receiver with elevation angle . The elevation angle step is 1°. Notice that rays may leave the base station with a positive or negative angle (with respect to the horizon), but after multiple reflections, they travel towards the sky with a positive angle. Thus, the CDFs derived from ray-tracing simulations represent the average clutter loss experienced by rays departing from the base station in positive and negative directions. For this reason, the clutter loss CDFs obtained from SIRADEL© are compared in Figure 17, for a few selected elevation angles and for TM polarization, with the averaged clutter loss curves of the proposed model. The CDF curves obtained by the ray tracer and proposed model show quite good agreement. In fact, for the comparison, it must be taken into account that the ray-tracing simulation considers a limited area of the city, i.e., a limited number of buildings with their actual heights and distances: the derived statistics are expected to have a more limited stability if compared to the Monte Carlo simulation, which considers a very high number of realizations (several rays, each of which will interact with a random building scenario) generated on the basis of the building height and distance statistics. Indeed, the purpose of the comparison between the Monte Carlo simulation and the ray tracing calculations was to confirm the same order of magnitude for the clutter loss by using two very different approaches.
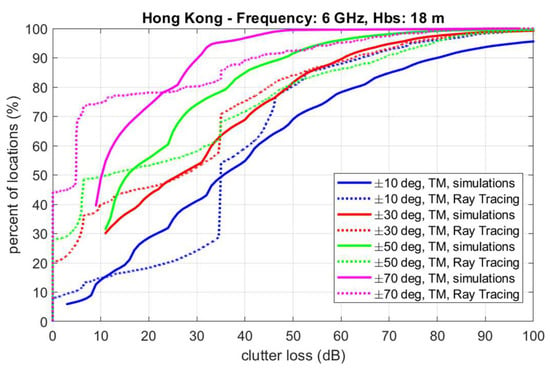
Figure 17.
Cumulative distribution function statistics of the clutter loss obtained with the ray tracer tool (dashed line) and with the proposed model, for different elevation angles.
8. Conclusions
This paper presents a new model valid up to the frequency of 10 GHz aimed at providing reliable clutter loss predictions in the wireless communication system design process. The proposed model relies on the stochastic approach presented in Report ITU-R P.2402-0, but with some crucial differences: the calculation of the diffraction loss and reflection loss is underpinned by solid physical assumptions. Further, the model adds the effect of the building material, the wave polarization angle and the non-orthogonal incidence of the ray on the building. In addition, rays with a negative elevation angle, i.e., reaching the satellite after ground reflection, are also included. Finally, the overall clutter loss is calculated differently depending on the scenario, i.e., considering just a direct ray undergoing only diffraction loss (LoS case) or by taking into account that a single ray may split into two rays after the first reflection, whose losses are afterwards recombined before reaching the satellite. The proposed methodology was applied to two different scenarios, namely, Melbourne and London, using the input statistics included in Report ITU-R P.2402. The authors believe that the proposed model offers more realistic predictions of the expected clutter loss, not only because of the physical concepts underpinning the main elements of the model (e.g., effect of different materials, use of TE and TM wave polarizations), but also because it also takes into account reflection from the ground, which is key to properly modeling the interference effects of real base stations. In addition, a comparison with the results of ray-tracing simulations is proposed: the satisfactory agreement of the clutter loss statistics obtained from the two different simulation approaches corroborates the representativeness of the proposed model. Given its mixed physical–statistical nature, the proposed model allows for faster calculations when compared to the classical ray-tracing approach; moreover, it can also be parameterized for higher-frequency bands. Future work includes the extension of the model applicability to other 5G frequency bands (e.g., around 28 GHz) by also considering the effects of diffuse scattering due to surface roughness (which emerges more as the frequency increases) and by using the proper electromagnetic material parameters (ε and σ) at such bands.
Author Contributions
C.G.R. contributed to the design of the Monte Carlo simulation, to the development of the software, to the simulations, to the comparison with Report ITU-R P.2402-0 and to the model validation; he also derived the analytical model. L.L. contributed to the design of the Monte Carlo simulation, to the assessment of the electromagnetic properties of the ground and building materials and to the development of the software. A.P. contributed to the development of the software, to the comparison with Report ITU-R P.2402-0 and to the simulations. L.R. and C.M. contributed to the identification of the interference problem, to the design of the simulations and to the supervision of the work. F.M. and D.D.D. contributed to the model validation. R.L. supervised the work. All authors contributed to the text. All authors have read and agreed to the published version of the manuscript.
Funding
This research was funded within the program of the Joint Research Lab of Politecnico di Milano and Huawei Technologies Italia.
Data Availability Statement
The data analyzed in this study comes from Monte Carlo simulations and are slightly different for each simulation. Data sharing is not applicable to this article.
Acknowledgments
The research was carried out in the framework of the Huawei-Politecnico di Milano Joint Research Lab.
Conflicts of Interest
Some authors are currently Huawei Technologies employees. This research was funded within the program of the Joint Research Lab of Politecnico di Milano and Huawei Technologies Italia.
References
- The 6 GHz Opportunity for IMT—5G Area Traffic Demand vs. Area Traffic Capacity Supply, A Whitepaper by Coleago Consulting, 1 August 2020. Available online: http://www.coleago.com/app/uploads/2020/09/The-6GHz-Opportunity-for-IMT-Coleago-1-Aug-2020-002.pdf (accessed on 29 December 2022).
- Resolution 245 (WRC-19). Studies on Frequency-Related Matters for the Terrestrial Component of International Mobile Telecommunications Identification in the Frequency Bands 3 300–3 400 MHz, 3 600–3 800 MHz, 6 425–7 025 MHz, 7 025–7 125 MHz and 10.0–10.5 GHz. Available online: https://www.itu.int/dms_pub/itu-r/oth/0C/0A/R0C0A00000F0083PDFE.pdf (accessed on 29 December 2022).
- Available online: https://www.federalregister.gov/documents/2020/05/26/2020-11236/unlicensed-use-of-the-6-ghz-band (accessed on 29 December 2022).
- ITU-R Working Party 5D, Liaison Statement to ITU-R WP 3K and WP 3M—Information for Studies on WRC-23 Agenda Item 1.4, Document 3J/3, 3K/6, 3M/4, 10 March 2020. Available online: https://www.itu.int/md/R19-WP3K-C-0006/en (accessed on 29 December 2022).
- Whitteker, J.H. Physical optics and field-strength predictions for wireless systems. IEEE J. Sel. Areas Commun. 2002, 20, 515–522. [Google Scholar] [CrossRef]
- Hata, M. Empirical formula for propagation loss in land mobile radio services. IEEE Trans. Veh. Technol. 1980, 29, 317–325. [Google Scholar] [CrossRef]
- Okumura, Y.; Ohmori, E.; Kawano, T.; Fukuda, K. Field strength and its variability in VHF and UHF land-mobile radio service. Rev. Elect. Com. Lab. 1968, 16, 825–873. [Google Scholar]
- Recommendation ITU-R P.2108-1. Prediction of Clutter Loss. ITU, Geneva, 09/2021. Available online: https://www.itu.int/rec/R-REC-P.2108-1-202109-I/en (accessed on 29 December 2022).
- Walfisch, J.; Bertoni, H.L. A Theoretical Model of UHF Propagation in Urban Environments. IEEE Trans. Antennas Propag. 1988, 36, 1788–1796. [Google Scholar] [CrossRef]
- Blaunstein, N.; Katz, D.; Censor, D.; Freedman, A.; Matityahu, I.; Gur-Arie, I. Prediction of loss characteristics in built-up areas with various buildings’ overlay profiles. IEEE Antennas Propag. Mag. 2001, 43, 181–191. [Google Scholar]
- Report ITU-R P.2402-0. A Method to Predict the Statistics of Clutter Loss for Earth-Space and Aeronautical Paths. ITU, Geneva, 03/2017. Available online: https://www.itu.int/pub/R-REP-P.2402-2017 (accessed on 29 December 2022).
- Recommendation ITU-R P. 526-15. Propagation by Diffraction. ITU, Geneva, 10/2019. Available online: https://www.itu.int/rec/R-REC-P.526-15-201910-I/en (accessed on 29 December 2022).
- Balanis, A.A.; Nora, P. Advanced Engineering Electromagnetics; Wiley: Hoboken, NJ, USA, 2012; ISBN 13 978-0-470-58948-9. [Google Scholar]
- Recommendation ITU-R P.2040-1. Effects of Building Materials and Structures on Radio-Wave Propagation above about 100 MHz. ITU, Geneva, 09/2021. Available online: https://www.itu.int/rec/R-REC-P.2040-2-202109-I/en (accessed on 29 December 2022).
- GPR Velocity Table and Analysis. Available online: https://gprrental.com/gpr-velocity-table-analysis/ (accessed on 7 November 2022).
- Hsieh, F.; Rybakowski, M. Propagation Model for High Altitude Platform Systems Based on Ray Tracing Simulation. In Proceedings of the 13th European Conference on Antennas and Propagation (EuCAP), Krakow, Poland, 31 March–5 April 2019. [Google Scholar]
- Yoon, Y.; Kim, J.; Kim, K.; Kim, M.; Chong, Y. Clutter loss characteristic in mm-Wave bands for small urban environment. In Proceedings of the International Conference on Information and Communication Technology Convergence (ICTC), Lotte City, Republic of Korea, 18–20 October 2017. [Google Scholar]
- Montenegro-Villacieros, B.; Bishop, J.; Chareau, J. Clutter loss measurements and simulations at 26 GHz and 40 GHz. In Proceedings of the 13th European Conference on Antennas and Propagation (EuCAP), Krakow, Poland, 31 March–5 April 2019. [Google Scholar]
- SIRADEL. Available online: https://www.siradel.com/volcano-5g-siradel-announces-enhanced-version-of-its-volcano-propagation-model/ (accessed on 7 November 2022).
Disclaimer/Publisher’s Note: The statements, opinions and data contained in all publications are solely those of the individual author(s) and contributor(s) and not of MDPI and/or the editor(s). MDPI and/or the editor(s) disclaim responsibility for any injury to people or property resulting from any ideas, methods, instructions or products referred to in the content. |
© 2022 by the authors. Licensee MDPI, Basel, Switzerland. This article is an open access article distributed under the terms and conditions of the Creative Commons Attribution (CC BY) license (https://creativecommons.org/licenses/by/4.0/).