
A Carrier Synchronization Lock Detector Based on Weighted Detection Statistics for APSK Signals


Abstract
:1. Introduction
- (1)
- Based on detection statistics used in the Linn detector, the proposed method weights the detection statistics according to the difference in signal amplitude on different rings of APSK constellation and generates a new detection statistic.
- (2)
- The expectation and variance of the detection statistics in the two states of carrier synchronization (lock and unlock) are analyzed theoretically.
- (3)
- The lock-detection probability and false-alarm probability of the proposed detection method are analyzed.
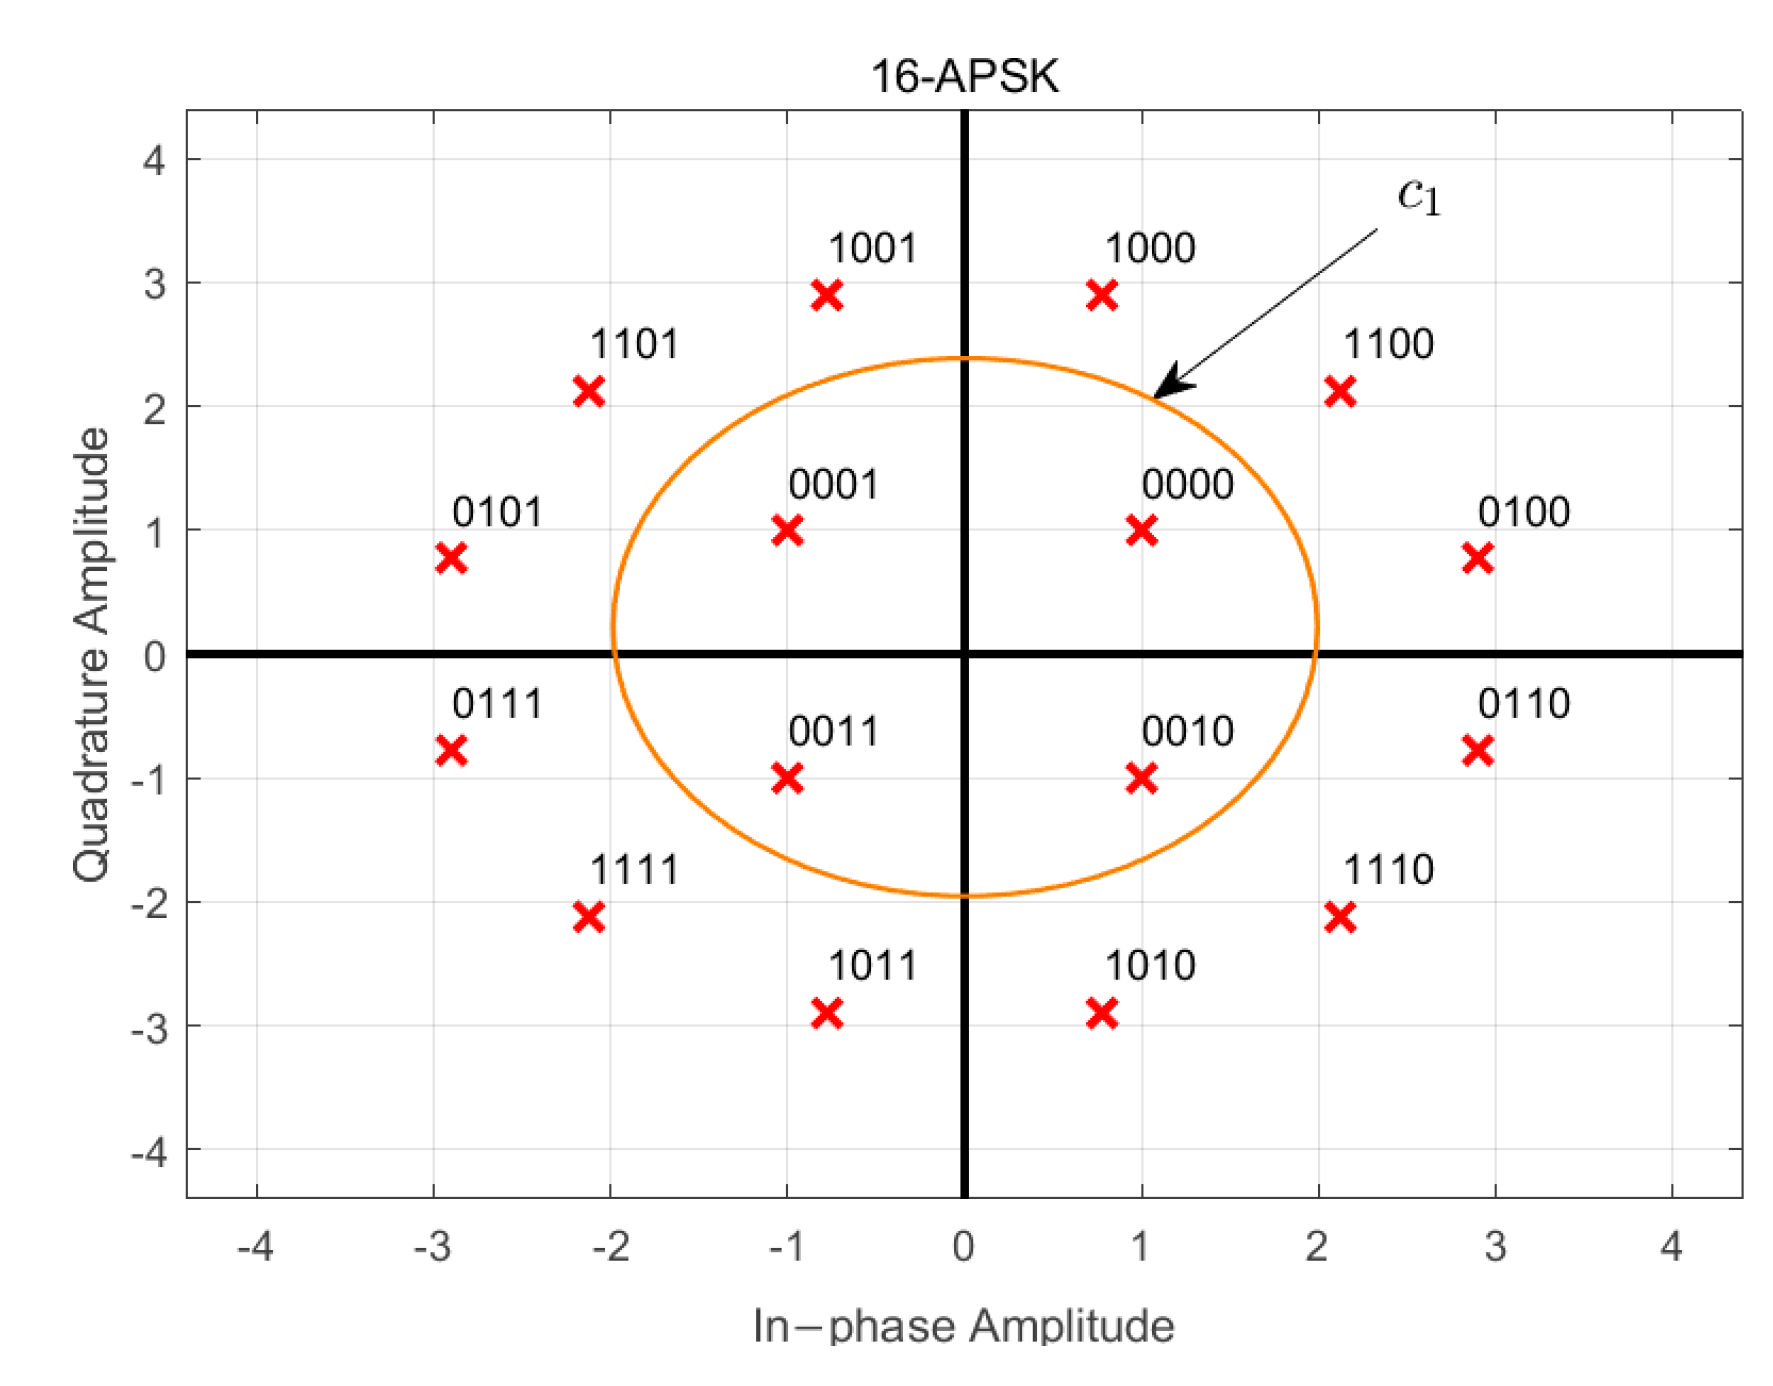
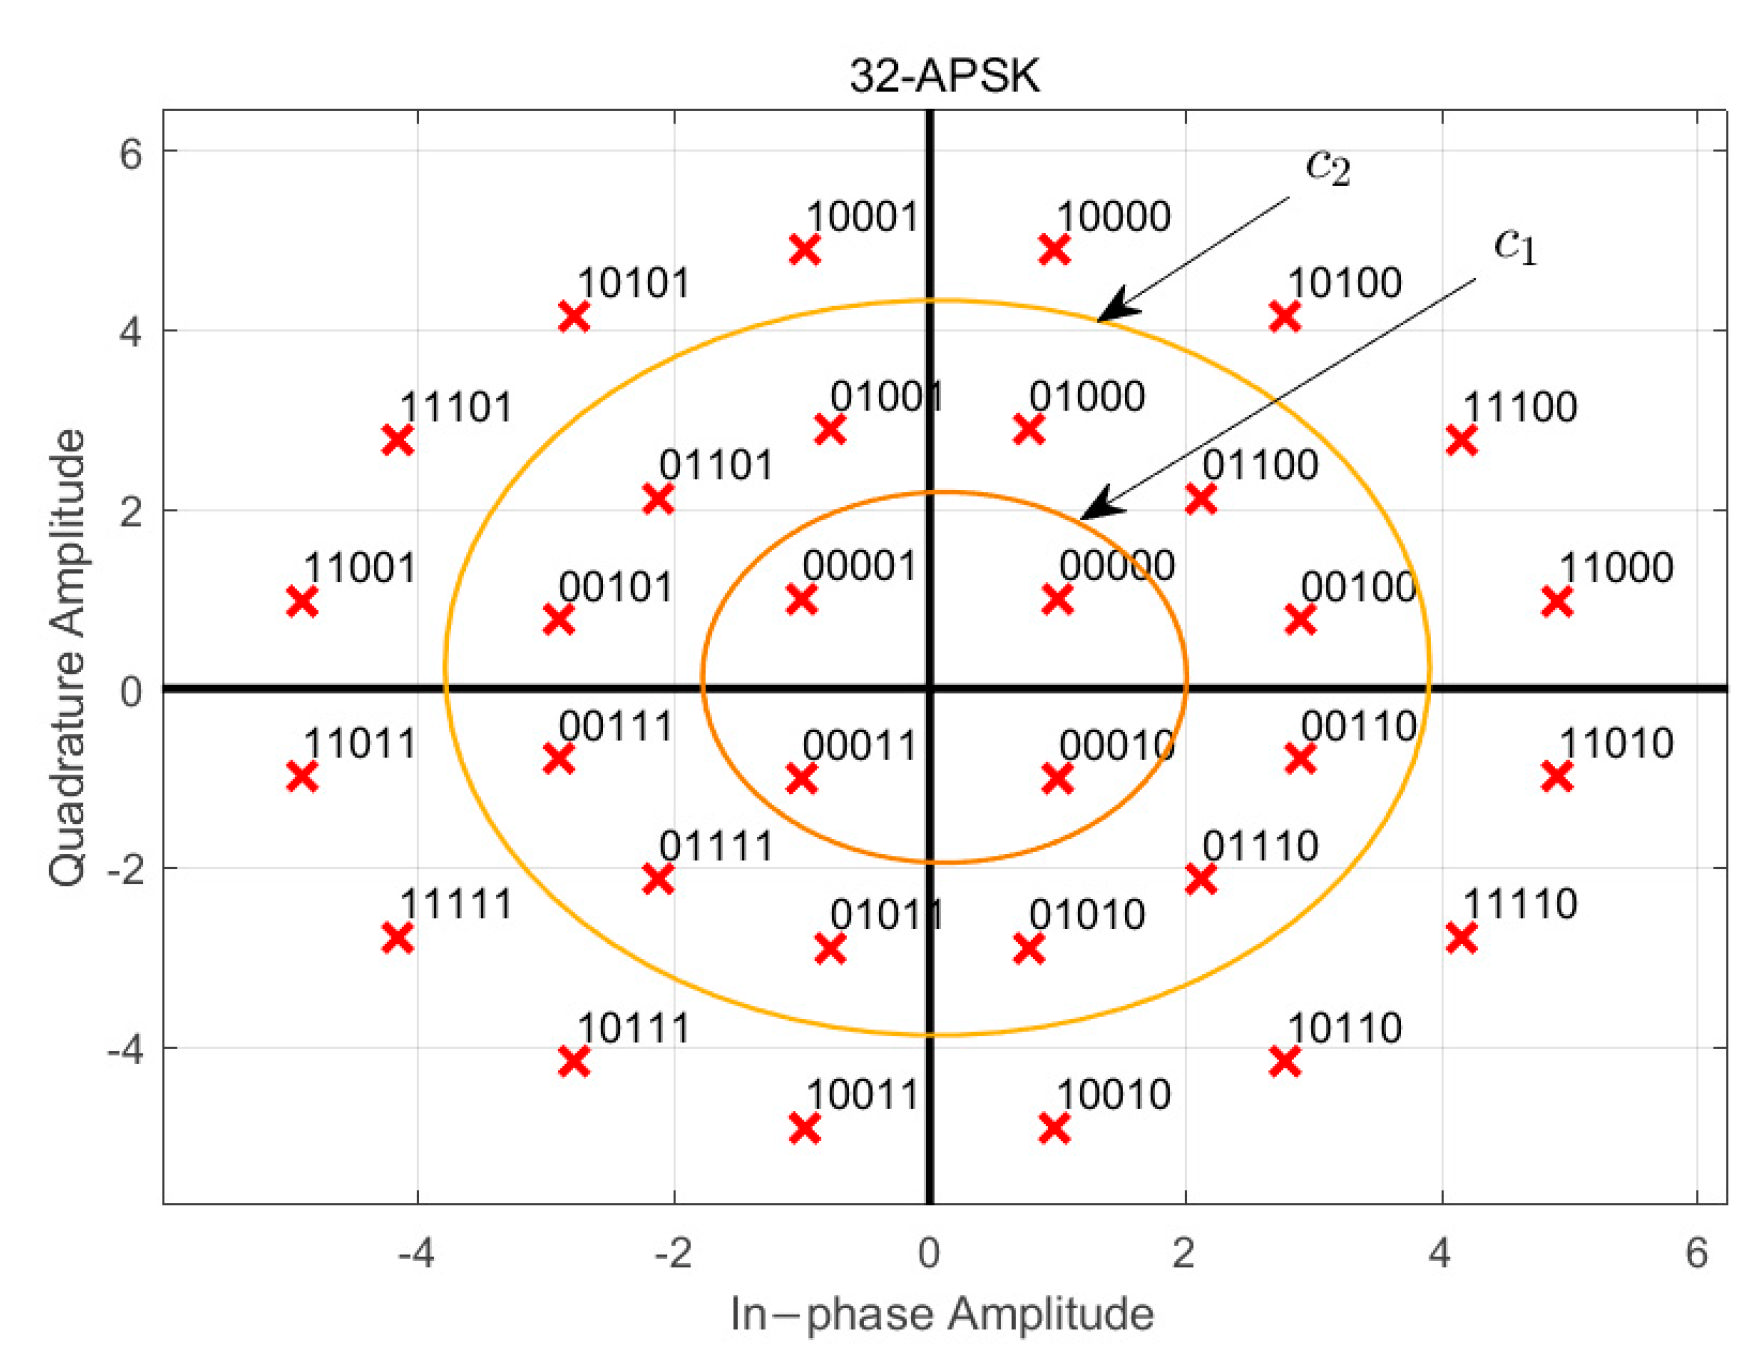
2. Signal Model
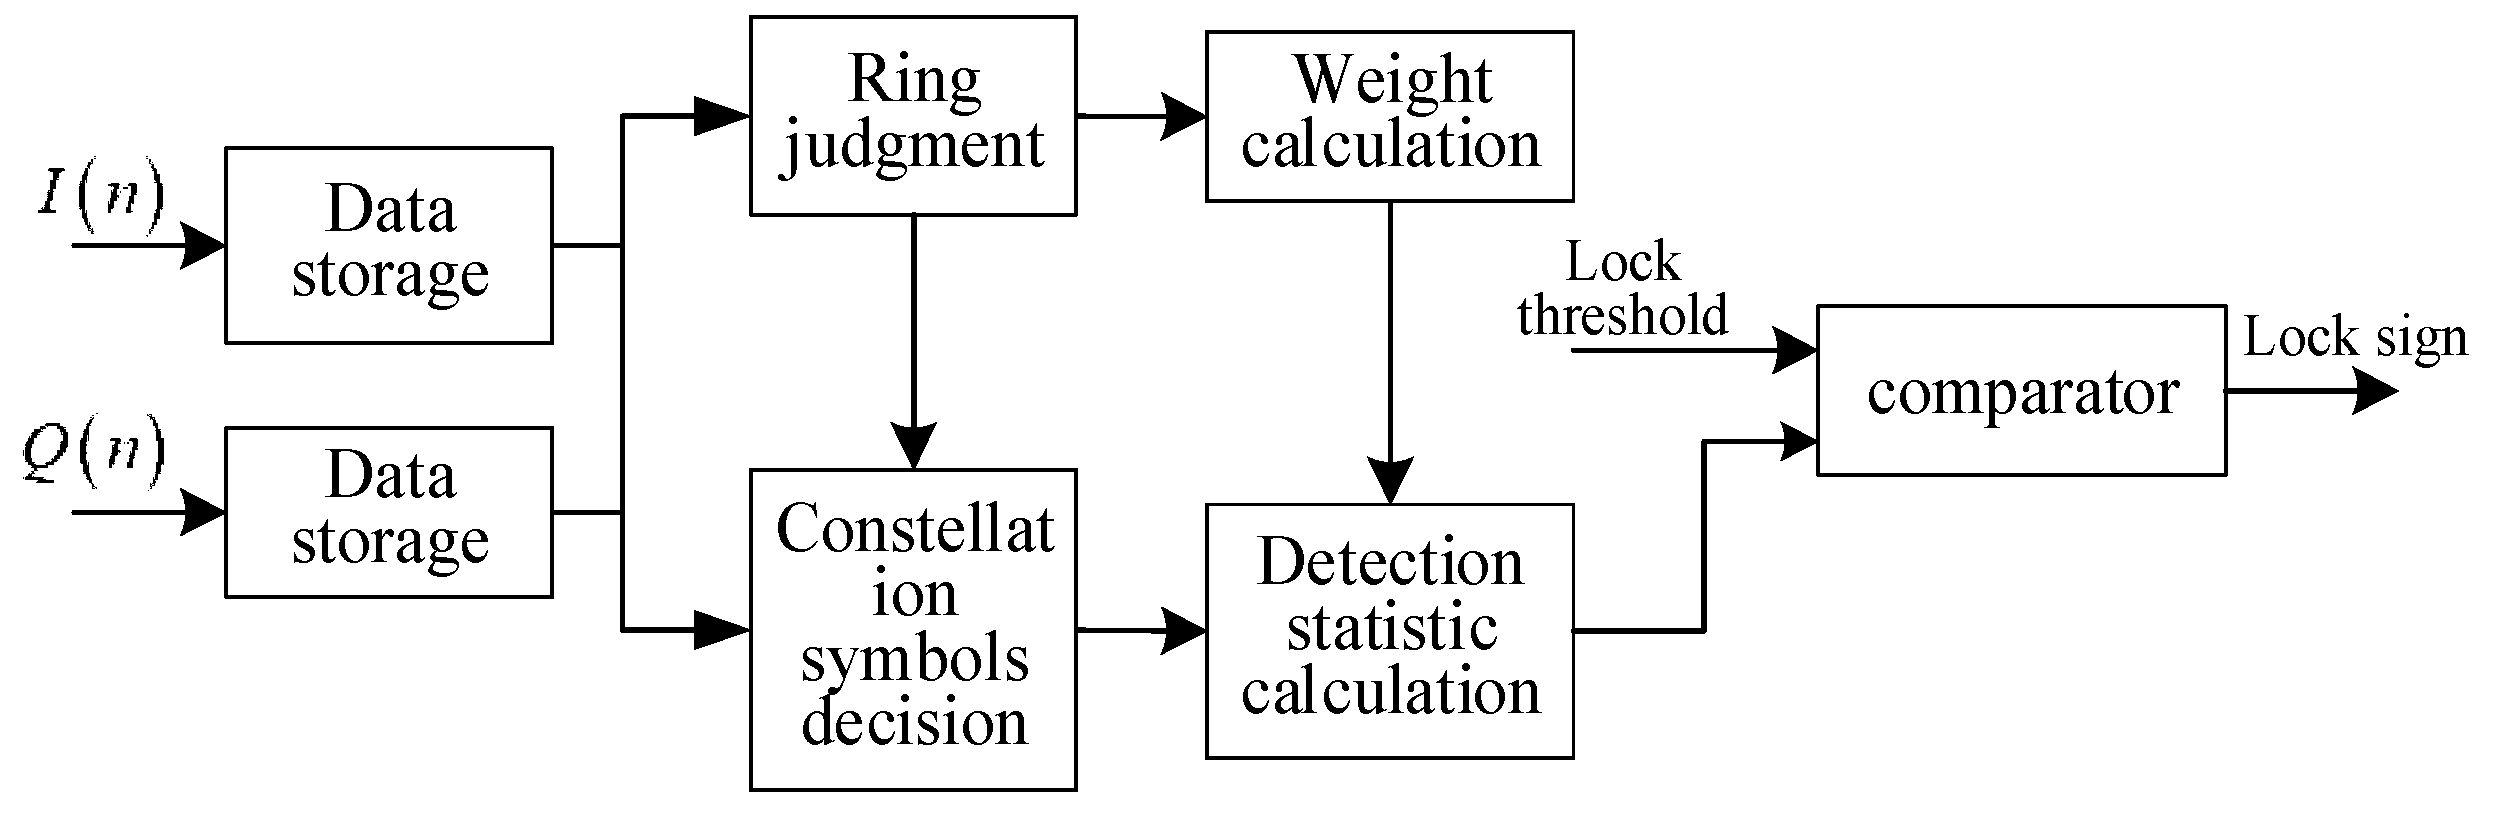
3. Methodology
4. Performance Analysis
4.1. Expectation and Variance
4.2. Lock Detection Probability
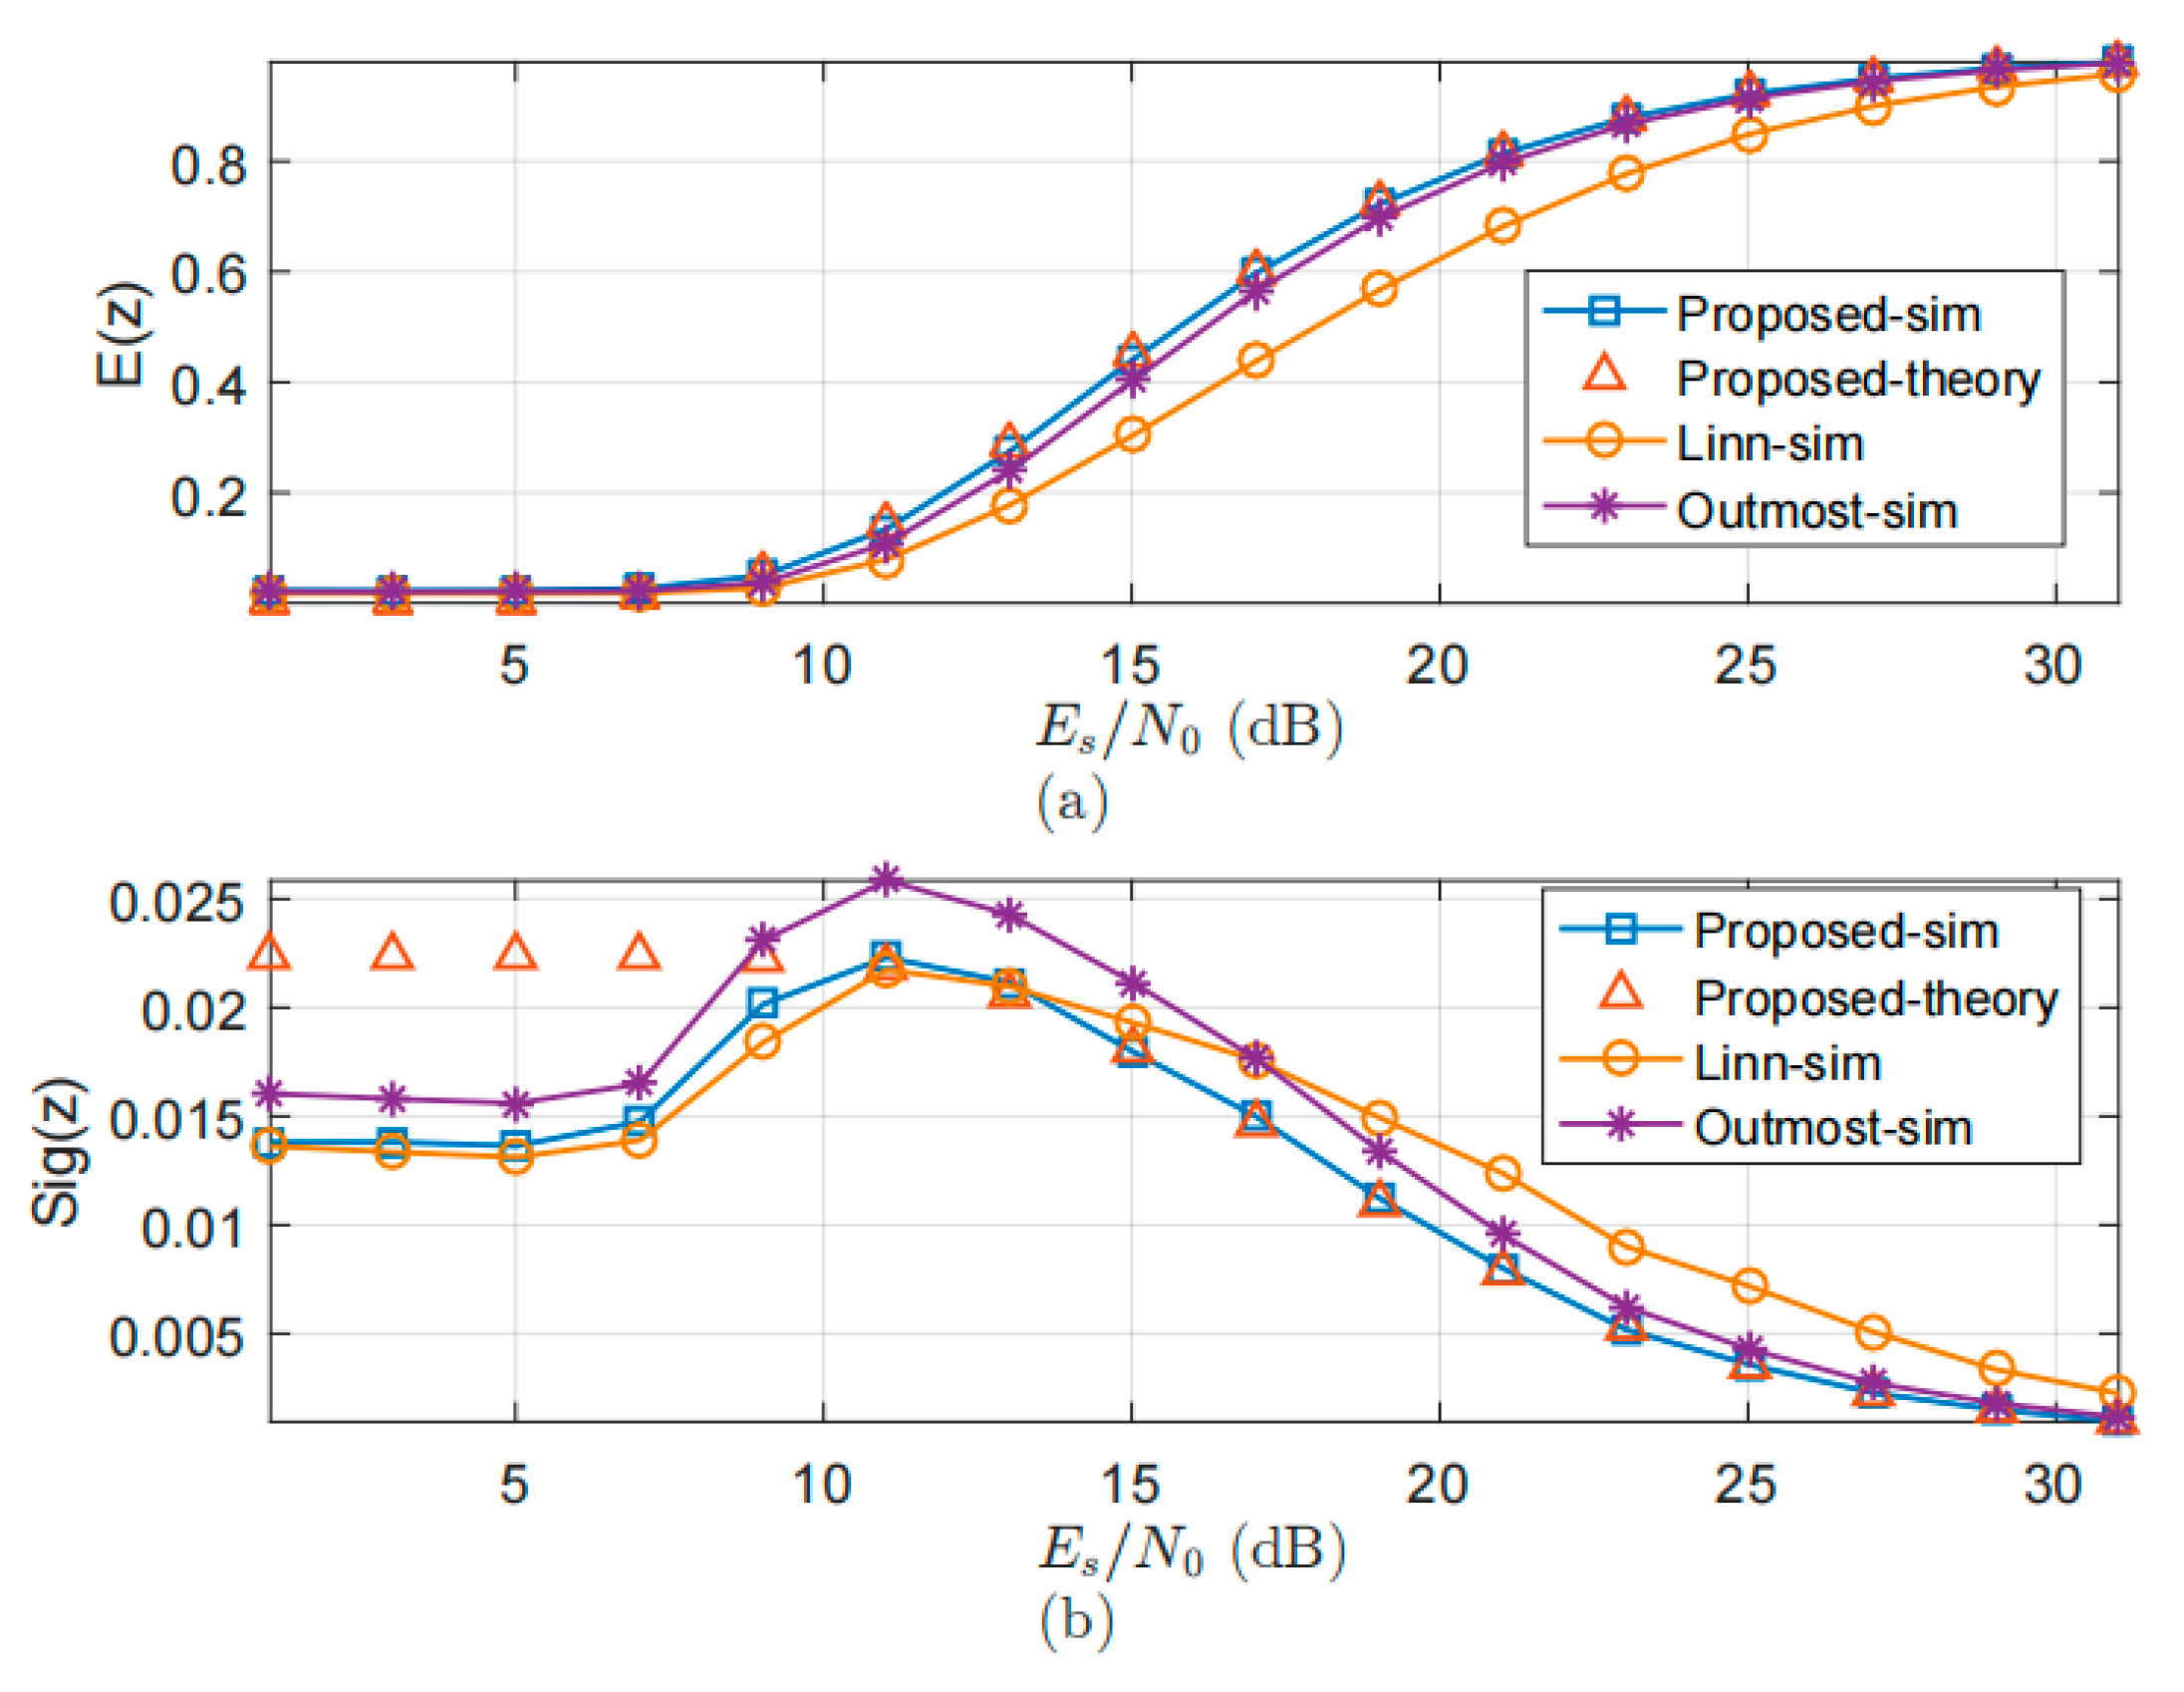
5. Numerical Results
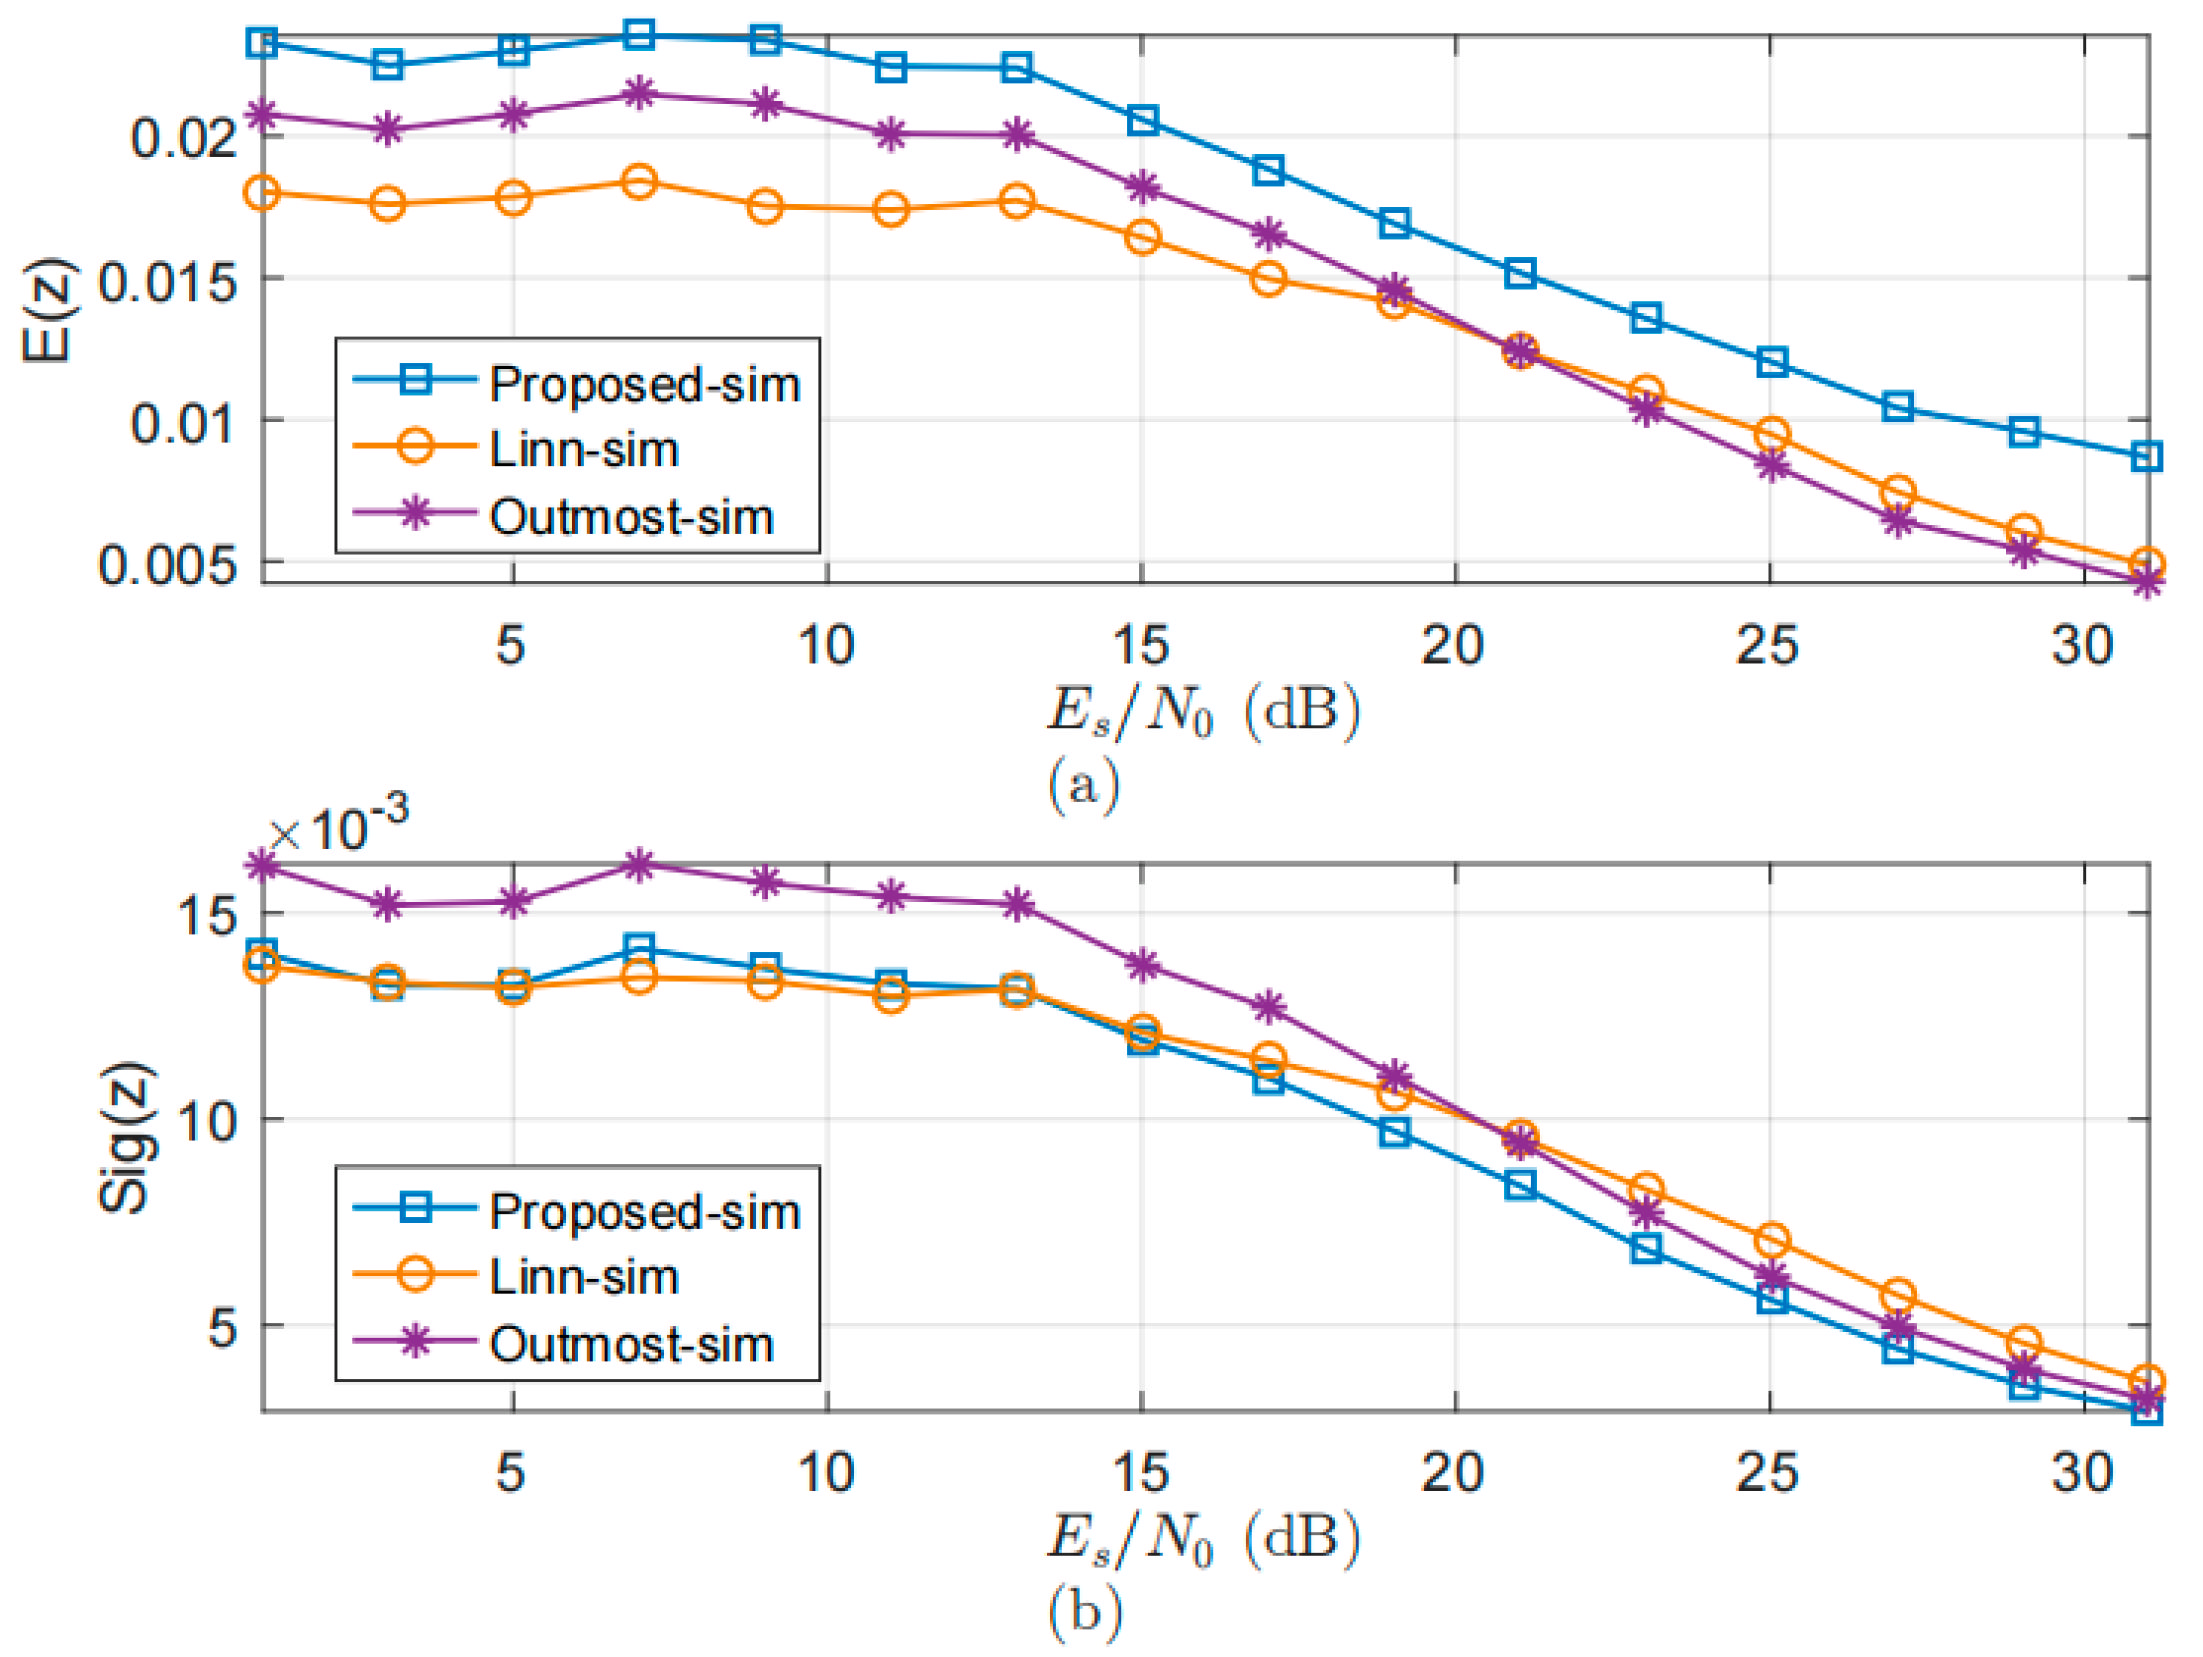
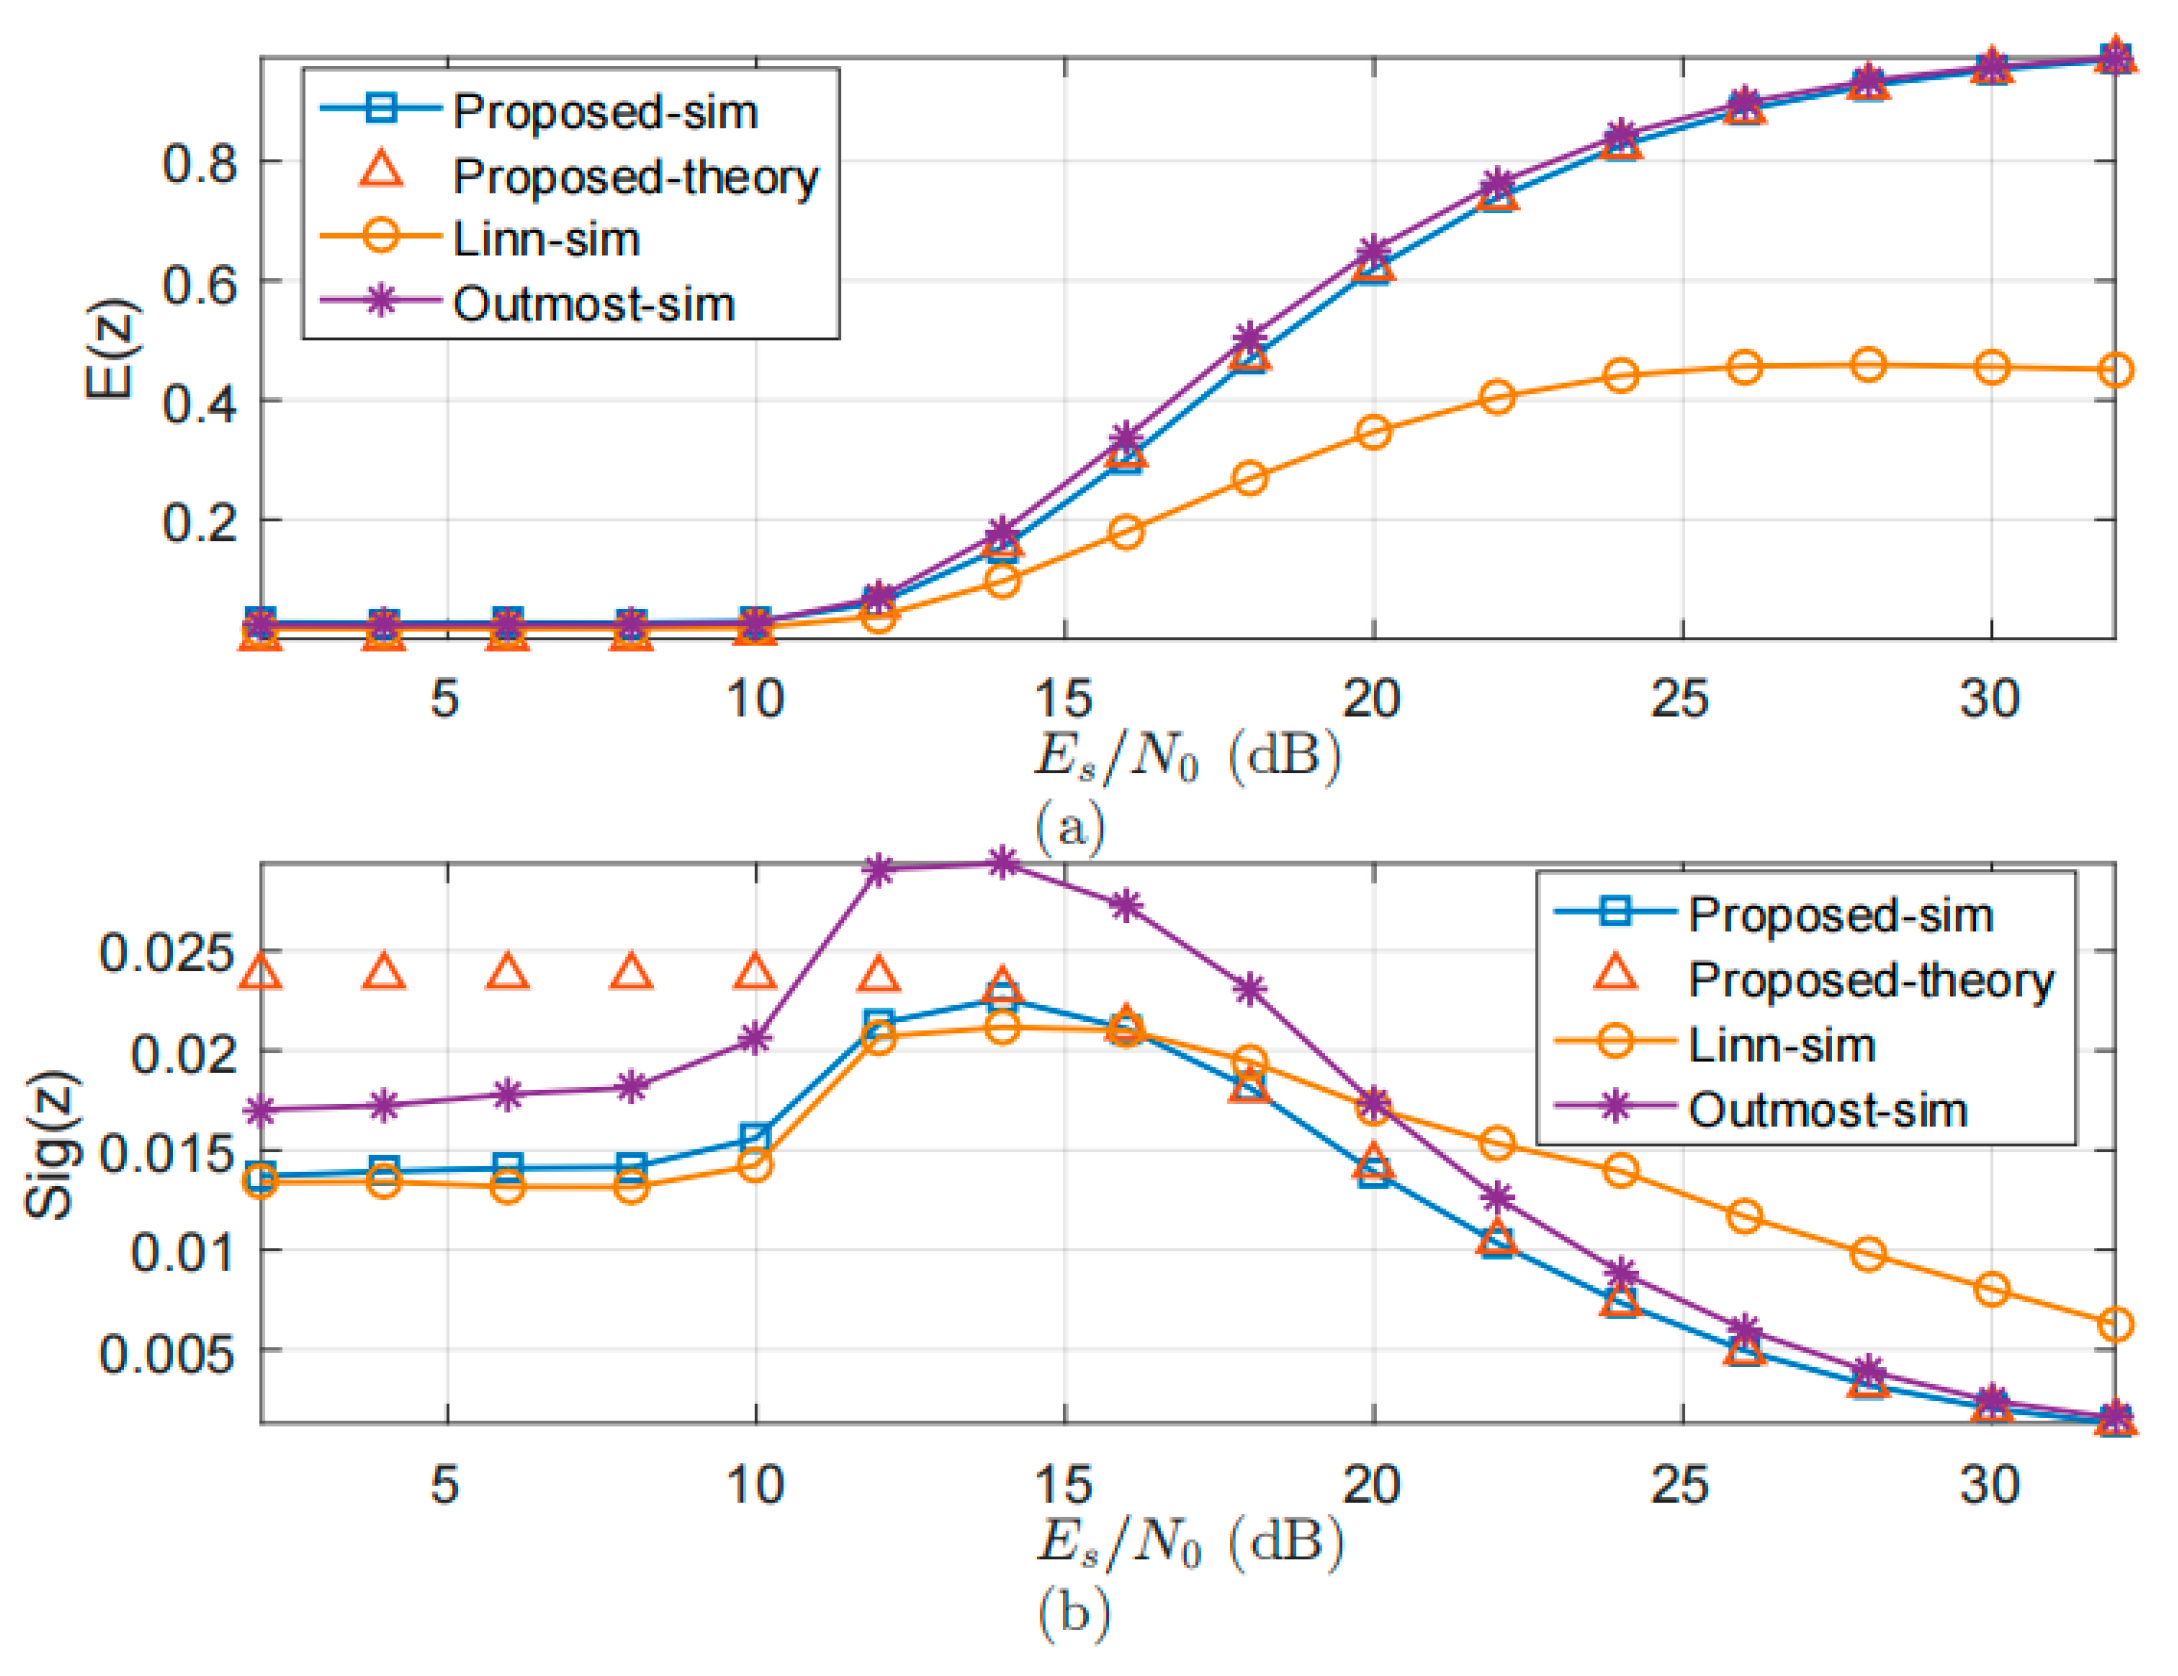
5.1. Expectation and Variace
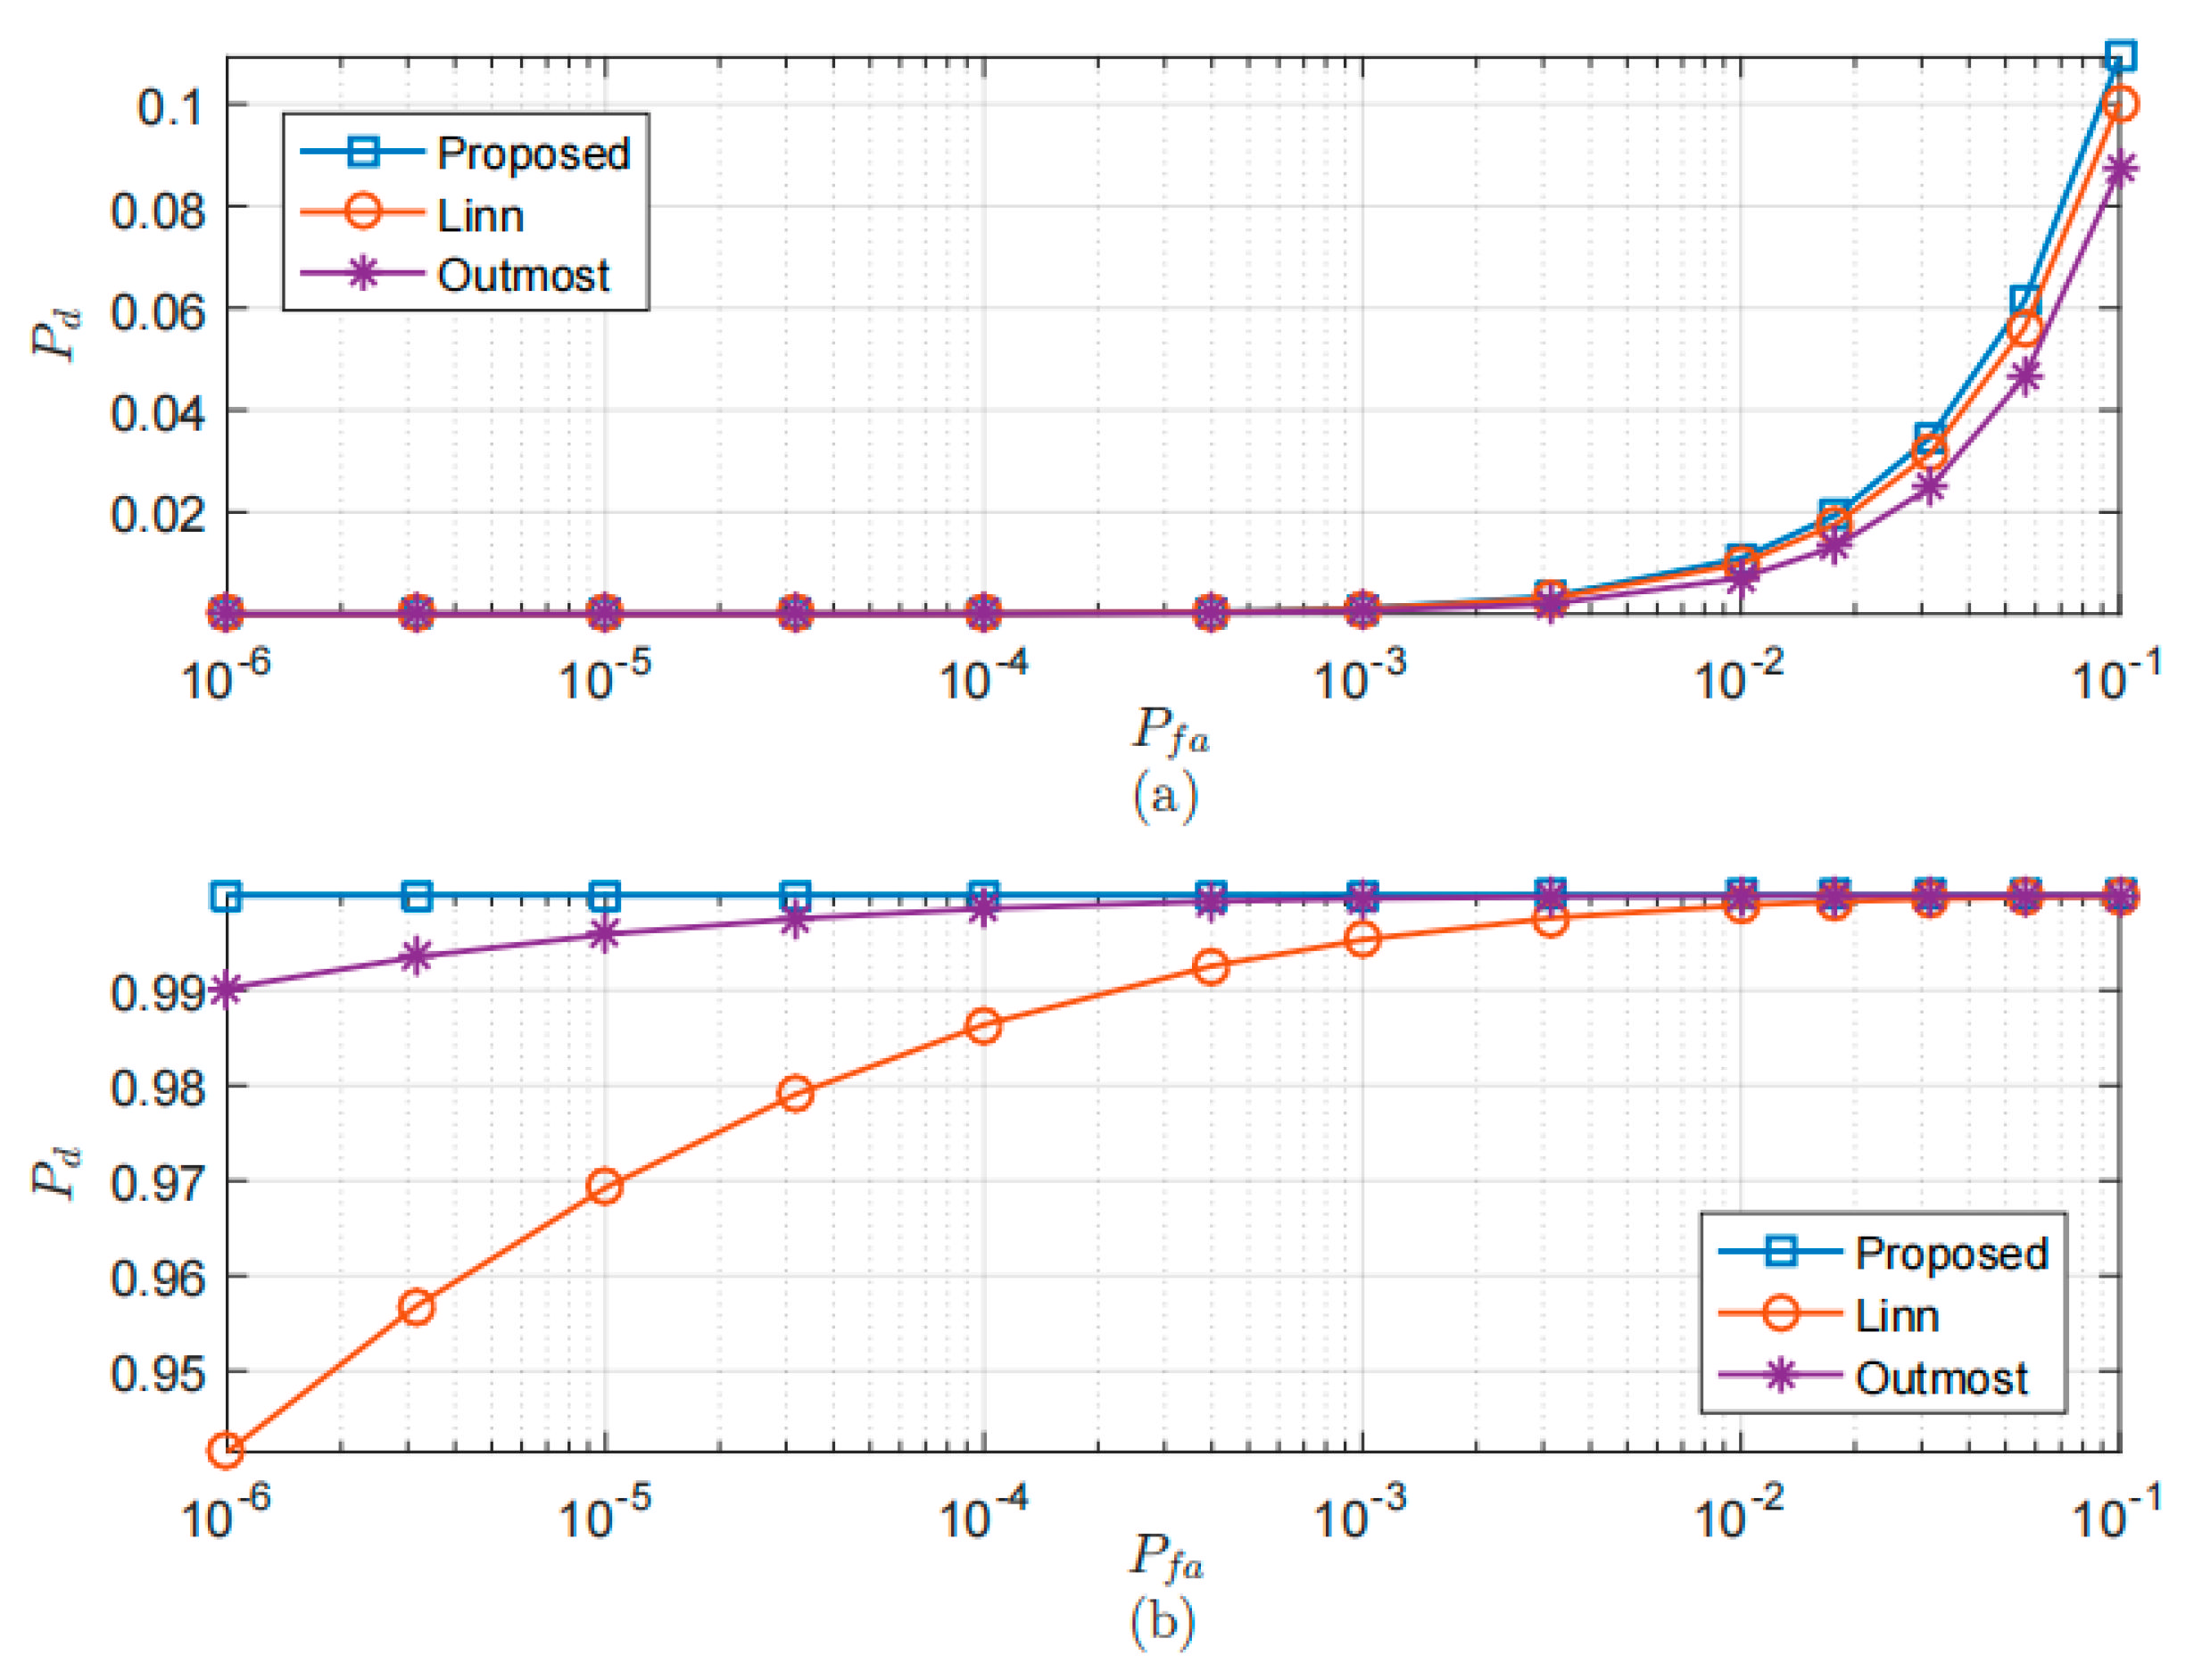
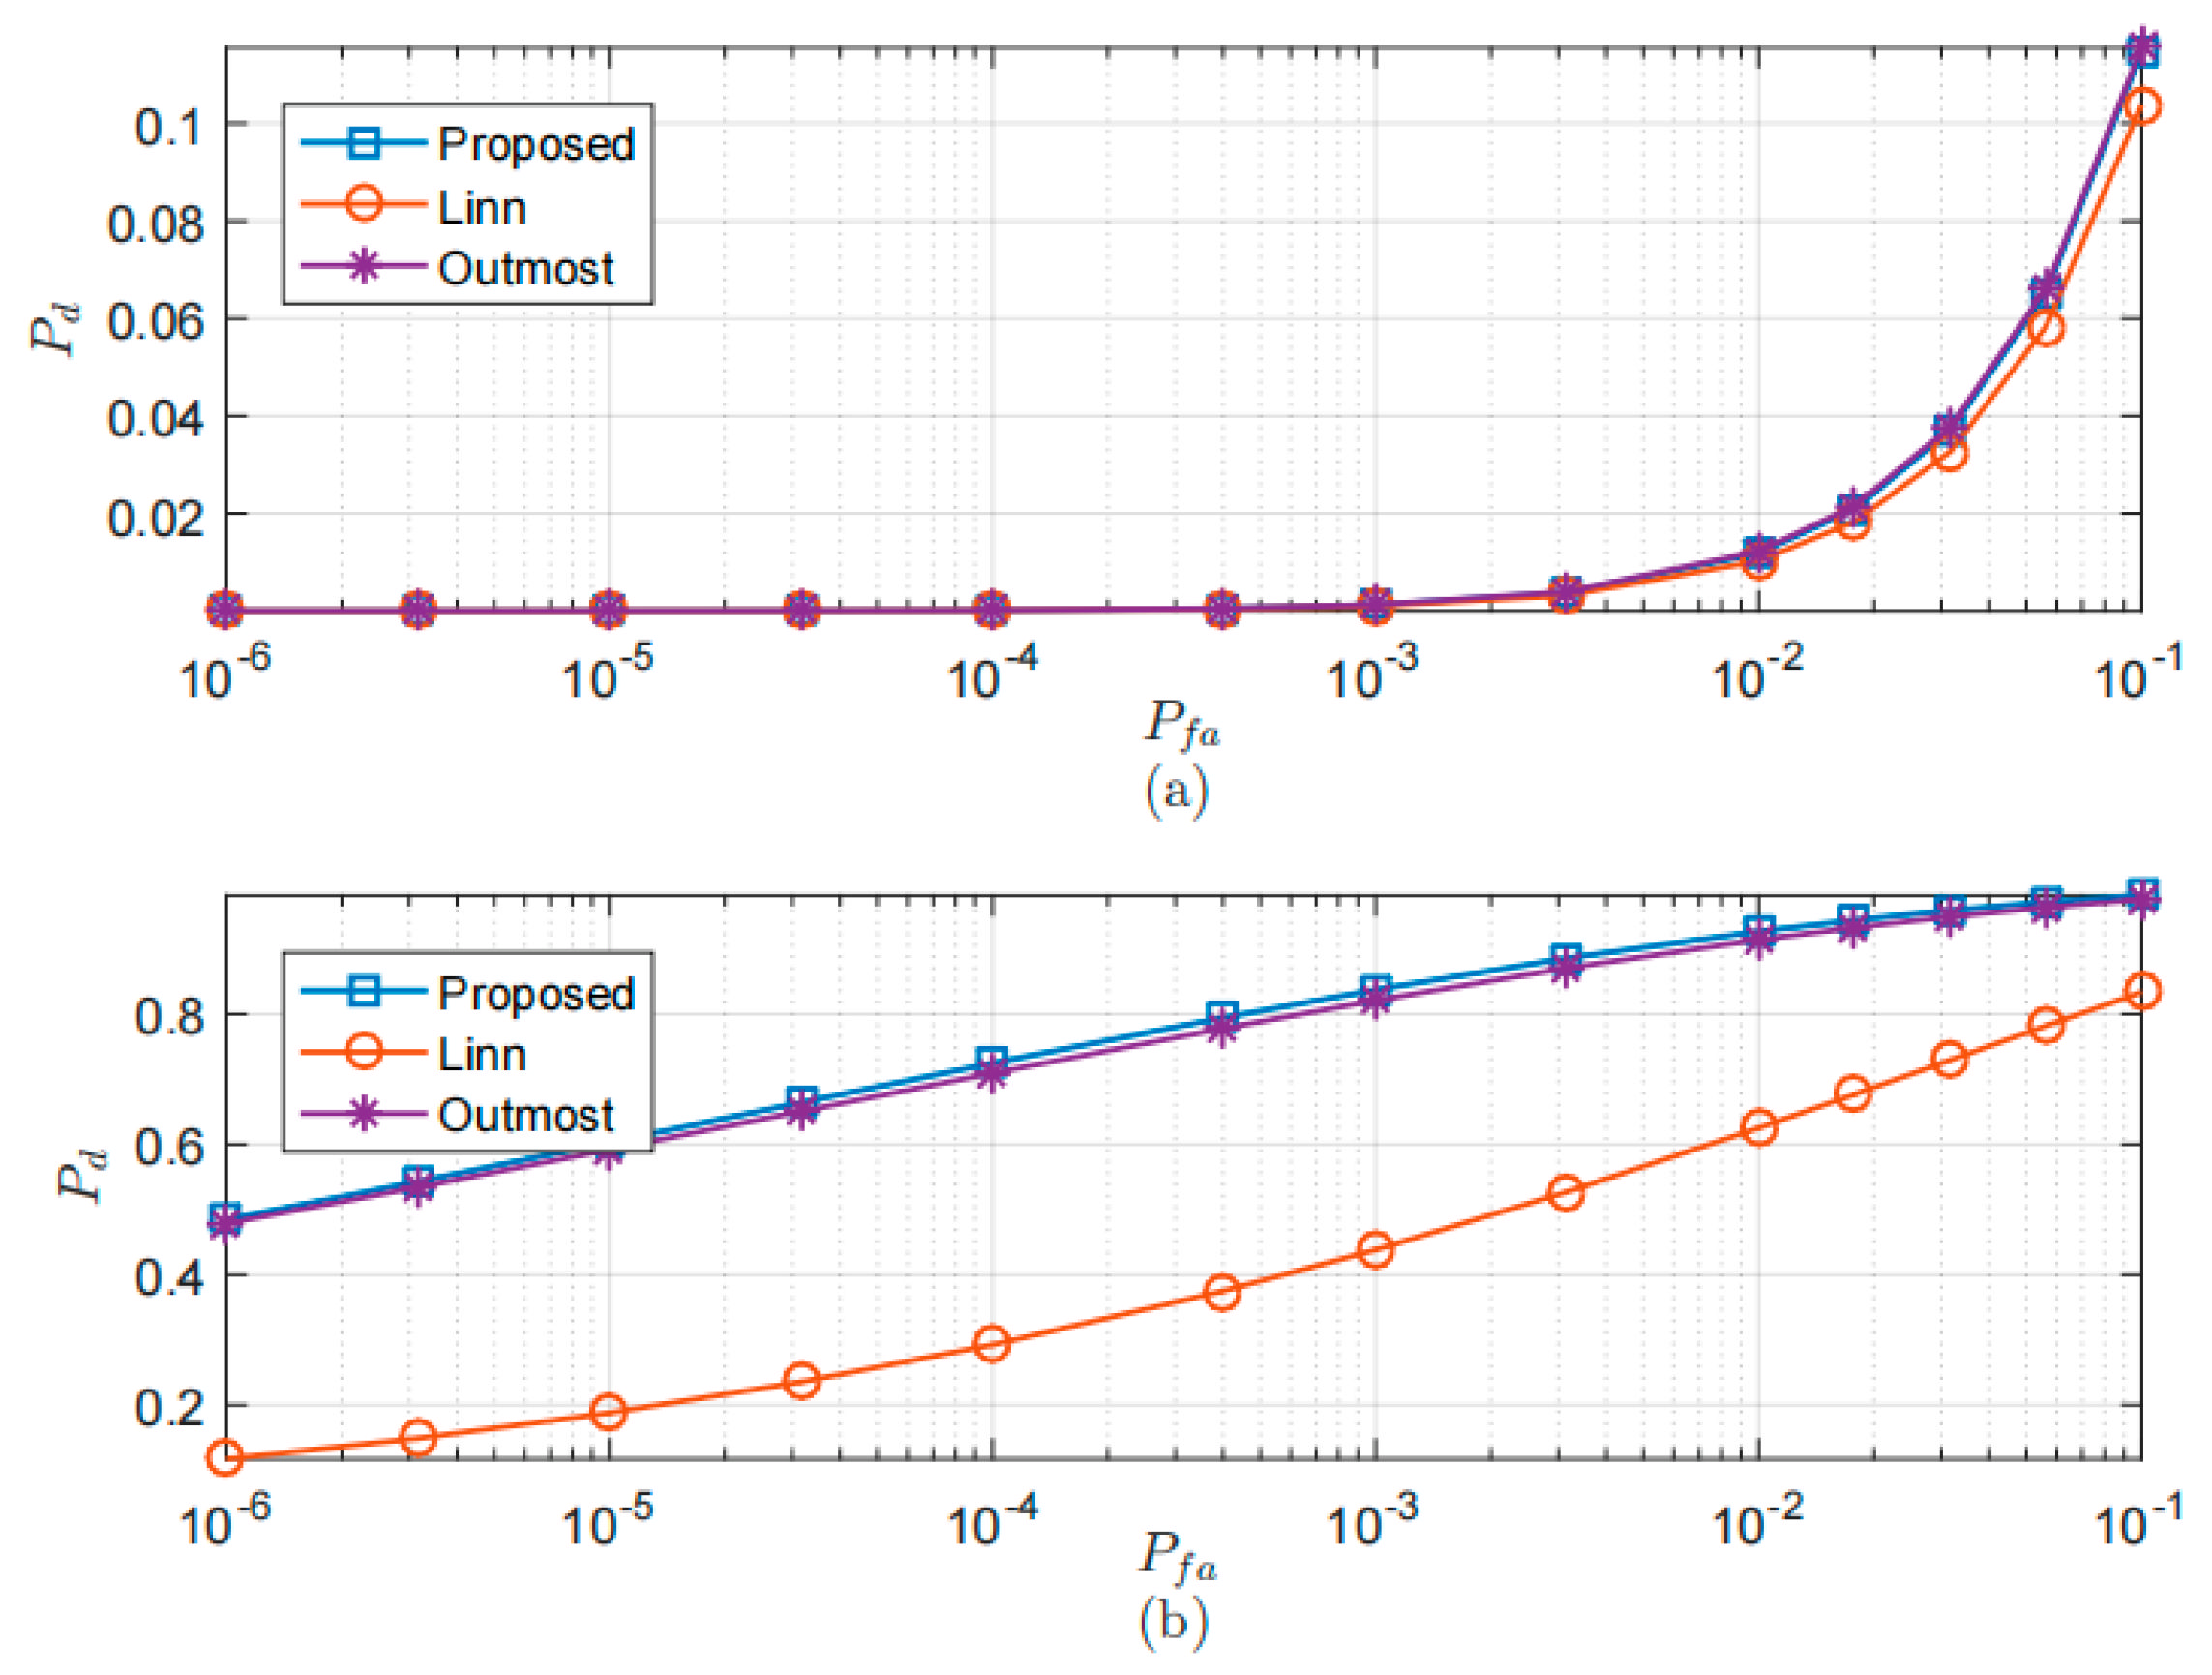
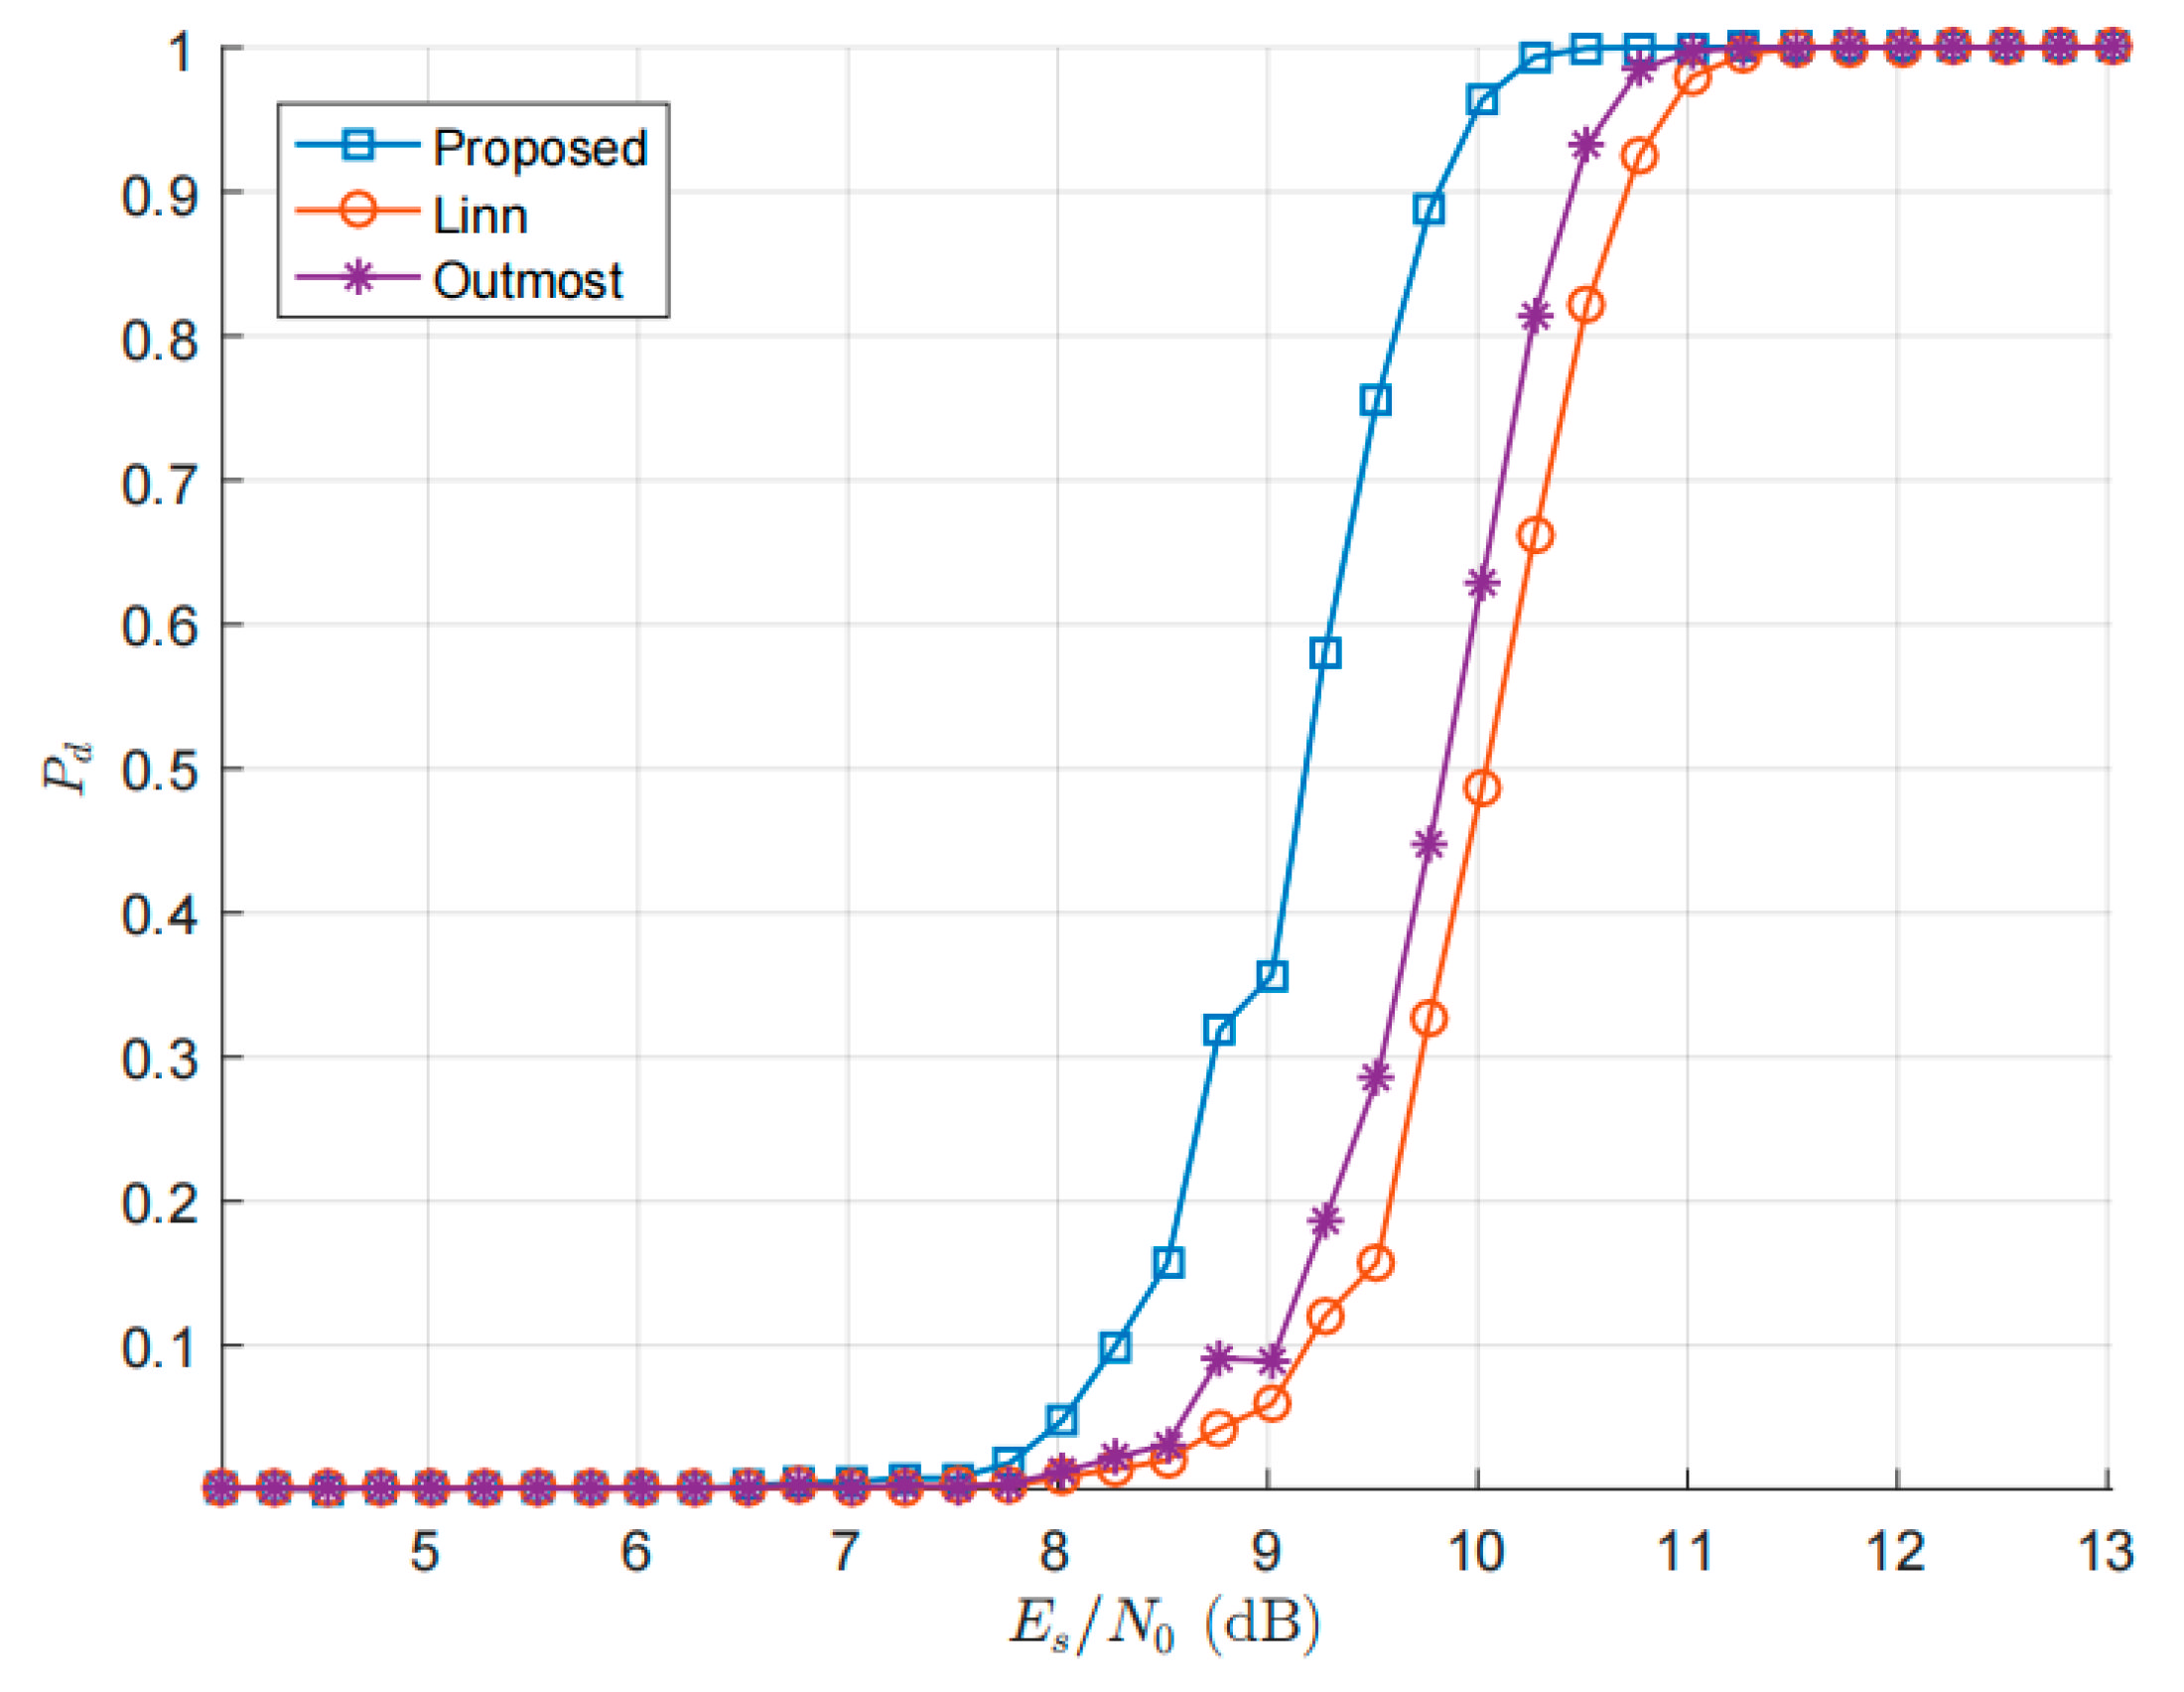
5.2. Lock Detection Probability
6. Conclusions
Author Contributions
Funding
Conflicts of Interest
References
- Savvopoulos, P.; Antonakopoulos, T. A new performance metric for M-APSK receivers. AEUE-Int. J. Electron. Commun. 2014, 68, 1136–1144. [Google Scholar] [CrossRef]
- Liu, J.; Dan, L.; Yang, P.; Xiao, L.; Yu, F.; Xiao, Y. High-rate-APSK-aided differential spatial modulation: Design method and performance analysis. IEEE Commun. Lett. 2017, 21, 168–171. [Google Scholar] [CrossRef]
- Shen, Y.; Shi, X.; Zhao, S.; Wang, Y. An Improved Phase Deviation Discriminator for Carrier Synchronization of APSK Signal in Satellite-to-Ground Communication Systems. Electronics 2022, 11, 1472. [Google Scholar] [CrossRef]
- Ayanda, D.; Akuon, P.; Abdulsalam, K.A.; Bolaji, A. Performance characterization of 64-APSK mapping schemes for uncoded space-time labeling diversity in Rician fading channels. In Proceedings of the IEEE Annual Computing and Communication Workshop and Conference, NV, USA, 27–30 January 2021; pp. 393–398. [Google Scholar]
- Robert, S.; Wolfgang, H.G.; Johannes, B.H. Decision-feedback differential detection based on linear prediction for 16DAPSK signals transmitted over flat Ricean fading channels. IEEE Trans. Commun. 2001, 49, 1339–1342. [Google Scholar]
- Zhu, C.; Li, X.; Shi, L.; Liu, Y.; Yao, B. Influence of time-varying plasma sheath on the lock condition of phase-locked loop for TT&C carrier tracking system. IEEE Trans. Plasma Sci. 2017, 45, 636–643. [Google Scholar]
- Mileant, A.; Hinedi, S. On the effects of phase jitter on QPSK lock detection. IEEE Trans. Commun. 2002, 41, 1043–1046. [Google Scholar] [CrossRef]
- Mileant, A.; Hin Ed, I.S. Lock detection in Costas loops. IEEE Trans. Commun. 1992, 40, 480–483. [Google Scholar] [CrossRef]
- Wenjun, F.; Jingshan, J.; Shuanrong, W.; Luan, L. Design and Performance Evaluation of Carrier Lock Detection in Digital QPSK Receiver. In Proceedings of the IEEE International Conference on Communications, Istanbul, Turkey, 11–15 June 2006; pp. 2941–2945. [Google Scholar]
- Lee, K.H.; Jung, S.C.; Choi, H.J. A novel digital lock detector for QPSK receiver. IEEE Trans. Commun. 2002, 46, 750–753. [Google Scholar]
- Kyungha, Y.; Seungchul, J.; Yonghoon, K.; Jin, C.H. A new lock detection algorithm for QPSK digital demodulator. In Proceedings of the IEEE International Symposium on Personal, Indoor & Mobile Radio Communications, Taipei, Taiwan, 15–18 October 1996; pp. 848–852. [Google Scholar]
- Zhu, Y.; Zhan, Y.; Xu, G.; Han, M. A general carrier lock detection algorithm for MPSK signal. In Proceedings of the International Conference on Wireless Communication, Networking and Mobile Computing, Beijing, China, 15–17 August 2010; pp. 1–4. [Google Scholar]
- Ramakrishnan, B. Maximum-likelihood based lock detectors for M-PSK carrier phase tracking loops. Electron. Lett. 2012, 48, 242–244. [Google Scholar] [CrossRef]
- Wang, H.; Yan, C.; Kuang, J.; Wu, N.; Fei, Z.; Zheng, M. NDA SNR estimation with phase lock detector for digital QPSK receivers. In Proceedings of the IEEE Vehicular Technology Conference, Taipei, Taiwan, 16–17 May 2010; pp. 1–5. [Google Scholar]
- Linn, Y. Efficient M-PSK lock detectors and SNR estimators. In Proceedings of the IEEE International Conference on Electrical & Computer Engineering, Toronto, ON, Canada, 4–7 May 2014; pp. 1–8. [Google Scholar]
- Linn, Y. Simple and Exact Closed-Form Expressions for the Expectation of the Linn-Peleg M-PSK Lock Detector. In Proceedings of the IEEE Pacific Rim Conference on Communications, Victoria, BC, Canada, 22–24 August 2007; pp. 102–104. [Google Scholar]
- Linn, Y.; Peleg, N. A Family of Self-Normalizing Carrier Lock Detectors and ES/N0 Estimators for M-PSK and Other Phase Modulation Schemes. IEEE Trans. Wirel. Commun. 2004, 3, 1659–1668. [Google Scholar] [CrossRef]
- Linn, Y.; Mathiopoulos, T. A new family of NDA carrier phase detectors for coherent M-PSK receivers. In Proceedings of the IEEE International Conference on Communications, Circuits & Systems & West Sino Expositions, Chengdu, China, 29 June–1 July 2002; pp. 134–141. [Google Scholar]
- Linn, Y. Robust M-PSK phase detectors for carrier synchronization PLLs in coherent receivers: Theory and simulations. IEEE Trans. Commun. 2009, 57, 1794–1805. [Google Scholar] [CrossRef]
- Proakis, J.G. Digital Communications, 5th ed.; McGraw-Hill: New York, NY, USA, 2000; pp. 72–74. [Google Scholar]
- Lathi, B.P. Modern Digital and Analog Communication Systems, 3rd ed.; Oxford University Press: Oxford, UK, 1998. [Google Scholar]


| Parameters | 16APSK | 32APSK |
|---|---|---|
| 2 | 3 | |
| [4,12] | [4,12,16] | |
| [4,12] | [4,12,16] | |
| [1.41,3] | [1.41,3,5] | |
| 2.21 | [2.21,4] | |
| [0.18,0.82] | [0.06,0.25,0.69] | |
| (sps) | 1000 | 1000 |
| (Hz) | 16,000 | 16,000 |
| Roll-off factor | 0.25 | 0.25 |
| (dB) | 0~30 | 0~30 |
| Simulation time(s) | 0.0639 | 0.0639 |
Disclaimer/Publisher’s Note: The statements, opinions and data contained in all publications are solely those of the individual author(s) and contributor(s) and not of MDPI and/or the editor(s). MDPI and/or the editor(s) disclaim responsibility for any injury to people or property resulting from any ideas, methods, instructions or products referred to in the content. |
© 2022 by the authors. Licensee MDPI, Basel, Switzerland. This article is an open access article distributed under the terms and conditions of the Creative Commons Attribution (CC BY) license (https://creativecommons.org/licenses/by/4.0/).
Share and Cite
Li, Y.; Shi, X.; Zhan, J.; Wang, Y. A Carrier Synchronization Lock Detector Based on Weighted Detection Statistics for APSK Signals. Electronics 2023, 12, 119. https://doi.org/10.3390/electronics12010119
Li Y, Shi X, Zhan J, Wang Y. A Carrier Synchronization Lock Detector Based on Weighted Detection Statistics for APSK Signals. Electronics. 2023; 12(1):119. https://doi.org/10.3390/electronics12010119
Chicago/Turabian StyleLi, Yaoyao, Xuesen Shi, Jie Zhan, and Yongqing Wang. 2023. "A Carrier Synchronization Lock Detector Based on Weighted Detection Statistics for APSK Signals" Electronics 12, no. 1: 119. https://doi.org/10.3390/electronics12010119
APA StyleLi, Y., Shi, X., Zhan, J., & Wang, Y. (2023). A Carrier Synchronization Lock Detector Based on Weighted Detection Statistics for APSK Signals. Electronics, 12(1), 119. https://doi.org/10.3390/electronics12010119