Abstract
Education 4.0 imitates Industry 4.0 in many aspects such as technology, customs, challenges, and benefits. The remarkable advancement in embryonic technologies, including IoT (Internet of Things), Fog Computing, Cloud Computing, and Augmented and Virtual Reality (AR/VR), polishes every dimension of Industry 4.0. The constructive impacts of Industry 4.0 are also replicated in Education 4.0. Real-time assessment, irregularity detection, and alert generation are some of the leading necessities of Education 4.0. Conspicuously, this study proposes a reliable assessment, irregularity detection, and alert generation framework for Education 4.0. The proposed framework correspondingly addresses the comparable issues of Industry 4.0. The proposed study (1) recommends the use of IoT, Fog, and Cloud Computing, i.e., IFC technological integration for the implementation of Education 4.0. Subsequently, (2) the Symbolic Aggregation Approximation (SAX), Kalman Filter, and Learning Bayesian Network (LBN) are deployed for data pre-processing and classification. Further, (3) the assessment, irregularity detection, and alert generation are accomplished over SoTL (the set of threshold limits) and the Multi-Layered Bi-Directional Long Short-Term Memory (M-Bi-LSTM)-based predictive model. To substantiate the proposed framework, experimental simulations are implemented. The experimental outcomes substantiate the better performance of the proposed framework, in contrast to the other contemporary technologies deployed for the enactment of Education 4.0.
1. Introduction
The evolution of the education system is a gradual process. Each revolution in education takes decades to implement. Each education revolution has its own importance on the basis of advancements in technology; the availability of resources; geographical challenges; and other implementation and execution challenges [1]. Some developed countries are moving towards Education 4.0. On the other hand, some developing nations are still stuck on Education 1.0. The hybridization of the educational revolution is very common in most nations because in some rural areas of a county Education 1.0 is executed, whereas some urban areas are moving towards Education 3.0 or Education 4.0. The revolution in the educational industry is mile-stoned as Education 1.0, Education 2.0, and Education 3.0, and the present and near-future are of Education 4.0. The different aspects of the educational revolution under these milestones are illustrated in Table 1 [2,3,4].

Table 1.
The revolution in education from Education 1.0 to Education 4.0.
Education 4.0 is a new dimension of education. Emerging technologies, including C-IoT (Cognitive-Internet of Things), ML (Machine Learning), AI (Artificial Intelligence), Fog and Cloud Computing, Augmented Reality (AR), and Virtual Reality (VR), are providing multidimensional support for the implementation of Education 4.0 [5]. Success traces of Education 4.0 can easily be tracked in numerous Education 4.0 scenarios, including dynamic higher education ecosystems [6], Higher Education 4.0 [7], Industry 4.0 schools [8], Engineering Education 4.0 [9], Digital English [10], and courseware [11,12]. Real-time assessment is one of the key challenges in the implementation of Education 4.0. Real-time assessment of every stakeholder, including students, teachers, and administrative staff, is of paramount importance for Education 4.0 [13]. Achieving accuracy in the assessment process of an educational institution directly depends upon achieving accuracy during data acquisition, data classification, and integration. The main motivation behind this study is to explore the most suitable technological integration for the implementation of Education 4.0 and to propose a suitable framework for assessment and irregularity detection for Education 4.0. The proposed study contributes to Education 4.0 in many ways; some of the main contributions are listed as:
- The proposed study explores all existing emerging technologies used in Education 4.0 and explores the most suitable technological integration for assessment and irregularity detection.
- The proposed study evaluates the accuracy of proposed technological integration for assessment and irregularity detection.
- The proposed study explores the suitable methods for data acquisition, data classification, and integration for Education 4.0.
- The proposed study suggests a suitable framework for assessment and irregularity detection under Education 4.0 environment.
- The proposed study also evaluates the accuracy of the suggested framework for assessment and irregularity detection.
The proposed study recommends the involvement of sensor-based data acquisition methods (IoT), AI-based data classification and integration methods over fog nodes, AI-based assessment, and irregularity detection methods over the cloud nodes for the implementation of the Education 4.0 environment. In brief IFC (IoT, Fog, and Cloud Computing), technological integration is recommended for the implementation of Education 4.0. Further C-IoT-based assessment and irregularity detection methods are also recommended in the study [14]. The remaining paper is composed of four main sections. Section 2 elaborates on the different aspects of the proposed model. Section 3 elaborates on the material and methods used for the study. Consequently, Section 4 precisely unveils the results of various experimental studies executed during the research. Section 5 concludes the research.
2. Proposed Framework
The layered outline of the proposed framework for the real-time assessment and irregularity detection of the stakeholders is illustrated in Figure 1. The proposed framework illustrates the conceptual model of an IoT-enabled campus under Education 4.0. IFC technology is the spine of the proposed model. IFC technological integration is proposed under this model for assessment and irregularity detection. IFC technological integration is a robust technology that is showing its remarkable performance in all walks of life, including security [15], health care [16], industry [17], agriculture [18], supply-chain-management [19], and many more. All three technologies, i.e., IoT, Fog, and Cloud, constitute the following three layers of the proposed framework:
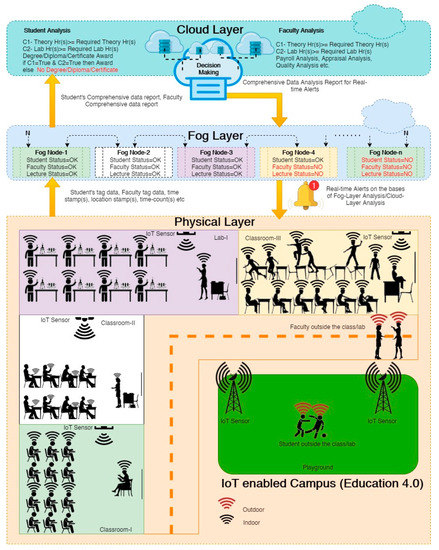
Figure 1.
The proposed layered architecture for assessment and irregularity detection for the ambient education environment under Education 4.0.
- The Physical Layer or IoT Layer.
- The Fog Layer.
- The Cloud Layer.
The subsequent subsections provide a detailed illustration of each layer, along with the construction, implementation scenario, significance, outputs, etc. All 3 layers are committed to the execution of a predefined task to fulfill the aims of the proposed framework. Firstly, the physical layer or IoT Layer constitutes numerous physical devices, including mobile phones, smart watches, RFID embedded ID cards, sensors, video surveillance cameras, raspberry Pi, actuators, and other IoT-enabled devices for real-time data acquisition. The placement of IoT devices is illustrated under the physical layer subsection of Figure 1. Here, the placement of IoT devices and sensors is demonstrated in the dynamic environment of classrooms, laboratories, and playgrounds. The extracted data from the IoT Layer is pre-processed with the local fog nodes on the Fog Layer. The Fog Layer is responsible for all data pre-processing activities, including classification, filtering, and abstraction [20]. In Figure 1, different fog nodes are deployed to illustrate the working of the Fog Layer. Here, each fog node is filtering the status of students, faculty, and lecture on the basis of students’ tag data, faculty tag data, time stamp(s), location stamp(s), etc. The classified data are further filtered and abstracted over the local fog nodes using information mining. The filtered and abstracted information over the local fog nodes is further disseminated to the cloud layer for analysis and decision making. Numerous data analysis algorithms are executed over the cloud layer for decision-making and irregularity detection. Based on Students’ comprehensive data reports and faculties’ comprehensive data reports, the comprehensive data analysis reports for real-time alerts and detailed analysis reports for students and faculties are demonstrated under the cloud layer in Figure 1. All the 3 layers are discussed in detail under the following subsections.
2.1. Physical Layer or IoT Layer
Numerous sensors, actuators, and IoT-enabled devices constitute the Physical or IoT Layer. All the physical devices are broadly characterized under two main categories: moveable and immoveable. All the wearable devices, including smart-watches and RFID Embedded ID cards, come under moveable devices, whereas the stationery devices, including video surveillance cameras, raspberry pi, actuators, and some other IoT-enabled stationery devices, are categorized as immoveable devices [21]. The detailed elaboration of moveable and immoveable devices is mentioned in Table 2.
Table 2.
Moveable and immoveable devices are used in an Education 4.0 environment. C—Communication; F—File Transfer; S—Sensing, A—Actuation, FD—Fitness Data, AD—Activity Data, ED—Environment Data, √—Applicable, and ×—Not Applicable.
Various devices deployed at the physical layer and their uses are listed below:
- The mobile phones of every stakeholder that are registered with the institution database are used to check the real-time location (geographical time stamp) of the stakeholders.
- The smart-watch and fitness bands are deployed to check the health-related data of the stakeholders.
- RFID Embedded ID Cards are used to check the real-time geographical location of the stakeholders [22].
- Courseware is a specially designed (institution-specific) hardware/software that contains all the digital information about various courses running in the institution. It is used to check the various aspects of courses and the other assessment and accreditation activities related to courses [11].
- Thermistors, resistance temperature detectors, and thermocouples are used to acquire temperature data from various places, including classrooms, labs, offices, libraries, and workshops [23].
- A psychrometer and hair tension moisture sensors are deployed to check the moisture and humidity data from various places [24].
- Photoresistor and Photodiode are used to collect ambient light intensity data from various places [25].
- The Hydrophone and Geophone are deployed to monitor the level of noise [26].
- Hydrostatic pressure sensors and optical sensors are used to check the pressure levels in labs [27].
- The Doppler radar and occupancy sensors are deployed to observe the motion of stakeholders in classrooms, labs, offices, corridors, passages, etc. [28].
- The active-ultrasonic motion sensor, passive-infrared motion sensor, active-radar sensor, and passive-infrared sensor (PIR) are used as motion sensors with surveillance cameras [29].
- Gyroscope IoT sensors, including accelerometer and heading indicator sensors, are deployed at various sports locations to check the motion of stakeholder with respect to the stationary objects [30].
- Chemical IoT sensors, including the Electrochemical Breathalyzer and Electronic Nose, are deployed to check the air and water purity [31].
- Image IoT sensors such as active-pixel sensors and charge-coupled devices, are used, along with surveillance cameras for image monitoring [32].
Along with all these IoT sensors, linear actuators, motors, relays, and solenoids are also deployed for various other purposes [33].
The detailed statistics of various sensors and actuators deployed in the ambient environment of education are illustrated in Table 3.
Table 3.
The sensors for an ambient education environment under Education 4.0. C—Communication; F—File Transfer; S—Sensing, A—Actuation, FD—Fitness Data, AD—Activity Data, ED—Environment Data, √—Applicable, and ×—Not Applicable.
The physical layer of the proposed framework used lots of IoT devices in the real-time scenario. Further, the physical layer is directly associated with the stakeholders, including students, teachers, administrative staff, and policymakers. The ethical perspective of this layer, as well as the proposed framework, is also a matter of concern. The IoT devices listed under this section are already tested for human safety and privacy. In the proposed framework IoT devices, sensors and actuators are proposed for installation in various places in an ambient educational environment. The privacy of all the stakeholders need to be monitored at the time of IoT devices’ placement in the institution. The physical layer is deployed in this framework for the collection of real-time data. The public and private reporting for assessment analysis, accreditation, and alert generation ensures the privacy of the personal information of the stakeholders. Moreover, it is also expected to overcome the academic and social loafing present under the current educational scenario after the implementation of the proposed system. As a whole, the proposed system is ethically suitable for all the stakeholders and the society associated with the educational domain.
2.2. Fog Layer
The extracted data from the physical layer are pre-processed over local fog nodes. Data pre-processing, data filtering, and data classification are the major activities executed under fog nodes [34]. Symbolic Aggregation Approximation and the Conditional Random Field Framework are deployed at the initial level of data pre-processing [14]. Further, the Maximum Likelihood (ML) and Maximum A Posterior (MAP) are used to accomplish the data pre-processing phase. The Kalman Filter, including the E-step and M-step, is deployed for data filtering [35]. Lastly, the filtered data are classified under various sets. The Stakeholder Fitness Dataset (SFD), Campus Environment Dataset (CED), Stakeholder Activity Dataset (SAD), and Course Authenticity Dataset (CAD) are the main datasets deployed for assessment and accreditation. The detailed construction of the Fog Layer is illustrated in Figure 2. A brief description of these datasets is given below:
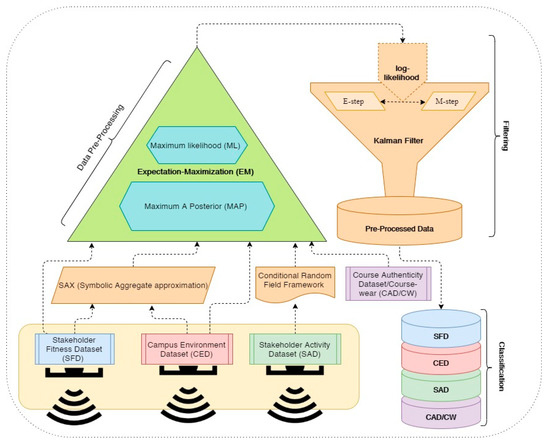
Figure 2.
The data pre-processing, filtering, and classification over the fog node.
- The Stakeholder Fitness Dataset (SFD) constitutes the past history and real-time fitness status of every stakeholder.
- The Campus Environment Dataset (CED) covers various factors of the campus environment, including, temperature, humidity, air pressure, and noise.
- The Stakeholder Activity Dataset (SAD) includes the location stamp, timestamp, and biometric timestamp.
- The Course Authenticity Dataset/Course-Ware (CAD/CW) comprises all the information with respect to courses running in the institutions, including the name of the course, the course code, the student enrolled under the course, the duration of the course, and the assessment and accreditation constitute. The Course Authenticity Dataset (CAD) is called the Course-Ware (CW). This dataset is static, and it depends on the number and types of courses and their curriculum, examination, and evaluation system. All these mentioned items are subject-specific, but the assessment and accreditation methodologies used in this framework are similar for all the disciplines and subjects. Further, the nature of the subject will not affect the assessment and accreditation process proposed in this framework.
All these pre-processed, filtered, and classified datasets are further used for the assessment and accreditation process. The subsequent section illustrates the assessment, reporting, and irregularity detection process executed over the cloud layer.
2.3. Cloud Layer
Real-time assessment, reporting, and irregularity detection have been executed over the cloud node. For assessment, the SoTL (Set of Threshold Limit) is deployed to predict major irregularities in each dataset in real-time. Table 4 illustrates the SoTL table for the two variables associated with the SFD dataset.
Table 4.
The SoTL table for body temperature and heartbeat level under the Stakeholder Fitness Dataset (SFD). Indicates an invulnerable state and indicates a vulnerable state.
Definition 1.
The Set of Threshold Limits (SoTL) are the sets of all threshold values of various variables, including the minimum required values, maximum acceptable values, etc., e.g., under SFD, the minimum and maximum heartbeat level, the oxygen saturation level, the body temperature, etc., are included.
As mentioned in Table 4, various other variables and datasets have a separate SoTL. On the basis of a respective SoTL value assessment, an irregularity detection and alarm generation have been executed. RNN, CNN, and M-Bi-LSTM are deployed over the cloud node for executing all these activities [14]. Figure 3 illustrates the proposed integration of these algorithms for various activities. The subsequent subsections illustrate the various activities executed on the cloud layer.
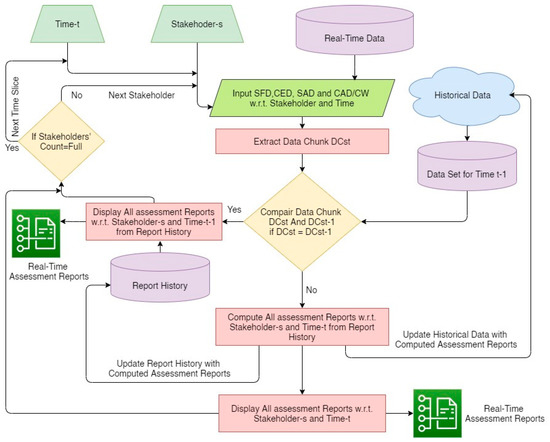
Figure 3.
Real-time assessment under Education 4.0.
2.3.1. Assessment
The classified data from the Fog Layer are evaluated on the cloud layer on the basis of their respective SoTL dataset. Under assessment, various dataset integrations are used. e.g., the courseware dataset is integrated with the student activity dataset for academic assessment. The student fitness dataset is integrated with the campus environment dataset for the real-time assessment of stakeholders’ fitness, etc. Dataset integration from various resources also boosts the quality of assessment. The following are the main assessment activities that are proposed during this study:
- The Stakeholders’ Fitness Assessment has been executed based on various fitness-related parameters. The HIoT (Healthcare Internet of Things) is deployed for fitness assessment [36]. The Student Fitness Dataset and Campus Environment Datasets are integrated for stakeholders’ fitness assessment. This assessment initiates various fitness-related irregularity detections and corresponding alarms. The Stakeholders’ Fitness Assessment is very useful to take preventive actions to control the spreading of contagious/epidemic/pandemic diseases.
- The Students’ Course Assessment has been executed on the basis of various courseware parameters. The Stakeholders’ Activity Dataset and the Courseware Dataset are integrated for the Students’ Course Assessment. The corresponding alarm and irregularity detection is initiated after accomplishing the Students’ Course Assessment. This assessment helps students to complete their theory and lab hours, course credits, etc. Regarding early irregularities, detection will decrease the student dropout rate, and consequently the result and education quality will also improve. The Students’ Course Assessments have a greater impact on various components, including quality, satisfaction, irregularity detection, etc.
- The Stakeholders’ Working Hours Assessment has been executed on the basis of the Stakeholders’ Activity Parameters. The Stakeholders’ Activity Dataset and the Courseware Dataset are integrated for the Stakeholders’ Working House Assessment. The real-time working hours assessment has a greater impact on employee retention and in-time course completion. The real-time working hours assessment will also eradicate human errors to calculate stakeholders’ working hours.
- The Stakeholders’ (Excluding Students) Payroll Assessment has been executed on the basis of the Stakeholders’ Activity Parameters. Students are excluded in this assessment as they are not the part of payroll system. The Stakeholders’ Payroll Assessment will be executed after the Stakeholders’ Working Hours Assessment. The Stakeholders’ Working Hours Assessment is associated with their payroll history, including their salary components and allowances, etc., for the Stakeholders’ Payroll Assessment.
- The Stakeholders’ (Excluding Students) Appraisal Assessment has been executed on the basis of the Stakeholders’ Activity Parameters. The working hours, payroll, quality, performance, feedback, etc., are the major components that affect the Stakeholder’s Appraisal Assessment. The proposed Appraisal Assessment is a transparent system and has zero human errors and human biasness.
- The Stakeholders’ Quality Assessment has been executed on the basis of the Stakeholders’ Activity Parameters. Quality is a component that depends on two major factors: the inputs (efforts) made by stakeholders in terms of working hours and the outputs in terms of the results. The Bi-M-LSTM-based predictive algorithm is used to predict the outputs or results of various stakeholders [14]. On the basis of the predictive results and actual results, the quality will be calculated.
- The Stakeholders’ Performance Assessment is an administrative component of the Stakeholders’ Activity Dataset, and the Campus Environment Dataset. The Stakeholders’ Fitness Dataset, and the courseware dataset are integrated for the Stakeholders’ Performance Assessment. Based on stakeholders’ inputs (efforts), the predictive algorithm is used to predict the performance assessment of individual stakeholders. The performance of different stakeholders has different impacts, e.g., the performance assessment of students will impact on their results and academic performance, whereas the performance of faculty and non-teaching staff members will impact on their salary and appraisal, etc.
The proposed assessment process; the various irregularities generated in respect of assessment; the alarm generation; and, finally, the process of accreditation are illustrated in Figure 4. Further, Figure 3 illustrates the proposed assessment process. Various predictive algorithms are used for the assessment process. All the activities discussed so far under this section and subsequently discussed are interrelated and depend on one another. The previous activity in this list either initiates the next activity or has some impact on the next activity. The consequent subsection explores the irregularity detection.
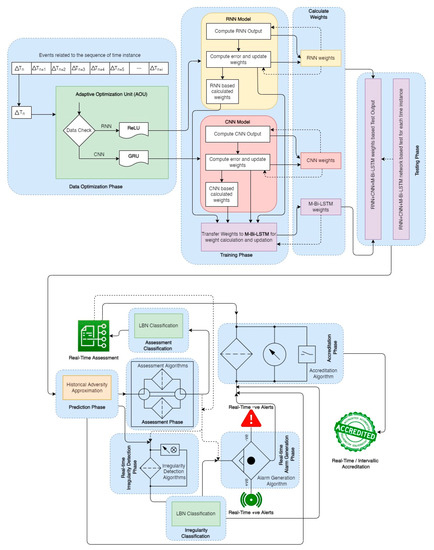
Figure 4.
The proposed model for assessment, irregularity detection, and alarm generation under Education 4.0.
2.3.2. Irregularity Detection
After assessment, it is possible to identify various types of irregularities in the ambient educational environment [37]. Various types of assessments have positive, as well as negative, outcomes for stakeholders. The positive outcomes or assessments are always in the favor of stakeholders, whereas the negative outcomes or assessments are due to some kind of irregularity in the system or stakeholders’ activities. For example, under the Students’ Course Assessment, if the requisite number of working hours are not completed by a particular student. Then it shows that the irregularity in respect of a particular student. The corresponding corrective actions are required for improvement after detection of irregularity. On the other hand, if a group of students or an entire class are not completing the requisite number of working hours, then in this particular case it may be due to an irregularity on the part of the faculty or administration. All possible irregularities are detected through various irregularity-prediction algorithms. Some of the irregularity-detection algorithms are efficient enough to work independently, whereas some others are integrated with another algorithm to explore the exact irregularity. Figure 5 illustrates the proposed irregularity detection mechanism. Various irregularity-detection algorithms are explored in the the results and discussion section.
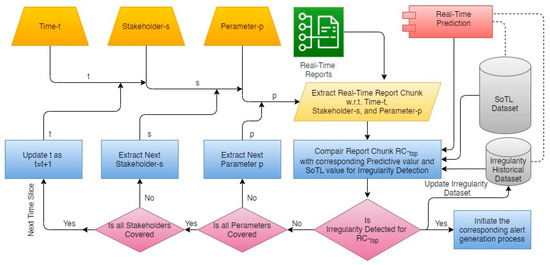
Figure 5.
Real-time irregularity detection under Education 4.0.
2.3.3. Alarm Generation
The positive and negative impacts of the assessment section required proper management [38]. The positive assessment is deployed for motivation, whereas the negative assessment is deployed to alert an individual stakeholder or a group of stakeholders for in-time predictive action. The real-time alarm is very useful to avoid numerous harmful effects of any type of irregularity. In continuation of the example discussed in the previous subsection, i.e., irregularity detection, if a particular student is lagging with regard to his/her course credits then the alarm generation will remind that individual about this irregularity. This alarm will make the individual aware and may help the individual to improve their credits. On the other hand, for group issues, the corresponding alert will be given to the respective faculty member, as well as to the corresponding administrative official for in-time corrective action. The positive assessment will also play a significant role in the improvement of quality. All alerts are based on some predictive analysis. The predictive analysis will help the individual to track their performance based on their current input scenario, as well as on the required inputs on their behalf to achieve their target. Positive motivation, improvement in quality, and performance are some of the hidden aspects of real-time alarm generation that are not quantified but will be observed after the implementation of the proposed system in an ambient educational environment.
3. Materials and Methods
A sequence of steps is deployed for each activity, including data mining, data pre-processing, data filtering, data classification, and prediction. Different suitable techniques/methods are employed for each activity. For data-mining labor, the Symbolic Aggregate Approximation (SXA) [39] and the Conditional Random Feld Framework are employed. Further, the Expectation Maximization (EM) [40], which includes the Maximum A Posterior (MAP) and the Maximum Likelihood (ML), is arrayed for data-preprocessing [41]. The Kalman Filter (E-Step and M-Step) [35] is used for filtering the pre-processed data. All the above-mentioned methods are implemented over the fog nodes. Subsequently, the Learning Bayesian Network (LBN) is used for various classifications in different stages. Consequently, RNN, CNN, and M-Bi-LSTM are used for training and prediction activities, as illustrated in Figure 4. The continuing part of this section discussed the simulation environment, data resources, and proposed procedures for assessment, irregularity detection, and alert generation.
3.1. Simulation Environment and Data Resources
At the initial level, the physical implementation of any framework is unreliable and uneconomical. Therefore, a simulation framework and data resources are deployed to simulate the proposed framework. The proposed simulation environment is inspired by the actual physical environment. The major components of the simulation environment and data resources are listed below in Table 5:
Table 5.
The simulation environment and the data resources.
3.2. Proposed Procedures
The earlier part of this section discussed various tools and technologies used to execute different aspects of the proposed model. The subsequent section covers the two major components of the proposed model: assessment and irregularity detection. Bi-LSTM is the core component of the proposed procedure. Bi-LSTM is an advantageous model that conquers the advantages of LSTM (Long Short-Term Memory) i.e., Storage in Cell Memory and Bi-RNN (Bi-directional Recurrent Networks) [42] i.e., access information from the context before and after (Feedback). Bi-LSTM consists of two main functions: the forward function and the backward function. The following two equations, i.e., Equations (1) and (2), illustrate the forward function, whereas the subsequent two equations, i.e., Equations (3) and (4), illustrate the backward function.
The forward function:
The backward function:
Here, x is the sequential input, a is the network input, h is the hidden unit, t is time, w is the weight, Θ is the activation function, and O is the objective function with unit k.
Classification is another important aspect of the proposed model. Initially, classification is required to classify data at fog nodes. Thereafter, on the cloud node, various alerts and irregularities need classification in real time. The proposed model recommends the use of LBN classification at various levels of data processing. The subsequent subsections under this section elaborate on three major components: assessment, irregularity detection, and alert generation.
3.2.1. Assessment Procedure
The real-time assessment for a time interval ΔT is stored by using a memory buffer. After a time interval ΔT, the previously stored data are compared with the current data chunk. The new assessment report is only generated if some variation is noticed between two data chunks. This classification process saves much computation power and also speeds up the assessment process. Further, the M-Bi-LSTM is deployed to predict the assessment reports. Every new assessment is also recorded under the assessment report history. The assessment report historical data improve the accuracy of prediction. The incorporation of parallel computing makes real-time assessment possible. In an ambient educational environment, the inflow of data is huge. The total processing time consists of data acquisition time, data pre-processing and classification time, and the processing time. Parallel computing is used to eradicate the overall processing time. The complete assessment procedure has already been discussed in previous sections. Algorithm 1 illustrates the proposed real-time assessment process.
| Algorithm 1: To generate the Real-Time Assessment Report |
 |
3.2.2. Irregularity Detection and Alert-Generation Procedure
The continuous assessment highlights many issues in the ambient educational environment in real-time. Real-time irregularity detection improves the robustness of the proposed system. Irregularity is a single activity or a set of sequential or random activities that violate the set rules and values under a specific domain. SoTL is deployed to check irregularities in real-time. The real-time irregularity detection speeds up the corrective decision-making process. In correspondence to every irregularity detection, a real-time alert has been generated for corrective action. All real-time alerts are communicated to all the corresponding stakeholders. The historical data corresponding to all the irregularities are deployed to improve the accuracy of the irregularity prediction. Algorithm 2 illustrates the complete irregularity detection process. In continuation of the irregularity-detection, Algorithm 3 elaborates the real-time alert-generation process.
| Algorithm 2: Irregularity Detection Algorithm |
 |
| Algorithm 3: Alert Generation Algorithm |
 |
4. Performance Evaluation and Results Analysis
This section is dedicated to evaluating the efficiency and reliability of the individual layer and the overall performance of the proposed model. The proposed model comprises mainly three layers; all these layers have specific importance and different natures with regard to data processing. Initially, physical-layer data are acquired from the ambient educational environment from various resources (already discussed under introduction section). Further, the acquired data are pre-processed, filtered, and classified. Finally, the classified data are processed over an M-Bi-LSTM-based model for assessment, irregularity detection, and alert generation. The performance of the proposed model is evaluated based on the following aspects:
- Temporal Delay Efficiency;
- Data Classification Efficiency (LBN Classification);
- Predictive Efficiency (M-Bi-LSTM);
- Overall Reliability.
The subsequent section discusses all these performance parameters in detail.
4.1. Temporal Delay Efficiency
Numerous factors are involved to analyze the temporal delay efficiency, including the delay for data mining ΔTmining, data classification ΔTclassification, data prediction ΔTprediction, and data reporting ΔTreporting [14]. The overall temporal delay efficiency is measured using Equation (5). Figure 6 illustrates the temporal delay efficiency analysis for the proposed system. Initially, a set of 2000 data instances have been deployed to check the delay for an individual component of delay efficiency. Subsequently, an additional 2000 data instances have been added for a detailed analysis. Sequentially, a total of 14,000 data instances have been deployed to analyze the temporal delay. Figure 6 categorically illustrates the temporal delay efficiency analysis. The CAD dataset registered the least average temporal delay of 117 s. On the other hand, the CED dataset took a higher average temporal delay of 157 s. The SAD dataset is also very close to the CED dataset, with a difference of a few milliseconds.
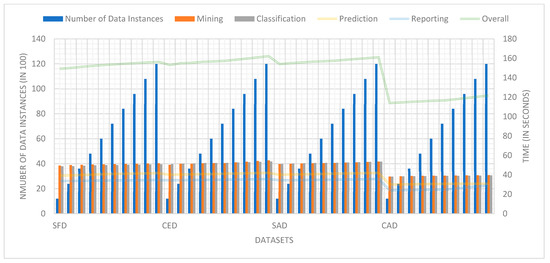
Figure 6.
The delay efficiency of the proposed framework.
4.2. Data Classification Efficiency (LBN Classification)
LBN, BBN (Bayesian Belief Network), and KNN (K-Nearest Neighbor) are deployed to monitor the data classification efficiency of the proposed framework [43]. The complete dataset of 30,000 records is used to evaluate the classification efficiency of the proposed framework. Primarily, a dataset of only 3000 records is used to evaluate the classification efficiency of the model. Further, 3000 additional records are used for the subsequent evaluation cycle. Each classification model in respect to various records is evaluated for Precision, Specificity, and Sensitivity. In comparison with BBN and KNN, the LBN model registered the highest efficiency of 92.15%, 90.94%, and 90.95% for Precision, Specificity, and Sensitivity, respectively. All of the 10 cycles of detailed comparison for data classification efficiency analysis are presented in Table 6.
Table 6.
The classification efficiency analysis (In %): P—Precision; S—Specificity; and Se—Sensitivity.
4.3. Predictive Efficiency (M-Bi-LSTM)
SVM, RNN, LSTM, M-LSTM, and M-Bi-LSTM are employed to check the predictive efficiency of the proposed model [44,45]. Initially, 5000 tasks instances are used to check the predictive efficiency. An additional 5000 tasks instances are used for the next analysis cycle. Under a single analysis cycle, Precision, Specificity, Sensitivity, and F-Measure are separately recorded for each model [46]. A maximum of 40,000 tasks instances are deployed to analyze various models under a single analysis cycle. Figure 7 illustrates the predictive efficiency analysis. A demonstration of all efficiency measures, i.e., Precision, Specificity, Sensitivity, and F-Measure, is carried out separately under Figure 7. To carry out a better analysis, we keep the simulation environment constant for all other factors except the prediction technique. M-Bi-LSTM registered the maximum efficiency under all measures, including 93.36 % (Precision), 93.60% (Specificity), 93.11% (Sensitivity), and 92.90% (F-Measures). M-Bi-LSTM registered the average predictive efficiency of 92.99% under all efficiency measures. On the other hand, SVN registered the least average efficiency of 89.1%. M-LSTM and M-Bi-LSTM are very close with one another, and M-Bi-LSTM shows only 0.30% more efficacy than M-LSTM.
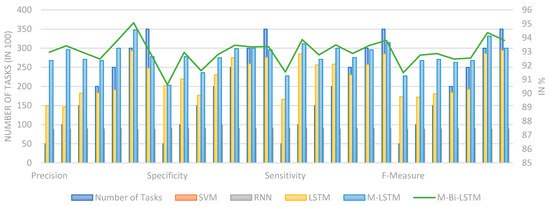
Figure 7.
The prediction efficiency analysis.
4.4. Overall Reliability
The overall reliability of a proposed system is measured in terms of stability. Particularly, Absolute Average Shift (AAS) is employed for the overall reliability analysis over a time instance ΔT. AAS measures lie between 0 and 1, where 0 indicates no reliability and 1 indicates reliability. The values closer to 1 are the reliable one; on the other hand, the values closer to 0 are not reliable. The SVM, RNN, LSTM, M-LSTM, and M-Bi-LSTM models are further deployed to check the reliability of the proposed model. All of these models used to analyze the overall reliability depend upon the number of datasets processed at a time. As we increased the number of datasets, the reliability of these models also increased. The clear visualization of this fact is illustrated by the means of Figure 8. Initially, four datasets are employed to check the stability under the first analysis cycle. A total of 35 datasets is deployed to analyze the stability under 9 different analysis cycles. The proposed M-Bi-LSTM model indicates the maximum stability (with 35 datasets) of 0.96, whereas the minimum stability (with only 4 datasets) is 0.37. Bi-Sectional reliability analysis is also performed for the model [46]. Under Bi-Sectional reliability, the entire analysis cycle is divided into two sections: the lower section and the upper section. The lower section contains the four lower groups (i.e., 4, 8, 12, and 16). The upper section contains the four upper groups (i.e., 24, 28, 32, and 35). The average stability registered by the lower section is 0.49, and the upper section is 0.67. For an in-depth stability analysis, the boundary value analysis with extreme ends has also been performed over the same scenario. Under a boundary value analysis, the lower and higher analysis cycles are evaluated together to make four different analysis cases: Case-I with datasets 4 and 35; Case-II with datasets 8 and 32; Case-III with datasets 12 and 28; and, lastly, Case-IV with datasets 16 and 24. Under these cases, Case-I shows the most extreme variation, whereas Case-IV shows the least variation. M-Bi-LSTM recorded 0.85 stability under the most extreme variation and probably much better stability under the lease variation case, i.e., Case-IV with 0.955 stability value. As a whole, the M-Bi-LSTM performs better than all the other methods under all the reliability analysis cycles. Table 7 illustrates the summary of the stability analysis.
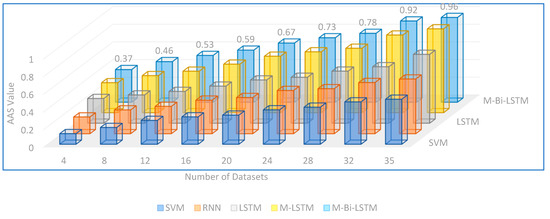
Figure 8.
The overall reliability analysis.
Table 7.
The reliability analysis summary.
5. Conclusions
The present scenario of industry and education has been changed due to the up-gradating and development of technology. We are living in an era of technology, where technology for everything is available. The tremendous success of Industry 4.0 has revolutionized every dimension of life and has emerging technological advantages. One of the major visualized impacts of Industry 4.0 comes in the form of Education 4.0. Automated data acquisition, classification, monitoring, and prediction are some of the key requirements of Education 4.0. Conspicuously, the proposed research recommends the use of IFC technology for the implementation of Education 4.0. The three key components of IFC technology, i.e., IoT, Fog Computing, and Cloud Computing, are deployed for data acquisition, pre-processing and classification, and data prediction and visualization, respectively. Specifically, in this research, (i) various IoT-enabled devices, sensors, and actuators are deployed for real-time data acquisition; (ii) the acquired data have been further pre-processed using SAX and filtered through Kalman Filter; (iii) the filtered data have been classified by LBN classification into various datasets under vulnerable and invulnerable data classes; (iv) the M-Bi-LSTM-based prediction model has been deployed for real-time assessment; (v) real-time irregularity detection has been carried out; and (vi) real-time alert generation has been carried out. To avoid early physical challenges and extravagant implementation costs, a simulation environment has been created to simulate the real-time education 4.0 environment using iFogSim for fog node simulation, Amazon EC2 for cloud layer simulation, and RapicMiner toolkit and LSTMV toolkit for classification and predication, respectively. Based on a comprehensive examination and comprehensive research, it can be safely stated that the proposed model is outperforming the other emerging technologies for real-time monitoring, assessment, irregularity detection, and alert generation under an ambient educational environment for the implementation of Education 4.0. The proposed model has also been analyzed for temporal delay, classification and prediction efficiency, and reliability. The proposed M-Bi-LSTM model for prediction and the LBN for classification outperform all other prediction and classification techniques for the proposed scenario for the implementation of Education 4.0.
Author Contributions
Conceptualization, A.V., R.V. and A.S.; methodology, D.A., A.S. and A.O.M.; validation, A.A., A.O.M. and R.V.; formal analysis, M.A.; investigation, A.V., A.O.M. and M.A.; resources, A.V. and A.A.; data curation, A.V. and D.A.; and writing—original draft preparation, A.V., A.S. and D.A. All authors have read and agreed to the published version of the manuscript.
Funding
Researchers Supporting Project number (TURSP-2020/231), Taif University, Taif, Saudi Arabia.
Acknowledgments
This research was supported by the Taif University Researchers Supporting Project number (TURSP-2020/231), Taif University, Taif, Saudi Arabia.
Conflicts of Interest
The authors declare no conflict of interest.
References
- Bonfield, C.A.; Salter, M.; Longmuir, A.; Benson, M.; Adachi, C. Transformation or evolution?: Education 4.0, teaching and learning in the digital age. High. Educ. Pedagog. 2020, 5, 223–246. [Google Scholar] [CrossRef]
- Butt, R.; Siddiqui, H.; Soomro, R.A.; Asad, M.M. Integration of Industrial Revolution 4.0 and IOTs in academia: A state-of-the-art review on the concept of Education 4.0 in Pakistan. Interact. Technol. Smart Educ. 2020, 17, 337–354. [Google Scholar] [CrossRef]
- Heinrichs, A.; Cesari, F.; Wrighton, K.; Baumann, K.; David, R. Do Web 4.0. Nat. Rev. Mol. Cell. Biol. 2010, 11, 1. [Google Scholar] [PubMed]
- Maria, M.; Shahbodin, F.; Pee, N.C. Malaysian higher education system towards industry 4.0—Current trends overview. AIP Conf. Proc. 2018, 2016, 020081. [Google Scholar] [CrossRef]
- Ciolacu, M.I.; Binder, L.; Svasta, P.; Tache, I.; Stoichescu, D. Education 4.0—Jump to Innovation with IoT in Higher Education. In Proceedings of the 2019 IEEE 25th International Symposium for Design and Technology in Electronic Packaging (SIITME), Cluj-Napoca, Romania, 23–26 October 2019; pp. 135–141. [Google Scholar] [CrossRef]
- Jamaludin, R.; McKAY, E.; Ledger, S. Are we ready for Education 4.0 within ASEAN higher education institutions? Thriving for knowledge, industry and humanity in a dynamic higher education ecosystem? J. Appl. Res. High. Educ. 2020, 12, 1161–1173. [Google Scholar] [CrossRef]
- Miranda, J.; Navarrete, C.; Noguez, J.; Molina-Espinosa, J.M.; Ramírez-Montoya, M.S.; Navarro-Tuch, S.A.; Bustamante-Bello, M.R.; Rosas-Fernández, J.B.; Molina, A. The core components of education 4.0 in higher education: Three case studies in engineering education. Comput. Electr. Eng. 2021, 93, 107278. [Google Scholar] [CrossRef]
- Benešová, A.; Tupa, J. Requirements for Education and Qualification of People in Industry 4.0. Procedia Manuf. 2017, 11, 2195–2202. [Google Scholar] [CrossRef]
- Grodotzki, J.; Ortelt, T.R.; Tekkaya, A.E. Remote and Virtual Labs for Engineering Education 4.0: Achievements of the ELLI project at the TU Dortmund University. Procedia Manuf. 2018, 26, 1349–1360. [Google Scholar] [CrossRef]
- Hariharasudan, A.; Kot, S. A scoping review on Digital English and Education 4.0 for Industry 4.0. Soc. Sci. 2018, 7, 227. [Google Scholar] [CrossRef]
- Jaklič, A. IoT as an Introduction to Computer Science and Engineering: A Case for NodeMCU in STEM-C Education. In Proceedings of the 2020 IEEE Global Engineering Education Conference (EDUCON), Porto, Portugal, 27–30 April 2020; pp. 91–95. [Google Scholar] [CrossRef]
- Seng, L.G.; Wei, K.L.K.; Narciso, S.J. Effective industry ready IoT Applied Courseware—Teaching IoT Design and Validation. In Proceedings of the 2020 IEEE Global Engineering Education Conference (EDUCON), Porto, Portugal, 27–30 April 2020; pp. 1579–1583. [Google Scholar] [CrossRef]
- Verma, A.; Singh, A.; Lughofer, E.; Cheng, X.; Abualsaud, K. Multilayered-quality education ecosystem (MQEE): An intelligent education modal for sustainable quality education. J. Comput. High. Educ. 2021, 33, 551–579. [Google Scholar] [CrossRef]
- Verma, A.; Singh, A.; Anand, D.; Aljahdali, H.M.; Alsubhi, K.; Khan, B. IoT Inspired Intelligent Monitoring and Reporting Framework for Education 4.0. IEEE Access 2021, 9, 131286–131305. [Google Scholar] [CrossRef]
- Zohora, F.T.; Khan, M.R.R.; Bhuiyan, M.F.R.; Das, A.K. Enhancing the capabilities of IoT based fog and cloud infrastructures for time sensitive events. In Proceedings of the 2017 International Conference on Electrical Engineering and Computer Science (ICECOS), Palembang, Indonesia, 22–23 August 2017; pp. 224–230. [Google Scholar] [CrossRef]
- Da Silva Lisboa Tigre, M.F.F.; Santos, G.L.; Lynn, T.; Sadok, D.; Kelner, J.; Endo, P.T. Modeling the availability of an e-health system integrated with edge, fog and cloud infrastructures. In Proceedings of the 2018 IEEE Symposium on Computers and Communications (ISCC), Natal, Brazil, 25–28 June 2018; pp. 416–421. [Google Scholar] [CrossRef]
- Alli, A.A.; Alam, M.M. The fog cloud of things: A survey on concepts, architecture, standards, tools, and applications. Internet Things 2020, 9, 100177. [Google Scholar] [CrossRef]
- Alharbi, H.A.; Aldossary, M. Energy-Efficient Edge-Fog-Cloud Architecture for IoT-Based Smart Agriculture Environment. IEEE Access 2021, 9, 110480–110492. [Google Scholar] [CrossRef]
- Carbone, A.; Davcev, D.; Mitreski, K.; Kocarev, L.; Stankovski, V. Blockchain based Distributed Cloud Fog Platform for IoT Supply Chain Management. In Proceedings of the Eighth International Conference on Advances in Computing, Electronics and Electrical Technology—CEET 2018, Kuala Lumpur, Malaysia, 3–4 February 2018; pp. 51–58. [Google Scholar] [CrossRef][Green Version]
- Greco, L.; Percannella, G.; Ritrovato, P.; Tortorella, F.; Vento, M. Trends in IoT based solutions for health care: Moving AI to the edge. Pattern Recognit. Lett. 2020, 135, 346–353. [Google Scholar] [CrossRef] [PubMed]
- Sarkar, S.; Wankar, R.; Srirama, S.N.; Suryadevara, N.K. Serverless Management of Sensing Systems for Fog Computing Framework. IEEE Sens. J. 2020, 20, 1564–1572. [Google Scholar] [CrossRef]
- Tripathi, A.; Singh, A.K.; Choudhary, P.; Vashist, P.C.; Mishra, K.K. Significance of Wireless Technology in Internet of Things (IoT). In Machine Learning and Cognitive Computing for Mobile Communications and Wireless Networks; Wiley Online Library: Hoboken, NJ, USA, 2020; pp. 131–154. [Google Scholar] [CrossRef]
- Neji, B.; Ferko, N.; Ghandour, R.; Karar, A.S.; Arbess, H. Micro-fabricated RTD based sensor for breathing analysis and monitoring. Sensors 2021, 21, 318. [Google Scholar] [CrossRef]
- Yap, S.H.K.; Chan, K.K.; Tjin, S.C.; Yong, K.T. Carbon allotrope-based optical fibers for environmental and biological sensing: A review. Sensors 2020, 20, 2046. [Google Scholar] [CrossRef]
- Willner, J.; Fornalczyk, A.; Jablonska-Czapla, M.; Grygoyc, K.; Rachwal, M. Studies on the Content of Selected Technology Critical Elements (Germanium, Tellurium and Thallium) in Electronic Waste. Materials 2021, 14, 3722. [Google Scholar] [CrossRef]
- Egorov, E.; Shabalina, A.; Zaitsev, D.; Kurkov, S.; Gueorguiev, N. Frequency response stabilization and comparative studies of MET hydrophone at marine seismic exploration systems. Sensors 2020, 20, 1944. [Google Scholar] [CrossRef]
- Spaeth, U.; Fechtner, H.; Weisbach, M.; Schmuelling, B. Potential of pressure sensor based mass estimation methods for electric buses. Electronics 2020, 9, 711. [Google Scholar] [CrossRef]
- Balageas, D.; Fritzen, C.P.; Güemes, A. Structural Health Monitoring. In Structural Health Monitoring; ISTE: London, UK, 2010; pp. 1–495. [Google Scholar] [CrossRef]
- Shirole, D.; Hedayat, A.; Ghazanfari, E.; Walton, G. Evaluation of an Ultrasonic Method for Damage Characterization of Brittle Rocks. Rock Mech. Rock Eng. 2020, 53, 2077–2094. [Google Scholar] [CrossRef]
- Huang, E.J.; Onnela, J.P. Augmented movelet method for activity classification using smartphone gyroscope and accelerometer data. Sensors 2020, 20, 3706. [Google Scholar] [CrossRef]
- Al Mamun, M.A.; Yuce, M.R. Recent Progress in Nanomaterial Enabled Chemical Sensors for Wearable Environmental Monitoring Applications. Adv. Funct. Mater. 2020, 30, 2005703. [Google Scholar] [CrossRef]
- Sukhavasi, S.B.; Sukhavasi, S.B.; Elleithy, K.; Abuzneid, S.; Elleithy, A. Cmos image sensors in surveillance system applications. Sensors 2021, 21, 488. [Google Scholar] [CrossRef] [PubMed]
- Salazar, A.O.; Sugahara, Y.; Matsuura, D.; Takeda, Y. Scalable output linear actuators, a novel design concept using shape memory alloy wires driven by fluid temperature. Machines 2021, 9, 14. [Google Scholar] [CrossRef]
- Bhatia, M.; Sood, S.K.; Manocha, A. Fog-inspired smart home environment for domestic animal healthcare. Comput. Commun. 2020, 160, 521–533. [Google Scholar] [CrossRef]
- Chouzenoux, E.; Elvira, V. Graphem: Em Algorithm for Blind Kalman Filtering under Graphical Sparsity Constraints. In Proceedings of the ICASSP 2020—2020 IEEE International Conference on Acoustics, Speech and Signal Processing (ICASSP), Barcelona, Spain, 4–8 May 2020; pp. 5835–5839. [Google Scholar]
- Cai, G.; Fang, Y.; Chen, P.; Han, G.; Cai, G.; Song, Y. Design of an MISO-SWIPT-Aided Code-Index Modulated Multi-Carrier M-DCSK System for e-Health IoT. IEEE J. Sel. Areas Commun. 2021, 39, 311–324. [Google Scholar] [CrossRef]
- Baril, X.; Coustié, O.; Mothe, J.; Teste, O. Application Performance Anomaly Detection with LSTM on Temporal Irregularities in Logs. In Proceedings of the 29th ACM International Conference on Information & Knowledge Management, New York, NY, USA, 19–23 October 2020; pp. 1961–1964. [Google Scholar] [CrossRef]
- Munchava, T.; Basilaia, G.; Vacheishvili, N.; Kvavadze, D.; Chkhaidze, D.; Elashvili, M. IoT systems for the study of cultural heritage monuments—Case of Uplistsikhe, Georgia. In Proceedings of the 22nd EGU General Assembly, Online, 4–8 May 2020. [Google Scholar]
- Park, H.; Jung, J.Y. SAX-ARM: Deviant event pattern discovery from multivariate time series using symbolic aggregate approximation and association rule mining. Expert Syst. Appl. 2020, 141, 112950. [Google Scholar] [CrossRef]
- Zhou, F.; Chen, W.; Xiao, Y. Deep learning research with an expectation-maximization model for person re-identification. IEEE Access 2020, 8, 157762–157772. [Google Scholar] [CrossRef]
- Jiang, D.; Cui, Y. ML estimation and MAP estimation for device activities in grant-free random access with interference. In Proceedings of the 2020 IEEE Wireless Communications and Networking Conference (WCNC), Seoul, Korea, 25–28 May 2020. [Google Scholar]
- Rao, M.; Li, Q.; Wei, D.; Zuo, M.J. A deep bi-directional long short-term memory model for automatic rotating speed extraction from raw vibration signals. Meas. J. Int. Meas. Confed. 2020, 158, 107719. [Google Scholar] [CrossRef]
- Hassouneh, Y.; Turabieh, H.; Thaher, T.; Tumar, I.; Chantar, H.; Too, J. Boosted Whale Optimization Algorithm with Natural Selection Operators for Software Fault Prediction. IEEE Access 2021, 9, 14239–14258. [Google Scholar] [CrossRef]
- Selvin, S.; Vinayakumar, R.; Gopalakrishnan, E.A.; Menon, V.K.; Soman, K.P. Stock price prediction using LSTM, RNN and CNN-sliding window model. In Proceedings of the 2017 International Conference on Advances in Computing, Communications and Informatics (ICACCI), Udupi, India, 13–16 September 2017; pp. 1643–1647. [Google Scholar] [CrossRef]
- Karmiani, D.; Kazi, R.; Nambisan, A.; Shah, A.; Kamble, V. Comparison of Predictive Algorithms: Backpropagation, SVM, LSTM and Kalman Filter for Stock Market. In Proceedings of the 2019 Amity International Conference on Artificial Intelligence (AICAI), Dubai, United Arab Emirates, 4–6 February 2019; pp. 228–234. [Google Scholar] [CrossRef]
- Li, L.L.; Lv, C.M.; Tseng, M.L.; Sun, J. Reliability Measure Model for Electromechanical Products under Multiple Types of Uncertainties; Elsevier, B.V.: Amsterdam, The Netherlands, 2018; Volume 65. [Google Scholar]
Publisher’s Note: MDPI stays neutral with regard to jurisdictional claims in published maps and institutional affiliations. |
© 2022 by the authors. Licensee MDPI, Basel, Switzerland. This article is an open access article distributed under the terms and conditions of the Creative Commons Attribution (CC BY) license (https://creativecommons.org/licenses/by/4.0/).