Article

A Contrastive Evaluation Method for Discretion in Administrative Penalty

1
School of Software, Shandong University, Jinan 250101, China
2
School of Computer Science and Engineering, Beihang University, Beijing 100191, China
*
Author to whom correspondence should be addressed.
Electronics 2022, 11(9), 1388; https://doi.org/10.3390/electronics11091388
Submission received: 3 March 2022 / Revised: 29 March 2022 / Accepted: 21 April 2022 / Published: 26 April 2022
(This article belongs to the Special Issue Artificial Intelligence of Things Enabled Smart Applications)

Abstract

:
Discretion, namely discretionary power, indicates that administrative agencies could make modifiable decisions under personal judgment when facing situations defined in the law. It plays an essential part in an administrative practice that existing laws and regulations could hardly cover all cases. However, this may also cause the abuse of enforcement power. The rapid development of the Internet of Things (IoT) and databases has provided a powerful tool to measure discretionary power, such as judging if a given administrative punishment is appropriate, and recommending similar cases for a new law-violation record. In this paper, we develop a multi-task framework to extract contrastive patterns from historical records and recommend unprocessed penalties. There is massive ambiguity in collected records, where the limited samples of specific penalties and a large number of whole records make it hard to distinguish factors in individual administrative enforcement actions. We propose an automatic data-labeling method based on data pattern discovery, clustering, and statistical analysis to replace manual labeling under potential personal prejudice. We estimate the distribution of collected penalty records to distinguish deviated and reasonable ones, then produce contrastive samples, which are fed into different network branches. We build a complete IoT platform and collect three-year administrative penalty records nationwide as an empirical evaluation. Experiments show that our proposed methods can learn reasonable discretion by measuring the objectiveness in samples and combining it with a joint training strategy. The final results of penalty amount forecasting and penalty reasonableness judging tasks reach ready-to-use performance.

1. Introduction

Discretionary power in administrative punishments refers to administrative agencies having the legitimate power to make administrative decisions according to their judgment in the absence of a clear definition in the law. The gradually widening range of administration brings increasing complexity to accomplishing management tasks, where the delay characteristic of legislation regulation formulation increases the occurrence of inappropriate administrative punishment. Consequently, the discretion of administrative punishment could be monitored by information techniques and Internet of Things (IoT) platforms to help improve administrative law enforcement. Discretionary health administrative acts refer to the fact that health administrative departments perform administrative acts based on legislation spirits and social welfare, within the scope of legal authorization or in the absence of specific provisions in the law. Health administrative agencies have relatively broad discretionary powers given that health administration requires high professional competence, medical and health matters are complicated, and relevant laws and regulations can not always cover all cases [1].
To better demonstrate the complexity of discretion, we show three examples of discretionary powers, which arise from different real-world scenarios:
  • Discretion in deciding whether or not to punish: For example, the Blood Donation Law of the People’s Republic of China stipulates that “any of the following acts …confiscates illegal gains and may impose a fine of less than 100,000 yuan.” The wording on whether to impose a fine is “may”, and therefore, whether to fine or not is decided by on-site officers.
  • Discretion in deciding what form of punishment to impose: The Law of the People’s Republic of China on Medical Practitioners states that “a warning or an order to suspend practice activities for more than six months or less than one year shall be given.” To perform just a warning or a more rigorous suspension of practice activities punishment is decided by law enforcement officers.
  • Discretion when it comes to the severity of punishment: Law enforcement officers have relatively strong discretionary power regarding the extent of punishment, including fine amounts. The upper and lower bounds for fines are only set by law, while law enforcement officers decide the exact value of fines according to the extent of the law violation activities.
While discretion addresses some practical issues during enforcement, it also introduces an evaluation problem, where we encounter inappropriate clause usage or even authority abuse. The subjective judgment of law enforcement officers and the ambiguity of laws and regulations are two main factors when performing discretionary power. Thus, defects in either one will cause defects in the final punishment decision.
Administrative regulations have certain flaws themselves. Firstly, some clauses lack clarity. For example, Detailed Rules for the Implementation of the Regulations on Hygiene Management in Public Places stipulates that public places shall not reuse disposable appliances, but it does not stipulate the definition and contents of disposable items; The Requisitioning and Acquisition of Immovable Property Act in India accredits the government to requisition private real estate for “purposes of the union” without a clear definition of this term, which gives the government too much freedom to exploitit. Secondly, the formulation of laws and regulations is generally lacking, or even refers to actual situations, which may cause imperfections in them. One real case might not be covered by law in detail, and different laws with different punishment standards might be referred to. As a result, the ambiguity, inconsistency, and lack of comprehensiveness cause flaws in administrative laws and regulations.
The officer’s subjective judgement forms the discretion when performing enforcement. To certain extents, the power of discretion gives the ability to perform legislative discretion, that is, part of the power to “interpret laws”. This requires the officer to have a higher understanding of the clauses and underlying situations. They not only need to understand health-related knowledge but also administrative knowledge, and this affects both the efficiency and reasonableness of health administration. An incorrect choice of applicable law and lacking legal definitions and content may cause an inadequate subjective judgment [2]. Moreover, subjective and deliberate inappropriate enforcement is rare but will cause discretionary power abuse.
Mobile devices, mobile Internet, and cloud service technology have developed rapidly in recent years. Many recent works have researched the efficiency, security and availability of the cloud services [3,4]. Their works have pushed the development of such technologies and further helped to reshape the working flow of many traditional businesses [5,6], including administrative affairs.
In this paper, we aim to provide a framework to measure the discretionary power in the health and sanitation administrative punishment field, which is designed to record the whole process and improve objectivity and impartiality. Informatization and digitization techniques of law enforcement records have been widely adopted recently, where the massive records make it possible to apply machine learning methods to alleviate the discretion evaluation problem. Law enforcement officers are equipped with portable devices that help to collect real-time administrative data. Artificial intelligence algorithms deployed on platforms can process, analyze, and further help make decisions on these data to promote the unification of judicial discretion while pursuing efficiency and justice. A computer-aided punishment quantification system can learn from previous cases and consider both laws and specific circumstances to minimize the impact of regulation flaws and subjective errors.
There are broad applications of introducing artificial intelligence to administrative management. The classical paradigm of fine amount forecasting and unreasonable penalty detection algorithms  [7] includes collecting historical cases, separating rational and irrational cases, and further learning to distinguish such cases. There are inevitable irrational cases in historical records, and existing methods identify such irrational cases by human labeling. Likewise, we propose using statistical analysis methods to automatically distinguish reasonable and unreasonable penalty records in historical data, and construct contrastive samples to train a multi-task multi-perceptron model.
We target two tasks and build the Contrastive Discretion Evaluation (CADRE) framework to finish two tasks with separated network modules. The first module predicts a reasonable penalty amount, and the second module judges if a given penalty amount is reasonable for one given administrative record. Based on these, the two tasks are aligned: given an existing record with a historical penalty amount, the second module of the model can judge if it is reasonable, and given a new record to be fined, the first module predicts how much the amount should be, while the second module of the model can judge whether the prediction of the first model should be accepted or not. The second module acts as a judger in the latter scenario, which benefits practical applications.
The main contributions of this paper can be summarized as follows:
  • We propose the CADRE framework to automatically process and identify reasonable and unreasonable penalty records in an unsupervised manner. Meanwhile, we collected China’s three-year health administrative penalty data to explore their practical application further.
  • We propose a multi-task learning framework to predict the penalty amount for administrative punishment records and judge the corresponding reasonableness of a given penalty amount. Inspired by Contrastive Learning [8,9], our model treats positive (reasonable) punishment records and negative (unreasonable) ones from a different perspective, and we train it collaboratively from unlabeled data, which makes it easier for practical application.
  • We conduct experiments on the collected data, and the results reveal that the adversarial training model can improve the performance on both tasks.
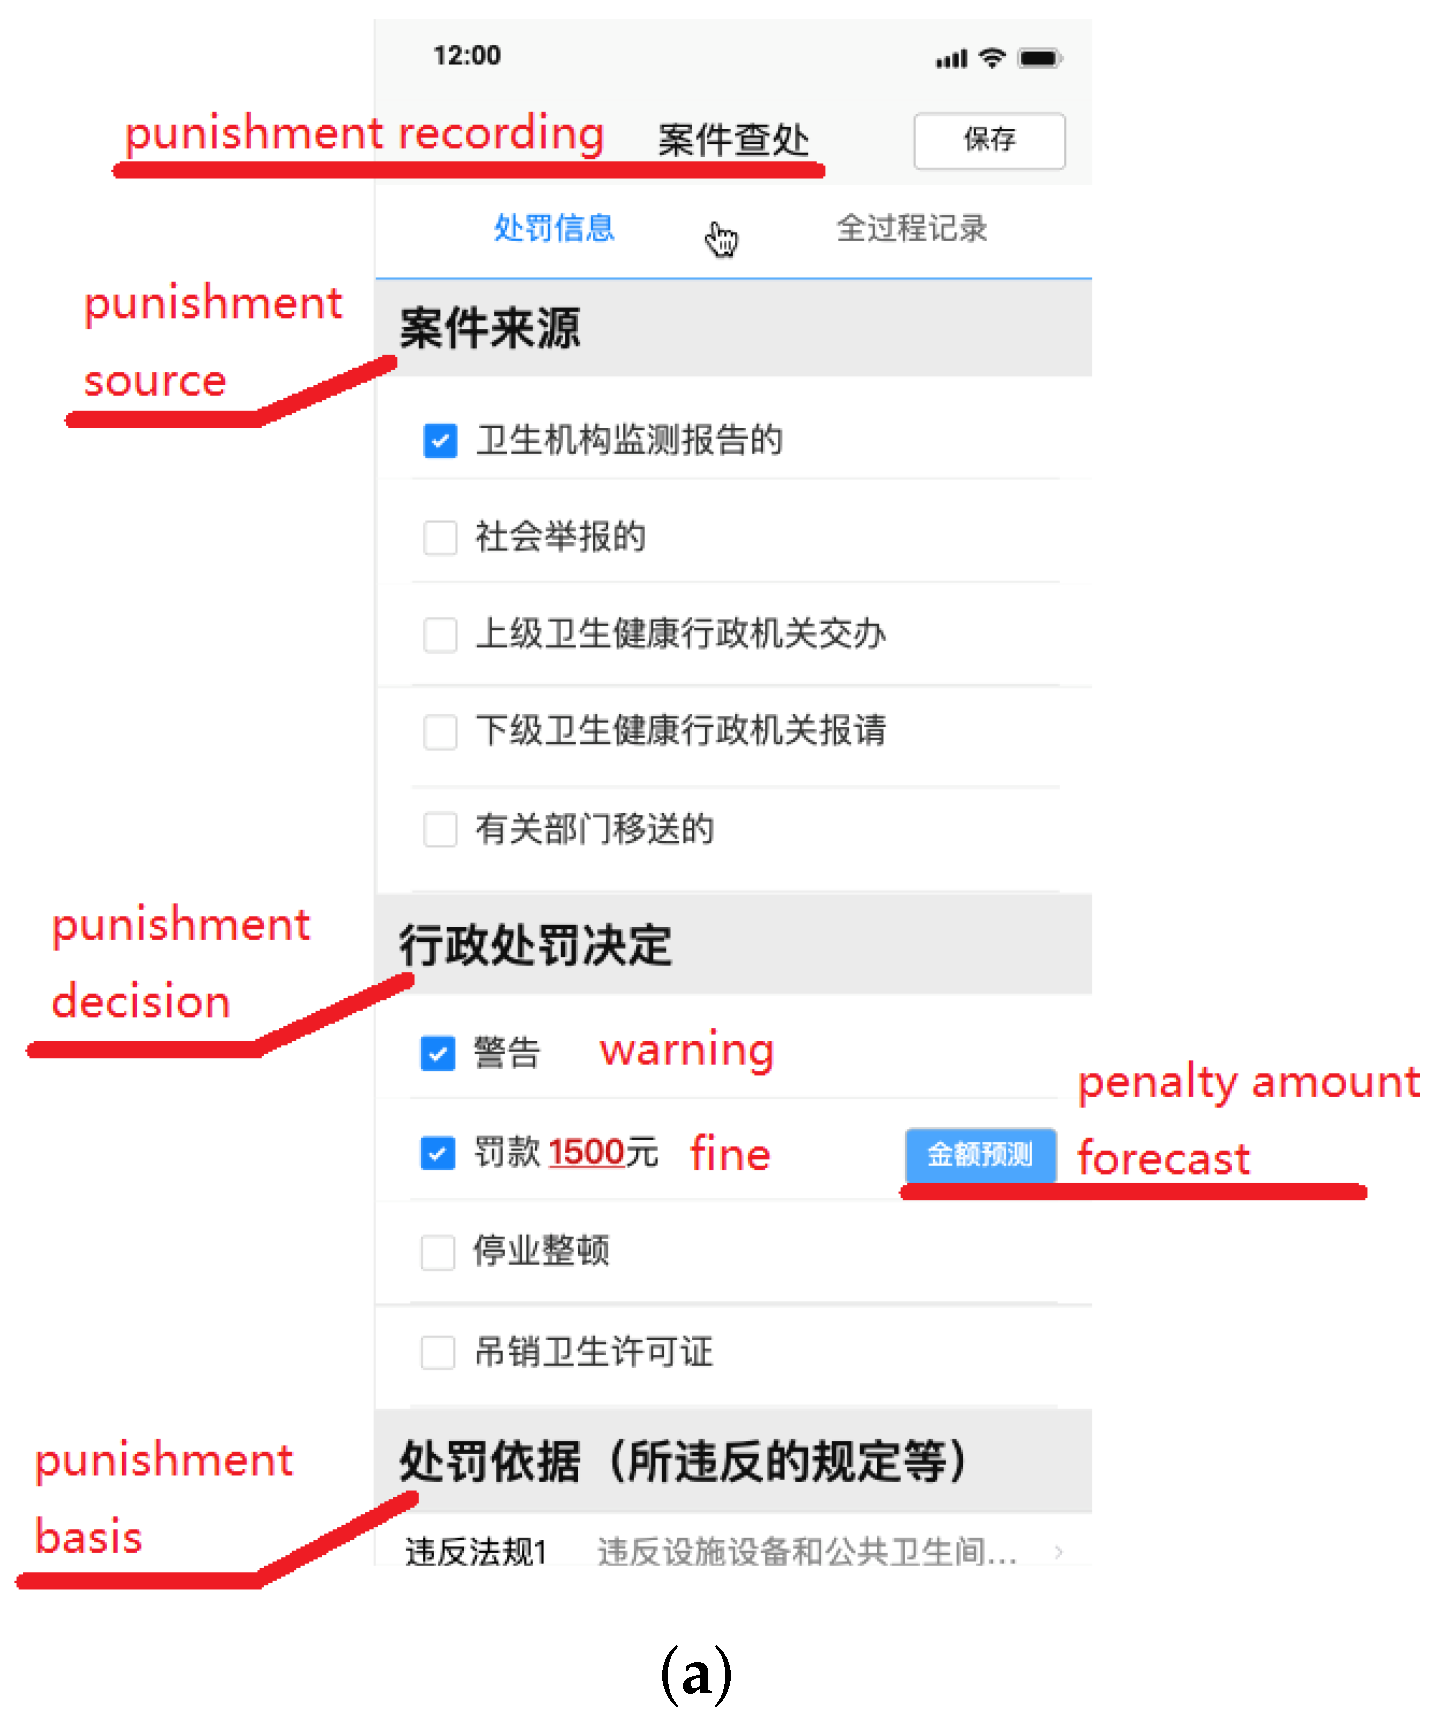
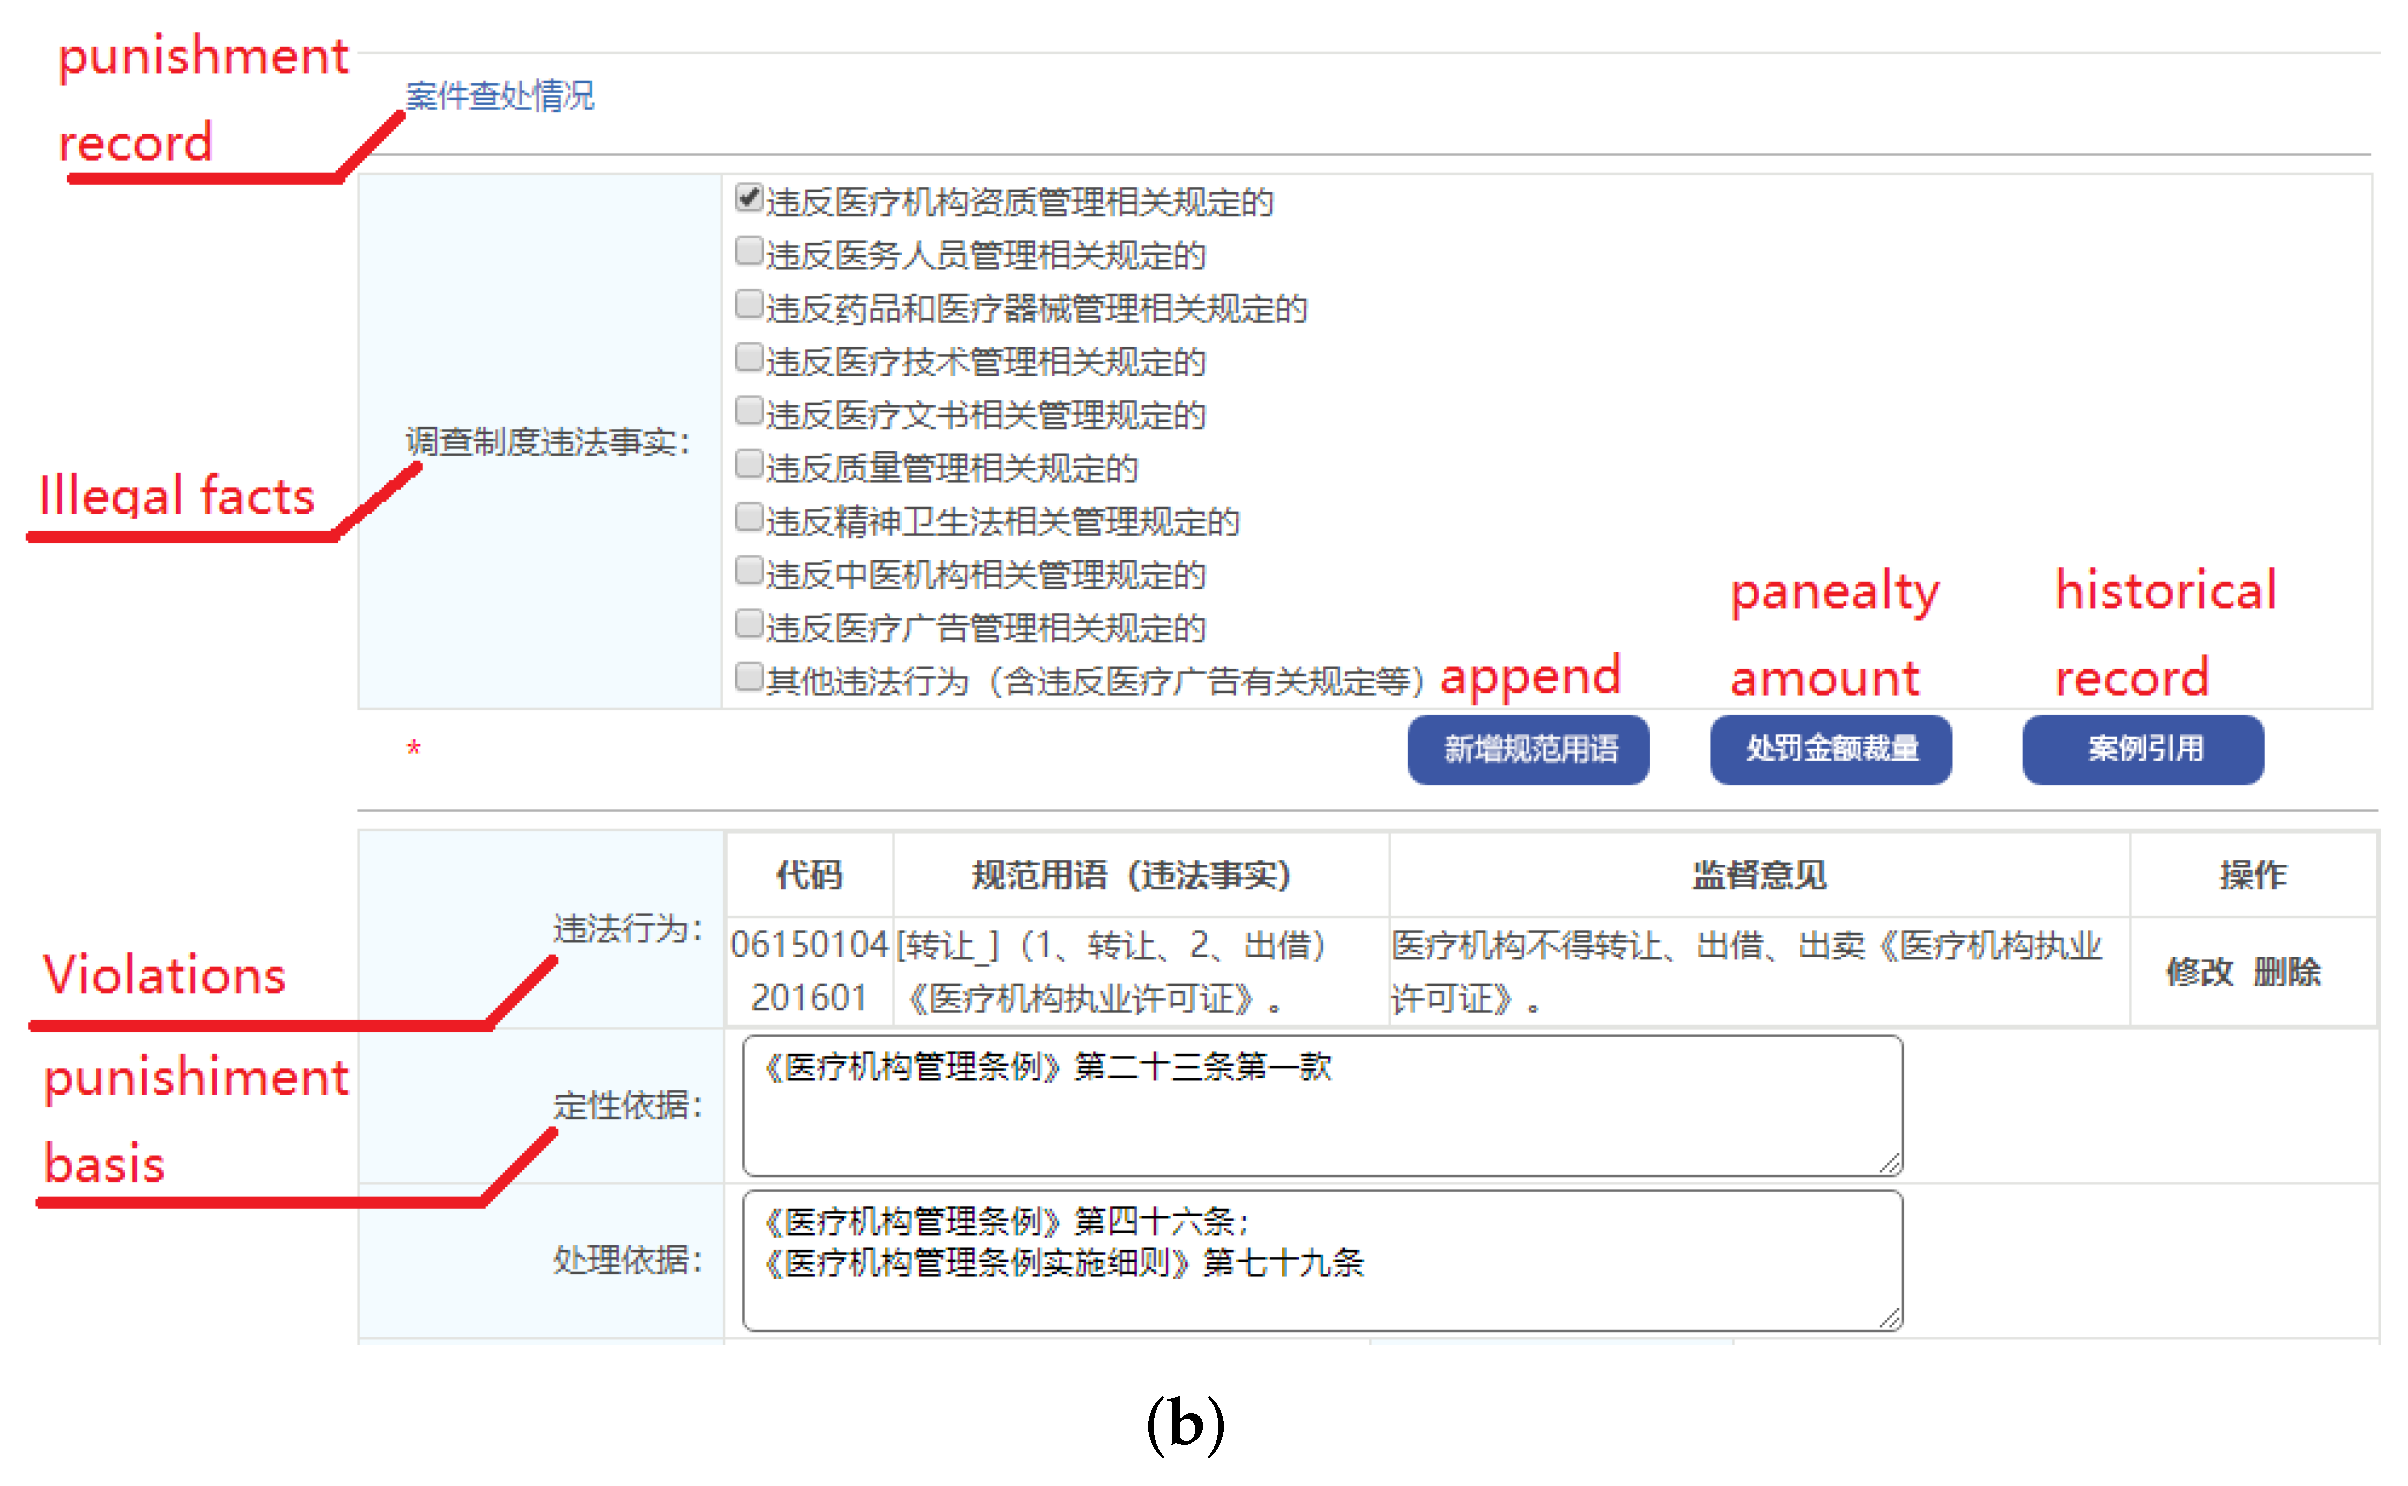
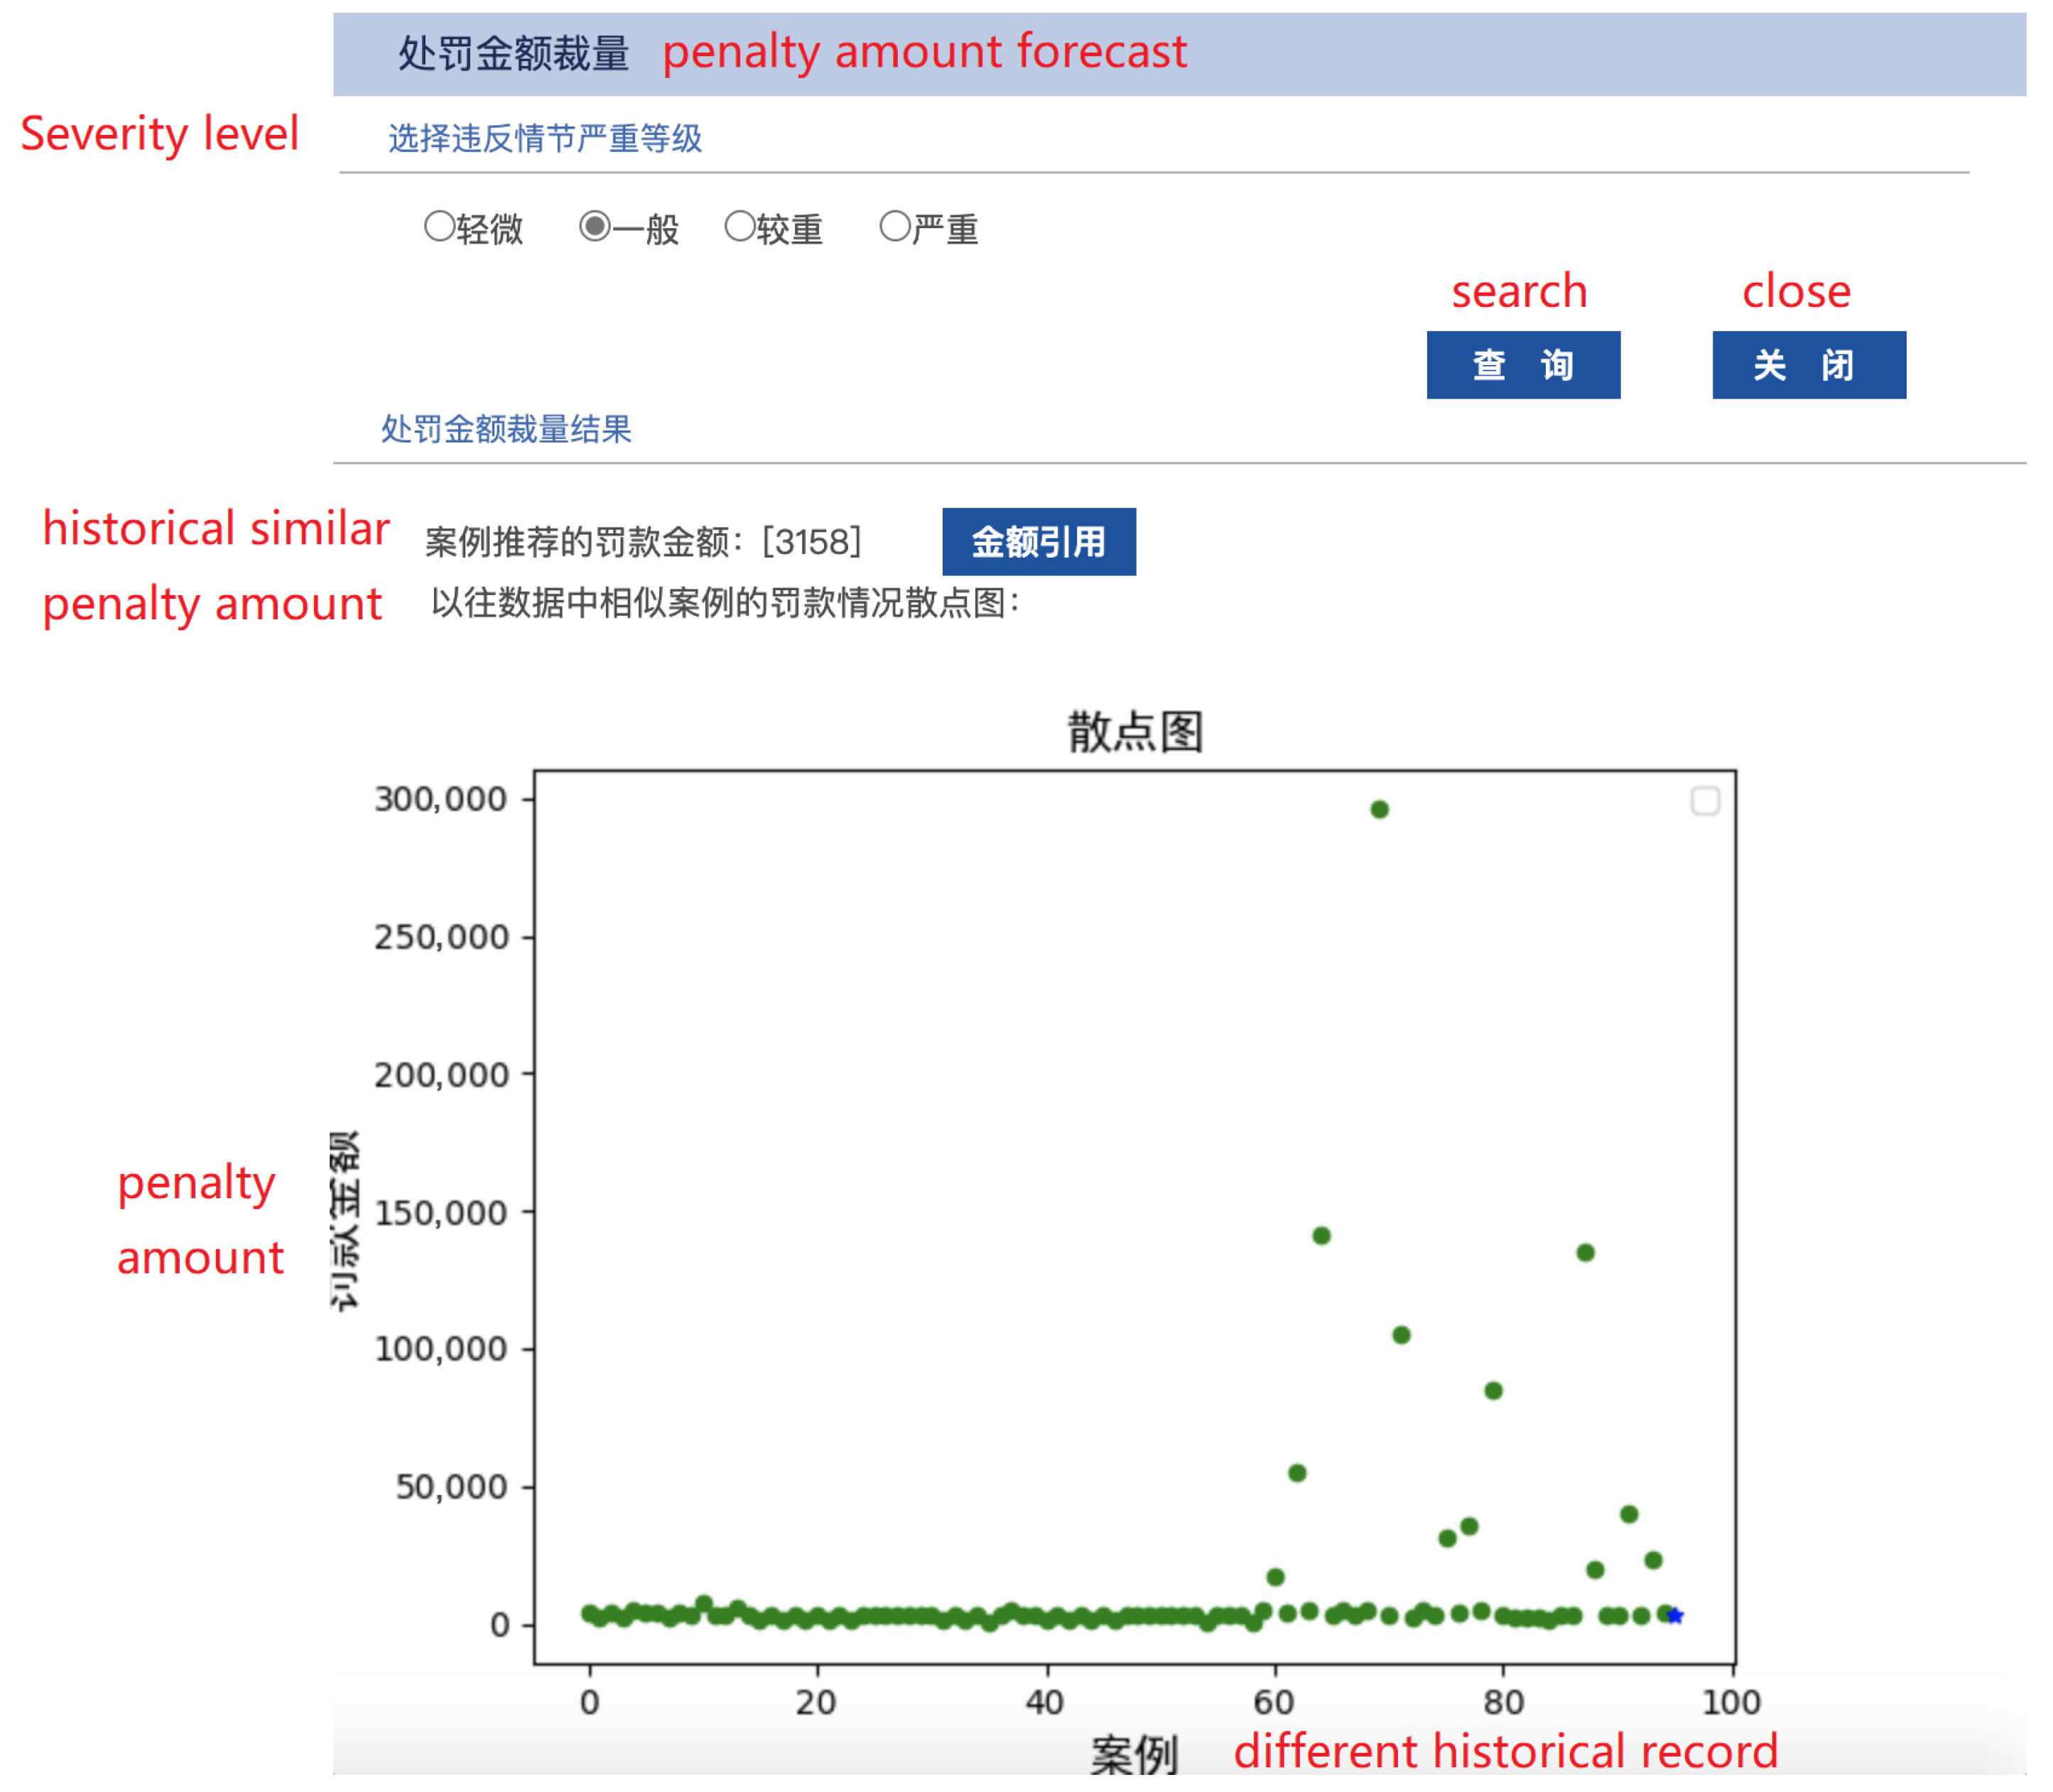
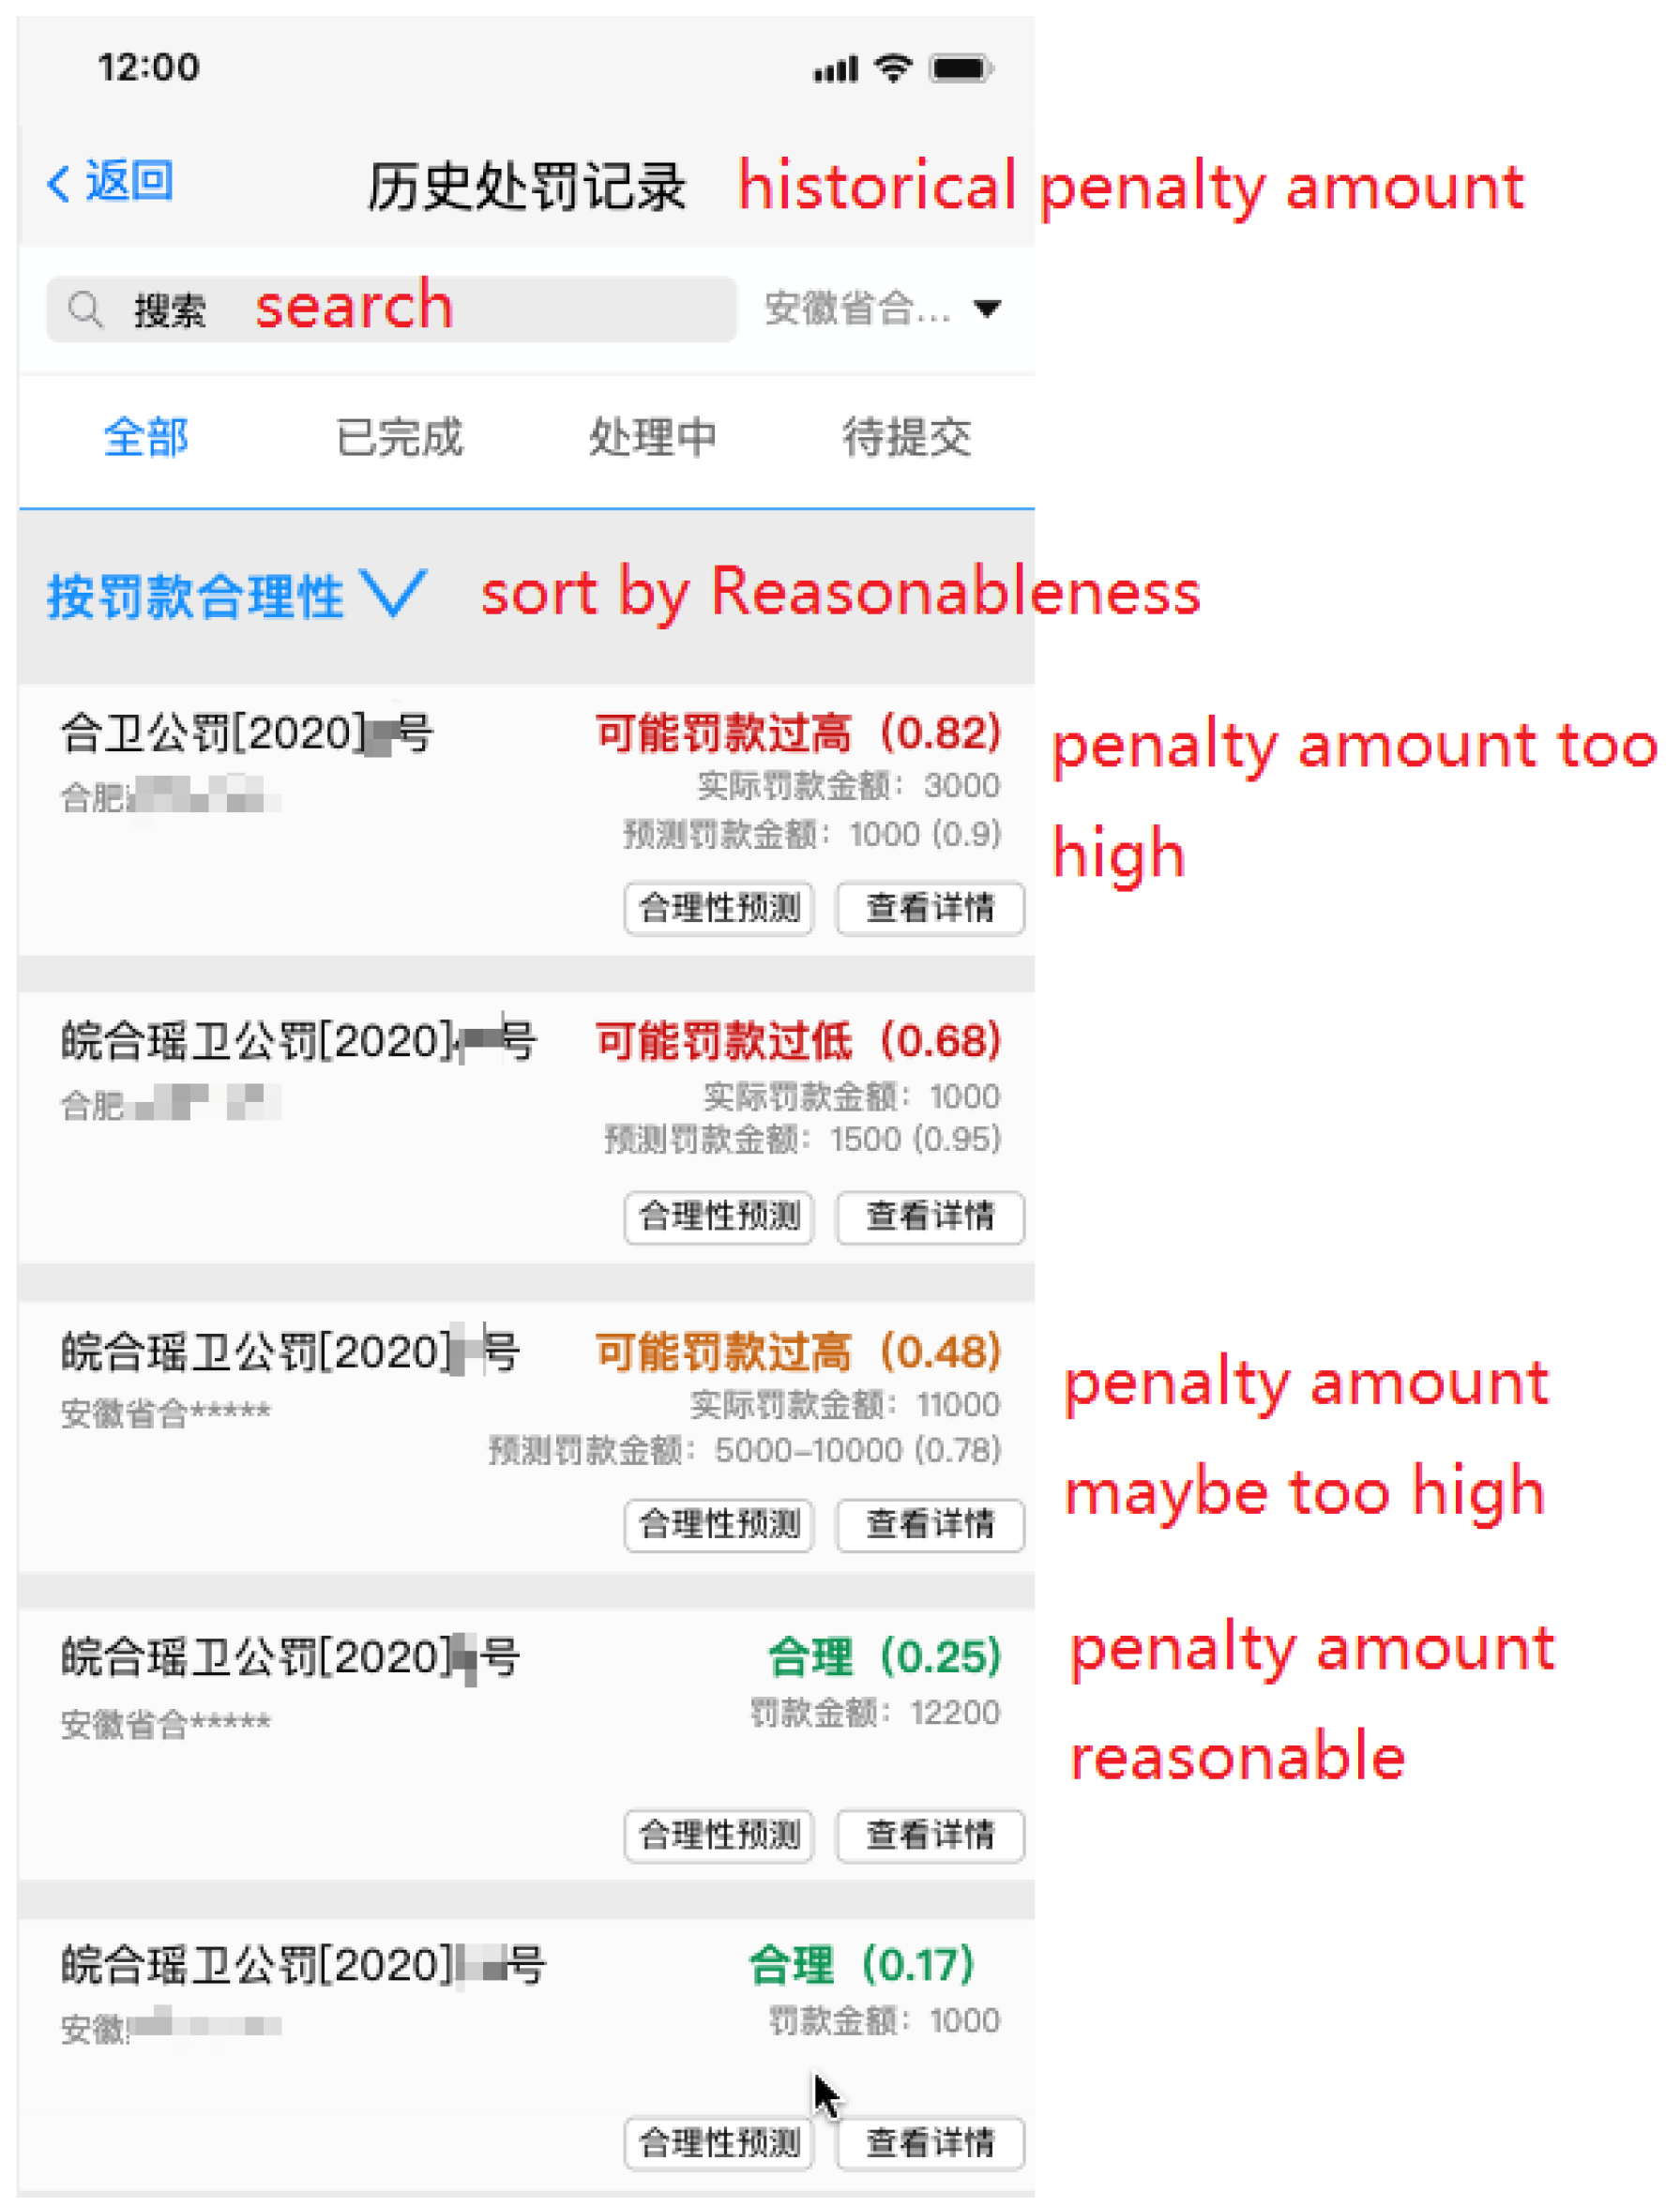
  • We develop a complete system, including automated administrative punishment collection, amount prediction, and abuse detection. The system collects data from IoT devices, and then we follow the proposed approach to provide the service during individual enforcement. The officer could make proper decisions through the system recommendations and retrieval results from historical records, and the management could review and evaluate each administrative penalty.
The rest of the paper is organized as follows. Section 2 introduces related works and discusses the advantages of multi-task learning and contrastive learning. Section 3 introduces the network architecture of the CADRE framework and the contrastive learning methods. Section 4 reports experimental results on the collected dataset. Section 5 illustrates the practical application of the proposed IoT system, which is an efficient and measurable platform for law-enforcement officers. Section 6 concludes this paper.

2. Related Work

2.1. Multi-Task Learning

Multi-task learning methods are generally based on data characteristics and actual goals to accomplish multiple tasks at the same time; in addition, auxiliary tasks can also be designed and constructed by analyzing data and using hidden information to help optimize the performance of the main task [10].
The research of multi-task learning methods has a long history. The traditional non-neural-network multi-task learning methods mainly focus on shared features, including introducing sparseness into the parameter space for learning features that are effective for all tasks [11] and learning the relationship and connections between tasks, allowing the model to cluster these tasks and share features in the same category [12].
Neural network multi-task learning methods are mostly realized by parameter sharing, among which the more frequently used ones are hard sharing [13] and soft sharing [14], as well as novel ones, such as sparse sharing [15].
Multi-task learning has also been widely used in sequential data. In the task of predicting the generation of renewable power plants, J. Schreiber et al. [16] embedded the task feature information in a multilayer perceptron and proposes the Emerging Relation Network (ERN). The sharing mechanism in the network is based on neurons that automatically learn the correlation between tasks without being restricted by subtasks. To capture the dynamic asymmetric relationship between tasks in time-series data, Nguyen T.A. et al. [17] proposed an asymmetric multi-task learning model, which can take advantage of both task correlation and time dependence, transferring information from specific tasks to more uncertain tasks. Chen Z. et al. [18] proposed two self-attention-based multi-task time series forecasting sharing models. The global attention sharing structure includes a task-specific encoder layer and a task-invariant attention layer. The shared multi-head attention layer captures the shared information of all tasks. Meanwhile, the local–global shared attention mechanism is also repeatedly sent feedback to the shared layer to record task-specific information through the output of a private encoder.

2.2. Label Classification Algorithm

Common label classification algorithms include SVM [19], K-means [20], KNN [21], etc. Many studies have made improvements and optimizations on the basis of these classical models to achieve better performance. These algorithms can be divided into three categories: supervised, semi-supervised, and unsupervised.
Kong S. et al. [22] proposed a label correction framework that uses DNN for feature extraction, iteratively applied deep KNN to predict the label, and retrained the neural network with the predicted label to improve the accuracy. In order to reduce the influence of noise, a loss ranking method was used to select samples with high confidence.
Schmarje L. et al. [23] proposed a semi-supervised classification framework for processing fuzzy labels based on the idea of over-clustering. In this paper, a new loss algorithm using inverse cross-entropy was proposed to maximize mutual information. After unsupervised pre-training, supervised augmentations are applied to optimize the classification results.
In terms of text labels, Chu Z. et al. [24] proposed unsupervised label refinement (ULR), which employs k-means clustering to refine the prediction set of the classifier.

2.3. Other Related Basic Methods

Self-supervised learning is a type of unsupervised learning that does not require manual labeling of information, and uses the data itself as supervision to extract features. Supervised learning relies on manual labeling when the dataset is much larger than the labeled set, which sometimes affects the accuracy of the model and requires a larger dataset. On the other hand, labeling is not conducive to the transfer of learning tasks, and changes in goals may require relabeling the data.
The K-means [20] clustering algorithm is fundamental and significant. The sample set is divided into K clusters according to the distance between the samples. The optimization process is to minimize the distance between the points within the cluster while maximizing the distance between clusters. Minibatch K-Means [25] is an optimization of the K-means for big data applications, which can substantially reduce the computing time without losing too much performance. Mini Batch K-Means uses a batch processing method to calculate the distance between data points, extracting samples from the different clusters for representation.
Multi-Layer Perceptrons is a feed-forward neural network. There are multiple hidden layers between the input and output, and each hidden layer is transformed by the activation function, which can solve nonlinear problems. In the training process, the backpropagation algorithm is used to help the model learn from the labeled training data. The initial edge weights are randomly assigned. The outputs calculated by MLP from the given input are compared with the labels, then the error is propagated back to the previous layer, according to which the weights of the neurons are adjusted until convergence.
Bayesian classifiers are statistical classifiers. Naive Bayesian classifiers [26] assume that the effect of an attribute value on a given class is independent of the values of the other attributes. This assumption is made to simplify the computation involved. A Bayesian network [27] is a graphical model that encodes probabilistic relationships among variables of interest [28]. Bayesian networks are factored representations of probability distributions that generalize the naive Bayesian classifier and explicitly represent statements about independence, which outperform naive Bayes. Considering the economic efficiency, the differentiability of data, and the classification pattern we used to process data, we did not adopt Bayesian techniques in this paper.

2.4. Penalty Amount Prediction Methods

Zhang, N. et al. [29] proposed building a legal intelligent auxiliary discretionary system based on GA-BP neural network, which uses general information extracted from legal documents, judgments, and court decisions as network inputs to obtain the predicted value of the penalty. They use a BP neural network with a genetic algorithm to overcome the problem of slow convergence and local optimum.
In the patent “Classification, Prediction Method and Device for Fine Range of Long Text Cases Based on Document Embedding” [30], Zhuang Yeguang discretizes the penalty amount of the judgment and marks the known amount with labels. After removing the stop words and calculating the TF-IDF value of each word, the top k words are sorted as keywords. The documents are encoded into vectors based on these keywords. Then, the forecast is determined by the Euclidean distance between vectors, and the nearest label is taken as the predicted label value.
There are few studies on the application of AI-aid penalty prediction. The field of related research extends to predicting the length of sentences in administrative punishment. Wan Yuting [31] proposed classifying and labeling the sentence based on the Graph-LSTM model, exploring the relationship between the elements of the case and the sentence. The problem is converted into a text classification problem using such structured information as model input and obtaining the prediction of the sentence. Sun Chenpeng et al. [32] proposed a method of imprisonment prediction based on attention mechanism. First, the crime facts and the crime measurement standards are converted into a vector matrix; then, the matrix is input into the long short-term memory network to find the asemantic features that are selected through the attention mechanism. The two parts of the vectors are spliced and sent into the convolutional neural network, and the classification prediction is performed after the fully connected layer.

3. Methods

Motivated by the contrastive learning [8,9], we proposed the CADRE framework to assist in making punishment decisions. It comprises an unsupervised automatic sample identification method for checking records’ reliability, a multi-task prediction method for the fine amount, and a penalty amount reasonableness judgment sub-model. In this chapter, we divided the above contents into three parts. In the first section, we will explain the unsupervised automated sample identification and dataset construction method based on data clustering and statistical analysis of each cluster. In the second section, we will explain the developed multi-task deep learning model, which is the most important component of the CADRE framework, and accomplish two tasks, including the reasonableness judgment task for existing punishment records with fine amount values already decided beforehand and the penalty amount prediction task for new-coming punishment records, which are to be fined. Finally, we will explain the training scheme and the inference behavior of the multi-task model.

3.1. Unsupervised Automated Sample Identification and Dataset Construction Method

The first component of the CADRE framework is the data processing unit. For applying a machine learning model on the IoT device to assist in making punishment decisions, a large number of historical punishment records are required. However, labeling the collected punishment records into fair and unfair cases requires laborious human work. To alleviate the model’s demand for a large labeled dataset and take in as many collected actual punishment records as possible, we proposed an unsupervised automatic punishment record identification method and built the large-scale health administrative penalty historical record dataset.
We will explain the unsupervised automatic punishment record identification method. Concisely, the method consists of two separate procedures. The data clustering process aggregates cases with similar features and punishment basis, while the statistical analysis deduces records’ labels within each cluster with respect to the distribution of penalty amount values. With such a procedure, the punishment records of historical cases are automatically managed, along with corresponding encoded features together with their penalty amount values. The collected dataset will be described in Section 4.1.

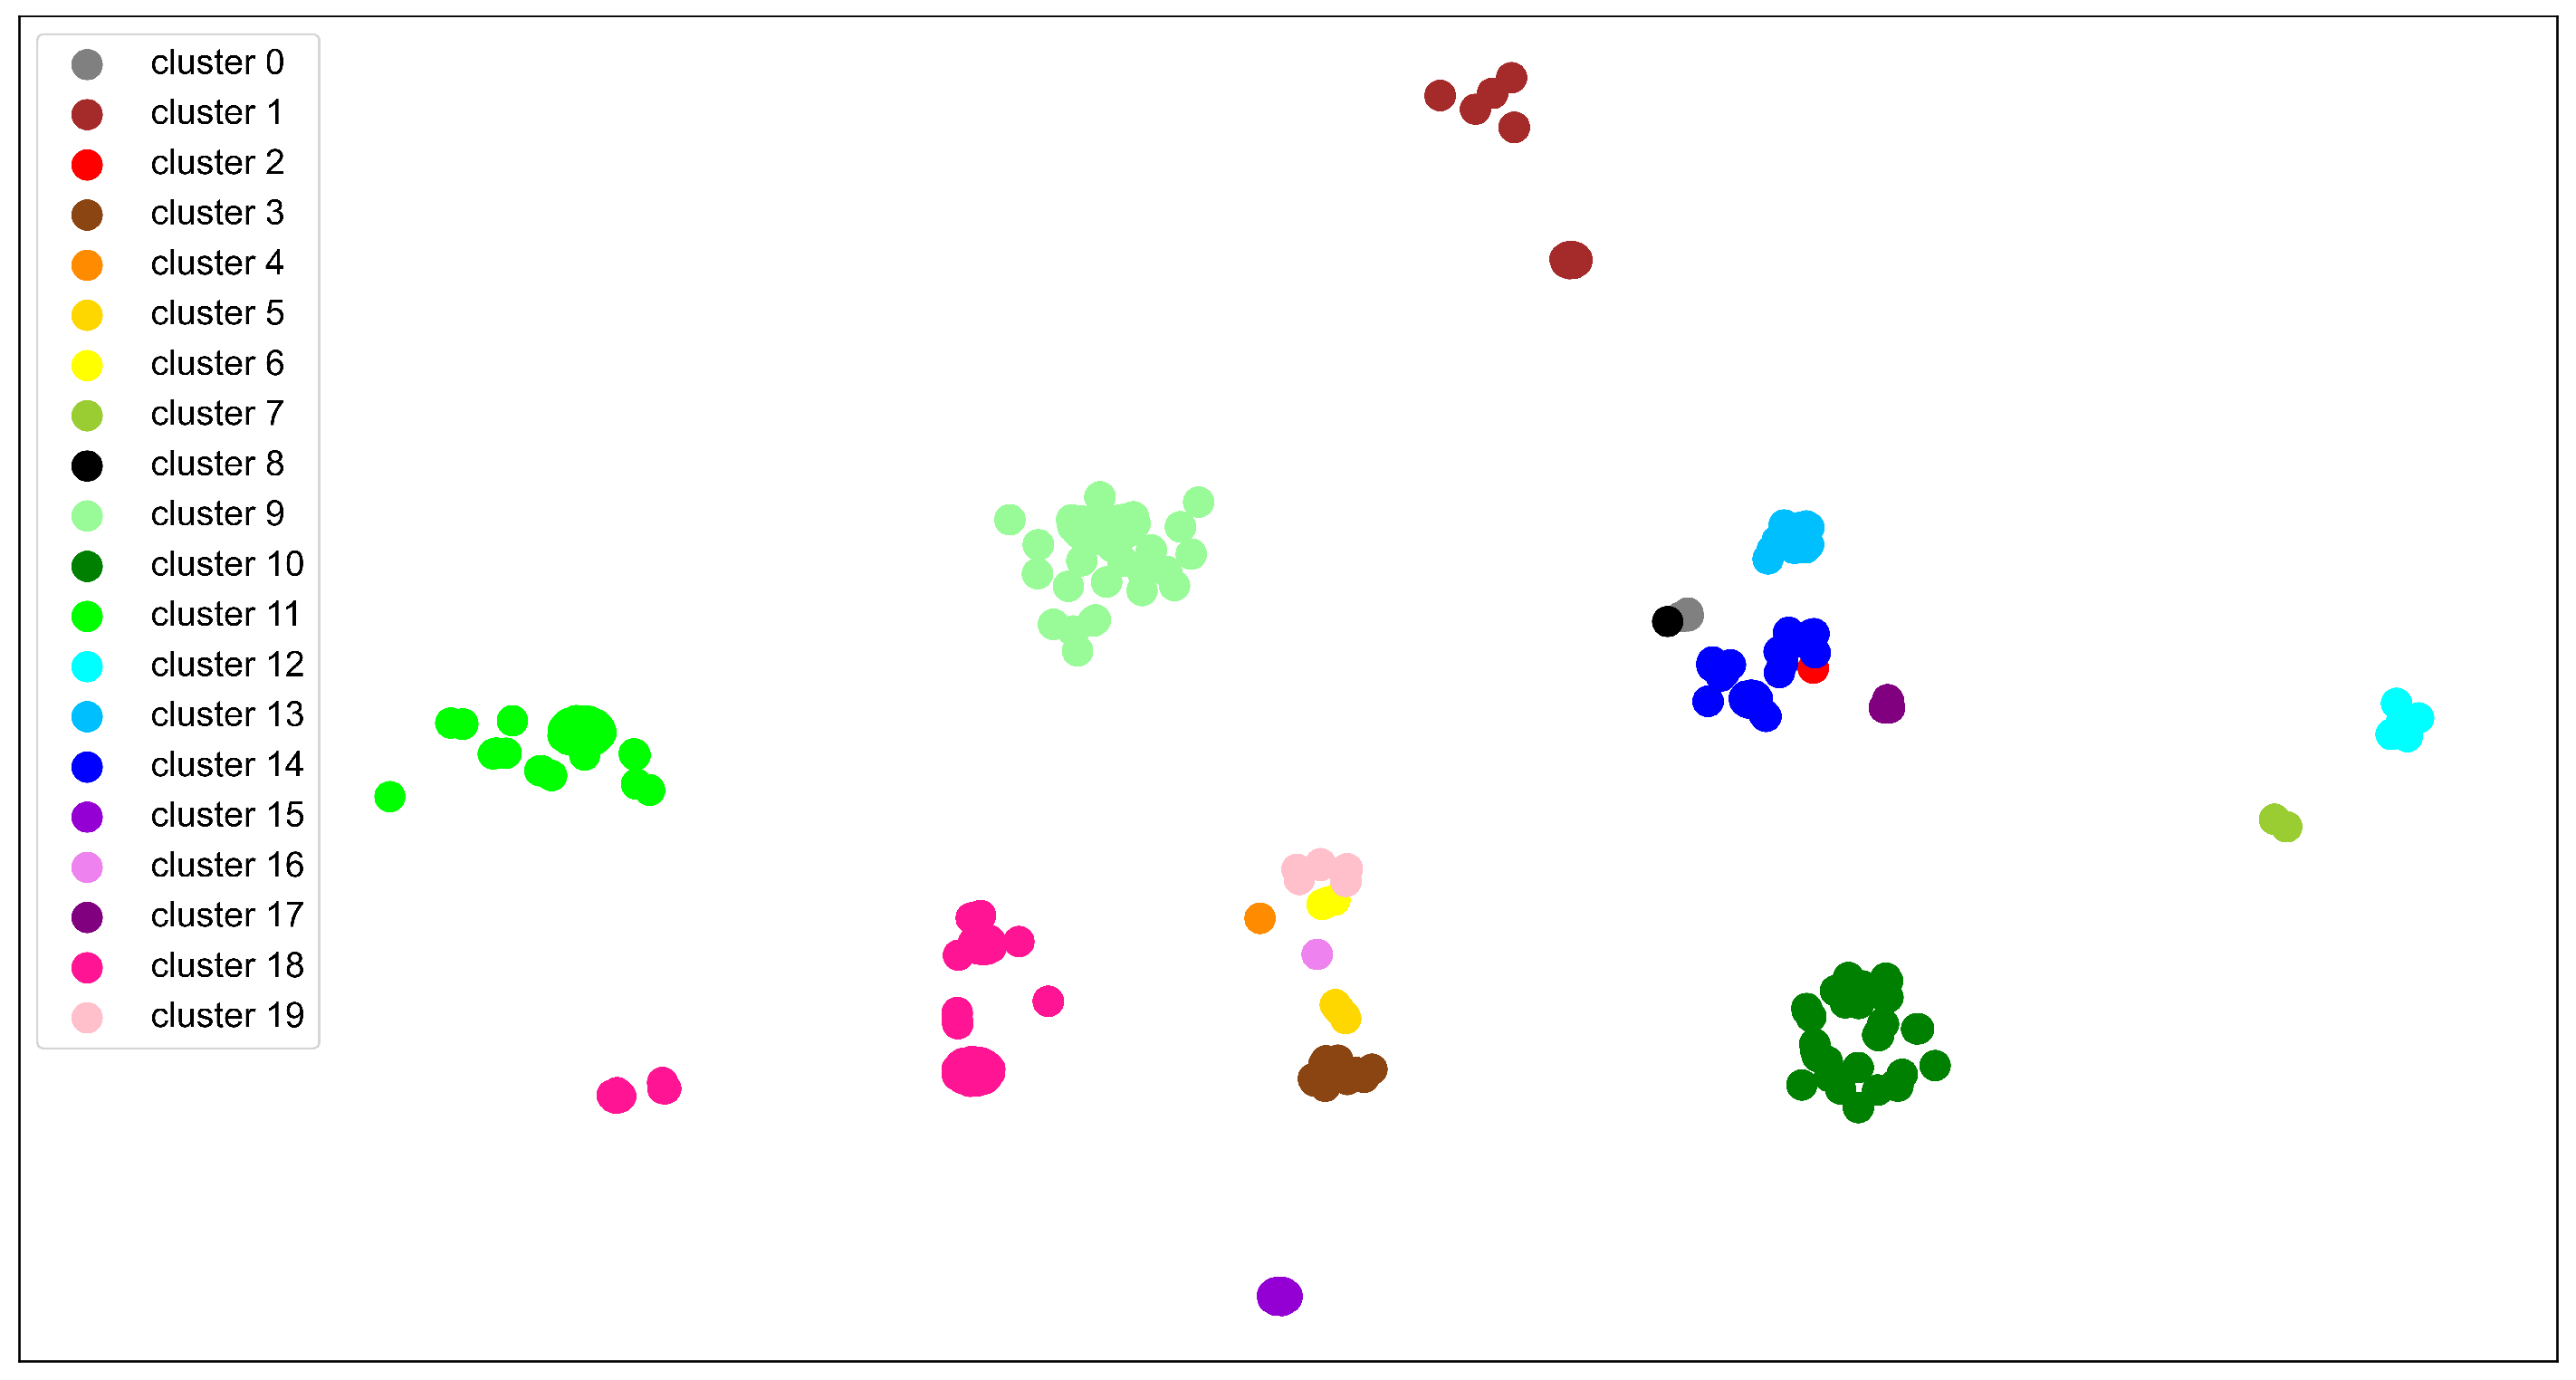
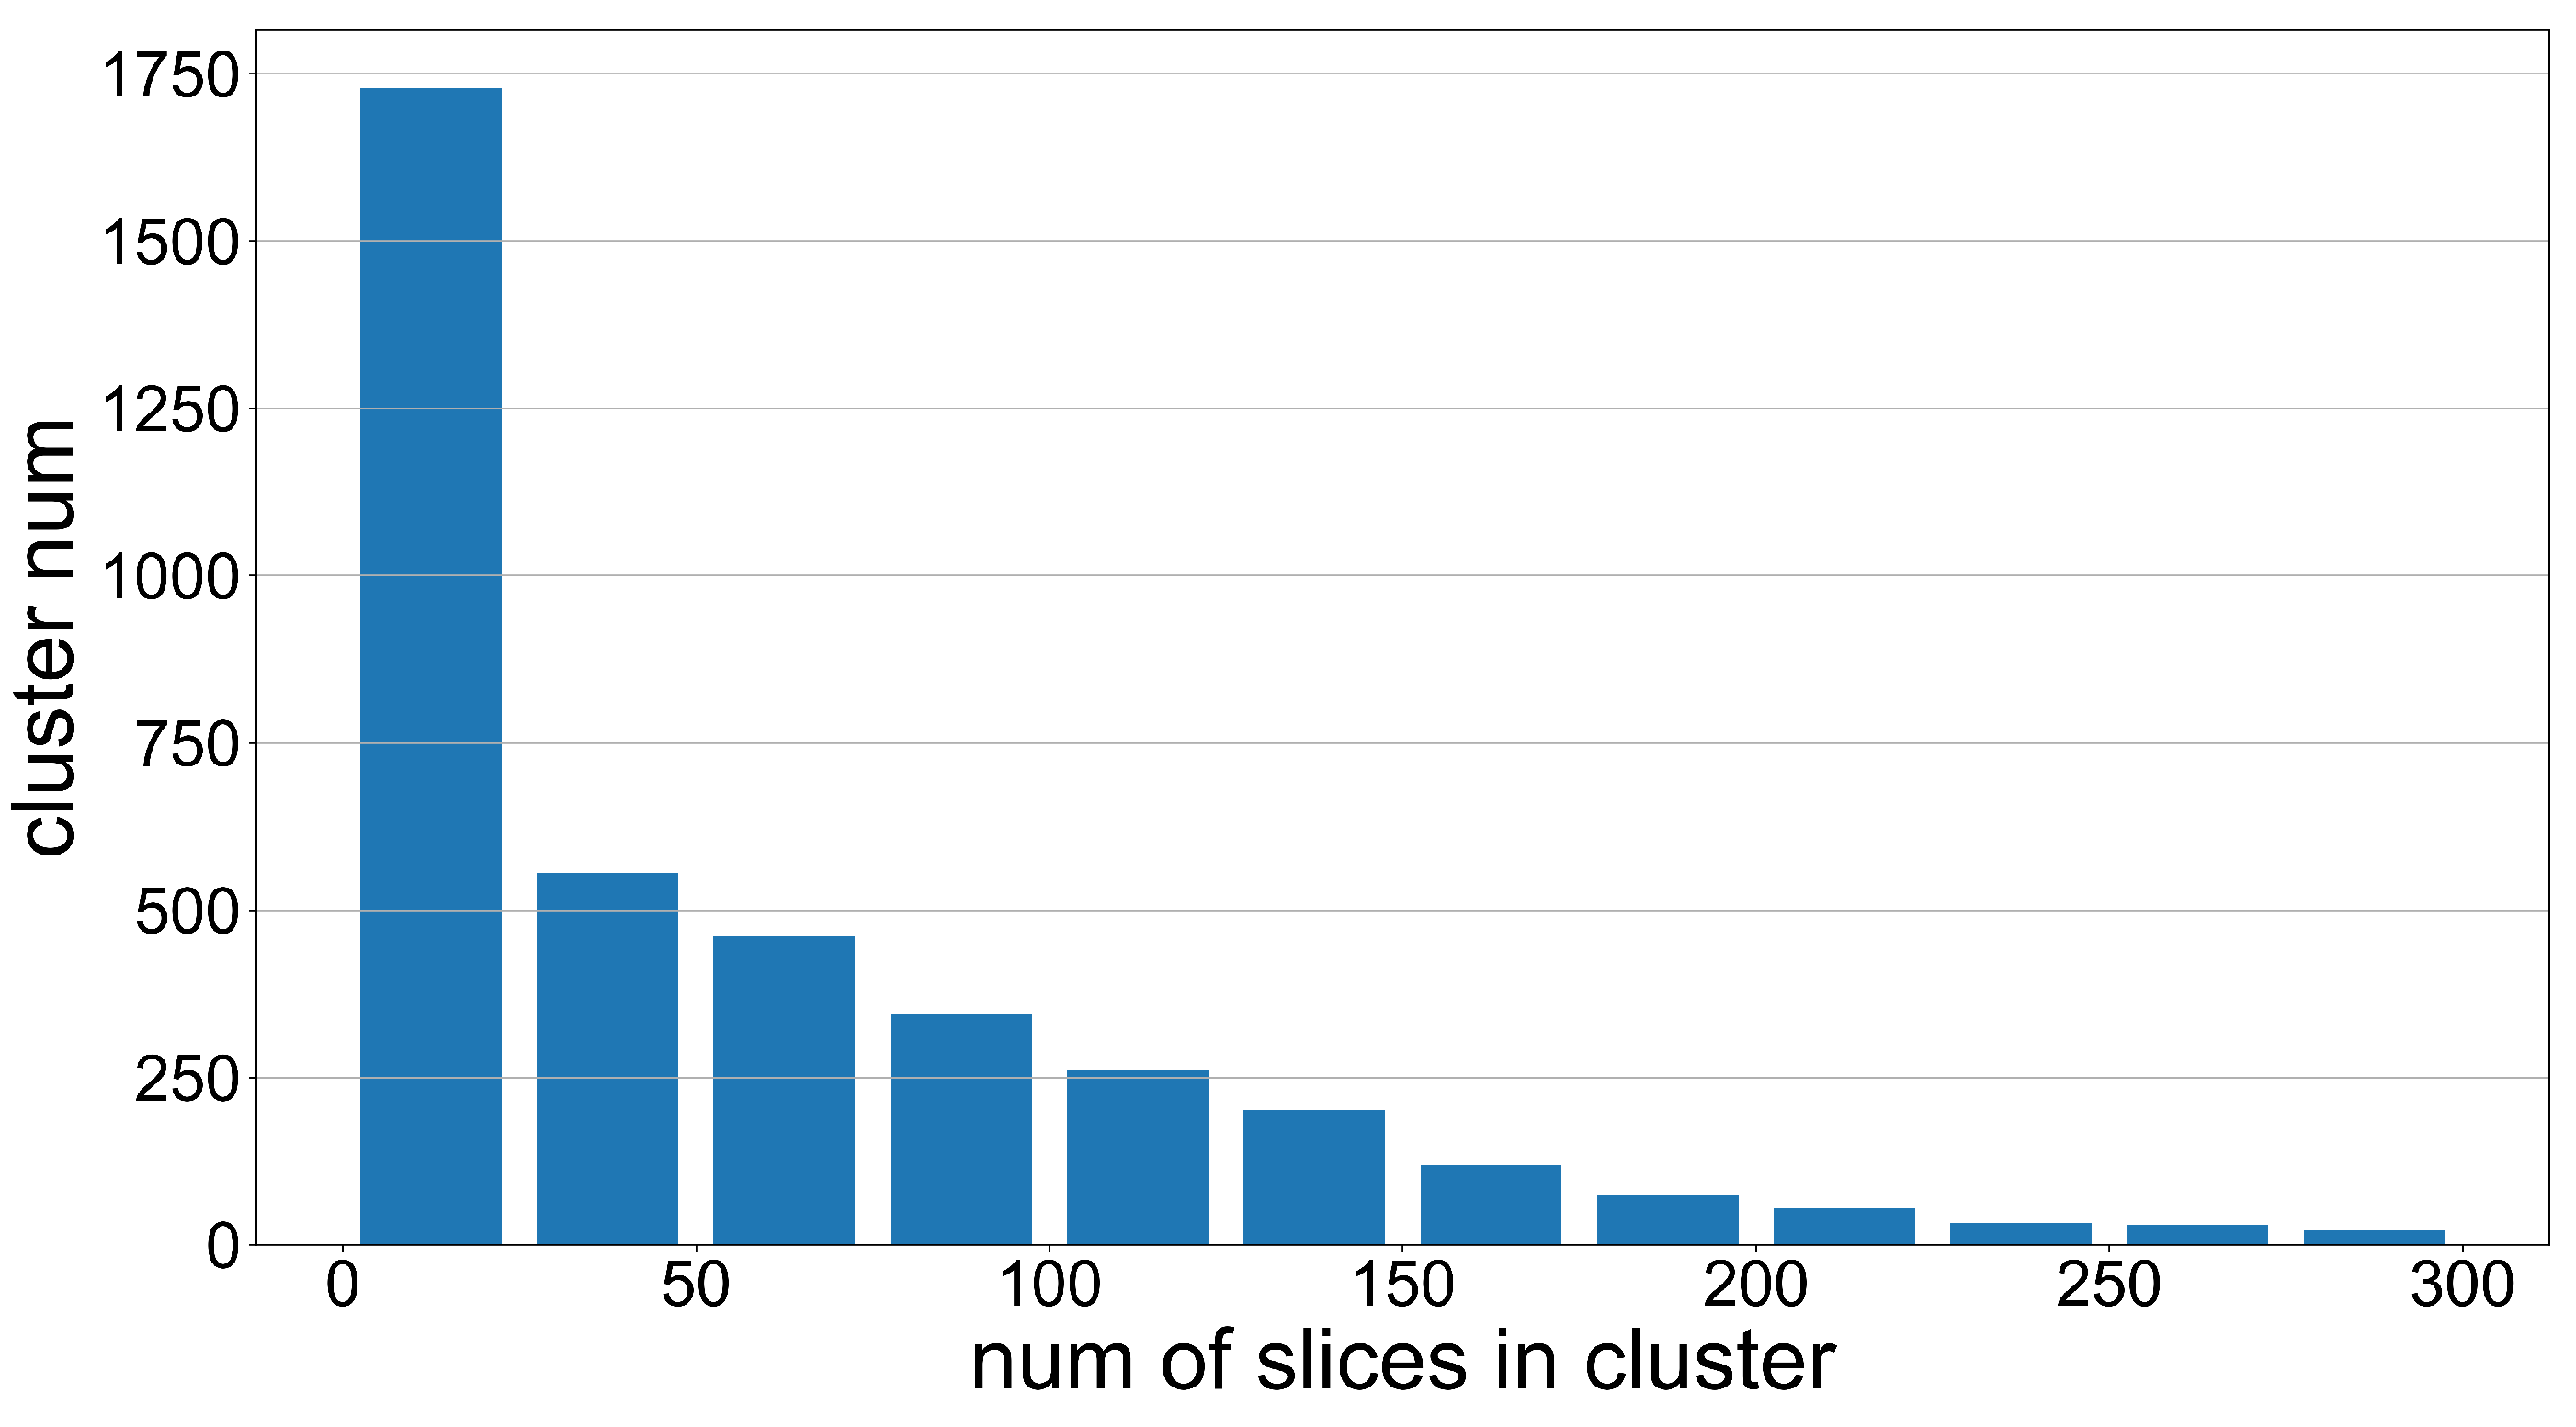
3.1.1. Data Clustering

The punishment records contain places, industry types, punishment basis (laws and regulations violated), violations degree and fine amount-related features. After simple pre-processing, we assemble similar punishment records under the assumption that two more similar records should have similar penalty amounts. The similarity is measured by the two records’ feature vector, the in-place situation and the date–time. Then, we designate the records for each cluster into the reasonable class and unreasonable ones through statistical analysis.
We adopt the mini-batch K-means [25] for data clustering: the feature vector of the i t h historical punishment record is denoted as X i with the dimension of D, and the total number of all feature vectors is N; thus, the dataset { X i } has the dimension of N × D . We use the mini-batch K-means algorithm implemented by the scikit-learn framework [33], and the feature vectors { X i } are grouped into different clusters { c l u s t e r 1 , , c l u s t e r N c } where N c is the number of the cluster centers. The expectation average number of feature vectors within each cluster is N / N c . We set N c to N / 100 , the parameter random_state to 0, and batch_size to N / 100 according to the recommendations.
The clustering result visualized by Truncated SVD [34] and t-SNE [35] is illustrated in Figure 1. Each point in the figure represents one slice of punishment data, and the color of the points demonstrates different categories of the data. As the number of cluster centres is set to N / 100 , the number of data points in each cluster is expected to be 100, and the actual data number of each cluster is illustrated in Figure 2.

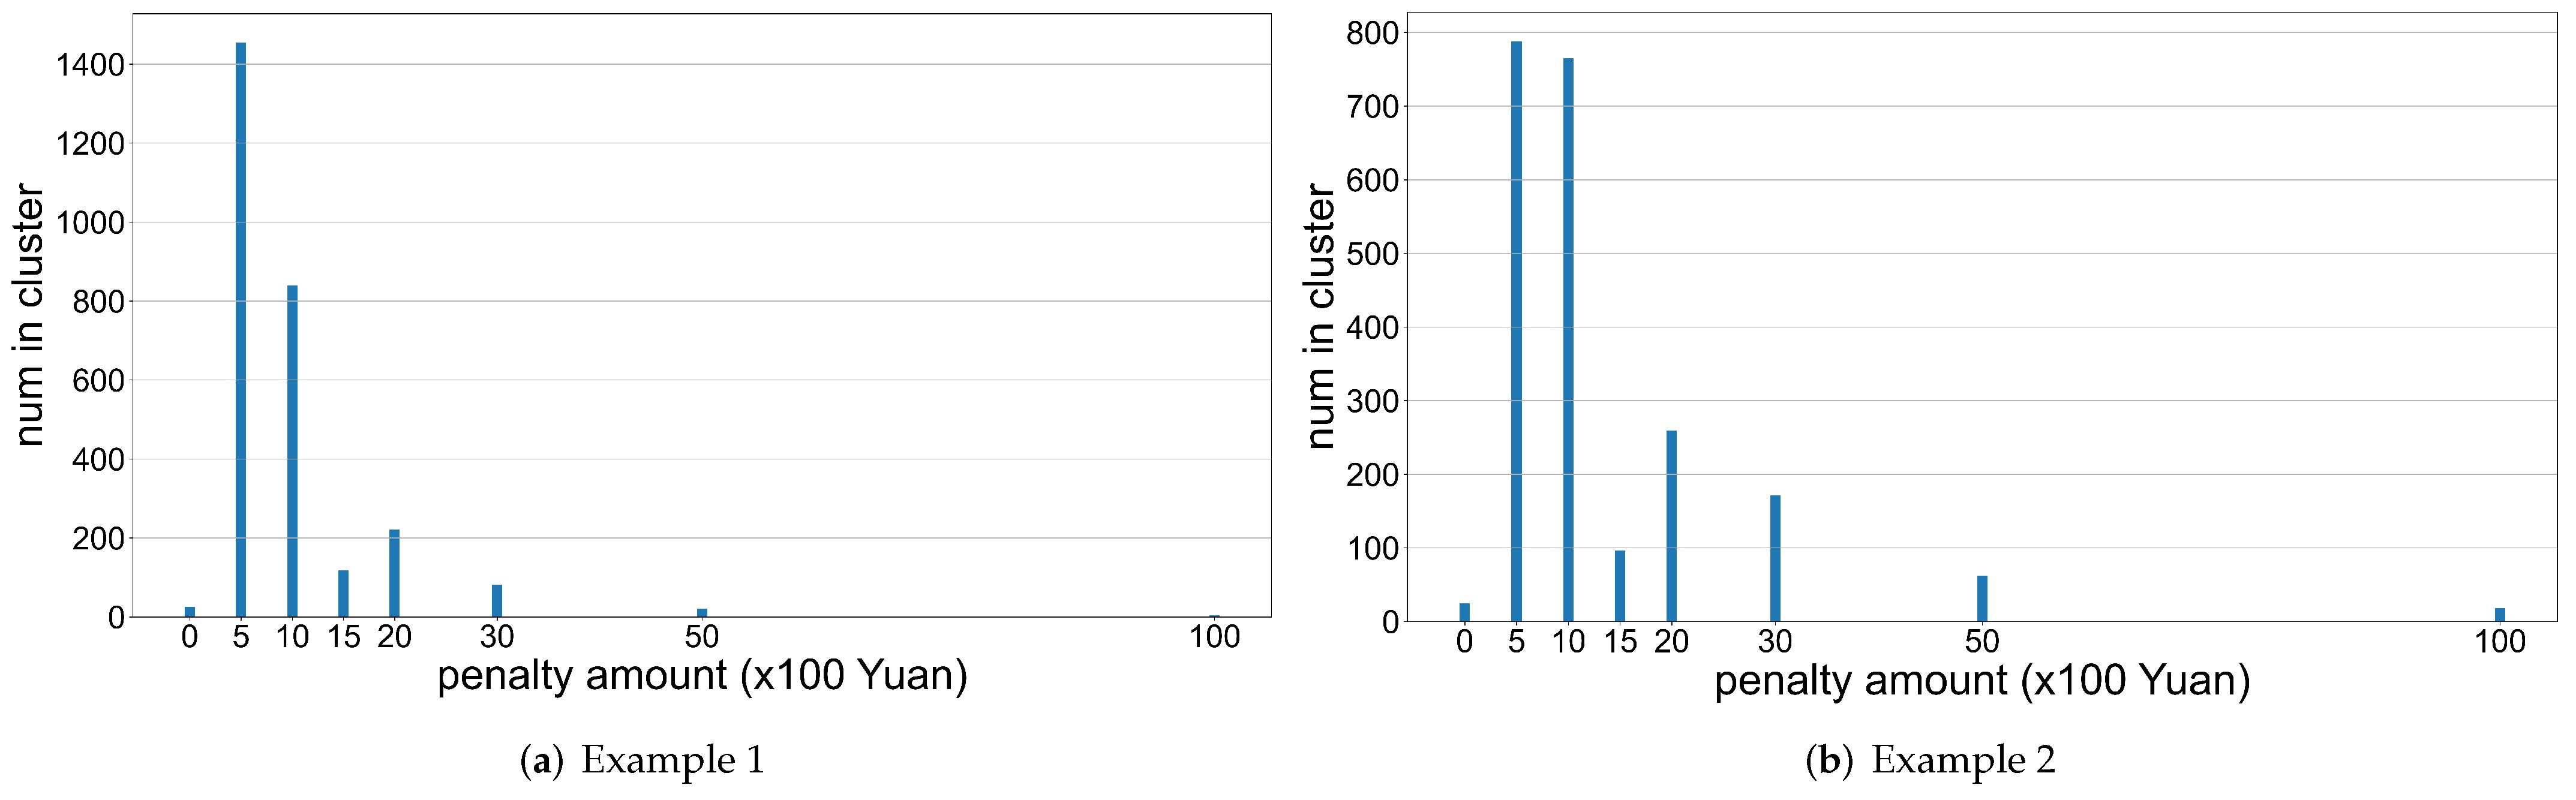
3.1.2. Identifying and Constructing Positive and Negative Samples

The samples contained within each cluster category obtained in Section 3.1.1 have similar features; that is, there is a large similarity in the punishment record, including the laws and regulations violated, the degree of violations, and other fine amount decision-making related features. Therefore, we assume that the fine amounts corresponding to these samples should be close. To practically evaluate this, we visualize the fine amounts of records within each cluster, and the results are shown in Figure 3. This indicates that most fine amounts of the punishment records are concentrated in one or a few values, which matches our hypothesis. Fine amounts that cannot always concentrate to one exact value might be caused by the ambiguity in the definition of the regulations since there is no quantitative indicator of the degree of violation in the punishment records. Even if the regulations violated are exactly the same, the degree of violation may vary greatly, which leads to differences in the amount of discretion.
Based on the assumption and the visualization results shown above, we further assume that the values of fine amounts within each cluster should obey a Gaussian distribution or a mixture of Gaussian distributions. We make use of this assumption by giving the most frequent penalty amount A f in each cluster with the highest credibility, which means a judgment with A f is considered reasonable and whose confidence level is assigned 1. The confidence level for the other samples is 0. By such means, we encourage the fine amount prediction model to predict similar values for similar input features, and encourage the punishment reasonableness judgment model to record the values with the highest credibility.

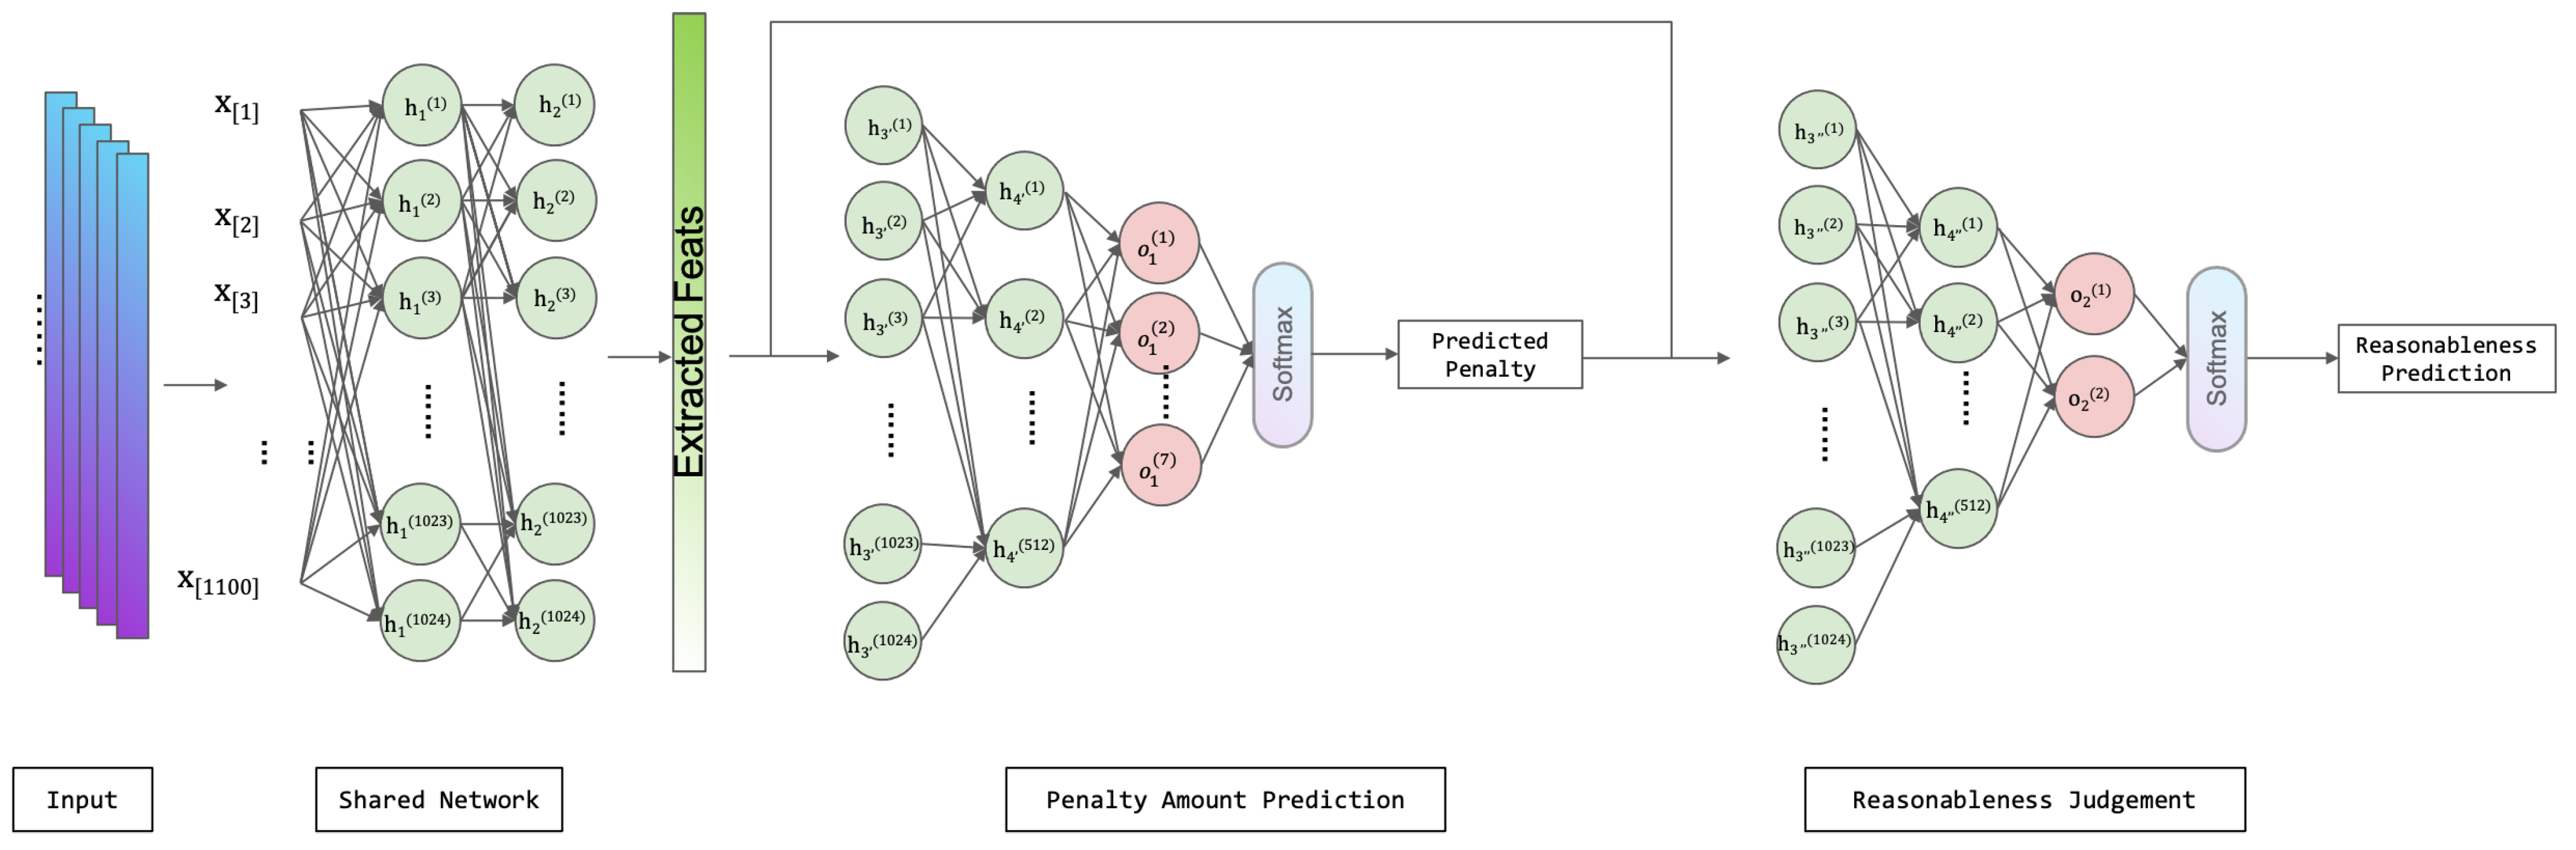
3.2. Network Architecture

The main contribution of this paper is to design the multi-task deep learning model of the CADRE framework: given a punishment record to be fined containing the economic type, industry type, punishment basis and other information about the irregularities, the model predicts a fine amount, and given an existing fine record containing the information described above together with an already existing fine amount, the model judges the credibility of the penalty.
The overall framework is based on multi-task learning, using multi-layer feed-forward networks with gradient backpropagation (BP) optimization to implement the tasks of prediction and judgment simultaneously. The model consists of shared layers between two tasks and two sub-task branches.
We reconstruct the fine amount prediction problem into a classification problem to avoid noises in the data. As the actual values of the fine amounts are continuous and most of the values are concentrated on small fine amounts, the data are heavily unbalanced and it is extremely difficult to predict rather high values, which will be discussed later in Section 4.1. As most of the values are close to a few specific values, we chose them as the prediction targets and classified other values into the class closest to them. In this way, we change the fine amount prediction problem from a regression problem into an eight-way classification problem, noises such as minor perturbations in the amount of fines can be ignored, and it becomes feasible to predict a huge range of fine amounts.
The input data are feature vectors with a dimension of 299, including the economic type, industry type, punishment basis, etc. The details of these data will be discussed in Section 4.1. The entire network consists of a shared feature encoding network, followed by two sub-networks: one for penalty amount prediction and another for credibility evaluation. Therefore, the two tasks can be accomplished with one single model. Given an existing fine record with a fine amount already decided, the shared network and the reasonableness judgment sub-network is used, and given a new case to be fined, the entire network is used: the shared network extracts and encodes information that will be sent to both branches, the fine amount prediction sub-network tries to predict a reasonable fine amount, and the credibility evaluation sub-network judges whether the decision made by the former sub-network is reasonable or not. The network behaves in a multi-task manner, and by such means, the two sub-networks within the model can cooperate: the first penalty amount prediction sub-network tries to better predict the fine amount, and the second penalty amount’s reasonableness judgment sub-network tries to identify irrational predictions better. Either sub-network produces more data for the other sub-network, which acts as a data augmentation method, making better use of the dataset.
The shared part of the model contains an input layer and two hidden layers with 1024 units in each. Each sub-network consists of one hidden layer with 1024 units, another hidden layer containing 512 units, and a final output layer. The ReLU [36] activation function is used in the input layer and each hidden layer, and the Softmax activation function is used in the output layer.
The overall model accepts the historical penalty records after the data pre-processing procedure, which are processed by the shared layers and used as the input of the two branches. The two branches are fed with the same data encoded from original case information, while the reasonableness judgment branch relies on the output of the penalty prediction branch. The output of penalty prediction is transformed to one hot form, spliced with the features extracted from the shared layer, and set as the input for the reasonableness judgment branch. The overall model structure is shown in Figure 4.

3.3. Training Scheme

As discussed and presented in Algorithm 1, the dual-task model is composed of two sub-models and the output of either sub-model is a classification result. Therefore, we use Cross Entropy Loss (CEL) as the loss function for both penalty prediction and credibility judgment, as Equation (1) shows:
C E L = 1 N i = 1 N j = 1 C y ^ j ( i ) ln y j ( i )
Algorithm 1: The two-stage training method of the multi-task penalty amount prediction and reasonableness judgment model
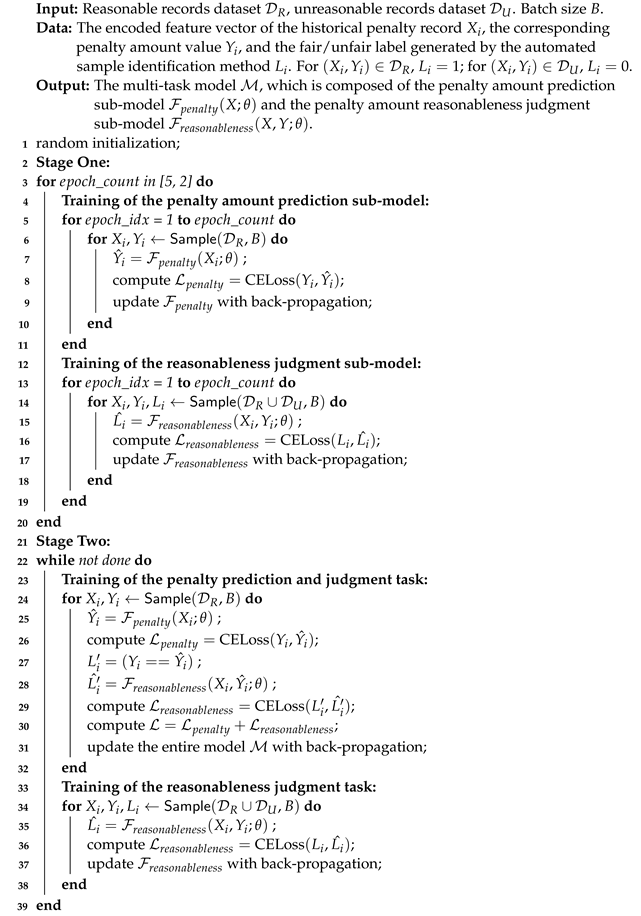
Electronics 11 01388 i001
The CADRE framework is designed for two scenarios. One is a reasonableness judgment for existing punishment records with fine amount decisions already made beforehand, and another is the penalty amount prediction for new-coming punishment records whose corresponding fine amount is to be predicted. As a result, different parts of the entire model will be used for a different task: for the first reasonableness judgment task, the shared network layers and the reasonableness judgment sub-model is used, and for the second fine amount prediction task, the entire model, including the shared network layers and both the reasonableness judgment sub-model and the fine amount prediction sub-model, is used.
Here, we will discuss how the CADRE framework is trained to accomplish both scenarios. The collected records are classified into fair and unfair ones with the unsupervised automatic penalty record identification method described in Section 3.1.2 first. Then, each category of the data is treated differently when training the model. The unfair punishment records can only be used to train the reasonableness judgment sub-model as no ground truth for the penalty amount prediction task is available. The encoded features and the corresponding penalty amount values are the input of the shared network layers and the reasonableness judgment sub-model, and the ground truth for the reasonableness judgment task is unfair. At the same time, the records that are labeled as fair can be used to train the entire network, including the shared feature extraction and encoding network layers and both sub-models. The feature vector of each slice of data serves as the input of the whole model, and the corresponding penalty amount value serves as the ground truth of the fine amount prediction task, while the ground truth of the reasonableness judgment task depends on whether the predicted fine amount matches its target. In addition to this, the records recorded as fair can also be used to train the reasonableness judgment network similar to the unfair ones.
The above-described behavior can be concluded in Table 1. We designed two tasks according to the actual application scenarios of the CADRE framework, and two kinds of losses are computed: the reasonableness judgment task, which uses all the data and only trains the reasonableness judgment sub-model with the credibility evaluation loss, and the fine amount prediction task, which only uses punishment records which are labeled as fair ones, and trains the entire model with both the penalty amount prediction loss and the credibility evaluation loss.
The above multi-task model is trained with an Adam optimizer in a two-phase alternative training manner from scratch. In the first burn-in phase, the penalty amount prediction task and the reasonableness judgment task are trained separately: the model is first randomly initialized, and afterward the penalty amount prediction sub-model composed of the shared network layers and the penalty amount prediction network branch is trained with records labeled as reasonable for five epochs. The encoded feature vectors serve as the input, and fine amount values in the records are the target prediction; then, the reasonableness judgment sub-model composed of the shared network layers and the reasonableness judgment network branch is trained with all records for five epochs, and the encoded feature vectors together with the fine amount values are the input and the target predictions are the fair/unfair labels generated by the unsupervised automatic identification method. Then, the above process is repeated, but with the difference that each task is only trained for two epochs. After the first burn-in phase, in the second phase the model is trained with two tasks, described as Table 1, or alternatively, each task for one epoch.

4. Experiments

We constructed a large-scale health administrative penalty historical record dataset and further conducted experiments with the dataset to reveal the effectiveness of the proposed CADRE framework.
In this section, we first introduce the data composition of the collected large-scale health administrative penalty record dataset and the pre-processing and data embedding operations. To the best of our knowledge, this is the largest dataset of health penalty records available. Then, to show the effectiveness of the proposed CADRE framework, we conducted experiments on different models with the above dataset and compared the performance of the CADRE framework with other models. We will explain the experimental setup and the detailed results.

4.1. Data Introduction and Pre-Processing

The penalty records are collected from the healthcare-related administrations of China from 2955 districts in 364 cities of 32 provinces over three years, from 2018 to 2020. Each record contains the area code, the economic type (including private, state-owned, collective ownership, etc.), the industry type, the punishment basis (including the laws and regulations violated and the severity of the violation), the punishment decision (the specific choice of the punishment), the value of the penalty, and other relevant information. A total number of 497,354 fine records were collected, specifically 93,562 fine records in 2018, 216,036 in 2019, and 187,756 in 2020.
The original records are cleaned and the above-mentioned features in the records are extracted and encoded to embedding vectors. They will be sent to the subsequent CADRE framework as input. The embedding vectors includes the following information: the economic type code, which mainly includes limited liability, state-owned and private companies; the primary industry type, which mainly includes public places, medical and health-related places, and drinking water-related places; the secondary industry type, which mainly includes beauty salons, barbershops, hotels, etc.; the punishment basis, including the specific statute violated and the specific terms in it; the punishment decision, including order to rectify, warning, and fine; and the final penalty amount value. If one record lacks the punishment basis, the record will be discarded; if the record lacks the economic type code, primary type, secondary type, or punishment decision, the lacking item will be filled with NaN; and if the record lacks the fine amount, 0 is filled.
As the punishment basis in the punishment records is written in natural language and lacks a standard format, we performed regular matching to extract the name of the laws and regulations together with the specific terms, to be specific, the chapter number, the section number and the article number. If the punishment record of one punishment record cannot be matched with any laws or regulations, the record will be discarded. If one or more of the chapter number, the section number or the article number is absent, NaN is filled in. We call one article within one section and a chapter of a regulation a punishment basis, and the number of punishment bases within each punishment record is illustrated in Figure 5. As the figure shows, most fine records contain only three or fewer fine bases. To save computing costs and improve efficiency, within each record, only the three most frequent items among all data are kept for the subsequent model training and prediction.
To reduce the dimension of feature codes, we sorted the economic type codes, primary industry types, secondary industry types, laws and regulations, and punishment decisions according to their frequency of occurrence, as shown in Figure 6. Items with frequencies less than 1000 are removed.
After performing the above-described data cleaning and feature extraction process, the selected features are encoded to one-hot encoded vectors, and the encoding of each vector is concatenated into a feature vector that represents the entire punishment record. The dimension of each feature is shown in Table 2, and the composition of the entire feature vector is shown in Figure 7.
Since the original fine amount is a continuous value, and there is a problem of long-tailed distribution of the data, to reduce the difficulty of neural network training, we counted the frequency of different fine amount values among all penalty records, as shown in Figure 8. We selected eight penalty amounts with the highest frequency of occurrence, respectively 0, 500, 1000, 1500, 2000, 3000, 5000, and 10,000, as the penalty levels to be predicted, and the actual penalty values are grouped into the nearest level.
After the above-described data pre-processing process, the data are sent to the CADRE framework as input, as described in Section 3.
Although the data processing method proposed in this paper is for Chinese laws, it is equally applicable to laws of other countries with some degree of adaptation. The economic type code, primary type, secondary type, and penalty decision can be modified to other classification features depending on the specific situation. Penalty basis is the key feature for fine amount prediction and fine abuse detection, which requires the user to provide the name of the regulation and collect the related punishment records. Using the regular matching method proposed in this paper, we can extract the name, article, subsection and subparagraph of the regulation from the collected data. After the above features are collected and extracted, the features can be encoded using the one-hot code encoding method proposed in this paper, and then fed into the neural network model proposed in this paper for training to predict the amount of fines and fine abuse for other countries’ laws.

4.2. Experiment Setup

Dataset: The above-described large-scale punishment record dataset, which contains encoded feature vectors of 399,470 records, is randomly divided into the training set, the validation set and the test set with respect to the ratio of 7:2:1. The records are labeled as fair or unfair with the unsupervised automated sample identification and dataset construction method of the CADRE framework, and the following experiments and comparisons between the multi-task model of the CADRE framework and other baseline methods are performed on the obtained labeled dataset.
Baseline methods: The baseline methods for comparison include Support Vector Machine (SVM) [19] and Random Forest [37]. Furthermore, to reveal the effectiveness of the proposed punishment record’s reasonableness judgment and penalty amount prediction multi-task network and the multi-task two-phase alternative training method, we also compare the proposed model with two single-task versions of it.
SVM is a classical method for classification problems. Its optimization objective is to obtain the optimal hyper-plane such that the two types of data are separated to either side of the hyper-plane, and for linearly inseparable data, a kernel function is used to map the data into a high-dimension feature space, and thereby the mapped data can be linearly separated. For a multi-class classification problem, SVM can solve it by dividing it into several binary classification problems.
Random Forest is another learning method for classification, regression and other tasks. It is an ensemble learning method that constructs a multitude of decision trees at training time. For classification tasks, the output of the random forest is the class selected by most trees.
The single-task versions of the proposed multi-task model within the CADRE framework is constructed based on the multi-task version: the multi-task model is composed of two sub-models, one for penalty amount prediction and one for penalty amount reasonableness judgment, and the multi-task model is trained in a two-phase method as explained in Section 3.3, and we removed this two-phase multi-task training method and replaced it with training each sub-model separately. Compared with the multi-task version, the main difference in the single-task version is the predicted penalty amount value is not further judged by the reasonableness judgment sub-model; thus, the hierarchical multi-task framework and the cooperation and supervision of the reasonableness judgment sub-model to the penalty amount prediction sub-model is removed.
Metric: This paper uses accuracy as the evaluation metric for both tasks. The classification results can be classified into the four cases in Table 3. Therefore, the accuracy is calculated as shown in Equation (2).
a c c = T P + T N T P + F P + T N + F N

4.3. Penalty Amount Prediction for New Penalty Records

We first performed experiments to verify the effectiveness of the proposed multi-task model of the proposed CADRE framework for the first task: given a new-coming punishment record to be fined, the model predicts a penalty amount value for it.
After training on the training set and hyper-parameter selection on the validation set, the baseline models, including SVM, Random Forest and the penalty amount prediction single-task version of the proposed deep learning model, and the proposed multi-task model are used to predict fine amount values for records which are labeled fair in the testing set. As there are no fair amount values for records labeled unfair, these records are discarded. The obtained results are shown in Table 4, respectively.
When predicting penalty amount values for new-coming punishment records, the output of the reasonableness judgment sub-model of our proposed multi-task model can also provide a credibility score to indicate the confidence of the prediction: when the credibility score is high, the predicted penalty amount value is trustworthy, and when it provides a low credibility score, the users of the CADRE framework, mostly the administrative officers, can rely more on their own judgment, thereby reducing the impact of model errors. Thus, the reasonableness judgment result of the model should be “reasonable” for a correct fine amount, and “unreasonable” for the fine amount mismatched with the value in the original record. The accuracy of the fine reasonableness judgment sub-model’s prediction for the penalty amount prediction sub-model’s output is 99.5%.
Based on the results of the fine amount prediction experiments and the comparison with the baseline methods, the multi-task model together with the multi-task two-phase training proposed in this paper can achieve a more accurate prediction of the fine amount values for health administrative punishment records. Furthermore, the proposed multi-task model has a significant performance improvement compared with its penalty amount prediction single-task version obtained by removing the fine reasonableness prediction branch. This demonstrates that by modeling the relationship between the two tasks, the model achieves joint optimization of the two tasks, enabling the shared network layer to extract features that are related and helpful for both interdependent tasks and to remove irrelevant features from the input feature vector, ultimately achieving performance enhancement.
However, due to the difficulty of the fine prediction problem itself, discovering an unfair or untrustworthy penalty record is much simpler than predicting a fair penalty amount value for it. For example, through the data analysis, we found some historical records that share the same contents, such as the industry type, the punishment basis, and the penalty behavior, except for time and location, but the final penalty amount varies greatly. We consider that the existing records lack a detailed description of the actual situation, including the degree and the severity of violation of each regulation in the punishment basis; thus, there are practical difficulties to complete a very accurate fine amount prediction by the existing data. To reduce the impact of inaccurate prediction, we introduced the fine reasonableness prediction task as an indicator, and the result shows that this goal can be accurately accomplished.

4.4. Reasonableness Judgment for Existing Penalty Records

Next, we performed experiments to verify the effectiveness of the proposed multi-task model of the CADRE framework for the second task: given an existing punishment record with penalty amount values already existing in the database, the model needs to judge the reasonableness of the fine amount.
The encoded feature vector of the punishment records and the corresponding fine amount values are given to the models, including the baseline models and the proposed model as input, and the models judge the reasonableness of the input punishment records. The ground truth labels for such records are generated by the automated sample identification method in the CADRE framework, and all records, together with their corresponding labels, are adopted. The accuracy values of the reasonableness judgment results are shown in Table 5.
The performance of the multi-task model exceeds the performance of both baseline methods and the single-task reasonableness judgment version of the proposed model with a large margin, which demonstrates that the proposed model can better judge the reasonableness of the penalty amount decision for existing punishment records and to detect unfair cases and administrative power abuse.
The overall results for all experiments and comparisons between the proposed multi-task model with baseline methods and the single-task version of the proposed model demonstrate the effectiveness of both tasks. The proposed multi-task model is able to predict penalty amount values for new punishment records, judge reasonableness for existing punishment records and detect unfair cases among all data. The proposed multi-task design and the two-phase multi-task training method are proved to be effective; there is a significant improvement in the performance of the multi-task model compared with its single-task versions. Based on the proposed CADRE framework, we developed an automated health administrative law enforcement supporting system, as will be described in Section 5.

5. Applications

To aid in the enforcement process of health enforcement officers and to reduce the inappropriate exercise of enforcement powers, based on the proposed CADRE framework, together with the IoT and cloud service technology, we developed an automated health administrative law enforcement supporting system. In this chapter, we will introduce the developed law enforcement assistance system, including the structure of the system and the implementation of each function.

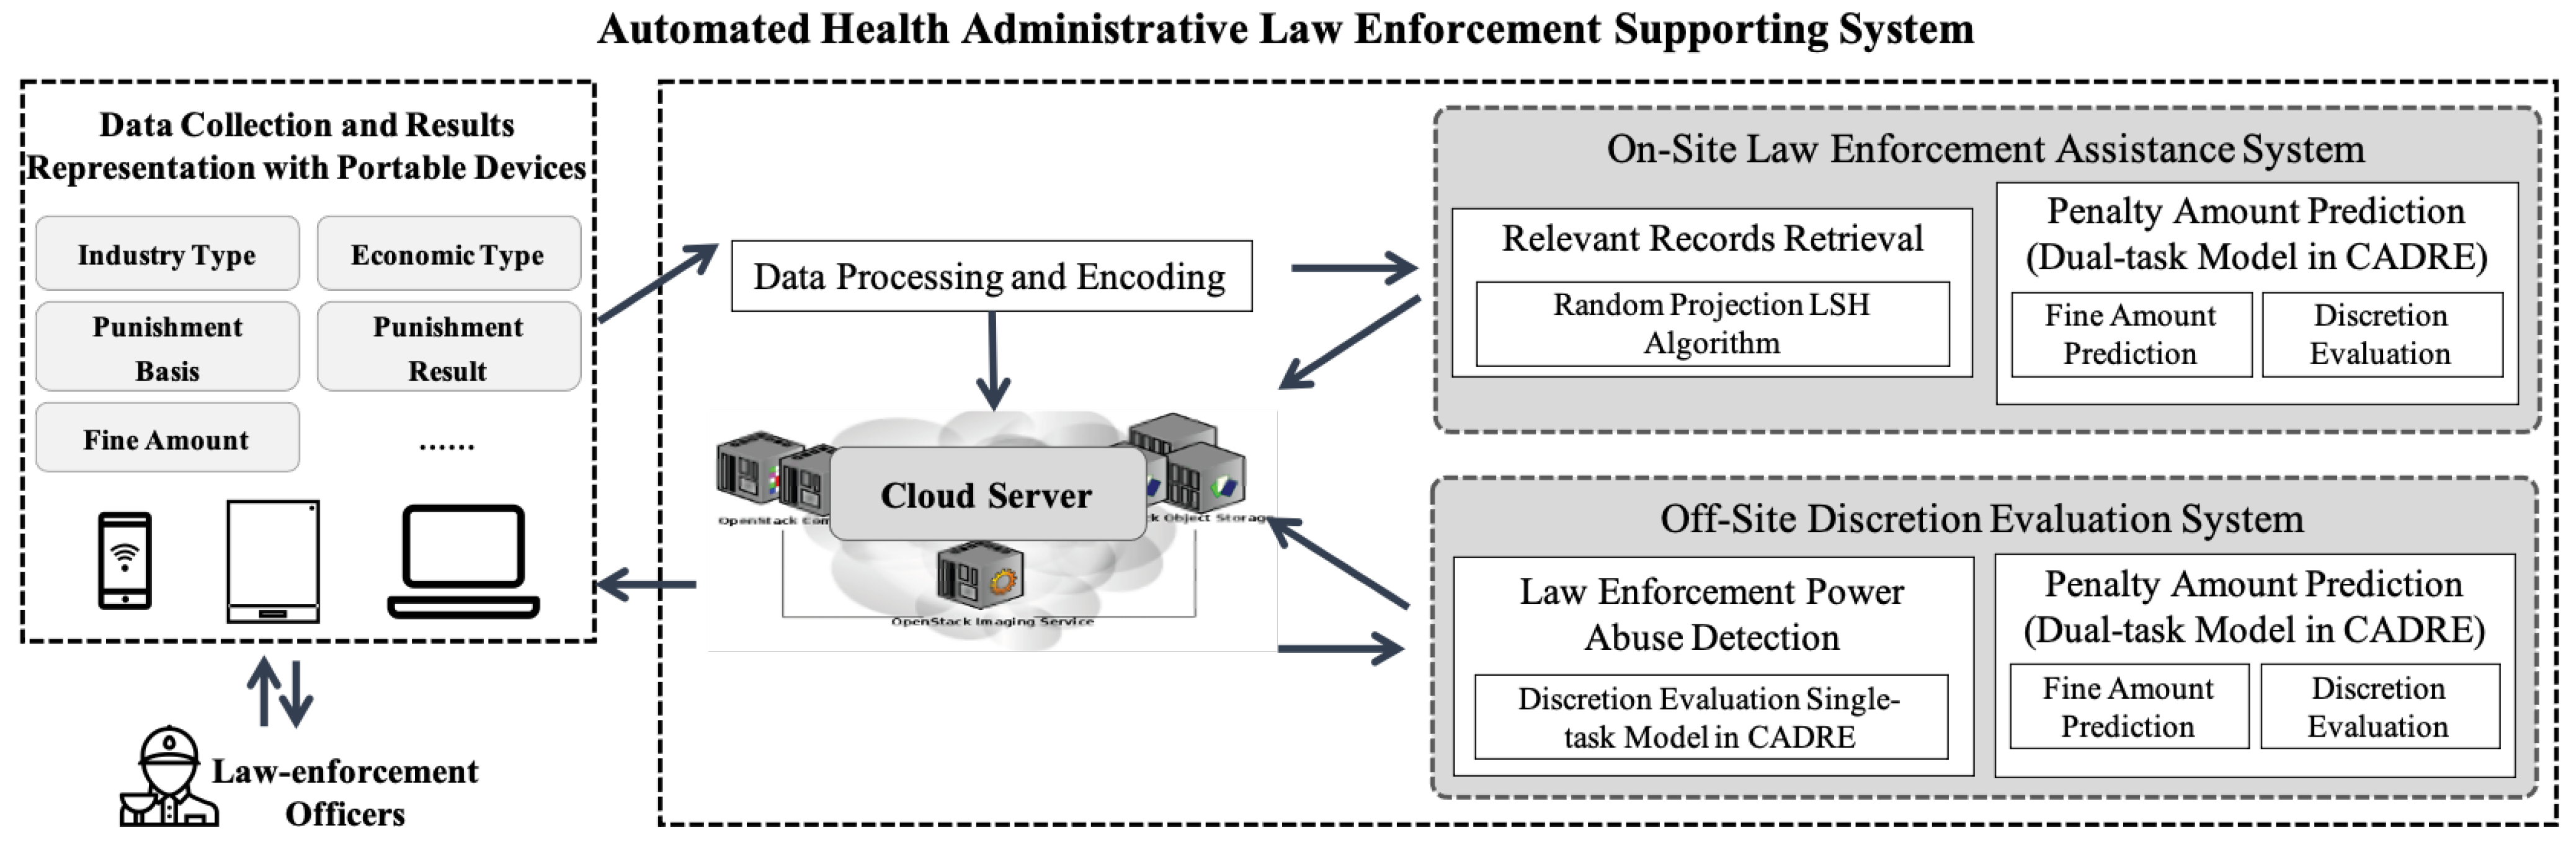
5.1. System Structure and Cloud Deployment

The system contains two functions: relevant historical retrieval and penalty amount suggestion function for law-enforcement officers during the law-enforcement process, and the discretion evaluation system for historical records. During the enforcement process, the system can discover the most relevant historical cases to be referred to for the officers, and generate a suggested fine amount. For the existing punishment records in the database, unreasonable fines with improper enforcement can be discovered with the system. In order to achieve the above two functions, the system is mainly composed of portable devices for data collection, result presentation and user interaction, as well as a cloud server for data storage and computing, as Figure 9 shows.
We developed a mobile application that runs on portable devices such as mobile phones, tablets and laptops, and the punishment records are collected with such portable devices. The collected data are then transferred to the cloud platform for storage, penalty amount suggestion and discretion evaluation. The cloud platform comprises a database, the on-site law enforcement assistance system, and the off-site discretion evaluation and power abuse detection system running on it. Next, we will introduce the implementation process of the above two functions.

5.2. On-Site Law Enforcement Assistance System

The on-site law enforcement assistance system is composed of two functions. The first one is the relevant historical records retrieval function and the second one is the suggestive penalty amount prediction function.
The administrative law-enforcement offices carry the devices during the law-enforcement process, document information about the actual situation as illustrated in Figure 10, and receive advice from the support system, including the most relevant, or to say the most similar, the most informative historical records to the current situation, and a suggested penalty amount to be referred to, as shown in Figure 11.
When the collected data are transferred to the cloud platform, the data are first stored in the database, and then the data pre-processing and data encoding steps are performed on the data as described in Section 4.1. Then, the historical records that are most relevant to current law enforcement records will be retrieved, and the suggested predicted penalty amount values, together with the confidence scores of the predictions, are generated.
The predicted value of the penalty amount together with the confidence score of the prediction is generated with the CADRE framework: the encoded feature vectors of the records are sent to the multi-task model to predict penalty amount values together with the confidence of the prediction with two sub-models within the multi-task model, as described in Section 3, and the similar historical records retrieval function is implemented with the Random Projection [38] method of the locality sensitive hashing (LSH) [39] algorithm.
The purpose of the LSH algorithms is to construct an appropriate hash function to hash similar input data into the same ‘buckets’ with a high probability; thus, the LSH algorithms can be used for fast approximate nearest neighbor searching. The LSH algorithms are composed of a number of different methods, each of which differs in the choice of the similarity evaluation indicators, such as MinHash [40], table distributions [41], Random Projection [38], etc. In this paper, we select the cosine similarity evaluation function and use the Random Projection method of LSH to retrieve and recommend similar judgment historical records.
The main idea of Random Projection is to randomly select n hyper-planes for the m-dimensional feature vectors, and let the normal vectors of these hyper-planes be n o r m 1 , , n o r m n ; then, for each feature vector v in the dataset, it can be hashed to an n-bit code c, and for the i-th bit c i :
c i = 1 , v · n o r m i > 0 0 , v · n o r m i < 0
That is, for the selected i-th hyper-plane, we judge whether the feature vector and the normal vector are on the same side of the hyper-plane; c i is assigned 1 when they are on the same side, and otherwise c i is assigned 0. c has a total number of 2 n possible values, corresponding to 2 n buckets; thus, the Random Projection LSH algorithm can be used to assign the feature vectors in the dataset into the buckets. The approximate nearest neighbor feature vector of a given feature vector is discovered by calculating the bucket to which the vector belongs and returning a non-empty feature vector within the bucket with the smallest Hamming distance to the given vector.
In our developed relevant historical punishment record retrieval function of the on-site law enforcement assistance system, the Random Projection LSH algorithm is performed to the encoded punishment record feature vectors to calculate the hash value of the feature vector, and thus the data with the same hash value are assigned to the same category, which forms the hash database. When a new collected punishment record is transferred to the cloud server and encoded, the system calculates the hash value of the feature vector, and matches it in the hash database. If the same hash value and its corresponding historical fine records are found in the database, these retrieved records and their corresponding penalty amount values will be demonstrated to the users with the portable devices.

5.3. Off-Site Discretion Evaluation and Law Enforcement Power Abuse Detection System

For the punishment records already in the database, the off-site discretion evaluation and law enforcement power abuse detection system can judge whether such records are fair or unfair, thus being able to evaluate the reasonableness of the discretion and detect unfair historical cases of possible law enforcement power abuses. The main component of the system is the reasonableness calculation method implemented based on the multi-task model within the proposed CADRE framework; the penalty amount prediction branch is removed, leaving the reasonableness judgment sub-model alone and forming the single-task reasonableness judgment model. The pre-processed historical punishment records are encoded and further judged by the system, and the detected possibly unreasonable cases are shown by the portable devices, as shown in Figure 12. Moreover, the system then predicts a suggestive penalty amount value for those detected unreasonable historical records.

6. Conclusions

This paper studied the discretionary power in the execution of health and sanitary punishments, proposed the Contrastive Discretion Evaluation (CADRE) framework to learn from the unlabelled historical punishment records, be able to predict a fair penalty amount value for a new record and identify unfair cases among historical records, and finally developed an automated health administrative law enforcement supporting system to assist in the law enforcement process.
We first discussed the meaning and content of discretionary power. Through the analysis of relevant regulations and actual situations, we found that discretionary power is prone to be inappropriately used or even abused in the process of actual law enforcement. To address such problems, we propose a method to automatically predict penalty amount values for new-coming punishment records that are to be fined and judge the reasonableness of existing punishment records with fine amount values already decided previously. However, collecting a labeled large-scale health administrative law enforcement record dataset requires laborious human work to label the collected punishment records as fair or unfair cases. To alleviate the model’s demand for a large-scale labeled dataset and to take in as many collected actual punishment records as possible, we proposed an unsupervised automatic punishment record identification method and built the large-scale dataset with this method. Then, we proposed a multi-task model composed of a penalty amount prediction sub-model and a reasonableness judgment sub-model. The two tasks can co-operate with each other: when predicting the penalty amount, the reasonableness judgment sub-model judges the reasonableness of the prediction, which serves as supervision for the penalty amount prediction sub-model, and the prediction of the penalty amount sub-model serves as an extension of the original dataset, which may improve the performance of the reasonableness model. The effectiveness of the proposed multi-task model is demonstrated with experiments: the performance not only exceeds the baseline models by a large margin, but also exceeds the single-task versions of the proposed multi-task model, which further demonstrates the effectiveness of the multi-task framework design and the two-phase multi-task training method. Finally, based on the multi-task model pretrained with the punishment record dataset generated with the sample identification and dataset construction method, we developed an automated health administrative law enforcement supporting system, which is composed of the on-site law enforcement assistance system and the off-site discretion evaluation and law enforcement power abuse detection system. The overall law enforcement supporting system is based on IoT and cloud computing technology. The data collection, result presentation and user interaction are implemented with portable devices, and the data storage and computing are implemented with a cloud server.

Author Contributions

Conceptualization, H.W. and X.L.; methodology, H.W.; software, H.X. and Y.Z.; validation, H.W., H.X. and Y.Z.; formal analysis, H.W., H.X. and Y.Z.; investigation, H.W.; resources, X.L.; data curation, X.L.; writing—original draft preparation, H.W, H.X. and Y.Z.; writing—review and editing, H.W.; visualization, H.X. and Y.Z.; supervision, X.L.; project administration, H.W.; funding acquisition, X.L. All authors have read and agreed to the published version of the manuscript.

Funding

This research received no external funding.

Data Availability Statement

The data presented in this study are available on request from the corresponding author. The data are not publicly available due to privacy and administrative issues.

Conflicts of Interest

The authors declare no conflict of interest.

References

  1. Cao, W.; Wan, L.; Tang, L.; Zhao, Y.; Chen, G. Compilation and Dynamic Adjustment of Health Administrative Law Enforcement Powers and Responsibilities list. Chin. J. Health Insp. 2021, 28, 320–326. [Google Scholar]
  2. Zhang, W. A Cognitive Study on the Implementation of Discretionary Power of Administrative Punishment of Medical and Health Supervisors in a Province. Master’s Thesis, Jilin University, Changchun, China, 2019. [Google Scholar]
  3. Li, B.; Li, J.; Huai, J.; Wo, T.; Li, Q.; Zhong, L. EnaCloud: An energy-saving application live placement approach for cloud computing environments. In Proceedings of the 2009 IEEE International Conference on Cloud Computing, Bangalore, India, 21–25 September 2009; pp. 17–24. [Google Scholar] [CrossRef]
  4. Li, J.; Li, B.; Wo, T.; Hu, C.; Huai, J.; Liu, L.; Lam, K. CyberGuarder: A virtualization security assurance architecture for green cloud computing. Future Gener. Comput. Syst. 2012, 28, 379–390. [Google Scholar] [CrossRef] [Green Version]
  5. Shi, L.L.; Liu, L.; Wu, Y.; Jiang, L.; Panneerselvam, J.; Crole, R. A Social Sensing Model for Event Detection and User Influence Discovering in Social Media Data Streams. IEEE Trans. Comput. Soc. Syst. 2020, 7, 141–150. [Google Scholar] [CrossRef]
  6. Mumin, D.; Shi, L.L.; Liu, L.; Panneerselvam, J. Data-driven diffusion recommendation in online social networks for the internet of people. IEEE Trans. Syst. Man Cybern. Syst. 2020, 52, 166–178. [Google Scholar] [CrossRef]
  7. Keown, R. Mathematical models for legal prediction. Computer/lj 1980, 2, 829. [Google Scholar]
  8. Chen, T.; Kornblith, S.; Norouzi, M.; Hinton, G.E. A simple framework for contrastive learning of visual representations. In Proceedings of the 37th International Conference on Machine Learning, ICML 2020, Virtual Event, 13–18 July 2020; Volume 119, pp. 1597–1607. [Google Scholar]
  9. He, K.; Fan, H.; Wu, Y.; Xie, S.; Girshick, R.B. Momentum contrast for unsupervised visual representation learning. In Proceedings of the 2020 IEEE/CVF Conference on Computer Vision and Pattern Recognition, CVPR 2020, Seattle, WA, USA, 13–19 June 2020; pp. 9726–9735. [Google Scholar] [CrossRef]
  10. Ruder, S. An overview of multi-task learning in deep neural networks. arXiv 2017, arXiv:1706.05098. [Google Scholar]
  11. Jalali, A.; Sanghavi, S.; Ruan, C.; Ravikumar, P. A dirty model for multi-task learning. In Advances in Neural Information Processing Systems; Lafferty, J., Williams, C., Shawe-Taylor, J., Zemel, R., Culotta, A., Eds.; Curran Associates, Inc.: Red Hook, NY, USA, 2010; Volume 23. [Google Scholar]
  12. Crammer, K.; Mansour, Y. Learning multiple tasks using shared hypotheses. In Advances in Neural Information Processing Systems; Pereira, F., Burges, C.J.C., Bottou, L., Weinberger, K.Q., Eds.; Curran Associates, Inc.: Red Hook, NY, USA, 2012; Volume 25. [Google Scholar]
  13. Yang, X.; Zeng, Z.; Yeo, S.Y.; Tan, C.; Tey, H.L.; Su, Y. A novel multi-task deep learning model for skin lesion segmentation and classification. arXiv 2017, arXiv:1703.01025. [Google Scholar]
  14. Yang, Y.; Hospedales, T.M. Trace norm regularised deep multi-task learning. arXiv 2016, arXiv:1606.04038. [Google Scholar]
  15. Sun, T.; Shao, Y.; Li, X.; Liu, P.; Yan, H.; Qiu, X.; Huang, X. Learning sparse sharing architectures for multiple tasks. In Proceedings of the Thirty-Fourth AAAI Conference on Artificial Intelligence, AAAI 2020: The Thirty-Second Innovative Applications of Artificial Intelligence Conference, IAAI 2020: The Tenth AAAI Symposium on Educational Advances in Artificial Intelligence, EAAI 2020, New York, NY, USA, 7–12 February 2020; pp. 8936–8943. [Google Scholar]
  16. Schreiber, J.; Sick, B. Emerging relation network and task embedding for multi-task regression problems. In Proceedings of the 2020 25th International Conference on Pattern Recognition (ICPR), Milan, Italy, 10–15 January 2021; pp. 2663–2670. [Google Scholar]
  17. Nguyen, T.A.; Jeong, H.; Yang, E.; Hwang, S.J. Clinical risk prediction with temporal probabilistic asymmetric multi-task learning. arXiv 2020, arXiv:2006.12777. [Google Scholar]
  18. Chen, Z.; Jiaze, E.; Zhang, X.; Sheng, H.; Cheng, X. Multi-task time series forecasting with shared attention. In Proceedings of the 2020 International Conference on Data Mining Workshops (ICDMW), Sorrento, Italy, 17–20 November 2020; pp. 917–925. [Google Scholar]
  19. Cortes, C.; Vapnik, V. Support-vector networks. Mach. Learn. 1995, 20, 273–297. [Google Scholar] [CrossRef]
  20. MacQueen, J. Some methods for classification and analysis of multivariate observations. In Proceedings of the Fifth Berkeley Symposium on Mathematical Statistics and Probability, Oakland, CA, USA, 21 June–18 July 1965; Volume 1, pp. 281–297. [Google Scholar]
  21. Cover, T.; Hart, P. Nearest neighbor pattern classification. IEEE Trans. Inf. Theory 1967, 13, 21–27. [Google Scholar] [CrossRef]
  22. Kong, S.; Li, Y.; Wang, J.; Rezaei, A.; Zhou, H. KNN-enhanced Deep Learning Against Noisy Labels. arXiv 2020, arXiv:2012.04224. [Google Scholar]
  23. Schmarje, L.; Brünger, J.; Santarossa, M.; Schröder, S.M.; Kiko, R.; Koch, R. Beyond Cats and Dogs: Semi-supervised Classification of fuzzy labels with overclustering. arXiv 2020, arXiv:2012.01768. [Google Scholar]
  24. Chu, Z.; Stratos, K.; Gimpel, K. Unsupervised label refinement improves dataless text classification. arXiv 2020, arXiv:2012.04194. [Google Scholar]
  25. Sculley, D. Web-scale k-means clustering. In Proceedings of the 19th International Conference on World Wide Web, Raleigh, NC, USA, 26–30 April 2010; pp. 1177–1178. [Google Scholar]
  26. Leung, K.M. Naive bayesian classifier. Polytech. Univ. Dep. Comput. Sci. Risk Eng. 2007, 2007, 123–156. [Google Scholar]
  27. Friedman, N.; Geiger, D.; Goldszmidt, M. Bayesian network classifiers. Mach. Learn. 1997, 29, 131–163. [Google Scholar] [CrossRef] [Green Version]
  28. Heckerman, D. A tutorial on learning with Bayesian networks. In Innovations in Bayesian Networks; Springer: Berlin/Heidelberg, Germany, 2008; pp. 33–82. [Google Scholar]
  29. Zhang, N.; Pu, Y.f.; Yang, S.; Gao, J.; Wang, Z.; Zhou, J.l. A Chinese legal intelligent auxiliary discretionary adviser based on GA-BP NNs. Electron. Libr. 2018, 36, 1135–1153. [Google Scholar] [CrossRef]
  30. Yeguang, Z. Classification, Prediction Method and Device for Fine Range of Long Text Cases Based on Document Embedding. 2019. Available online: http://www.soopat.com/Patent/201811237399 (accessed on 2 March 2022).
  31. Yuting, W. Deep Learning-Based Procuratorial Case Handling Auxiliary Sentencing Rule Mining. Ph.D. Thesis, North China Electric Power University, Beijing, China, 2019. [Google Scholar]
  32. Zhang, S.; Yan, G.; Li, Y.; Liu, J. Evaluation of judicial imprisonment term prediction model based on text mutation. In Proceedings of the 2019 IEEE 19th International Conference on Software Quality, Reliability and Security Companion (QRS-C), Sofia, Bulgaria, 22–26 July 2019; pp. 62–65. [Google Scholar]
  33. Pedregosa, F.; Varoquaux, G.; Gramfort, A.; Michel, V.; Thirion, B.; Grisel, O.; Blondel, M.; Prettenhofer, P.; Weiss, R.; Dubourg, V.; et al. Scikit-learn: Machine Learning in Python. J. Mach. Learn. Res. 2011, 12, 2825–2830. [Google Scholar]
  34. Halko, N.; Martinsson, P.; Tropp, J.A. Finding Structure with Randomness: Probabilistic Algorithms for Constructing Approximate Matrix Decompositions. SIAM Rev. 2011, 53, 217–288. [Google Scholar] [CrossRef]
  35. Rauber, P.E.; Falcão, A.X.; Telea, A.C. Visualizing time-dependent data using dynamic t-SNE. In Proceedings of the 18th Eurographics Conference on Visualization, EuroVis 2016–Short Papers, Groningen, The Netherlands, 6–10 June 2016; pp. 73–77. [Google Scholar] [CrossRef]
  36. Glorot, X.; Bordes, A.; Bengio, Y. Deep sparse rectifier neural networks. In Proceedings of the Fourteenth International Conference on Artificial Intelligence and Statistics, Fort Lauderdale, FL, USA, 11–13 April 2011; pp. 315–323. [Google Scholar]
  37. Breiman, L. Random forests. Mach. Learn. 2001, 45, 5–32. [Google Scholar] [CrossRef] [Green Version]
  38. Charikar, M.S. Similarity estimation techniques from rounding algorithms. In Proceedings of the Thiry-Fourth Annual ACM Symposium on Theory of Computing, Montreal, QC, Canada, 19–21 May 2002; pp. 380–388. [Google Scholar]
  39. Rajaraman, A.; Ullman, J.D. Mining of Massive Datasets; Cambridge University Press: Cambridge, UK, 2011. [Google Scholar]
  40. Broder, A.Z. On the resemblance and containment of documents. In Proceedings of the Compression and Complexity of SEQUENCES 1997 (Cat. No. 97TB100171), Salerno, Italy, 13 June 1997; pp. 21–29. [Google Scholar]
  41. Datar, M.; Immorlica, N.; Indyk, P.; Mirrokni, V.S. Locality-sensitive hashing scheme based on p-stable distributions. In Proceedings of the Twentieth Annual Symposium on Computational Geometry, Brooklyn, NY, USA, 8–11 June 2004; pp. 253–262. [Google Scholar]
Figure 1. Visualization of the clustering result. We conducted Truncated SVD and t-SNE to features of twenty clusters and plotted the feature points. Each point in the figure represents one slice of punishment data, and the color of the points demonstrates the data category.
Electronics 11 01388 g001
Figure 2. The number of fine records within each cluster. Most clusters have only a small number of records, while the expectation number of records within each cluster is 100.
Electronics 11 01388 g002
Figure 3. The (a,b) denotes the amount distribution of two representative (containing more than 1200 slices of record) clusters. The amounts are grouped into approximate categories in 0, 500, 1000, 1500, 2000, 3000, 5000, and 10,000, which are the amounts with the highest frequency of occurrence.
Electronics 11 01388 g003
Figure 4. Multi-task model for predicting the penalty and judging the credibility. The input of this model is a vector containing features representing punishment records, including economic type, industry type, punishment basis, etc. The model is composed of a shared feature extraction and encoding network and two sub-models: one for penalty prediction when given a new record without the amount to be fined, and the other is to predict credibility for an existing punishment record with the fine amount already decided. Therefore, when given a new record, the model can predict the penalty amount with the first sub-model, and the second sub-model can further judge whether the amount predicted by the first model is reasonable. The data can be better utilized and both results for penalty amount prediction and reasonableness judgement can be improved with such a method. The input vectors are encoded with the shared network layers first, and the encoded features are sent to each sub-model, respectively. The shared network is composed of two hidden layers with 1024 hidden units in each, and each sub-model is composed of one hidden layer with 1024 hidden units and another hidden layer with 512 hidden units, together with the final output unit. The prediction of the first penalty amount prediction sub-model is sent to the second reasonableness judgement sub-model as input as well.
Electronics 11 01388 g004
Figure 5. The number of punishment bases within each fine record, and as shown in the figure, most of the fine records contain only three or fewer fine bases. To save computing costs and improve efficiency, only the three most frequent items are kept for each record.
Electronics 11 01388 g005
Figure 6. The occurrence frequency of each item within punishment records. Each sub-graph corresponds to a feature in the records. In order to reduce the noise in the data and eliminate some extremely rare data that do not have much reference value for practical application, items with frequencies less than 1000 are removed.
Electronics 11 01388 g006
Figure 7. Composition of the feature vector. If any feature within the punishment record is empty, the corresponding feature embedding is filled with NaN for punishment basis (including the situation when there are only less than three punishment bases), and filled with 0 for other features.
Electronics 11 01388 g007
Figure 8. The frequency distribution of the penalty amounts in all records, and selected eight penalty amounts with the highest frequency of occurrence, respectively 0, 500, 1000, 1500, 2000, 3000, 5000, and 10,000, as the penalty levels to be predicted.
Electronics 11 01388 g008
Figure 9. Automated health administrative law enforcement supporting system.
Electronics 11 01388 g009
Figure 10. The punishment recording function of the on-site law-enforcement assistance system. The officers document information about the actual situation with the shown interface, and then recommendations will be obtained from the system. (a) Punishment recording with the mobile application. (b) Punishment recording with the website on laptops.
Electronics 11 01388 g010aElectronics 11 01388 g010b
Figure 11. The relevant historical record retrieval and suggested penalty amount prediction function of the on-site law enforcement assistance system. The suggested penalty amount value together with the confidence score of the prediction are provided to the officers, and the relevant historical records together with their corresponding penalty amount values are shown as well.
Electronics 11 01388 g011
Figure 12. The detected unreasonable historical results. The encoded historical punishment records are encoded and further judged by the off-site discretion evaluation and law enforcement power abuse detection system, and the detected possibly unreasonable cases are shown by the portable devices.
Electronics 11 01388 g012
Table 1. Explanation of loss.
TaskInputOutputLabelNetwork Components Used
reasonableness
judgment
all punishment records
& fine amount
credibilityfair/unfairshared layers,
reasonableness
judgment network
penalty
prediction
and judgment
fair punishment
records
fine amount
prediction
fine amount
in the record
shared layers,
amount prediction
network
fine amount
prediction
credibilitywhether predicted amount
matches with labels
shared layers,
reasonableness
judgment network
Table 2. Composition of the feature vector.
Feature NameNumber of Possible Values
Economic type code7
Primary Type8
Secondary Type28
Regulation name30
Chapter Number of the Regulation43
Section Number of the Regulation3
Article Number of the Regulation10
Punishment Decision10
Table 3. Four cases of classification results.
Ground Truth
PositiveNegative
PredictionPositiveTrue Positive (TP)False Positive (FP)
NegativeFalse Negative (FN)True Negative (TN)
Table 4. Results of fine amount forecast.
ModelAccuracy
SVM63.5%
Random Forest88.6%
single-task model98.5%
Multi-task model (ours)99.6%
Table 5. Results of misuse and abuse detection.
ModelAccuracy
SVM96.2%
Random Forest87.2%
single-task model96.5%
Multi-task model (ours)99.4%
Publisher’s Note: MDPI stays neutral with regard to jurisdictional claims in published maps and institutional affiliations.

