Abstract
In this paper, a diagonal permutation code is presented for spectral amplitude coding optical code division multiple access (SAC-OCDMA) employing a single photodiode (SPD) detection technique. It is characterized by practical code length and ideal in-phase cross correlation (CC) that results in multiple access interference (MAI) suppression. A diagonal permutation shift (DPS) code can be constructed using both prime codes and some matrix operations. In addition, it can be easily implemented as it exists for prime numbers P, which limits the addressing probability of codes to P2. Fiber Bragg gratings (FBGs) are used for code encoding and decoding. Simulation analysis that calibrates with BER, Q-factor, and eye diagram proves that DPS code using SPD technique is able to maintain error free transmission compared to the complementary detection scheme (CDS) technique. It is reported that a reduction of fiber Bragg grating (FBG) sets by 41.6% was achieved for SPD over CDS techniques.
1. Introduction
Recently, SAC-OCDMA systems have gained a lot of attention among OCDMA systems as they are able to completely eliminate multiple access interference (MAI) by spectral coding [1]. As the number of users increases, the bit error rate (BER) also increases as the phase-induced intensity noise (PIIN) increases through the balanced detecting schemes [2]. Unfortunately, the presence of PIIN leads to limitation of the network capacity. Many families of codes have been proposed by researchers lately for SAC-OCDMA systems that have ideal in-phase cross correlation (CC) [3,4,5,6,7]. In [5], Abd et al. proposed a new code that is dynamic cyclic shift (DCS) code and compared it with other reported codes. It shows better performance. As in this code, the number of users is the same as the code length and the code length is short, so that will cause restriction in selecting the code. In order to achieve the cyclic shift property with minimum CC, the authors considered the dynamic part D > 7 to have a CC value less than 1. Tseng and Wu in [6] constructed a partitioned partial prime (PPP) code family that has many advantages such as flexible code length, lower value for in phase CC (IPCC), excellent orthogonality, and balanced code. In addition, by comparing PPP codes with other SAC-OCDMA codes [6], it can support a large number of users as well as higher transmission rate. However, the code construction is too complicated which makes it time-consuming. Fadhil et al. [7] proposed random diagonal (RD) code for OCDMA systems. They used both code and data segments in code structure which make the code constructions easy with short code length. However, when the number of users increases, the cross correlation increases, eventually degrading the system performance. Ahmed et al. proposed a new coding scheme for spectral amplitude coding (SAC) family, known as Sigma Shift Matrix (SSM). There are two techniques for constructing SSM, lower and upper shift [8]. H.Y. Ahmed and K.S. Nisar [2] constructed Diagonal Eigenvalue Unity (DEU) code with CC ≤ 1 and different sets of code sequences. However, the code construction is complicated which is considered one of its drawbacks. Fiber Bragg gratings (FBGs) are used for encoding and decoding each user in SAC-OCDMA systems. However, when the number of active users becomes large, the sizes of FBG will become impractical.
The SAC-OCDMA code system uses low price broadband incoherent sources such as amplified spontaneous emission (ASE) and light emitting diode (LED) [9]. These sources are harmonized with the SAC-OCDMA concept by nature while implementing commercially. An incoherent sources-based SAC-OCDMA system is simple and easy to implement with extremely low price and huge optical bandwidth features with bandwidth limitation constraints at high transmission rates due to their intensity noise restricted system performance [10]. The main issue with such sources is that it provides low data rates when long distance communication is involved with high inherent intensity noise [11].
The performance of SAC-OCDMA is limited by strong noise originating from other users trying to use the medium simultaneously for transmitting concurrent data streams using the same time and frequency, referred to as Multiple Access Interference (MAI). MAI severely increases with the number of simultaneous users resulting in performance deterioration, increase in bit error rate (BER), and eventually limitation of the capacity of the system. Therefore, MAI is considered the dominant source of noise in an OCDMA system. Due to this problem, it is important that an intelligent design of the code sequence considers reducing the contribution of MAI to the total received signal [12,13]. If we have an ideal cross correlation, it helps in the balance detection scheme and the filtering will be easy, eventually leading to performance improvement.
In this paper, an efficient method is used to address the abovementioned problems by using a Diagonal Permutation Shift (DPS) code family. The new proposed code is a family of bits “0” and “1”. It characterized by L which refers to code length, N which represents the code length, code weight P (number of ones), and cross correlation λc. The DPS code family has many advantages such as good property in cross-correlation control, short code length, and easy to implement using fiber Bragg gratings (FBGs).
Moreover, both detection techniques are used with DPS code for mitigating the multiple access interferences between any two code sequences. The performance is evaluated for DPS code in terms of different transmission distance, bit error rate (BER), received power, signal-to-noise ratio (SNR), and eye diagram.
The rest of the paper is organized as follows. Section 2 provides code construction and code properties. Section 3 shows the description of the DPS system. Section 4 explains the detection techniques. Performance analysis is given in Section 5. Section 6 shows the discussion for obtained results followed by conclusion in Section 7.
2. Code Construction and Code Properties
2.1. Algorithm of Code Construction
The mathematical model of Diagonal Permutation Shift (DPS) code is presented in this section. The DPS is characterized by code weight (P), number of users (N), code length (), and cross correlation (). The construction of DPS can be done using both certain matrix operations and some simple algebraic ways. The derivation of DPS code is done by using prime code sequences that are based on the Galois field GF (P) = {0, 1, …, P − 1} for P > 2 where P is a prime number. The following steps explain how the DPS codes were constructed.
Step 1. (Diagonal process):
Construct primary diagonal sequences of integer numbers as shown in Table 1 using Equation (1).
where i and j represent the position of each element over Galois fields and mod represents the modulo operation.

Table 1.
Tabular representation of integer numbers over GF(P).
Based on Equation (1), a generator sequence is constructed as follows.
For any P, the following elements are fixed
For P = 3, the following sequences are generated based on Equation (2).
Step 2. (Permutation process):
Construct the basic matrix by taking as a first row, then make a permutation of one time in the next rows to get a zero-diagonal symmetric matrix without repeating any row as follows.
For P = 3, the following matrices are obtained based on Equation (5).
Step 3. (Shifting process):
Construct (P − 1) shifted matrices by adding K to each element of the matrix , where K = 1, 2, 3, ⋯, P − 1. In doing so, the following metrics are obtained in Equation (7).
Step 4. (Joining process):
In the joining process, matrix A is obtained by joining in each sequence, then an extra column of matrix is added to each corresponding .
where is a P × 1 matrix contains the elements in arbitrary order. The size of matrix A is and its elements where i = 0, 1, 2, , , and j = 0, 1, 2, , P.
The above four steps can be summarized in Equation (9). This equation is valid for any prime number P > 2 to generate a code with a unity cross correlation in the form of a matrix.
2.2. Code Properties
The properties of DPS code are mentioned as follows.
- A unity CC between any sequences.
- The number of users N = .
- The code weight can be any prime number greater than 2.
- The code length equals .
- Each code sequence has (P + 1) “1s” and ( − 1) “0s”.
2.3. Code Examples
The DPS code patterns for P = 3 where i = 0, 1, 2, 3, 4, 5, 6, 7, 8, and j = 0, 1, 2, 3 and using Equation (9) is shown in Table 2.

Table 2.
DPS code sequence for P = 3.
3. DPS System Description
Figure 1 shows the transmitting/receiving structure based on the DPS code sequence for P = 3. As cleared from Figure 1a, the transmitter consists of ON/OFF Keying (OOK) modulation for encoding User#1 information that is 100010010100 as tabulated in Table 2.
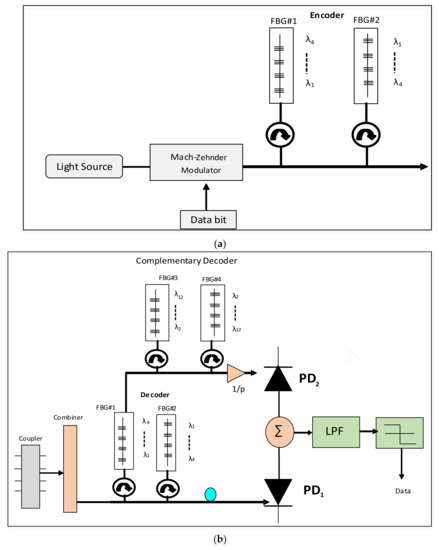
Figure 1.
Block diagram implementation of DPS code for P = 3: structure of (a) transmitter, (b) receiver.
The arriving signal is then reflected to an FBG group. The FBGs-centered wavelengths depend on the presence of bit ”1” in the code sequence as an example for user#1, the centered wavelengths for the FBGs are λ1, λ5, λ8, and λ10 according to Table 3.

Table 3.
Wavelengths assigned to three users using DPS encoder.
At the receiver that is shown in Figure 2b, the received signal is divided into two branches: one branch containing the decoder that has the same spectral of encoder of the desired user and the output of this branch contains p + 1 power units for the intended user accompanied by λ power units for interferers from other users. The other branch has the CDS detection technique which contains only the complementary spectrum of the desired user. For example, where user#1 is the desired user, the CDS will detect λ2, λ3, λ4, λ5, λ6, λ7, λ9, λ11, and λ12 according to Table 3.
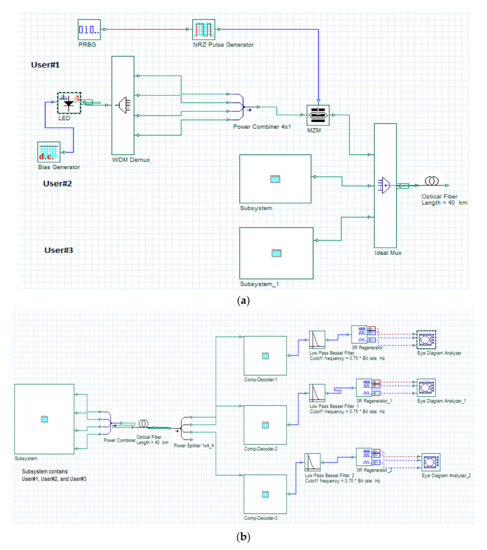
Figure 2.
Schematic diagram of DPS code using three users: (a) transmitter; (b) receiver using CDS detection technique.
Complementary detection is used (Comp-Decoder) which detects the complementary spectrum of the desired user (as shown in Table 2: λ2, λ3, λ4, λ5, λ6, λ7, λ9, λ11, and λ12).
Then, two photo diodes are used, one at the output of decoder branch and the other one at the output of complementary branch. Photodiodes (PD) detectors here are used for converting the signal from optical domain to electrical domain. The outputs of the PDs are subtracted, then the resultant signal is passed to low pass filter (LPF) and thresholding process where the original data for the desired user are reconstructed.
4. Detection Techniques Selection
The goal of this work is to design an OCDMA system for low-cost applications with large cardinality, simplified design, minimum cost, and ease of implementation. Thus, an optimal choice of detection techniques with good properties of code structure is needed. Therefore, we principally show the design and operation concept of complementary CDS and SPD detection schemes and choose the best among them in terms of performance and complexity.
4.1. Complementary Detection Scheme (CDS)
The DPS system utilizing CDS is given in Figure 2a. An optical software simulator known as Optisystem, version 7.1 (Optiwave Systems Inc, Ottawa, ON, Canada) is utilized to perform CDS operation in this section. Figure 1 is used as a reference prototype to make the simulation setup. The transmitter section consists of LEDs that generate the encoder of SAC-OCDMA that uses DPS codes. Specific wavelengths are combined in the encoder using an optical coupler according to the user’s assigned code then modulated by a Mach–Zehnder (MZ) modulator. The data of a pseudo random bit sequence (PRBS) generator are OOK-modulated with a non-return to zero (NRZ) pulses. The assigned wavelengths corresponding to the three users are given in Table 3. The modulated signals are transmitted through single mode fiber (SMF).
Figure 2b shows the receiver based on the CDS detection scheme. Here, a power splitter is connected to splitting the spectrum in accordance with the number of users. These portions are connected to a combination of subtractors, positive over intrinsic (PIN) photodiode, FBGs, LPF, and decision-making circuit to extract the desired information via CDS technique.
4.2. Single Photodiode (SPD)
In Figure 3, the receiver structure of three users is based on the DPS code sequence for P = 3.
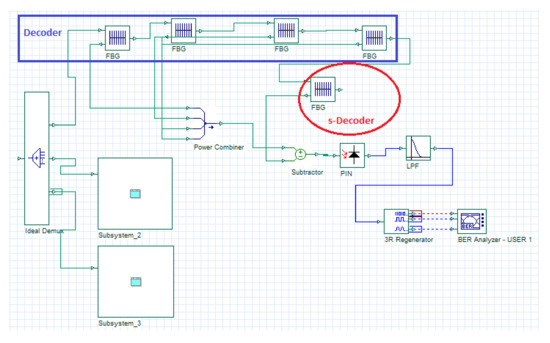
Figure 3.
Transmitter/receiver of three users using DPS code with SPD detection technique.
The incoming signal is first decoded by the decoder which has a matched spectral response to the intended encoder for the data to be recovered (Decoder) then transferred to the subtractive decoder (s-Decoder).
The s-Decoder contains only frequency bins from different interferers. After the optical subtractor, the result is passed to a single balanced photodetectors whether PIN or avalanche photodiode (APD). Here, the cancellation is done in the optical domain. The logical representation of MAI cancellation for DPS code is presented in Table 4 based on Table 3. Finally, after photo detections, LPF, and thresholding processes, the original data are reconstructed.

Table 4.
Logical representation of interference cancellation.
4.3. Pickup of Detection Scheme
In order to select the best detection technique, we listed the required components for CDS and SPD implementation in Table 5 for three users. It shows that, 36 FBGs are needed for CDS compared to 15 FBGs. Moreover, six PINs are required for CDS while only three PINs is sufficient for SPD. In the meantime, numbers of LPFs and Subtractors are the same for both techniques. To conclude, SPD detection needs less components than complementary subtraction as in our simulated system for three users and the more preferable choice in this study.

Table 5.
Required components for CDS and SPD Implementation.
5. Performance Analysis
In this section, analytical expressions are presented for the mean optical power and noises in order to get the BER performance of the SAC-OCDMA system using DPS code based on the SPD detection technique.
The mean optical power reaching the PD, when the desired user is active, is
where and are the encoder and decoder transfer functions, respectively, S is the received power and is the optical source bandwidth. These functions are the spectral representations of the filters. and denote the element of the encoder and decoder code words, respectively.
The PIIN expression for unpolarized thermal light source can be expressed as
where is the electrical bandwidth.
The variance of shot noise can be expressed as
where is the responsivity of photodetector.
The variance of thermal noise can be evaluated using [5,6]
where is the Boltzmann’s constant, is the receiver noise absolute temperature, and is the receiver load resistance.
The SNR in case of DPS code can be written as [5,6,14]:
Based on the Gaussian distribution, the BER is given by [15]
6. Results and Discussion
The performance of the three users assigned DSP codes is characterized by maximum number of allowed users, maximum transmission distance, BER, Q-factor, the SNR, and eye pattern. The parameters used in the simulation of the proposed system are given in Table 6 [13,14,15,16].

Table 6.
System parameters.
Figure 4 shows BER versus the number of users for the system using DPS code with complementary subtraction detection and SPD detection at different bit rates. As cleared from Figure 4, when the number of users increases, BER increases while the system using SPD detection technique can support a larger number of users. In addition, as the bit rate increases, the number of users that the system can support decreases. The system that uses complementary subtraction can support up to 69, 53, 37, and 22 users at 622 Mbps, 1 Gbps, 2 Gbps, and 5 Gbps, respectively with BERs values , , , and , respectively. As for the system using the SPD detection technique, it can support number of users up to 200, 171, 82, and 28, respectively, at 622 Mbps, 1 Gbps, 2 Gbps, and 5 Gbps, respectively, with BER value .
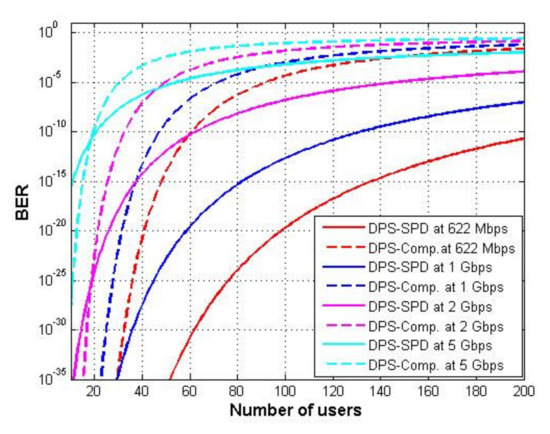
Figure 4.
BER versus number of users for DPS code at different detection techniques and different bit rates.
Figure 5 shows BER versus the number of users for the system using DPS and RD codes with CDS and SPD detection techniques at 622 Mbps data rate. As shown in Figure 5, when the number of users increases, BER increases in which the system using SPD detection technique can support a larger number of users compared with the CDS technique. The system that uses CDS technique can support up to 22 and 25, for DPS and random diagonal (RD) codes, respectively. In the meantime, at 622 Mbps, the system that uses the SPD technique can support up to 130 users at error free transmission. Figure 6 shows the effect of the effective received power that reaches PD on the performance of the system that uses DPS code with different detection techniques at 622 Mbps and fixed number of users equal to 60. It can be noticed that the system that uses complementary subtraction has a great effect when the value of effective power changed, while for SPD detection, it seems that there is no effect. As the value of effective power increases, the performance of the system using complementary subtraction becomes better while the other system that uses SPD detection has the best performance. At 622 Mbps and number of users equal to 60, BERs values when effective power is −15 dBm are and , respectively, when complementary and SPD detection techniques are used. Figure 7 shows SNR versus number of users for the system using DPS code with different detection schemes at different bit rates. As cleared from Figure 7, as the number of users increases, the SNR decreases while the system using SPD detection technique have greater value of SNR. As an example, at 50 users and bit rate 622 Mbps, SNR values are 23.6 and 28 dB, respectively, for the system use CDS and SPD detection schemes.
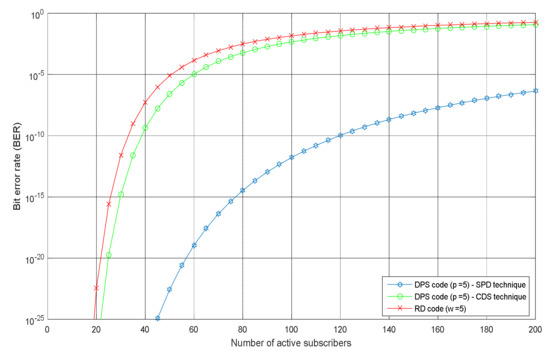
Figure 5.
BER versus number of active users for DPS and RD codes at different detection techniques and different bit rates.
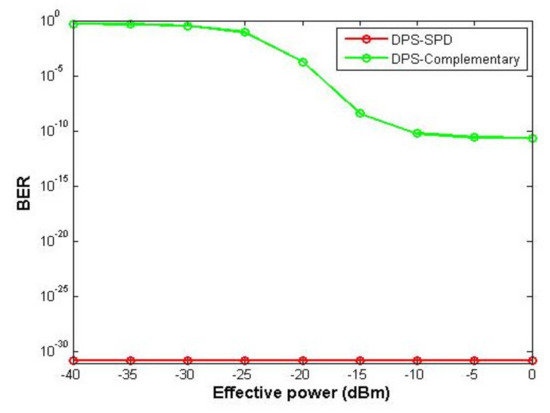
Figure 6.
BER versus effective power for DPS code using different detection techniques and at 622 Mbps and 60 users.
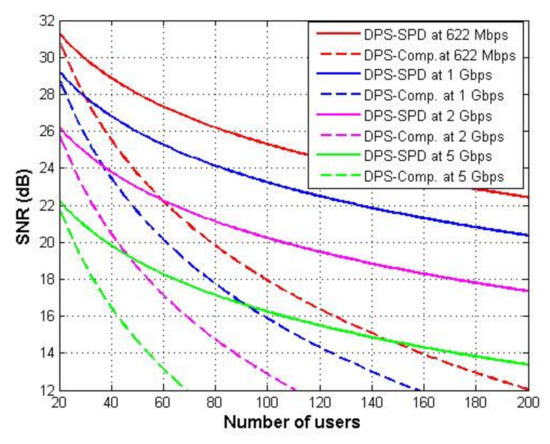
Figure 7.
SNR versus number of users for DPS code using different detection techniques at different bit rates Mbps.
The effect of fiber distance on the performance of three users of the SAC-OCDMA system assigned with DPS codes and using SPD detection technique at different bit rates is given in Figure 8. As the transmission distance increases as well as bit rates, the performance of the system decreases. The maximum achievable transmission distance with BER ~ that the system can travel is 52 km at 622 Mbps, which decreases at 1 Gbps and becomes 32 km, while achieving minimum distance at 2 Gbps which is 8 km. Figure 9 displays the eye diagram of one user at 10 km at 622 Mbps, 1 Gbps, and 2 Gbps. It is clear that the eye opening is large at a lower bit rate which indicates the best performance. The obtained results from Figure 10 show that as the transmission distance increases, the Q-factor decreases and the system that operates at 622 Mbps gives better Q-factor than the other ones operating at higher bit rates. The system using DPS code with SPD detection technique can transmit up to 52, 32, and 8 km, respectively, at 622 Mbps, 1 Gbps, and 2 Gbps with Q-factor value ~5.6.
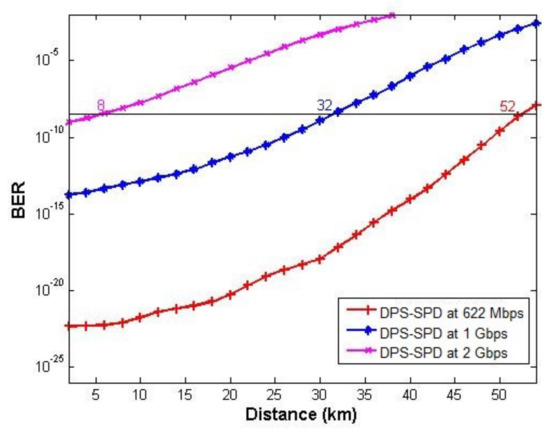
Figure 8.
BER versus transmission distance for DPS code using SPD detection scheme at 622 Mbps, 1 Gbps, and 2 Gbps.
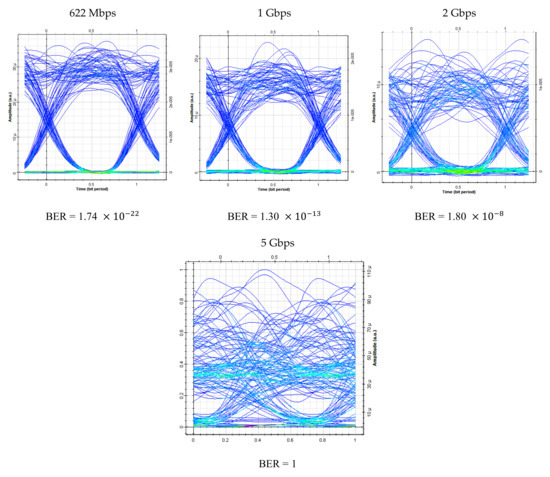
Figure 9.
Eye diagram for one user at 10 km and different bit rates.
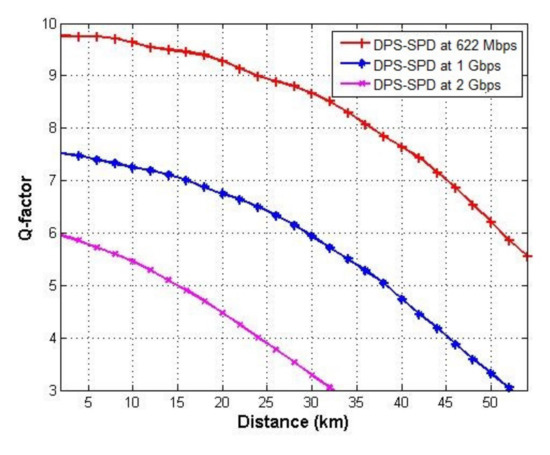
Figure 10.
Q-factor versus transmission distance for DPS code using SPD detection scheme at 622 Mbps, 1 Gbps, and 2 Gbps.
Figure 11 represents the way of estimation the value of Q-factor from eye diagram and that can be done by taking the time domain signal and overlapping the terraces for a certain number of symbols. The best time of sampling is that at large eye opening where we can estimate the value of Q-factor then calculate the BER from the known relation, which is BER = 0.5 × erfc(Q/). As an example, Q = 9.6 − 0 = 9.6, then BER = 0.5 × erfc(9.6/) = .
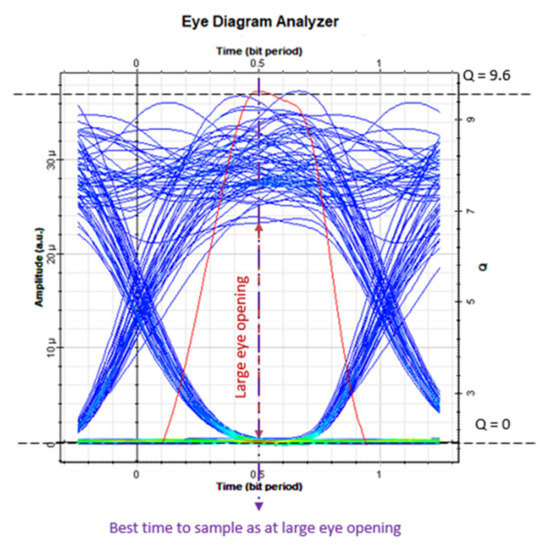
Figure 11.
Example of Q-factor reading from eye diagram.
Figure 12 shows SNR versus the transmission distance for the system using the DPS code with SPD detection techniques at different bit rates. As expected, shorter transmission distance gives better values for SNR as the value of SNR at 10 km is 20 dB at 622 Mbps, while it dropped to 10 dB when the distance increased to 30 km. Moreover, at higher data rates, SNR decreases.
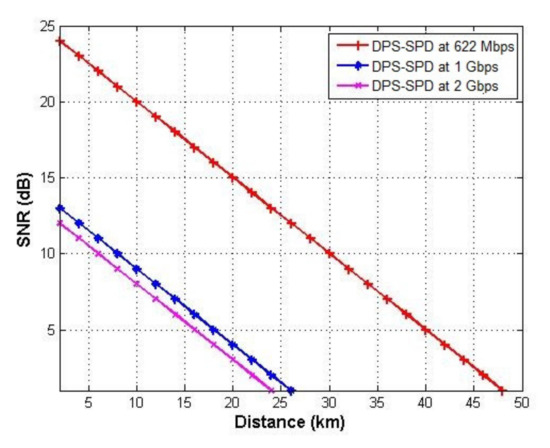
Figure 12.
SNR versus transmission distance for DPS code using SPD detection scheme at 622 Mbps, 1 Gbps, and 2 Gbps.
Figure 13 shows BER versus the received power at different transmission distance for the system using DPS code with SPD detection techniques and different photodiodes at different bit rates. As expected, APD gives higher received power compared to PIN. As cleared from Figure 13a as an example, at received power −25 dBm, the BERs values are and , respectively, when PIN and APD are used.
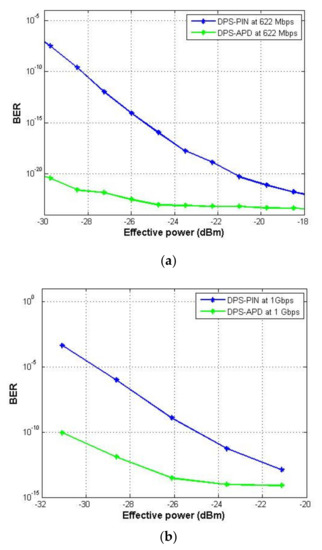
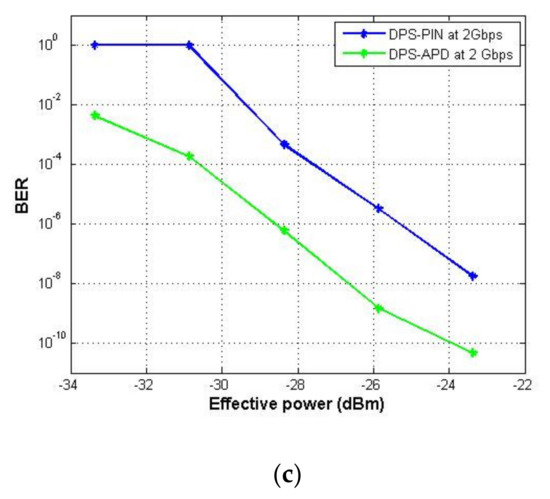
Figure 13.
BER versus received power at (a) 622 Mbps, (b) 1 Gbps, and (c) 2 Gbps.
The obtained results from Figure 14 show that as the transmission distance increases, the Q-factor decreases and the system using APD gives better Q-factor than the other one that used PIN at all transmission distances.
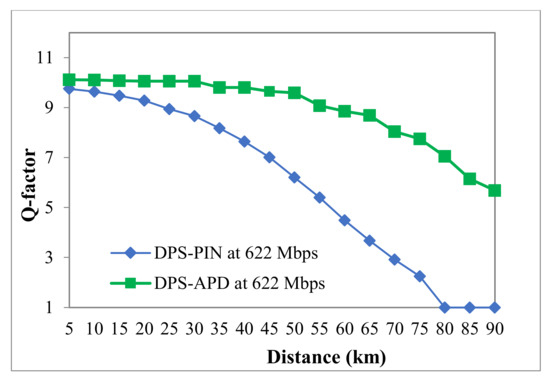
Figure 14.
Q-factor versus fiber length.
7. Conclusions
In this paper, a feasibility study to choose a detection scheme that suits a DPS code family is presented. The properties of this code family have been proven and discussed. The results of system performance are compared with reported codes. The advantage of the DPS code family can be summarized as follows: (1) good property in cross-correlation control; (2) short code length; (3) and easy to implement using fiber Bragg gratings (FBGs). The architecture of transmitter–receiver structure of both CDS and SPD techniques for DPS OCDMA system is presented. Simulation analysis that calibrates with BER, Q-factor, and eye diagram proves that DPS code using SPD technique is able to maintain error free transmission compared to the CDS technique. When the number of active users is 60, BERs of and are achieved for CDS and SPD at detection techniques, respectively, when effective power is −15 dBm at 622 Mbps. Apart from its improved performance, DPS codes with SPD technique are more flexible and require less complexity in the encoder and decoder designs. In particular, a reduction of FBG sets by 41.6% was achieved for SPD over CDS techniques.
Author Contributions
H.Y.A. design, analytical derivation; S.A.A.E.-M. performed the simulations and obtained the results; M.Z. and B.B. analyzed the obtained results; H.Y.A., M.Z. and S.A.A.E.-M. wrote the paper, which was further reviewed by A.C. All authors have read and agreed to the published version of the manuscript.
Funding
Funding for this work was provided by the Deanship of Scientific Research, King Khalid University, Ministry of Education, Kingdom of Saudi Arabia, under research Group Project grant award number RGP.1/157/42.
Data Availability Statement
The data presented in this study are available on request from the corresponding author. The data are not publicly available due to their large size.
Acknowledgments
The authors acknowledge the Deanship of Scientific Research for providing administrative and financial support.
Conflicts of Interest
The authors declare no conflict of interest.
References
- Salehi, J.A.; Brackett, C.A. Code division multiple access techniques in optical fiber network—Part II: System performance analysis. IEEE Trans. Commun. 1989, 37, 834–842. [Google Scholar] [CrossRef]
- Ahmed, H.Y.; Nisar, K.S. Diagonal Eigenvalue Unity (DEU) code for spectral amplitude coding-optical code division multiple access. Opt. Fiber Technol. 2013, 19, 335–347. [Google Scholar] [CrossRef]
- Wei, Z.; Shalaby, H.M.H.; Ghafouri-Shiraz, H. Modified Quadratic Congruence codes for Fiber Bragg-Grating-Based SAC-OCDMA. J. Light. Technol. 2002, 50, 1209–1212. [Google Scholar]
- Wei, Z.; Ghafouri-Shiraz, H. Code for spectral amplitude-coding optical CDMA systems. J. Light. Technol. 2002, 20, 1284–1291. [Google Scholar]
- Abd, T.H.; Aljunid, S.A.; Fadhil, H.A.; Ahmad, R.B.; Junita, M.N. Enhancement of performance of a hybrid SAC-OCDMA system using dynamic cyclic shift code. Ukr. J. Phys. Opt. 2012, 13, 12–27. [Google Scholar] [CrossRef]
- Tseng, S.-P.; Wu, J. A new code family suitable for high-rate SAC OCDMA PONs applications. IEEE J. Sel. Areas Commun. 2010, 28, 827–837. [Google Scholar] [CrossRef]
- Fadhil, H.A.; Aljunid, S.A.; Ahmad, R.B. Performance of random diagonal code for OCDMA systems using new spectral direct detection technique. Opt. Fiber Technol. 2009, 15, 283–289. [Google Scholar] [CrossRef]
- Ahmed, H.Y.; Zeghid, M.; Imtiaz, W.A.; Sherief, Y.; Aabdalla, O. Sigma Shift Matrix (SSM) code Supporting QoS for Spectral Amplitude Coding-Optical Code Division Multiple Access. Opt. Fiber Technol. 2019, 47, 73–87. [Google Scholar] [CrossRef]
- Imtiaz, W.A.; Ahmad, N. Cardinality enhancement of SAC OCDMA systems using new diagonal double weight code. Int. J. Commun. Netw. Inf. Secur. 2014, 6, 226–232. [Google Scholar]
- Hasoon, F.N.; Abdullah, M.K.; Aljundi, S.A.; Shaari, S.B.H. Construction of new code for spectral amplitude coding in optical code division multiple access systems. J. Opt. Eng. 2007, 46, 75004–75008. [Google Scholar]
- Fadhil, H.A.; Aljunid, S.A.; Ahmad, R.B. Design considerations of high performance optical code division multiple access: A new spectral amplitude code based on laser and light emitting diode light source. IET Optoelectron. 2010, 4, 29–34. [Google Scholar] [CrossRef]
- Stok, A.; Sargent, E.H. Lighting the local network: Optical code division multiple access and quality of service provisioning. IEEE Netw. 2000, 6, 42–46. [Google Scholar]
- Ahmed, Y.H.; Gharsseldien, Z.M.; Aljunid, S.A. Performance analysis of diagonal permutation shifting (DPS) codes for SAC-OCDMA systems. J. Inf. Sci. Eng. 2017, 33, 433–448. [Google Scholar]
- Al-Khafaji, H.M.R.; Aljundi, S.A.; Amphawan, A.; Fadhil, H.A.; Safar, A.M. Reducing BER of spectral-amplitude coding optical code division multiple-access systems by single photodiode detection technique. J. Eur. Opt. Soc. Rapid Publ. 2013, 8, 13022. [Google Scholar] [CrossRef] [Green Version]
- Abd El-Mottaleb, S.A.; Fayed, H.A.; Abd El-Aziz, A.; Metawee, M.A.; Aly, M.H. Enhanced Spectral Amplitude Coding OCDMA System Utilizing a Single Photodiode Detection. Appl. Sci. 2018, 8, 1861. [Google Scholar] [CrossRef] [Green Version]
- Ahmed, H.Y.; Zeghid, M.; Imtiaz, W.A.; Sharief, Y.; Sghaier, A. A tradeoff for dispersion compensating fibers (DCFs) deployment in SAC-OCDMA environment using 2D-Fixed Right Shift (2D-FRS) code. Optik 2019, 185, 746–758. [Google Scholar] [CrossRef]
Publisher’s Note: MDPI stays neutral with regard to jurisdictional claims in published maps and institutional affiliations. |
© 2022 by the authors. Licensee MDPI, Basel, Switzerland. This article is an open access article distributed under the terms and conditions of the Creative Commons Attribution (CC BY) license (https://creativecommons.org/licenses/by/4.0/).