1. Introduction
For the purpose of optimizing the energy structure and resource allocation, promoting the consumption of new sources of energy, such as wind power [
1], and reducing carbon emissions [
2], Line-Commutated Converter–High-Voltage Direct Current (LCC-HVDC) transmission technology has been rapidly developed due to its advantages in long-distance bulk power transmission and the interconnection of regional power grids [
3]. Differently from fully controlled power electronic devices such as Insulated Gate Bipolar Transistors (IGBTs) [
4], the thyristors adopted by LCC-HVDC are semi-controlled power electronic devices. Consequently, an inverter bus voltage is needed for the commutation process between the thyristor-based valves, and a deterioration in the inverter bus voltage will lead to the occurrence of a commutation failure (CF) of the LCC-HVDC [
5]. In addition, CFs and the DC power fluctuations caused by CFs will bring about new challenges to the safe and stable operation of LCC-HVDC and AC/DC hybrid power systems [
6].
The first commutation failure (CF) is unavoidable, and a subsequent commutation failure (SCF) may occur when an AC fault occurs in the receiving-end power system [
7]. An SCF of the LCC-HVDC will not only cause overcurrent issues with the converter valves, resulting in the shortening of their service life [
8], but also severe DC power fluctuations in a short period of time [
9], seriously threatening the transient stability of the sending-end power system [
10]. Additionally, an SCF may occur during the AC fault [
11] or during the recovery after the clearance of the AC fault [
12]. Moreover, an SCF may occur due to another AC fault, such as a cascading failure or a reclosure on a permanent AC fault [
13]. Therefore, SCFs are divided into Category 1, Category 2, and Category 3 SCFs. The occurrence mechanisms of the three categories of SCFs are not the same, so the prevention control strategies are different.
Category 3 SCFs can only be prevented by avoiding the occurrence of a cascading failure [
14] or adopting adaptive reclosing instead of the DC control system itself [
15].
Regarding Category 1 SCFs, the mechanism of an SCF as affected by improper interactions between DC controllers was deeply analyzed in [
11], and the recovery control strategy of an adaptive extinction angle was employed to avoid the occurrence of SCFs. The recovery performance of a CF was improved in order to prevent the occurrence of SCFs by modifying the lower and upper limits of a Constant Extinction Angle (CEA) controller in [
16]. Based on an analysis of the controller response and AC/DC interaction, an early warning system for SCFs was developed by considering the risks of controller regulation and the variations in electrical quantities in [
17,
18], and an emergency advanced control strategy was proposed with an adjustment of the inverter beta in [
17]. In addition, the impact of the conventional Phase-Locked Loop (PLL) on SCFs during an AC fault was analyzed. In [
19], a novel PLL was presented that supplies a precise phase reference for the DC control system, thereby reducing the probability of SCFs. The output of the extinction angle or DC voltage control was modified to mitigate the SCF by taking the error between the AC voltage phase and the PLL’s output angle into account in [
20]. Moreover, in order to inhibit the SCF during an AC fault, a Commutation Failure Inhibition Module (CFIM) with a high response speed was designed in order to modify the firing angle by direct measurement of the overlapping area in [
7]. A Controllable Commutation Failure Inhibitor (CCFI) was established in order to make the fault current rely on a reduced extinction angle in [
21].
Category 2 SCFs are mainly related to the inverter bus voltage during the recovery after the clearance of an AC fault. On the one hand, by installing a Static Var Compensator (SVC) [
22], the inverter bus voltage can be effectively supported during the recovery after the clearance of the AC fault, which will reduce the probability of SCFs, but additional investment is required. On the other hand, the DC control system could be optimized in order to prevent the occurrence of SCFs. In [
23], an adaptive Voltage-Dependent Current Order Limiter (VDCOL) based on granular computing and fuzzy rules was applied to lower the reactive power consumption during low-voltage periods. In [
12], the VDCOL was replaced with a novel current order control strategy on the basis of the relationship between the DC current order, the inverter bus voltage, and the inverter reactive power in order to improve the recovery performance.
In the above-mentioned studies on the mechanisms and prevention control strategies of SCFs, due to the fact that scholars have mainly focused on the LCC-HVDC itself, and not on the entire AC/DC hybrid power system, almost all receiving-end power systems are modeled as ideal voltage sources instead of synchronous generators, so the dynamic interaction characteristics between the AC system and the DC system are neglected. However, from the perspective of an AC/DC hybrid power system, the fluctuation in the DC power caused by the SCF has negative impact on the transient stability of the post-fault AC/DC hybrid power system, and the deterioration of the transient stability also affects the inverter bus voltage, which may cause additional SCFs to occur. Therefore, the sending-end and receiving-end power systems should be modeled as synchronous generators instead of ideal voltage sources. As a result, the mechanism of an SCF as affected by the transient stability can be analyzed and a corresponding control strategy can be proposed in order to prevent the occurrence of SCFs and guarantee the safe and stable operation of the LCC-HVDC and AC/DC hybrid power system.
In
Section 2, the three categories of SCFs and their impacts on transient stability are further discussed. In
Section 3, the mechanism of an SCF as affected by transient stability is analyzed based on the transient stability of the receiving-end power system and the reactive power characteristics of the inverter station and then validated by simulation results. In
Section 4, a DC power recovery model is established by adopting the ramp function, and a recovery speed control strategy is presented that can be used to not only avoid the occurrence of SCFs but also increase the transient stability margin of the sending-end power system. In
Section 5, a hybrid electromechanical–electromagnetic model and the full electromagnetic model of the IEEE 39-bus asynchronous interconnection test power system are adopted to confirm the effectiveness and robustness, respectively, of the proposed control strategy.
Section 6 concludes this paper.
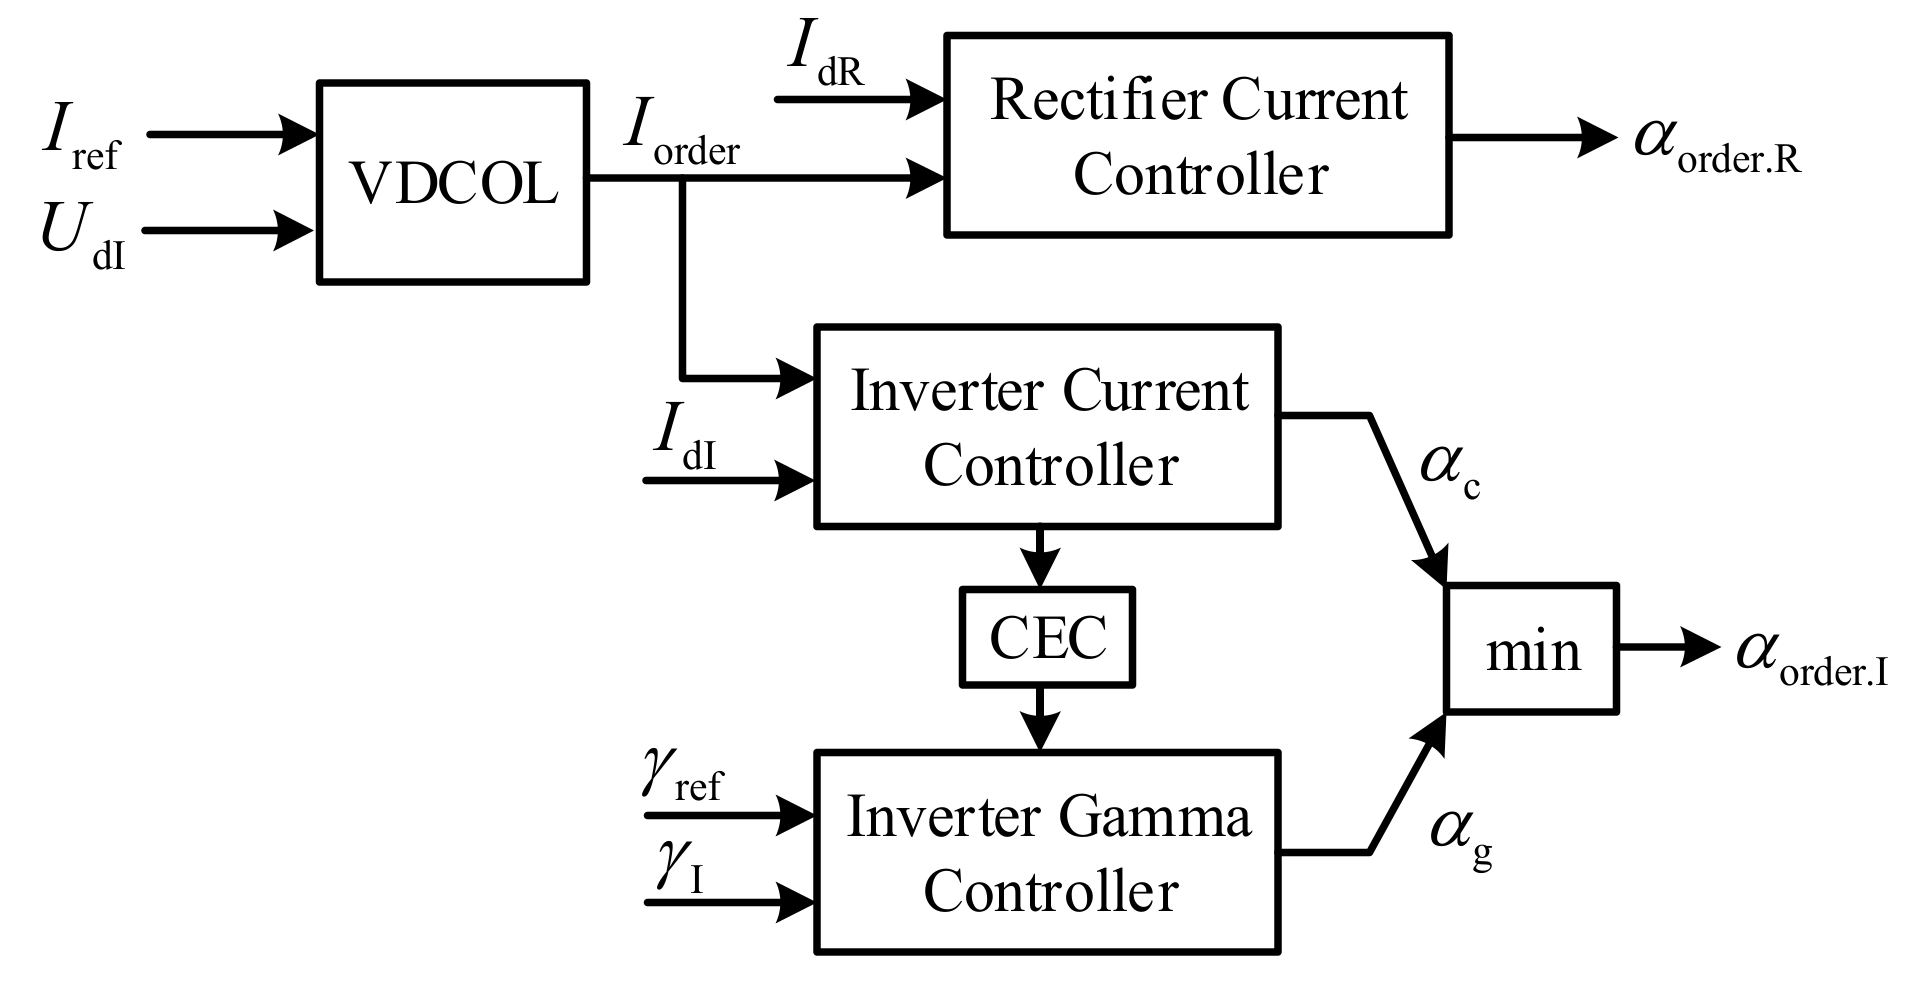
2. Definition of an SCF
The commutation process in an inverter station can be represented in the following manner [
24]:
where
αI is the firing angle,
β is the advanced firing angle,
μ is the commutation angle, and
γ is the extinction angle.
During the operation of the inverter, when the time (extinction angle γ) of application of negative voltage to the thyristor that has just been turned off is shorter than the time (inherent extinction angle ) required for it to restore the blocking capability and the thyristor is turned on again when positive voltage is applied, a commutation failure of the inverter will occur, and the occurrence of repeated commutation failures in a short period of time is called an SCF. The SCF may occur during an AC fault or occur during the recovery after the clearance of an AC fault. In addition, an SCF may occur due to another AC fault, such as a cascading failure or a reclosure on a permanent AC fault. Therefore, SCFs are divided into three categories according to the occurrence time of the SCF and the AC fault conditions. Definitions for the three categories of SCFs are given below.
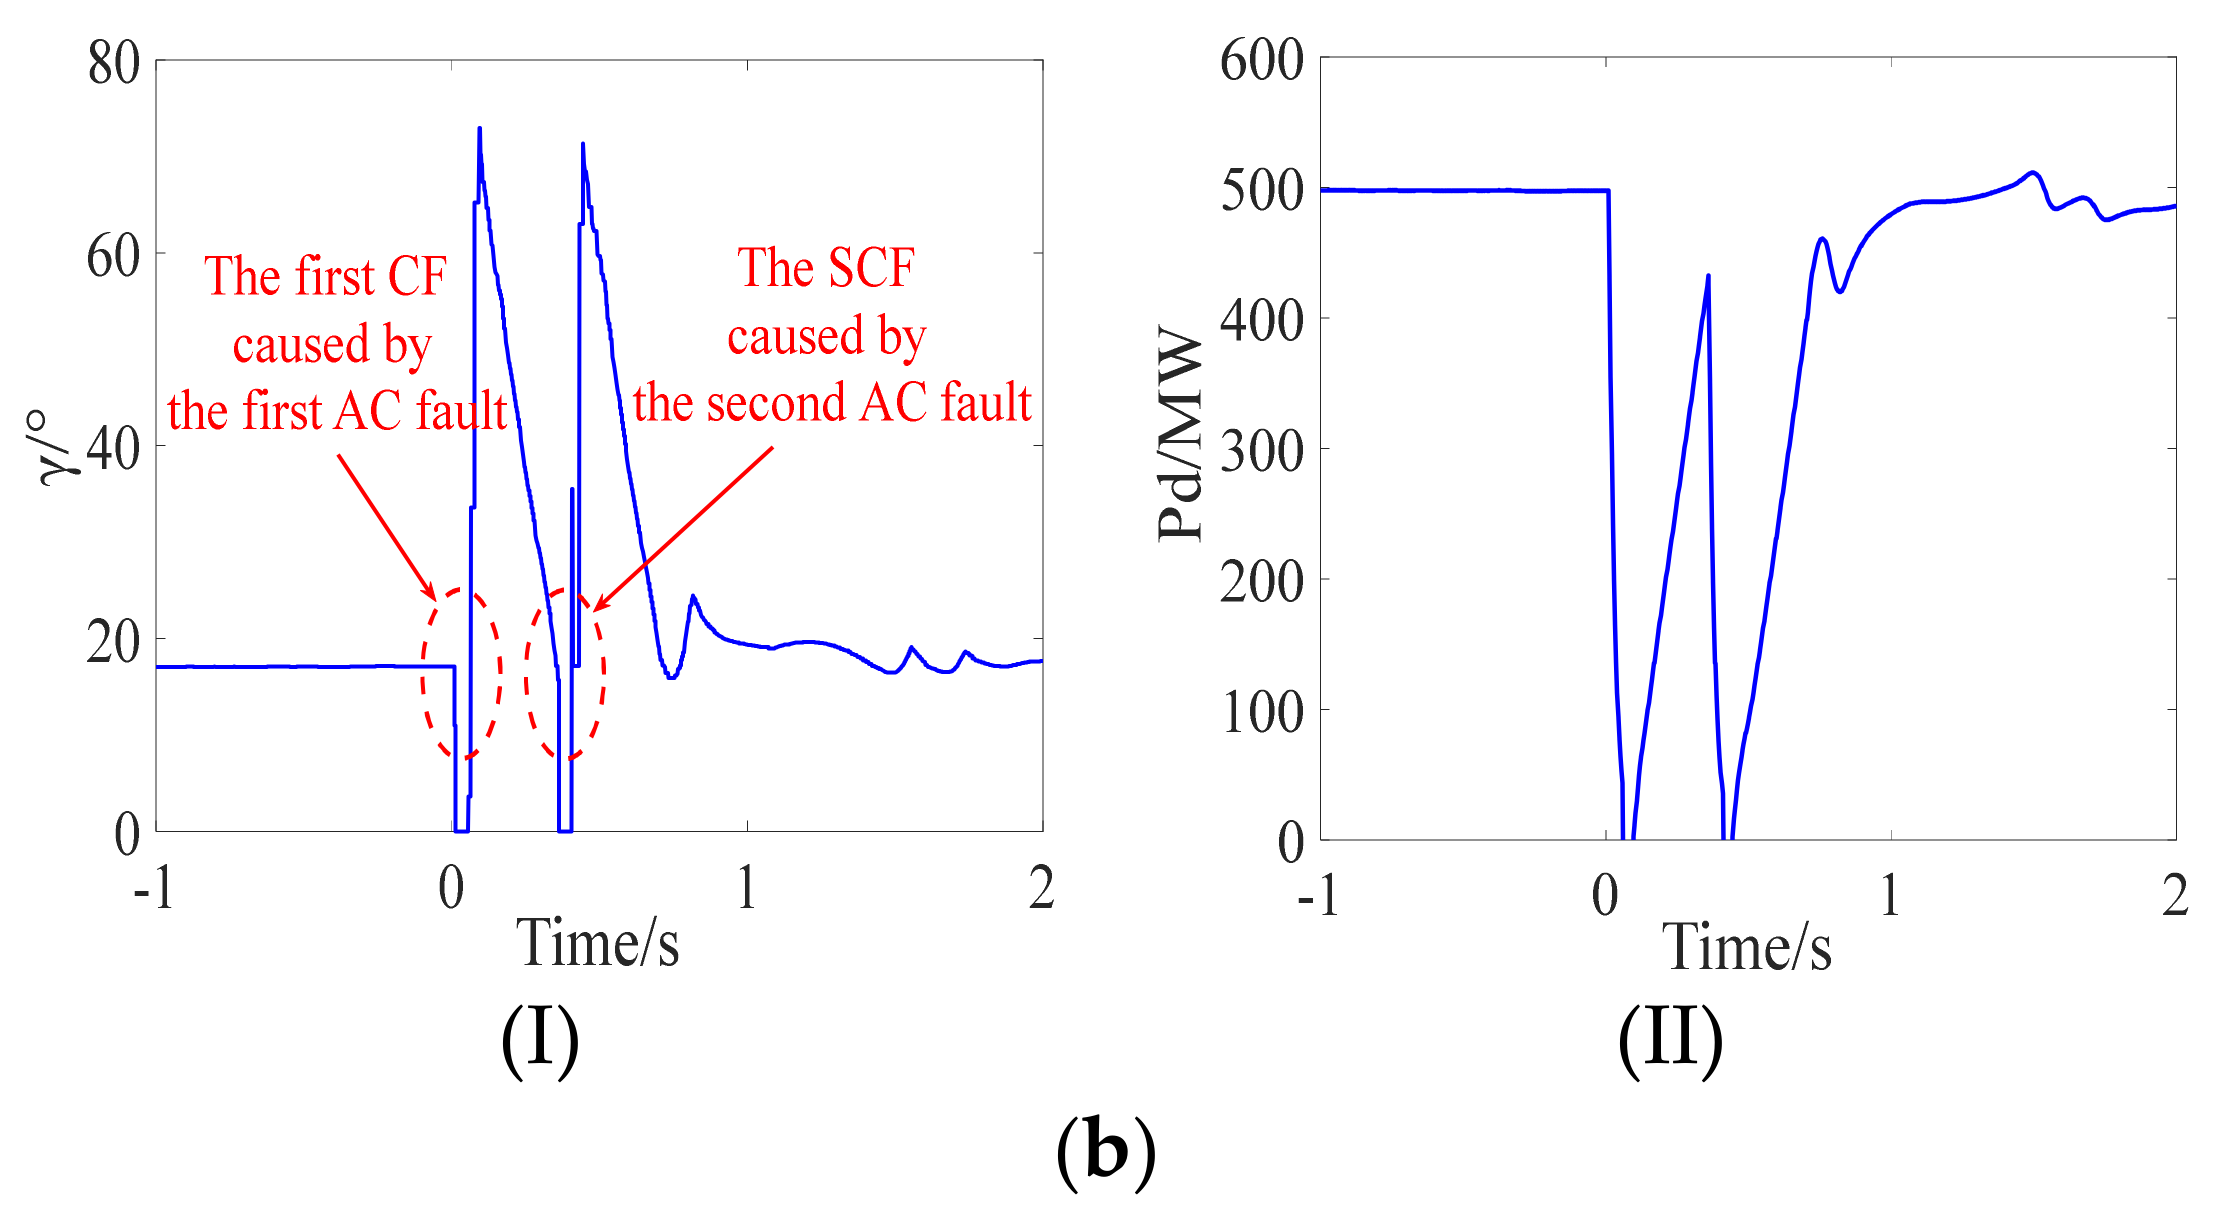
Category 1: The AC fault occurs in the receiving-end power system, causing the occurrence of the first CF. The SCF occurs during the recovery when the AC fault has not yet been cleared.
Category 2: The AC fault occurs in the receiving-end power system, causing the occurrence of the first CF. The SCF occurs during the recovery after the clearance of the AC fault.
Category 3: The first CF and the SCF are caused by multiple AC faults, such as a cascading failure or a reclosure on a permanent AC fault. The first and second AC faults cause the occurrence of the first CF and the SCF, respectively.
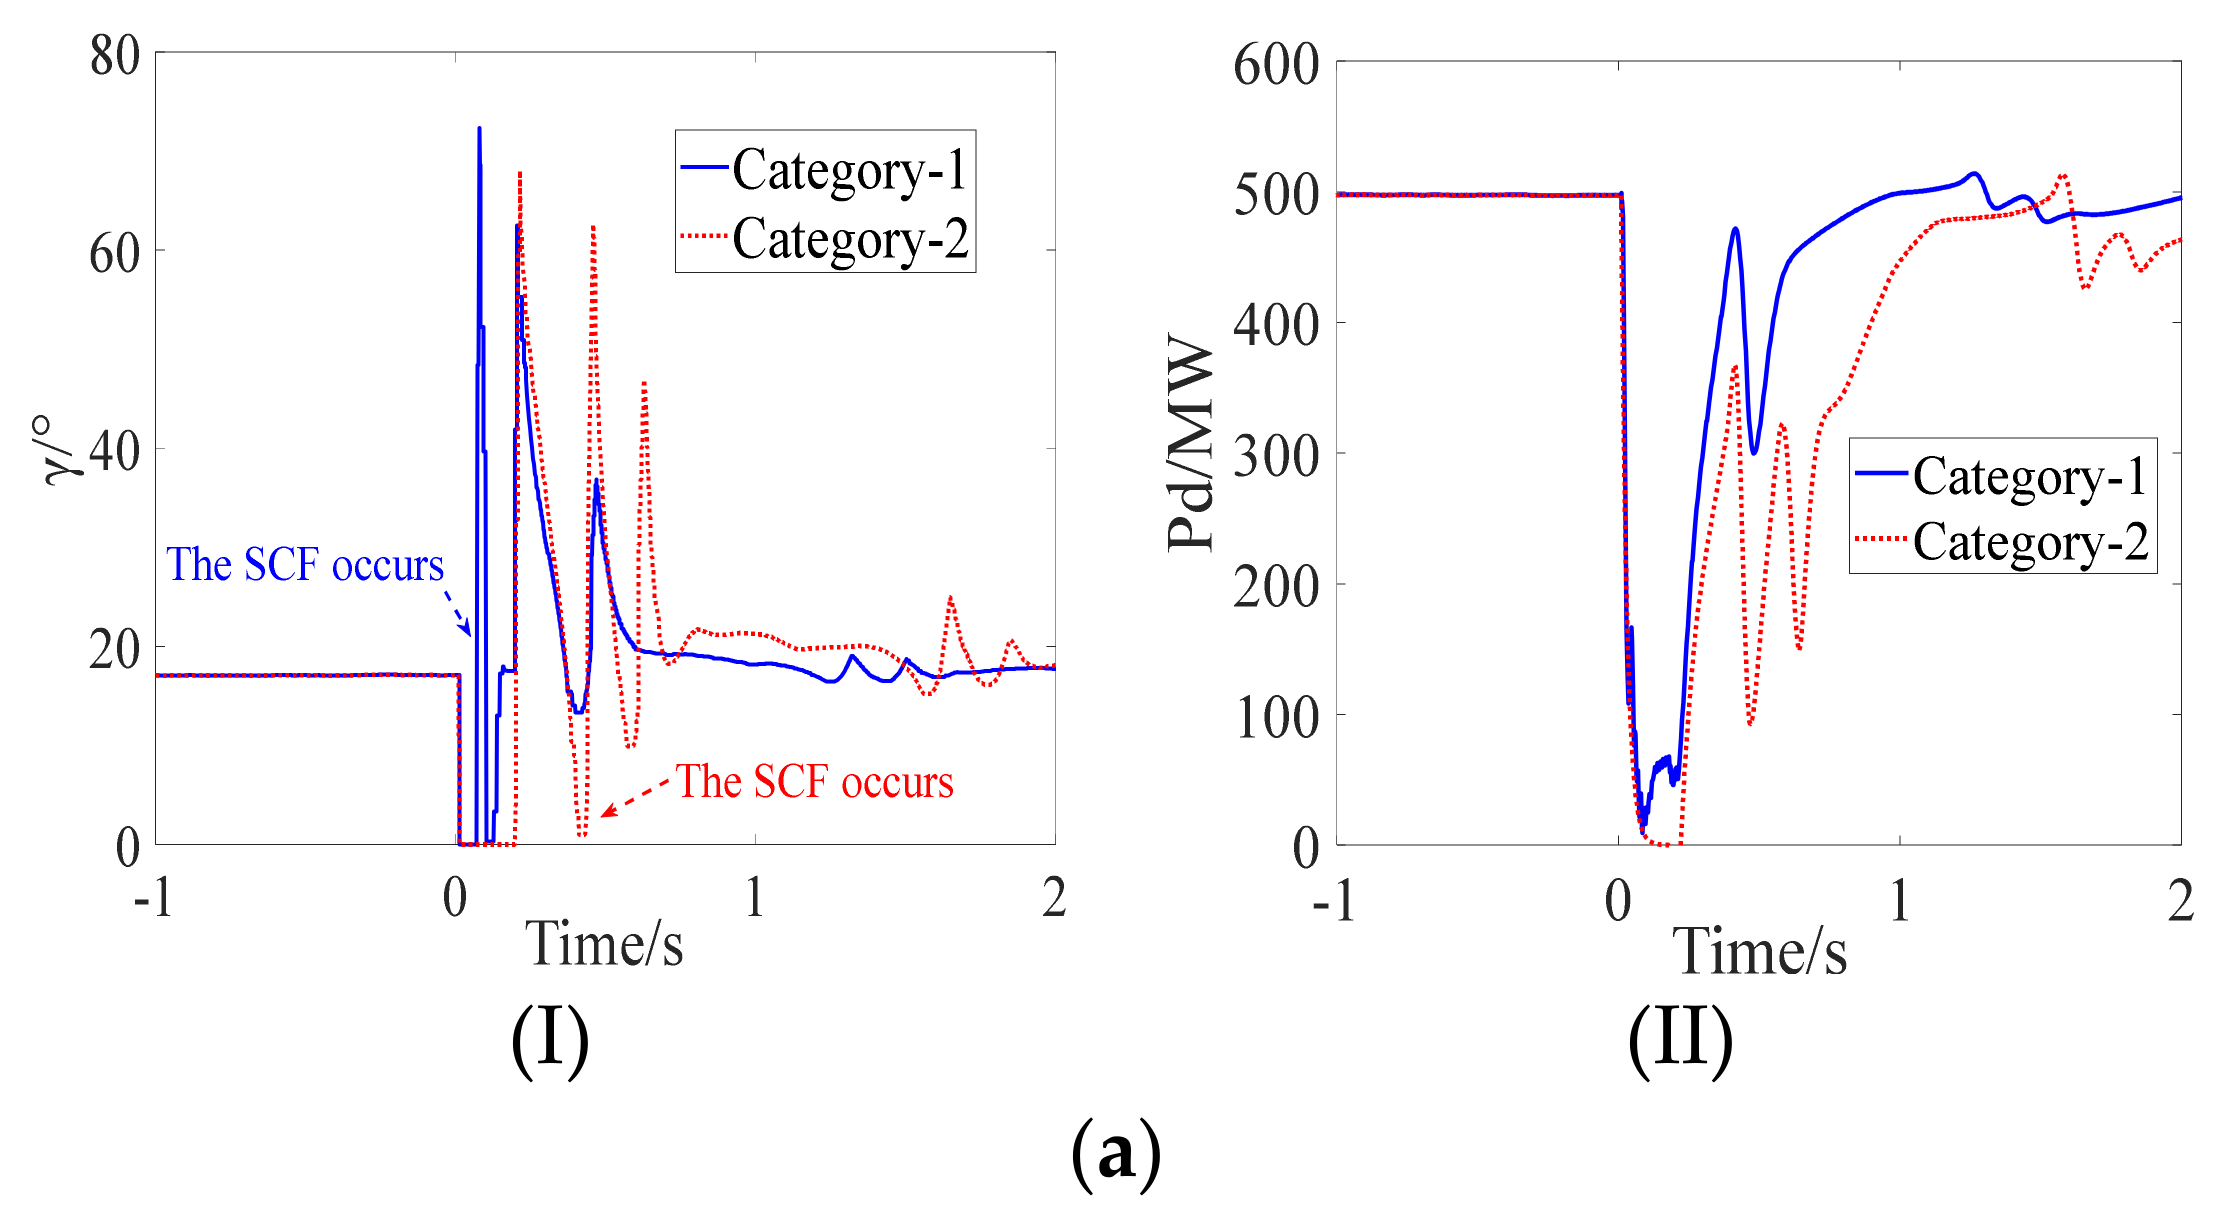
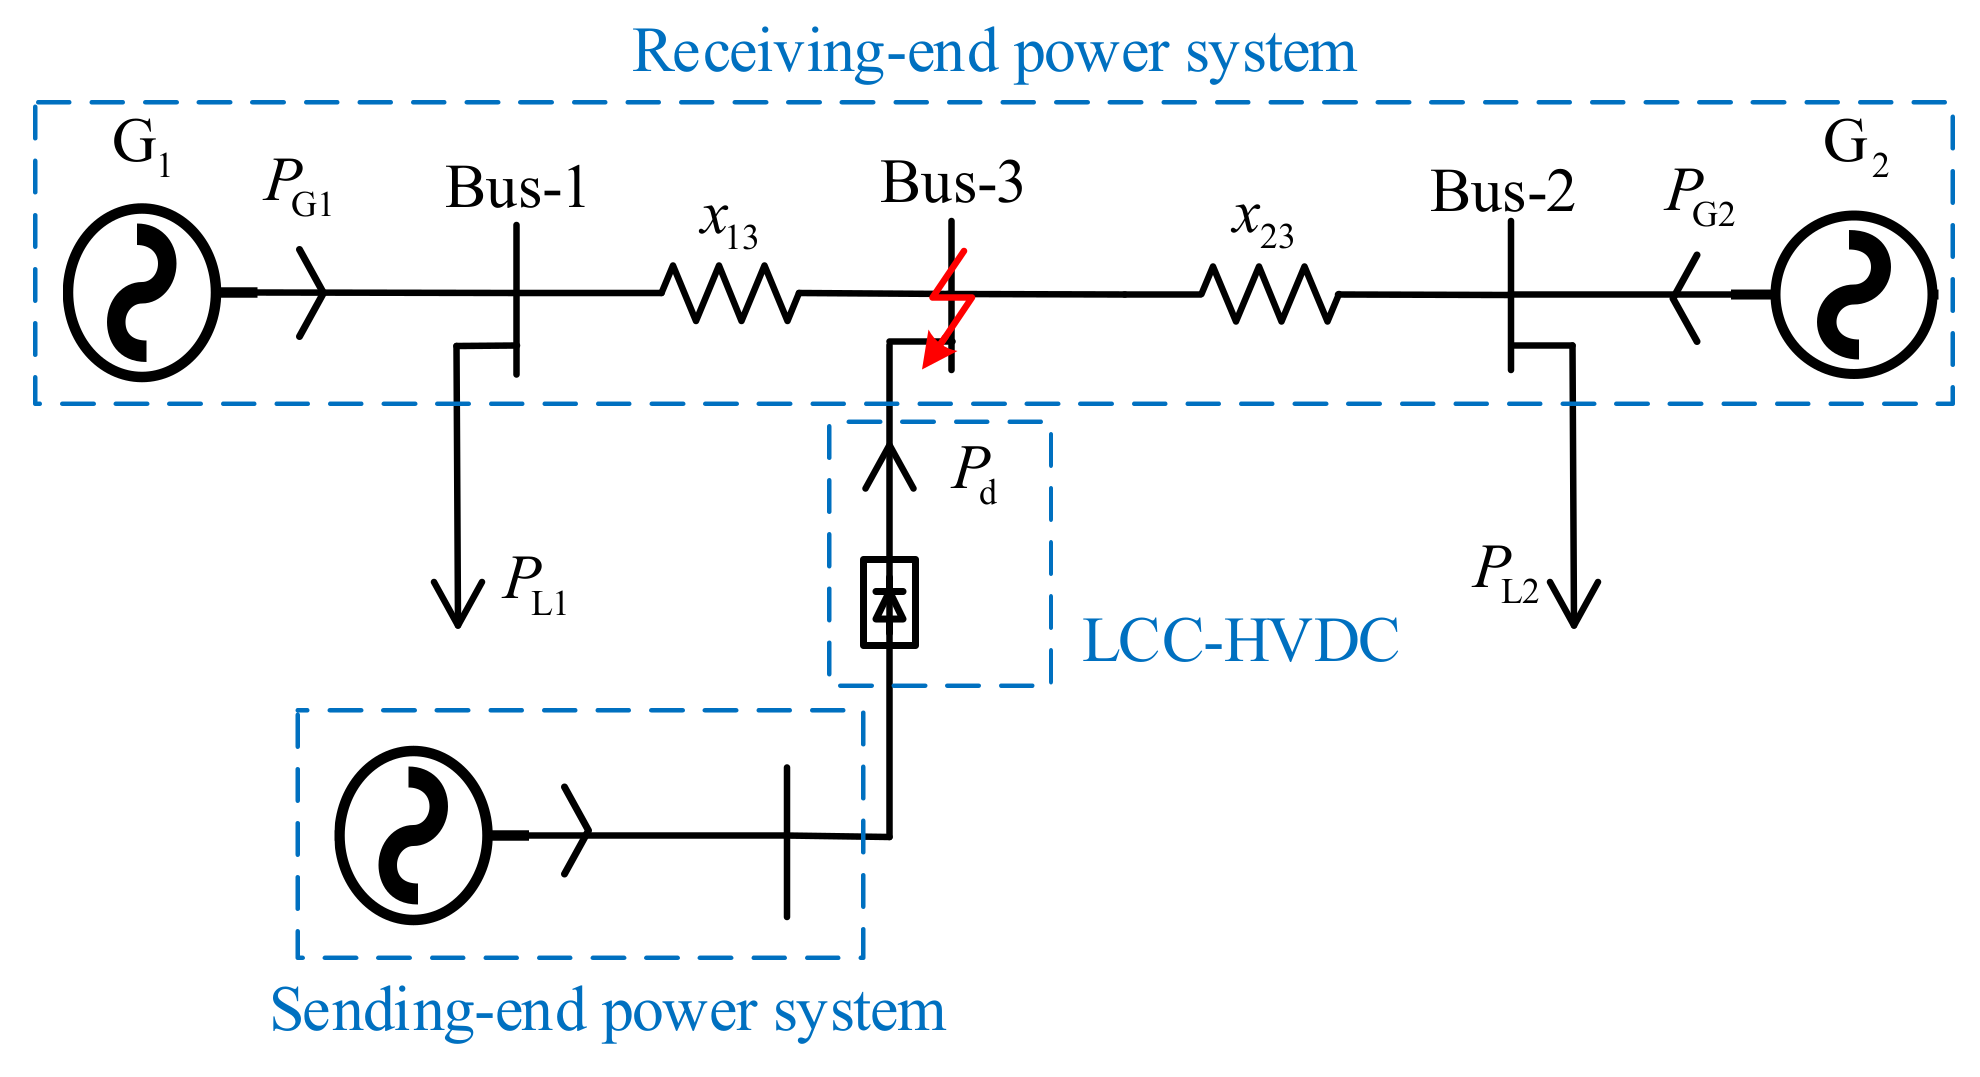
Regarding the transient stability analysis, we are most concerned with the external characteristics of converter stations, especially DC power. The simulation results of SCFs corresponding to the three categories are shown in
Figure 1.
As shown in
Figure 1a, the fault duration is the same, but the fault types are a single-phase resistance grounding fault and a three-phase short circuit fault, respectively. It can be seen from
Figure 1aI that the SCF corresponding to Category 1 does not have a significant negative impact on the DC power during the AC fault. In contrast, it can be seen from
Figure 1a (the red dotted line) and (b) that the SCFs corresponding to Category 2 and Category 3 cause severe fluctuations in the DC power and seriously affect the transient stability of the power system. To sum up, the order of the impact of the SCFs on the transient stability is Category 3 > Category 2 > Category 1. Next, we discuss the SCFs corresponding to Category 2.
5. Results and Discussion
5.1. Test Power System
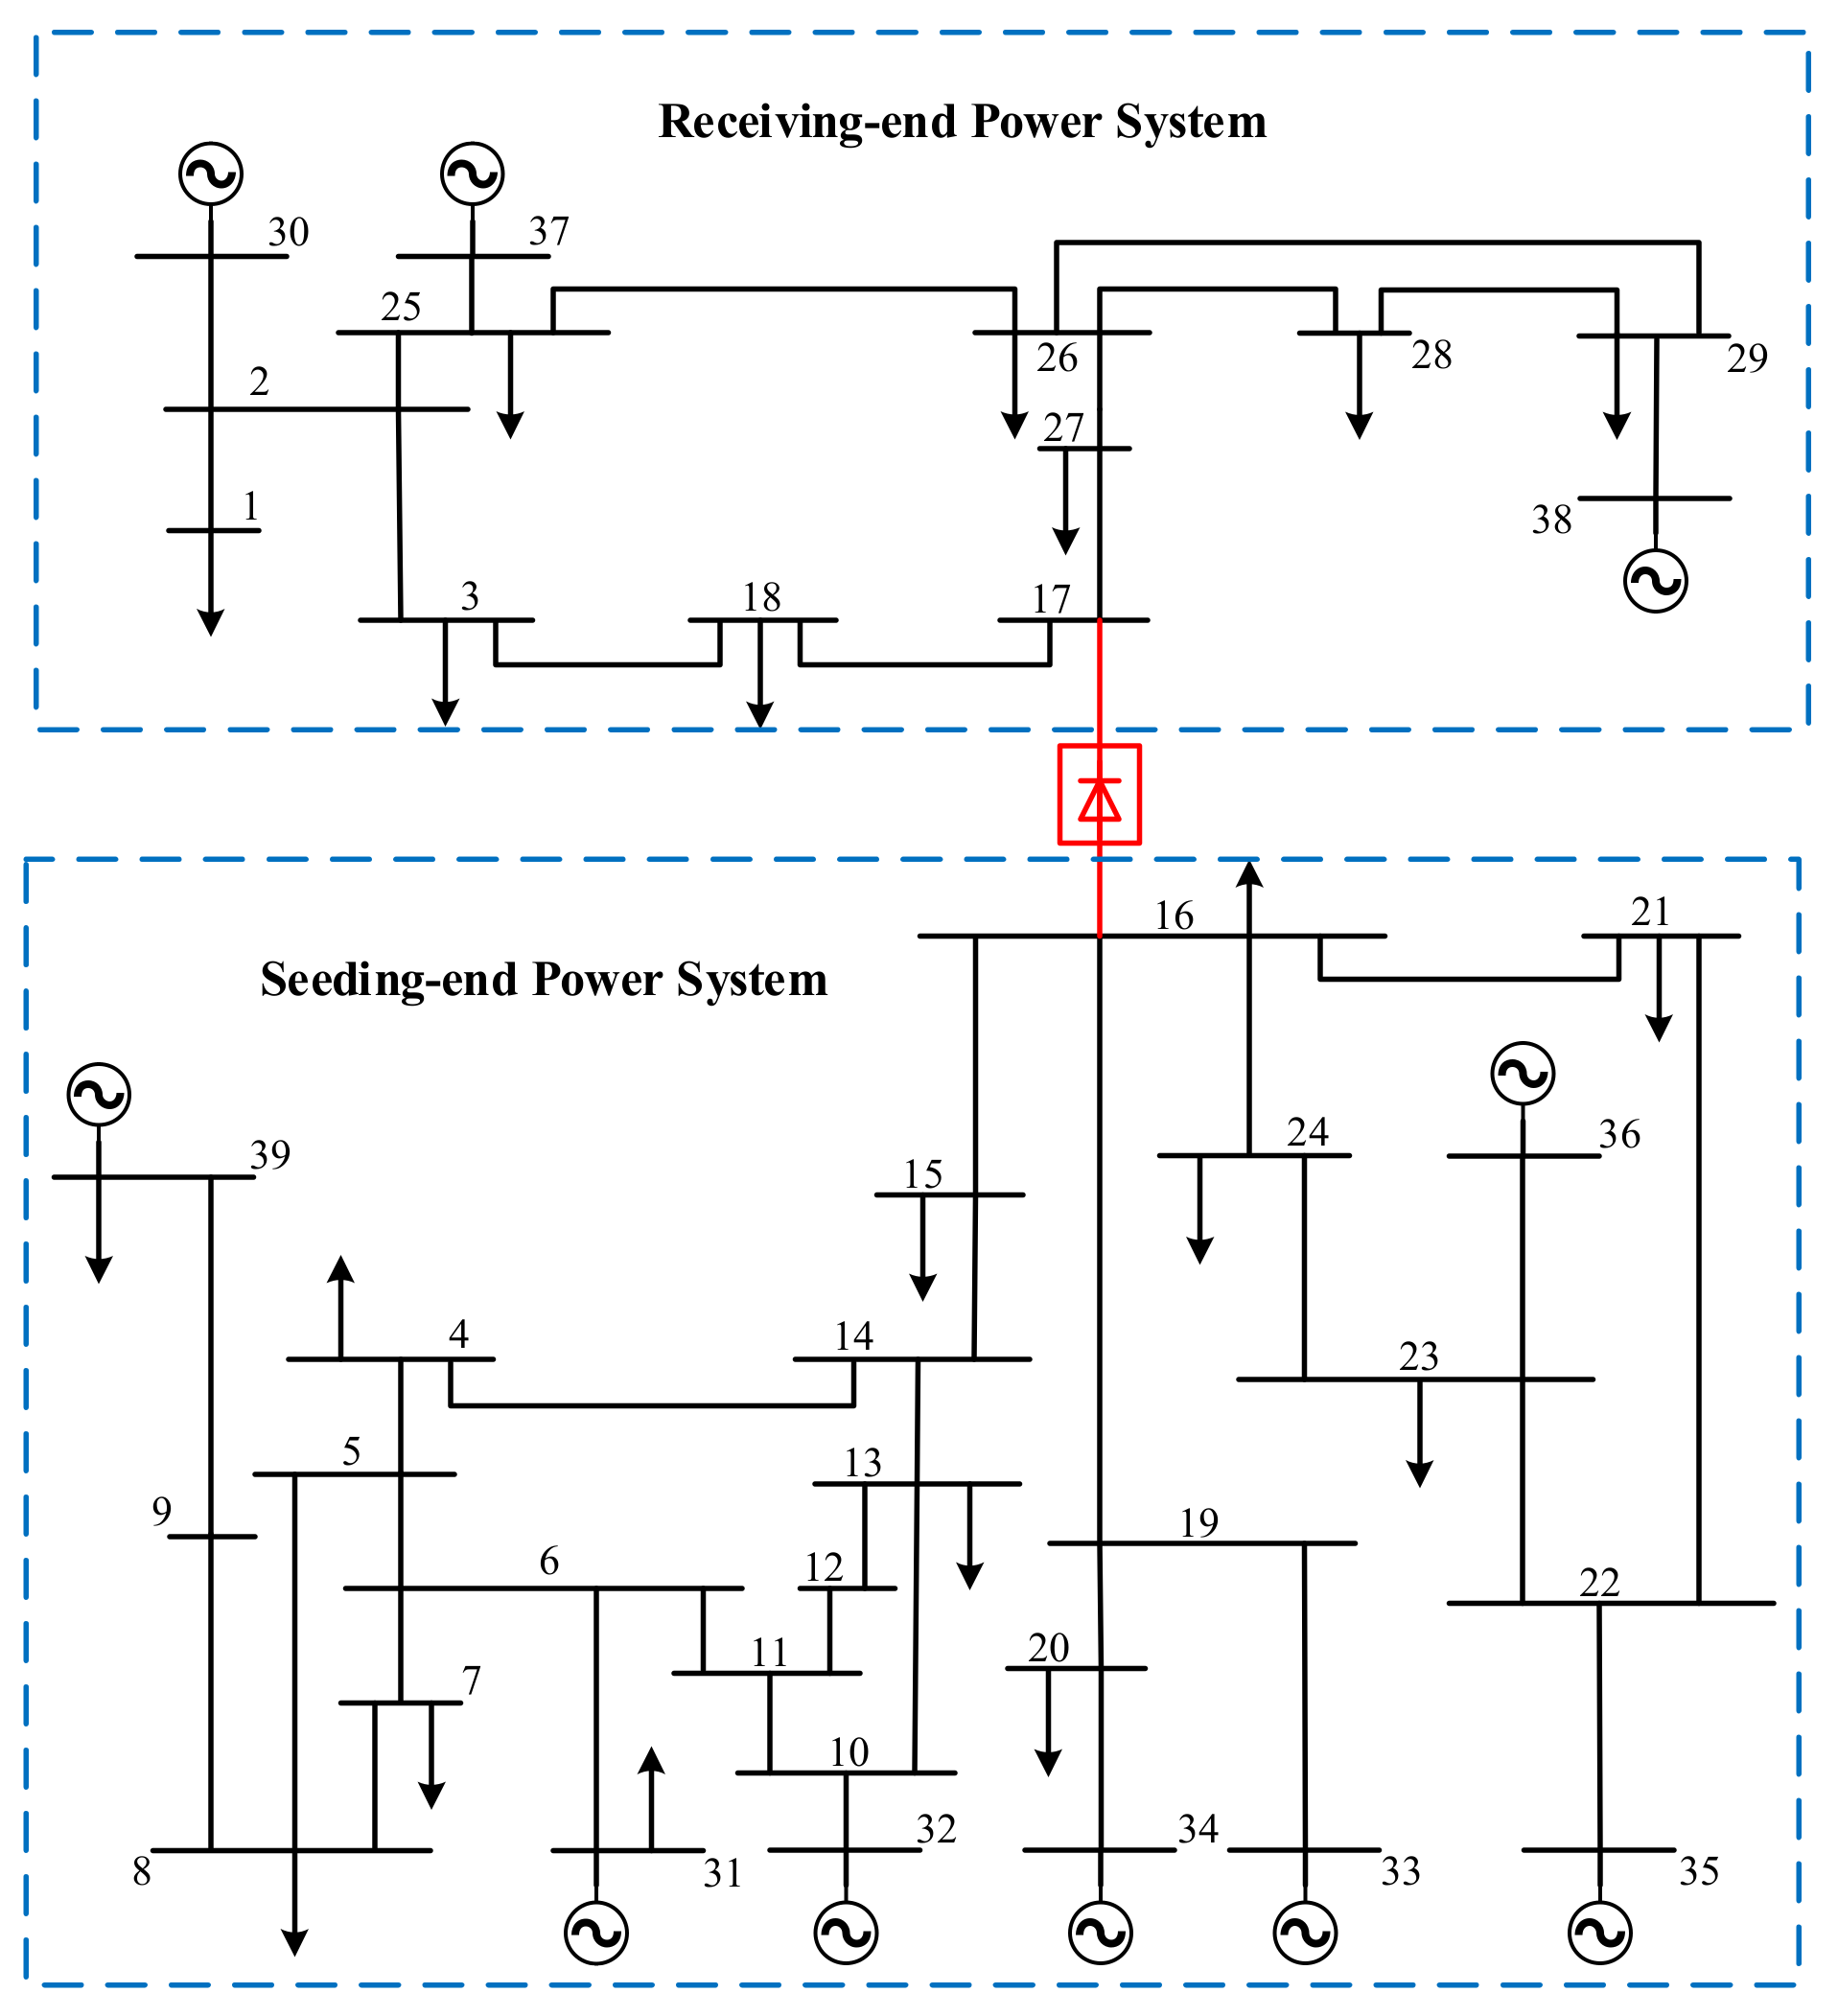
A simulation model of the IEEE 39-bus AC/DC asynchronous interconnection power system was built in the Advanced Digital Power System Simulator (ADPSS) to verify the effectiveness and robustness of the DC power recovery speed control strategy presented in this paper. The network topology is given in
Figure 12. The AC transmission lines between Bus-1 and Bus-39, and between Bus-3 and Bus-4, were cleared. The AC transmission line between Bus-16 and Bus-17 was replaced by LCC-HVDC, where Bus-16 is the rectifier station bus and Bus-17 is the inverter station bus. The ADPSS was developed by the Chinese Electric Power Research Institute [
30] and includes an electromechanical transient simulation module (Power System Analysis Software Package, PSASP) and an electromagnetic transient simulation module (Electromagnetic Transient Simulator for DC and AC power systems, ETSDAC) [
31].
Generally, the time scale of the electromagnetic transient process ranges from microseconds to milliseconds, while the time scale of the electromechanical transient process ranges from milliseconds to seconds. In addition, a commutation failure of LCC-HVDC is an electromagnetic transient process, which requires an electromagnetic model in order to characterize the dynamics of the DC system, while the transient stability of synchronous generators is an electromechanical transient process, which means that the electromechanical model is able to characterize the dynamics of the AC system. The typical simulation steps of the electromagnetic model and the electromechanical model are 50 us and 10 ms. Therefore, the DC system adopted the electromagnetic model on ETSDAC, and the AC system adopted the electromechanical model on PSASP. The total simulation time T was 5 s, and the simulation time steps of PSASP and ETSDAC were 10 ms and 50 us, respectively. The damping coefficient of the generators was μ = Di/TJi, and a CF occurred when γ < γmin = 7°.
As shown in
Figure 12, an AC fault was set near the inverter station in the receiving-end power system, and the fault duration was long enough to cause an SCF in the DC system during the recovery after the clearance of the AC fault. Then, the Maximum Relative Rotor Angle (MRRA) of the generators in the post-fault sending-end power system was employed to assess the transient stability margin, where the generators, except for the generator at Bus-39 (Group B), were grouped into Group A according to the coherence situation when the AC fault occurred. The smaller the relative rotor angle of the post-fault power system during the first swing is, the larger the transient stability margin of the post-fault power system will be.
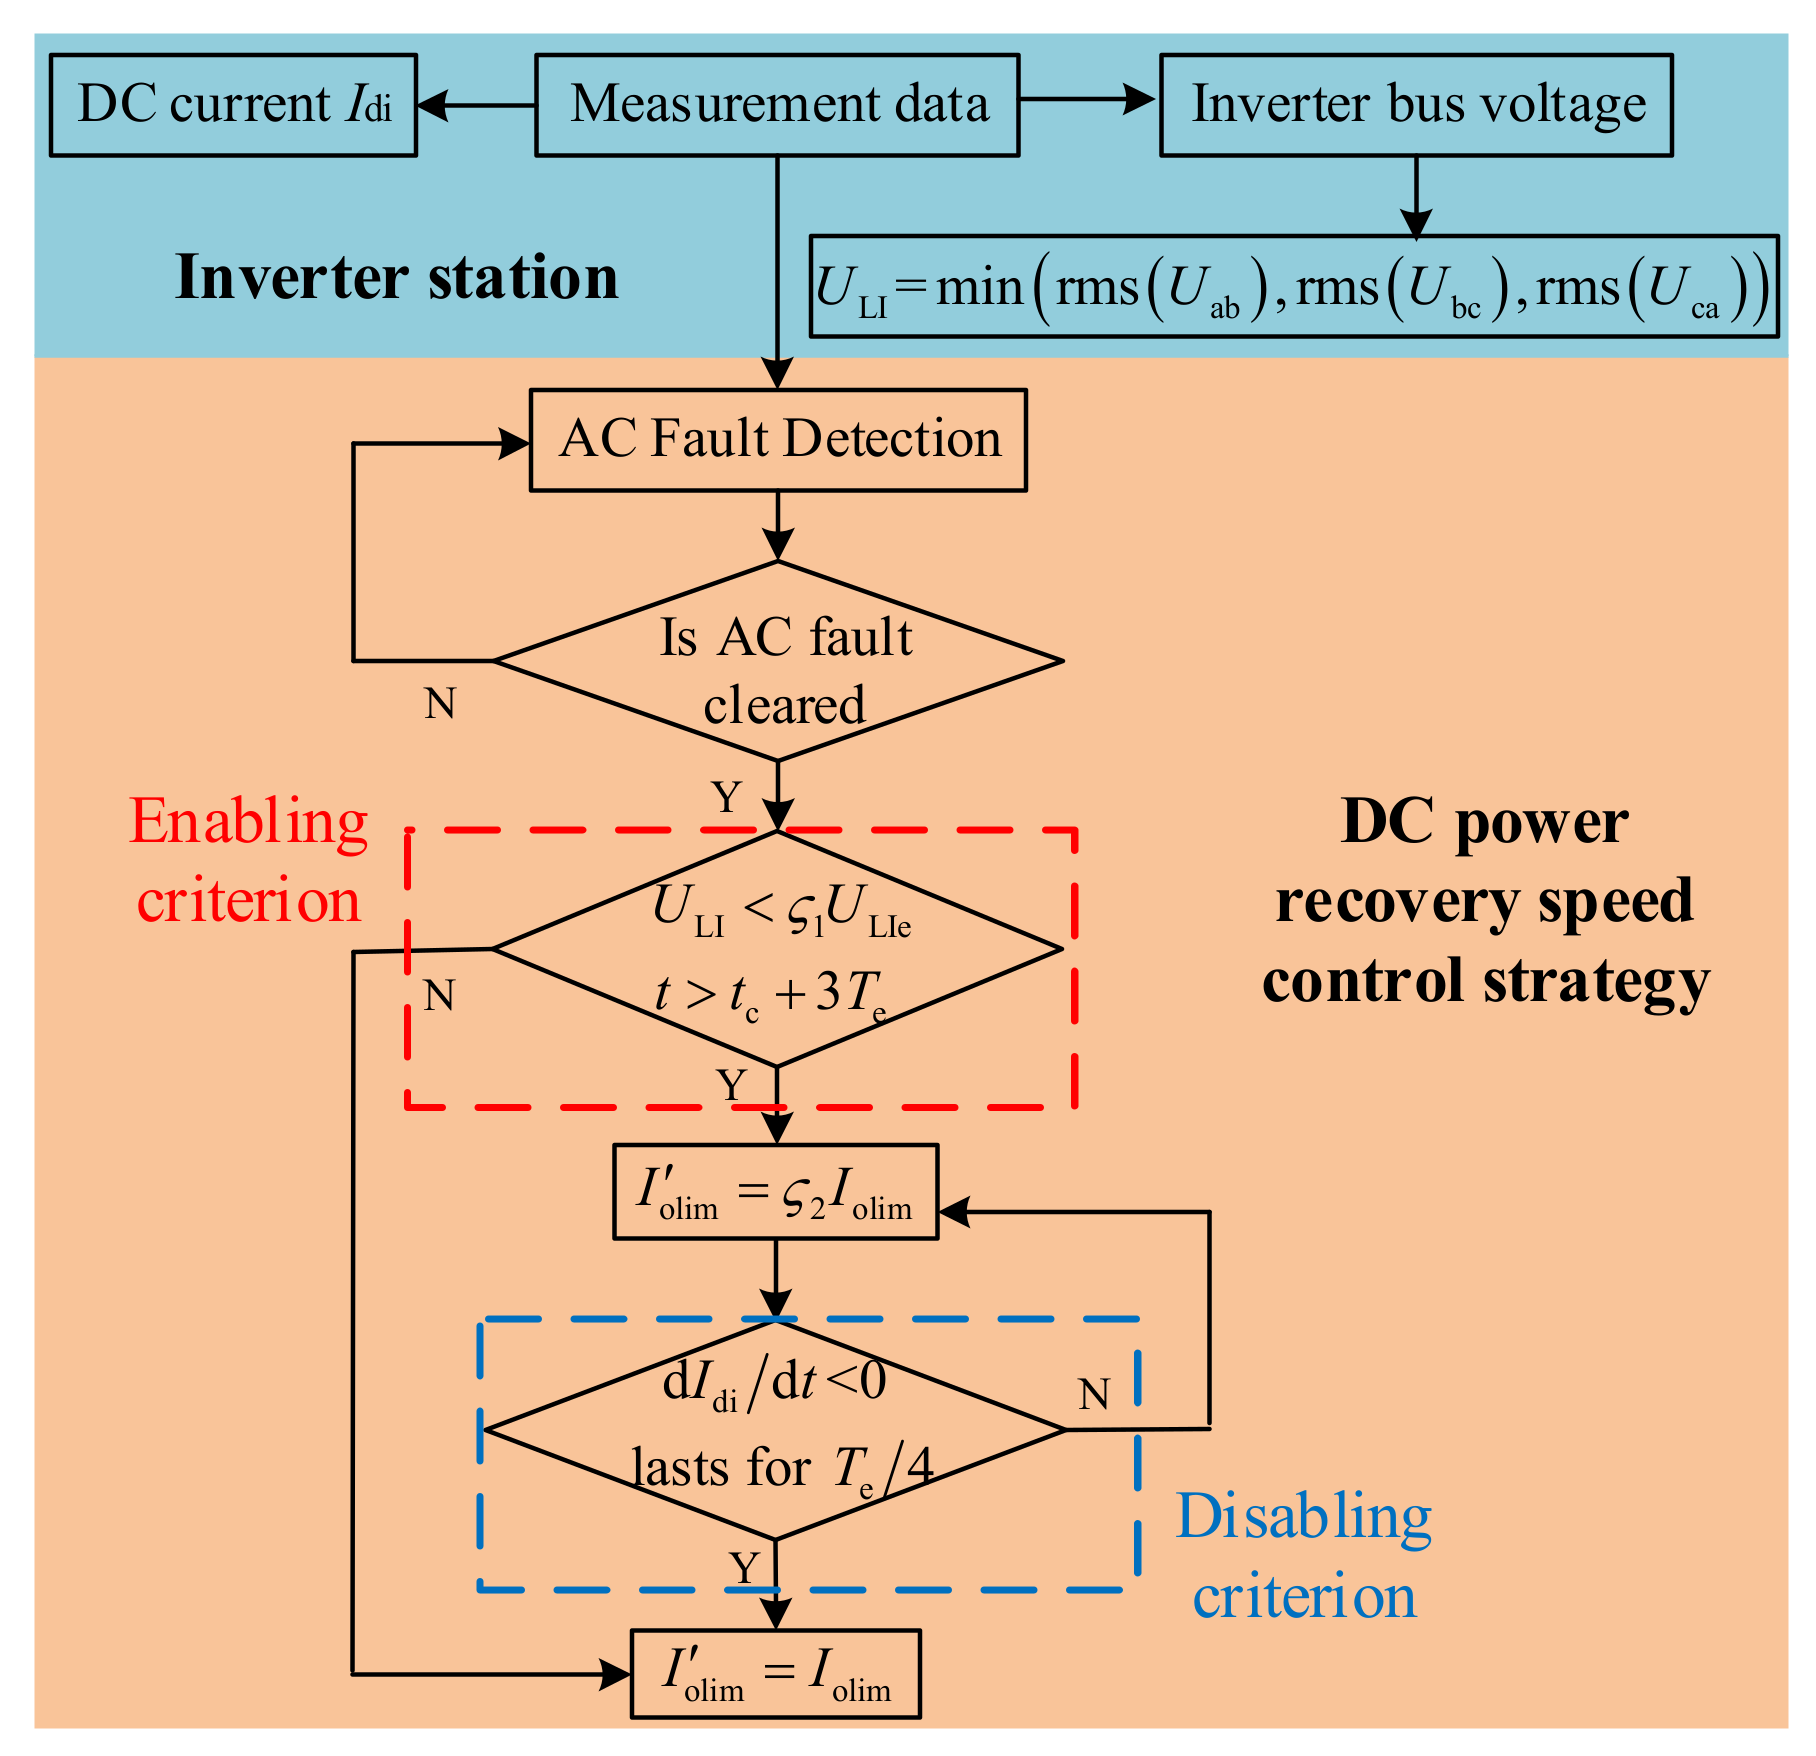
Finally, two control strategies for the DC control system were defined and employed in different scenarios to verify the effectiveness and robustness of the proposed control strategy.
Control Strategy 1 (CS-1): The DC control system adopts the standard control strategy given in
Figure 6.
Control Strategy 2 (CS-2): Based on CS-1, the proposed DC power recovery speed control strategy is employed as an additional form of control by the DC control system. Here, the parameters of the proposed control strategy are ς1 = 0.9 and ς2 = 0.5.
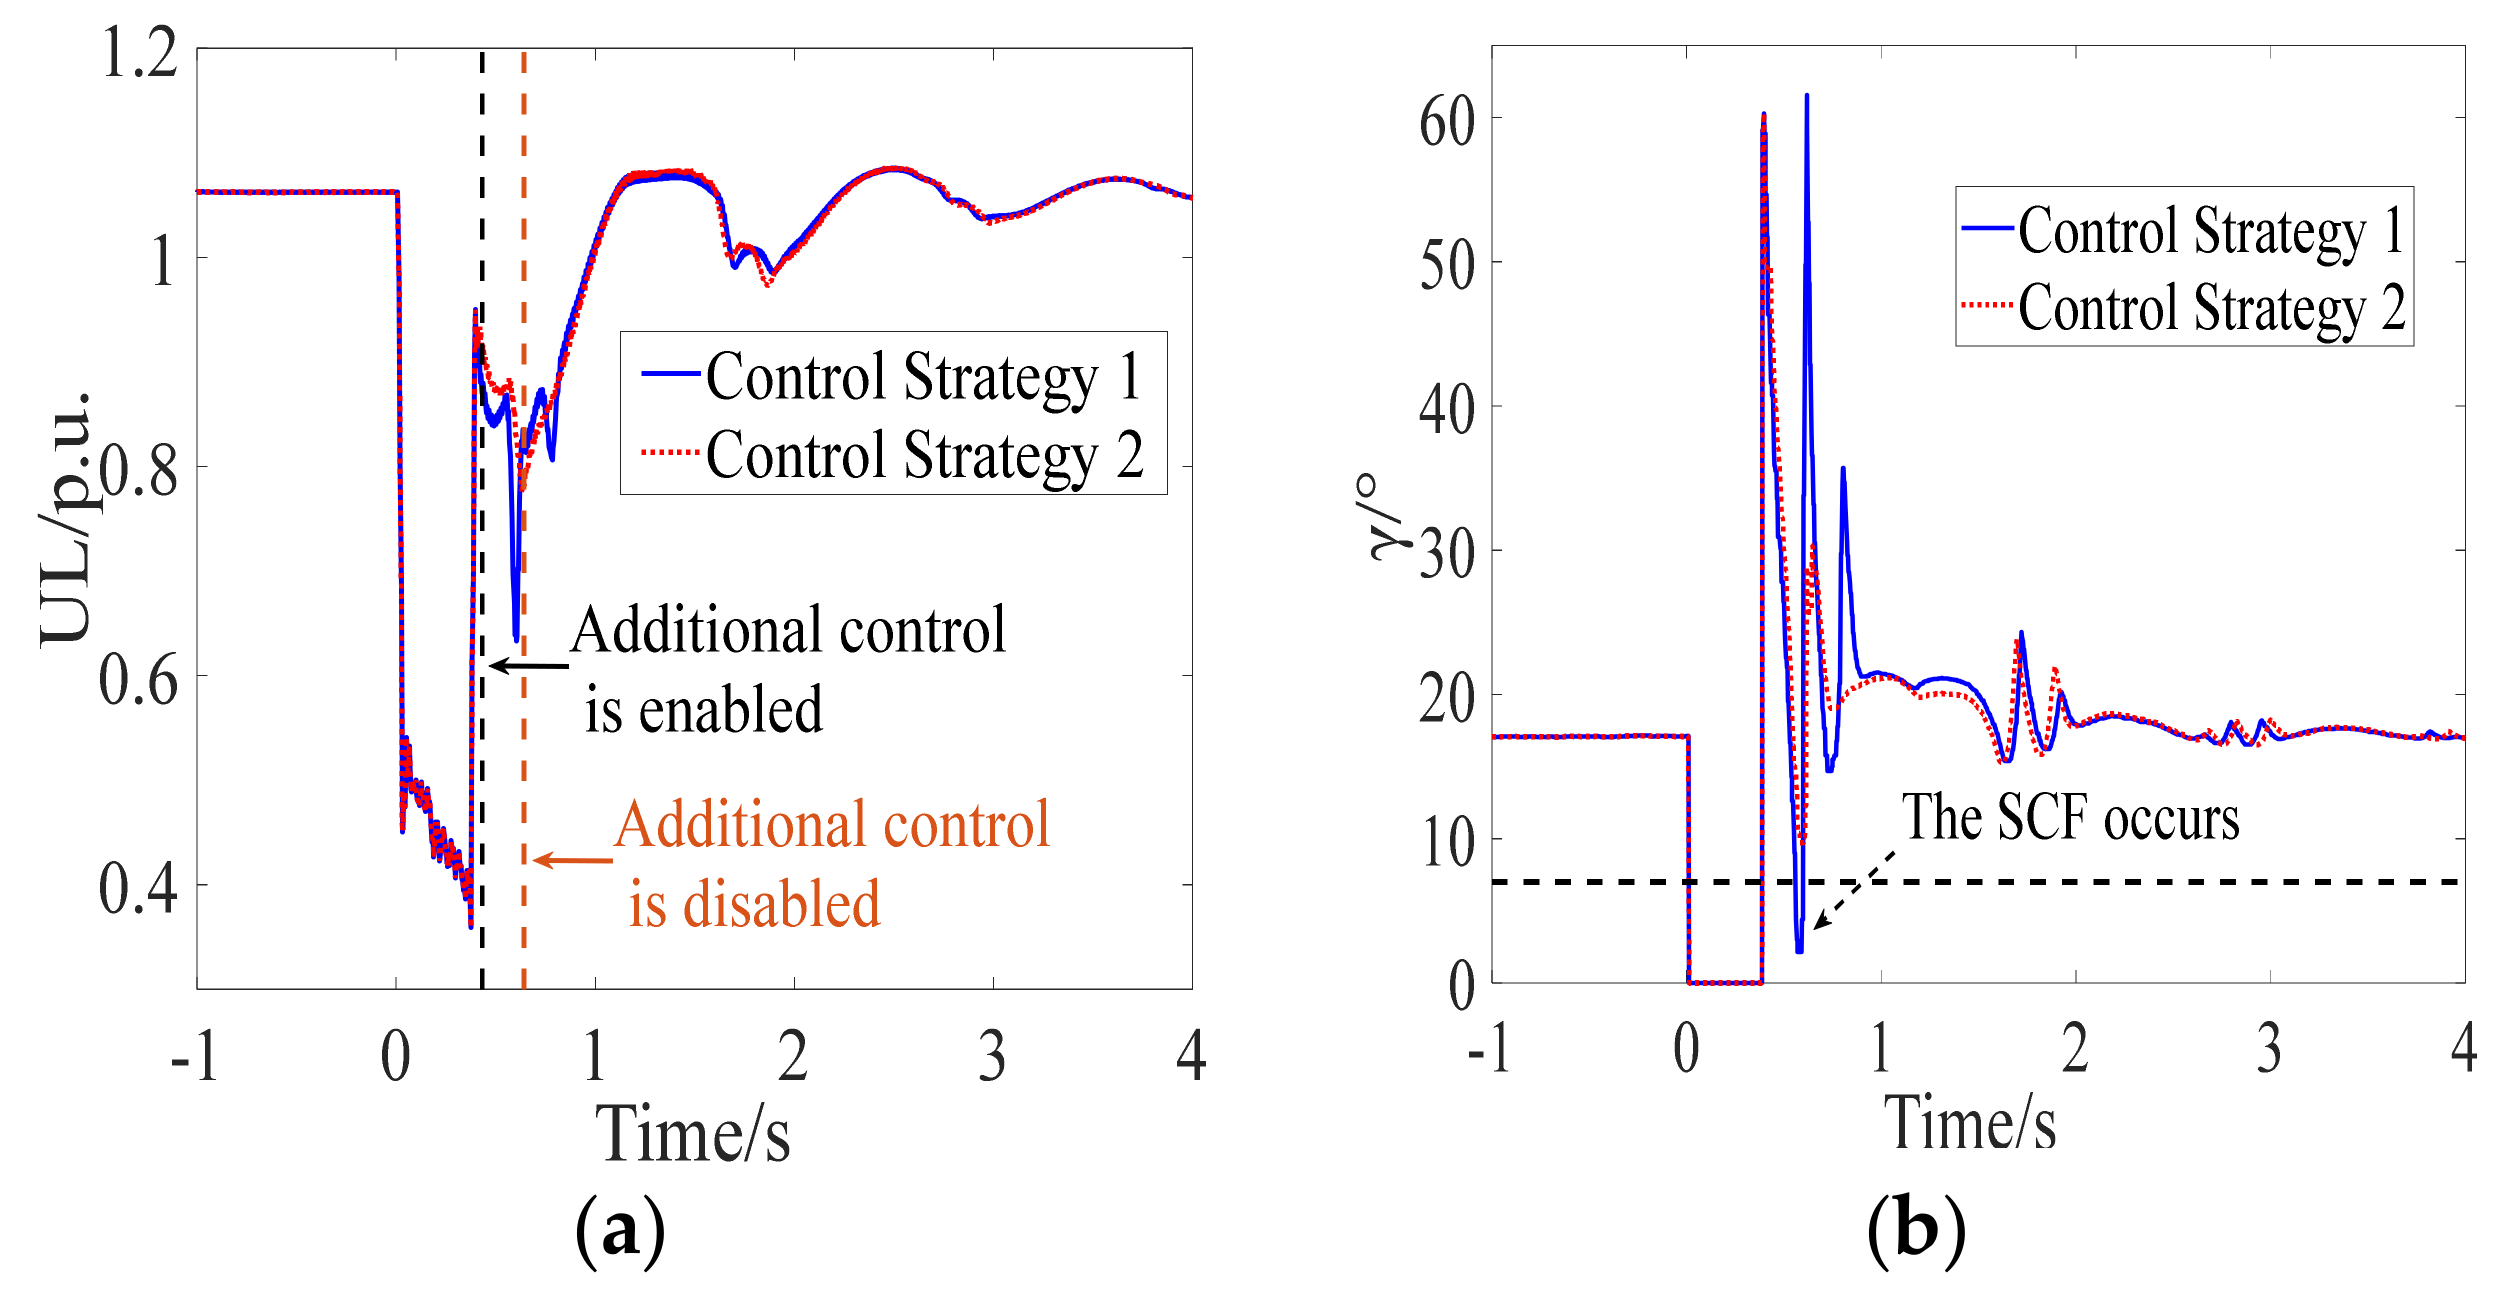
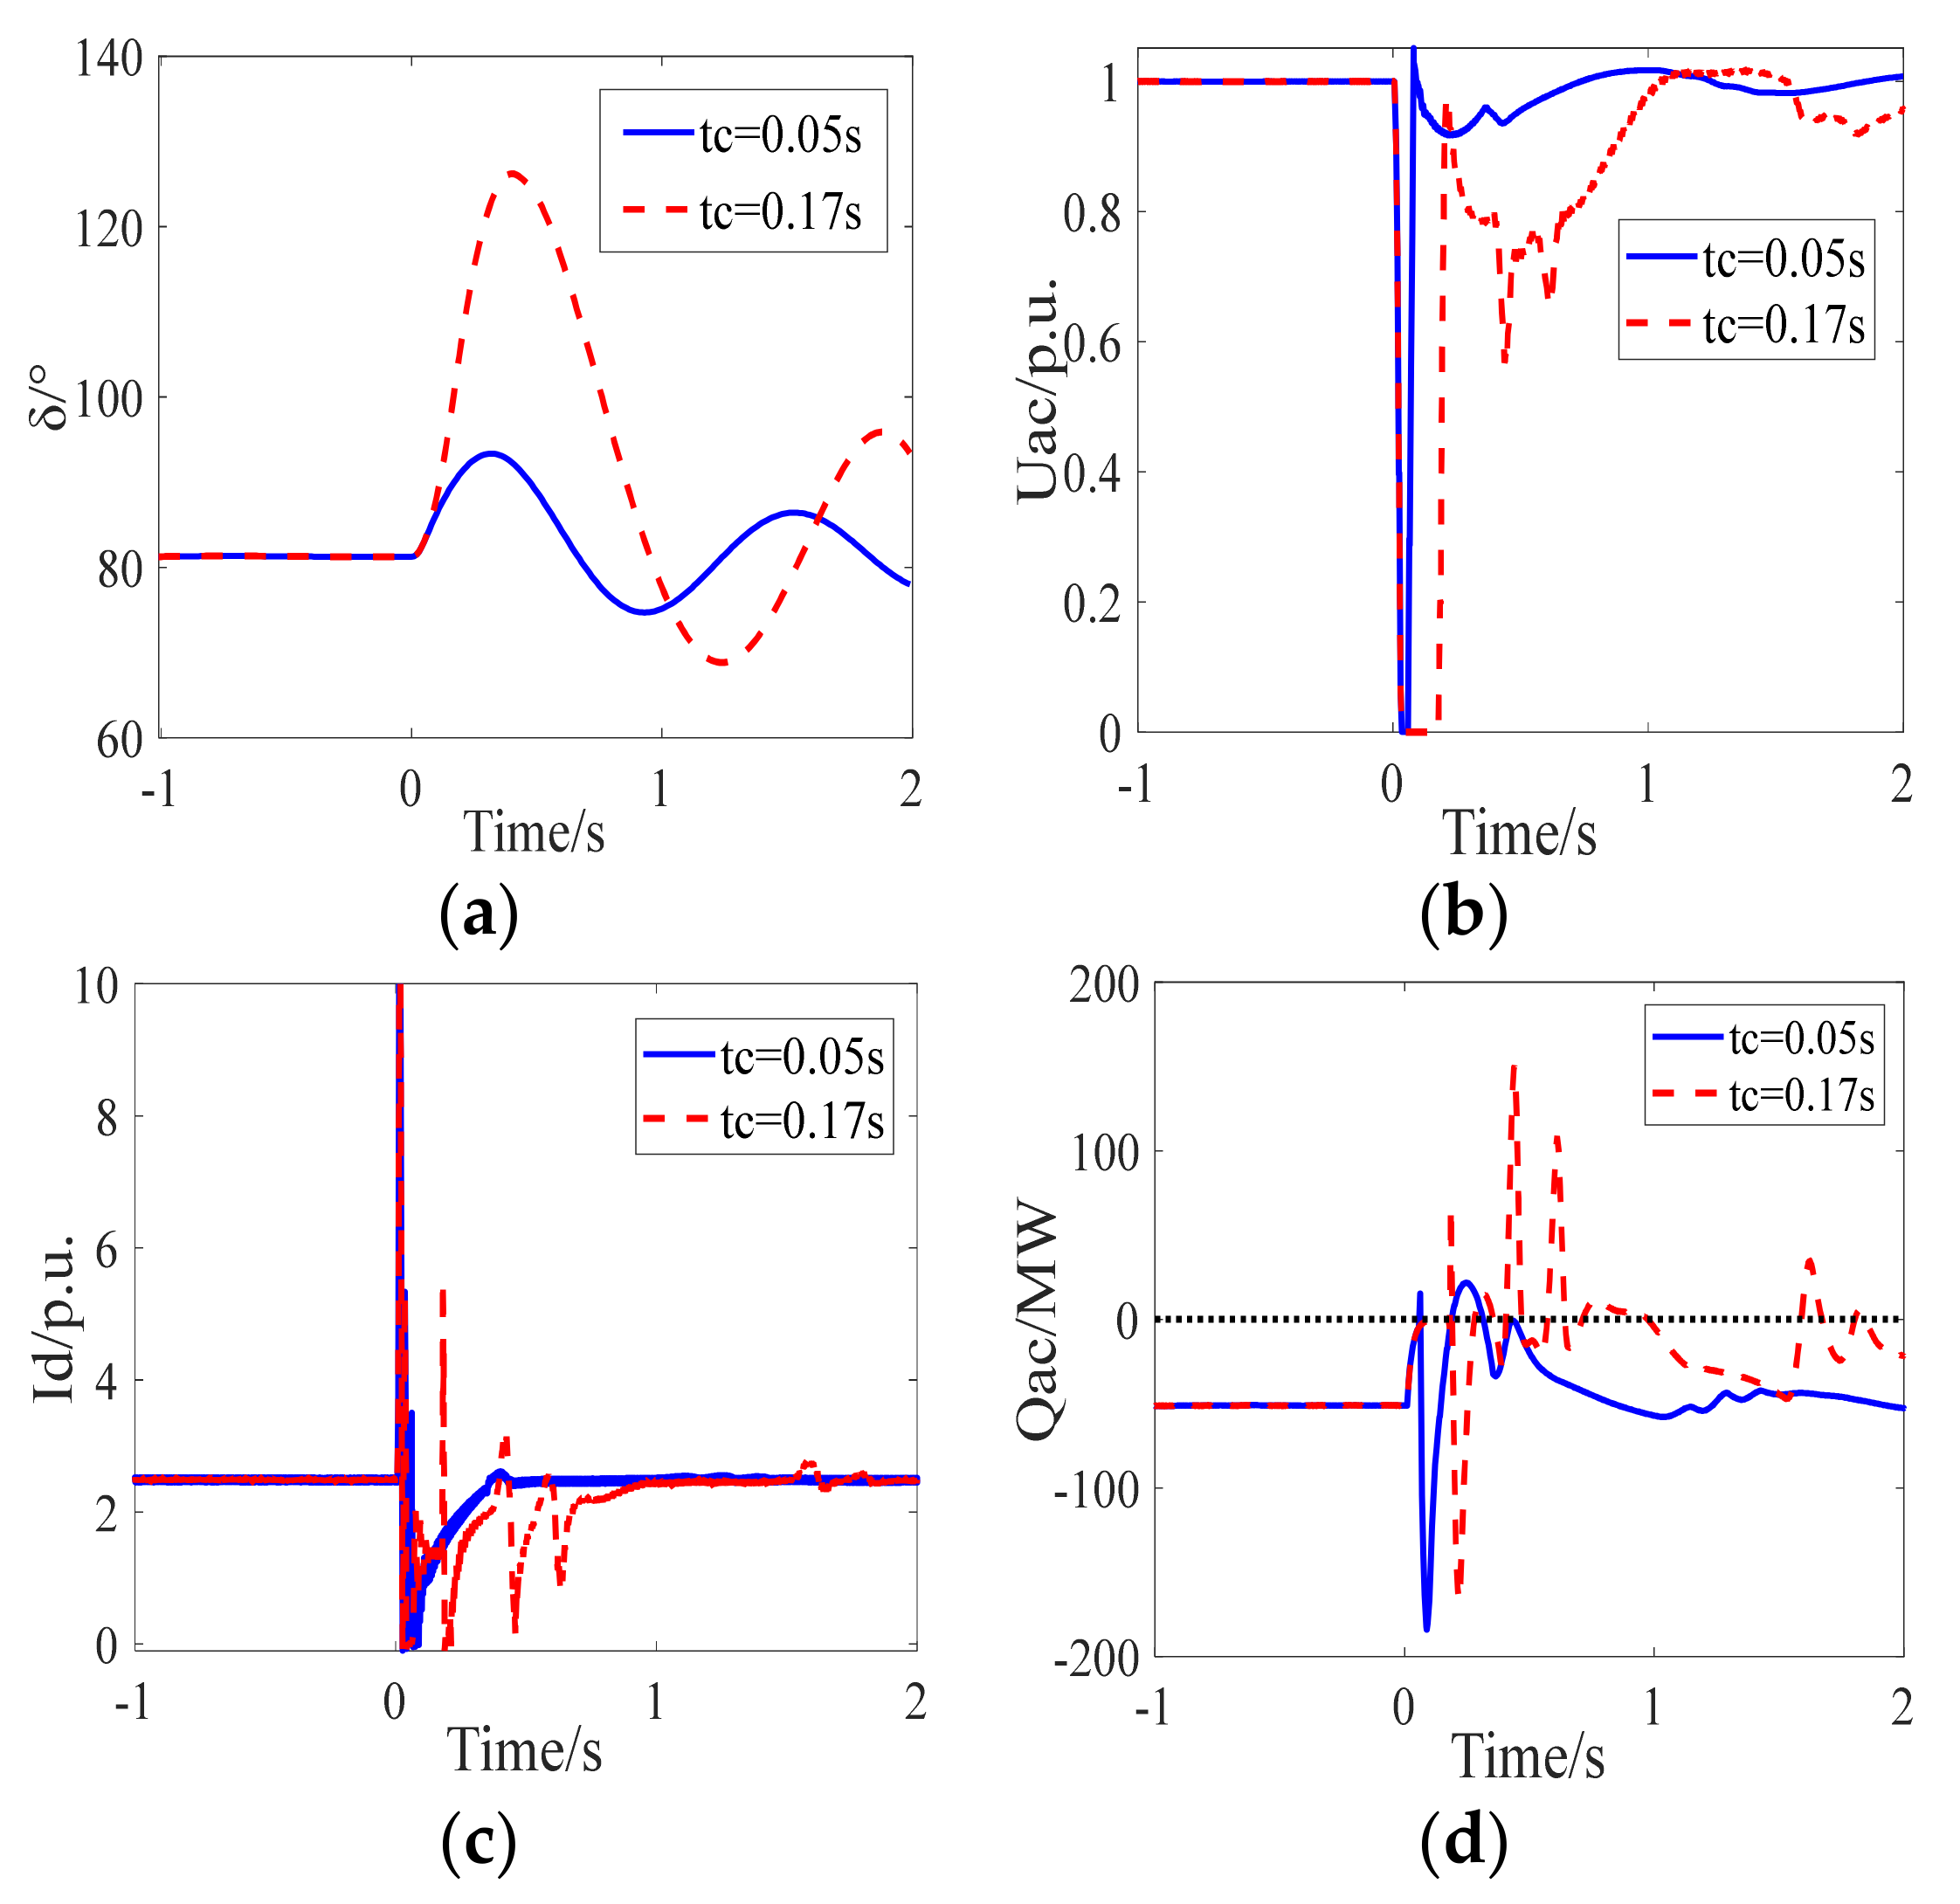
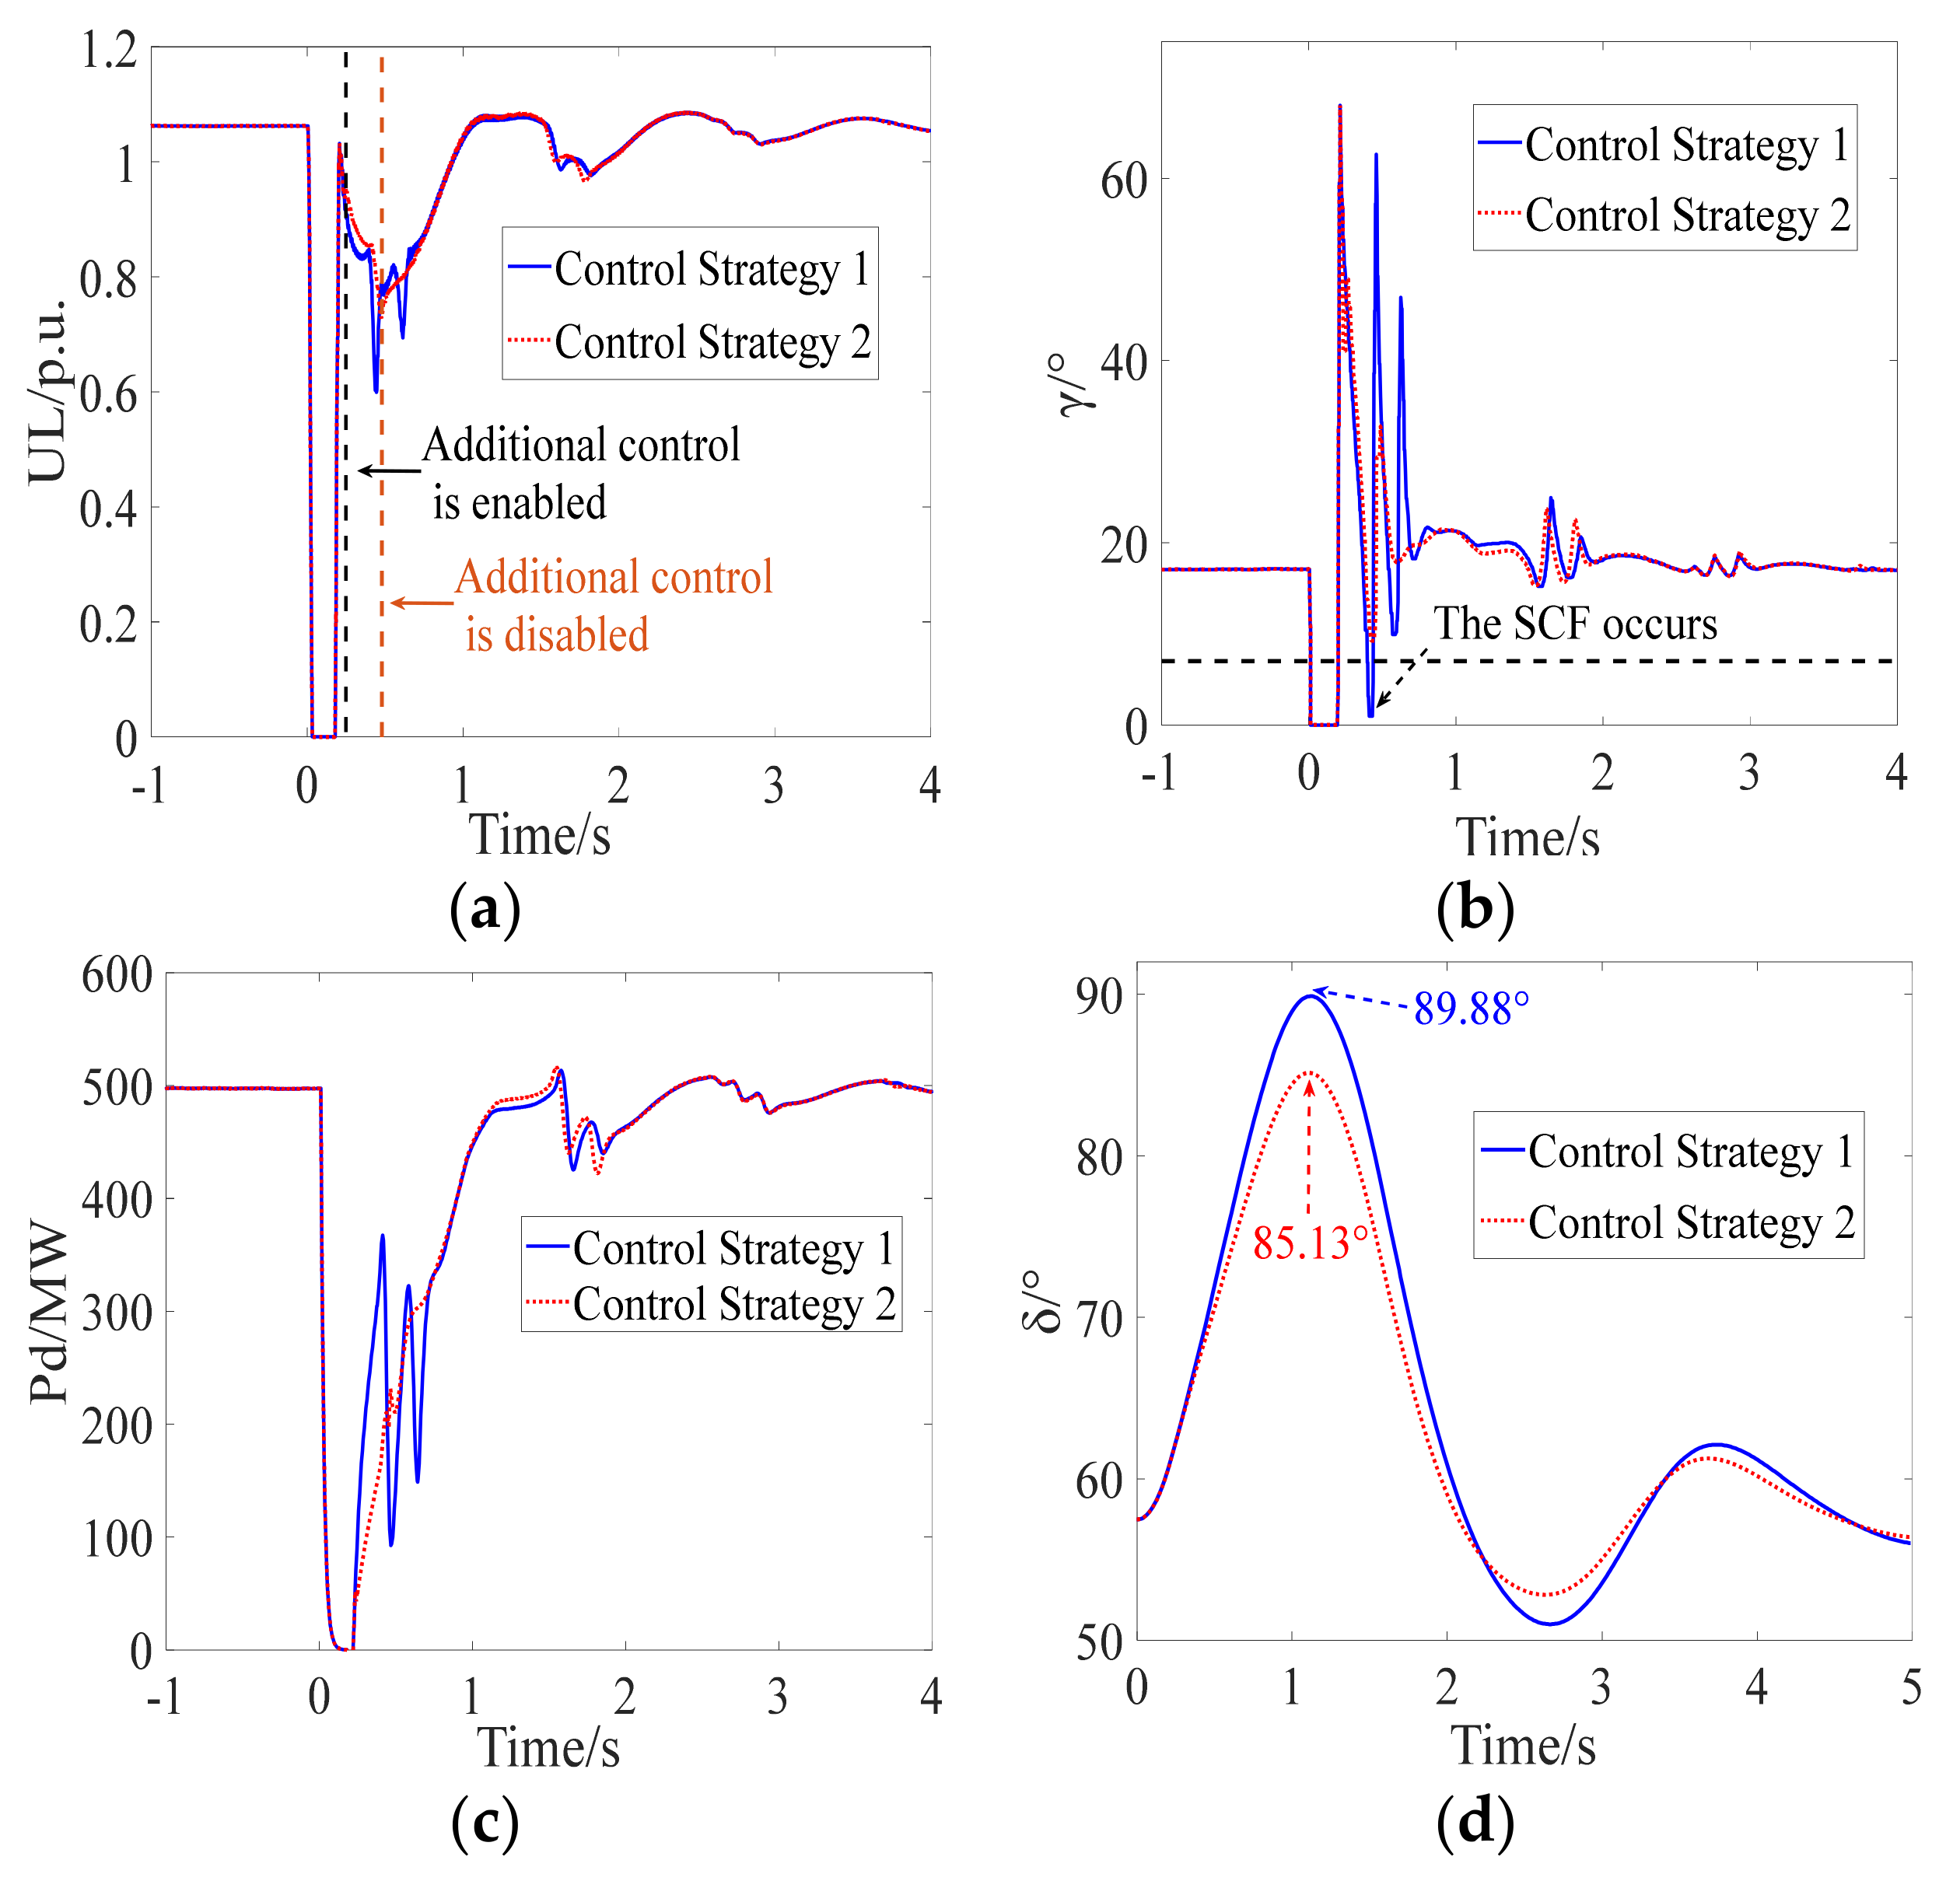
Scenario 1: A three-phase short circuit fault is set at Bus-17, which starts at t = 0 s and lasts for 0.17 s.
The inverter bus voltage, extinction angle, DC power, and relative rotor angle of the sending-end power system are shown in
Figure 13a–d. The occurrence of the AC fault causes the first CF of LCC-HVDC. After the clearance of the AC fault, it can be seen from the blue solid line in
Figure 13a that the post-fault voltage of the inverter bus decreases rapidly and to a great extent, which indicates that the transient stability of the post-fault receiving-end power system has seriously deteriorated. The SCF (the blue solid line shown in
Figure 13b) occurs during the recovery when the DC control system adopts CS-1, demonstrating the correctness of the mechanism analysis of SCFs as affected by transient stability. Moreover, it can be seen from the red dotted line that the SCF is effectively prevented during the recovery when the DC control system adopts CS-2. In CS-2, the proposed control strategy is adopted as an additional form of control. The additional control (the red dotted line shown in
Figure 13a) is enabled when Equation (20) is satisfied, while the DC power recovery speed is limited by modifying the output DC current order
Iolim to
I′
olim =
ς2Iolim, so that the occurrence of the SCF is prevented. Then, the additional control is disabled based on Equation (29). Due to the occurrence of the SCF, it can be seen from the blue solid line in
Figure 13c that the DC power fluctuates seriously during the recovery. When the proposed control strategy is employed, the recovery characteristic of the DC power is improved, which increases the transient stability margin of the sending-end power system as shown in
Figure 13d. The effectiveness of the proposed control strategy is confirmed by the simulation results.
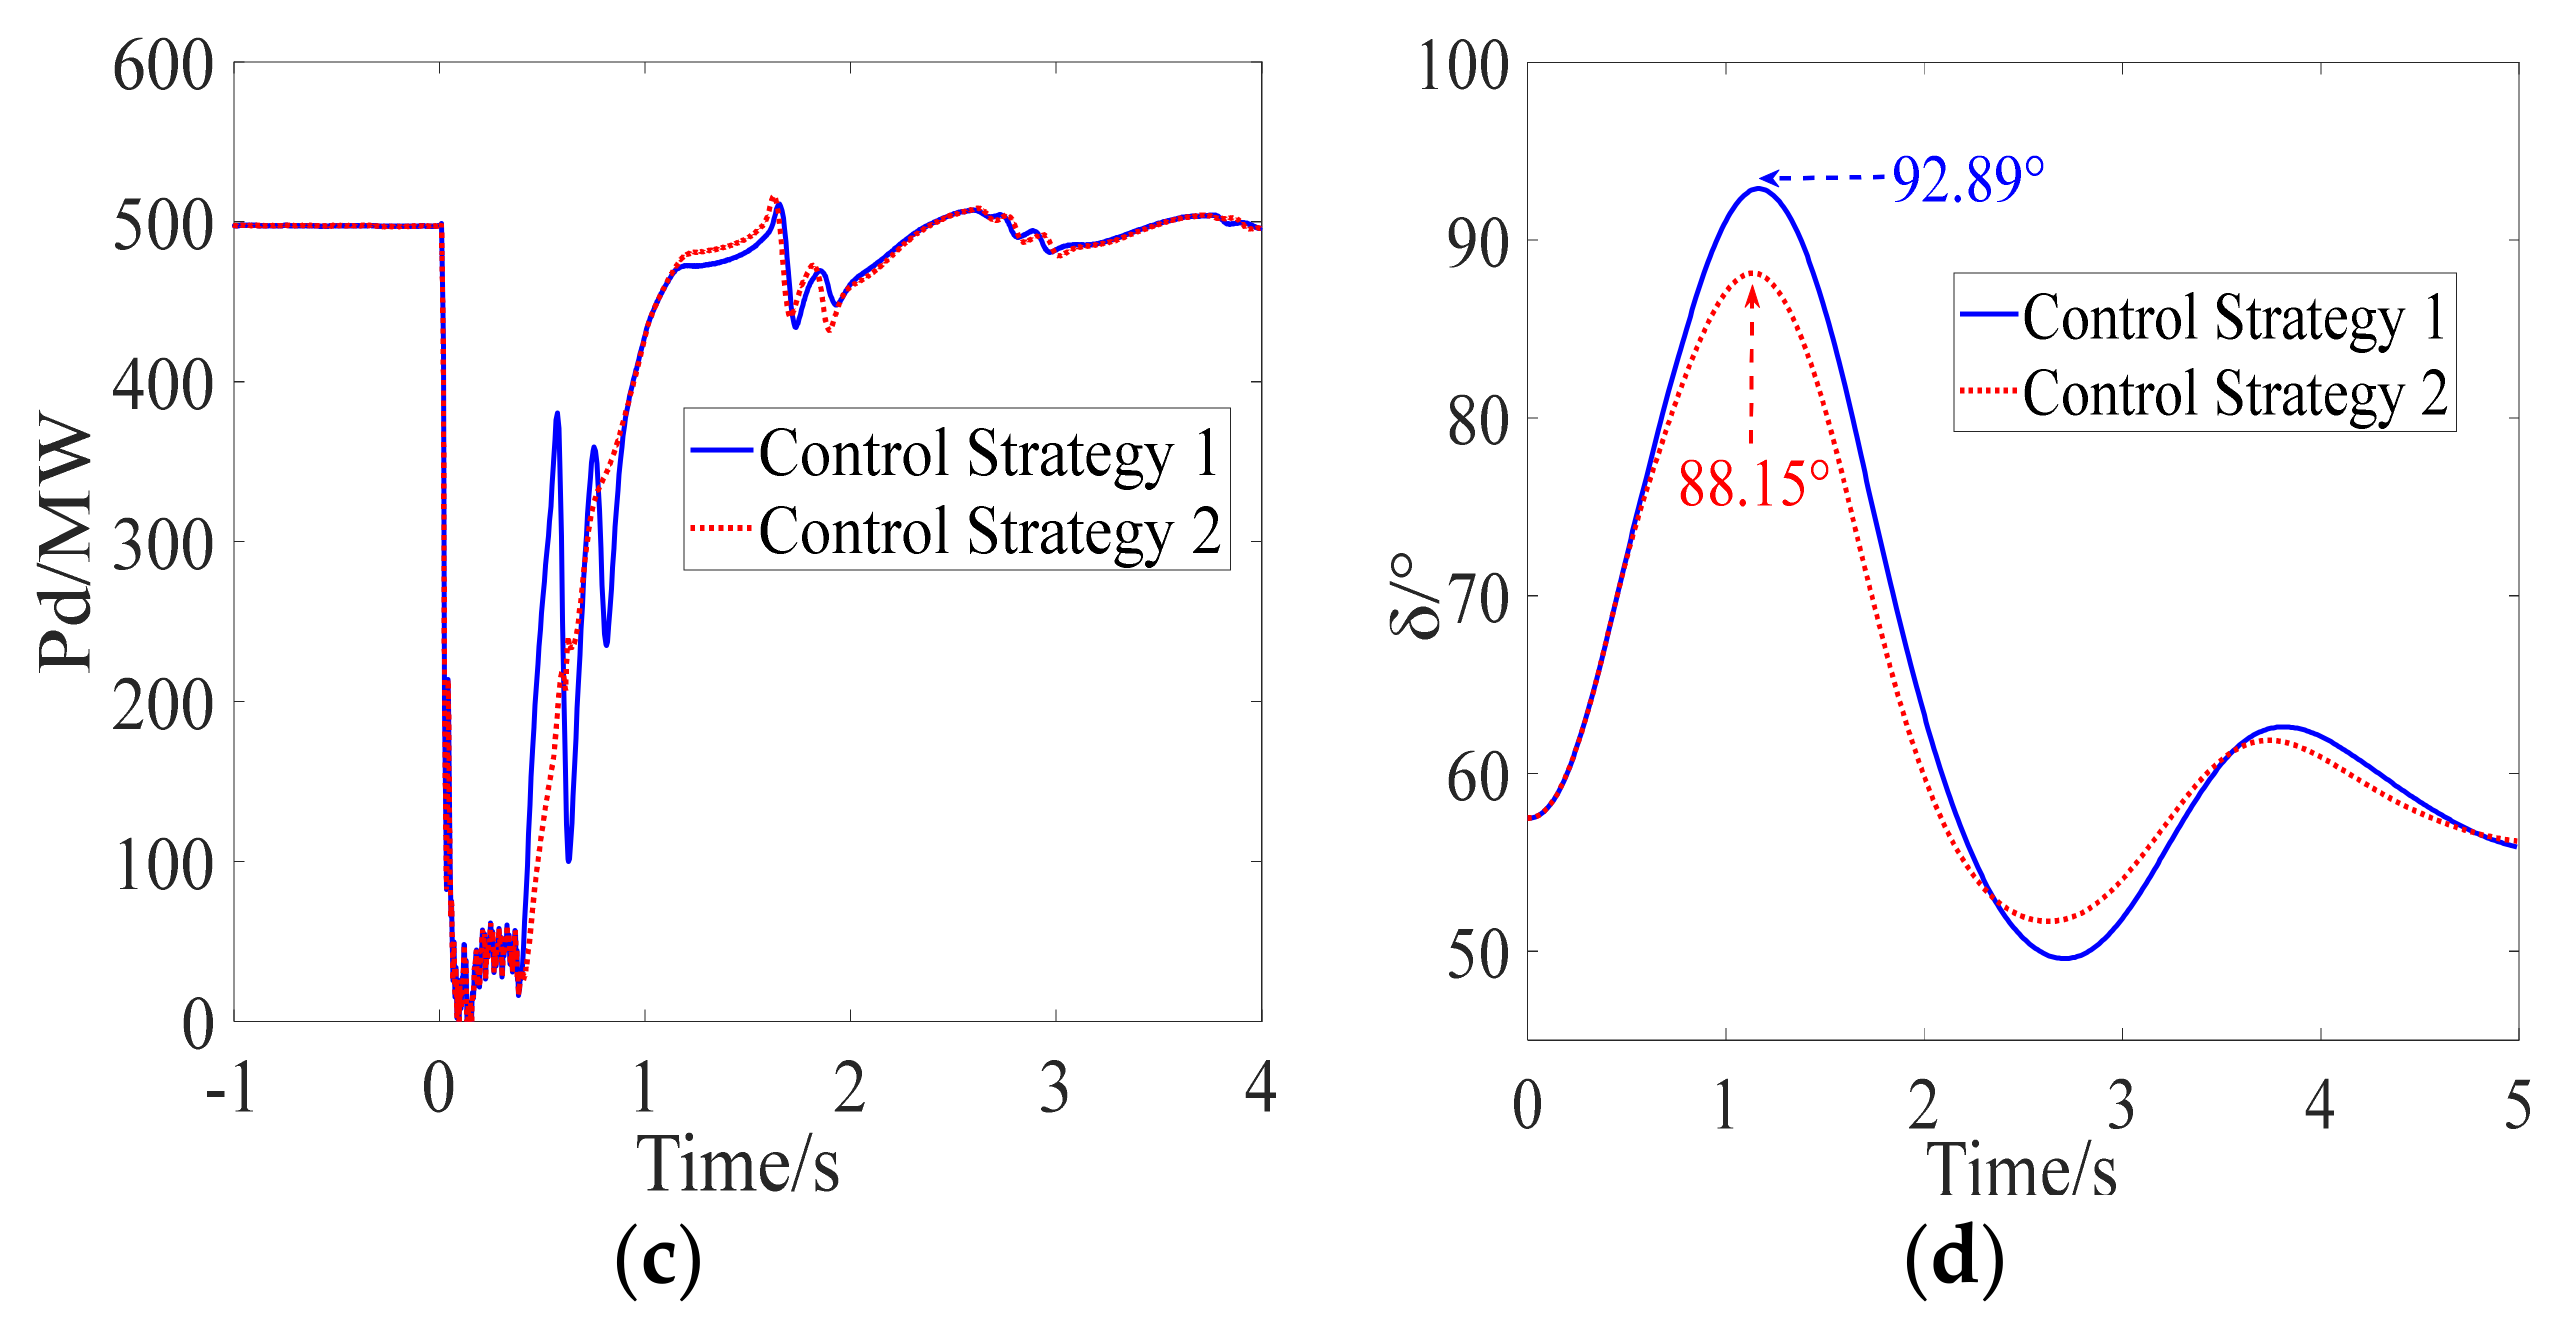
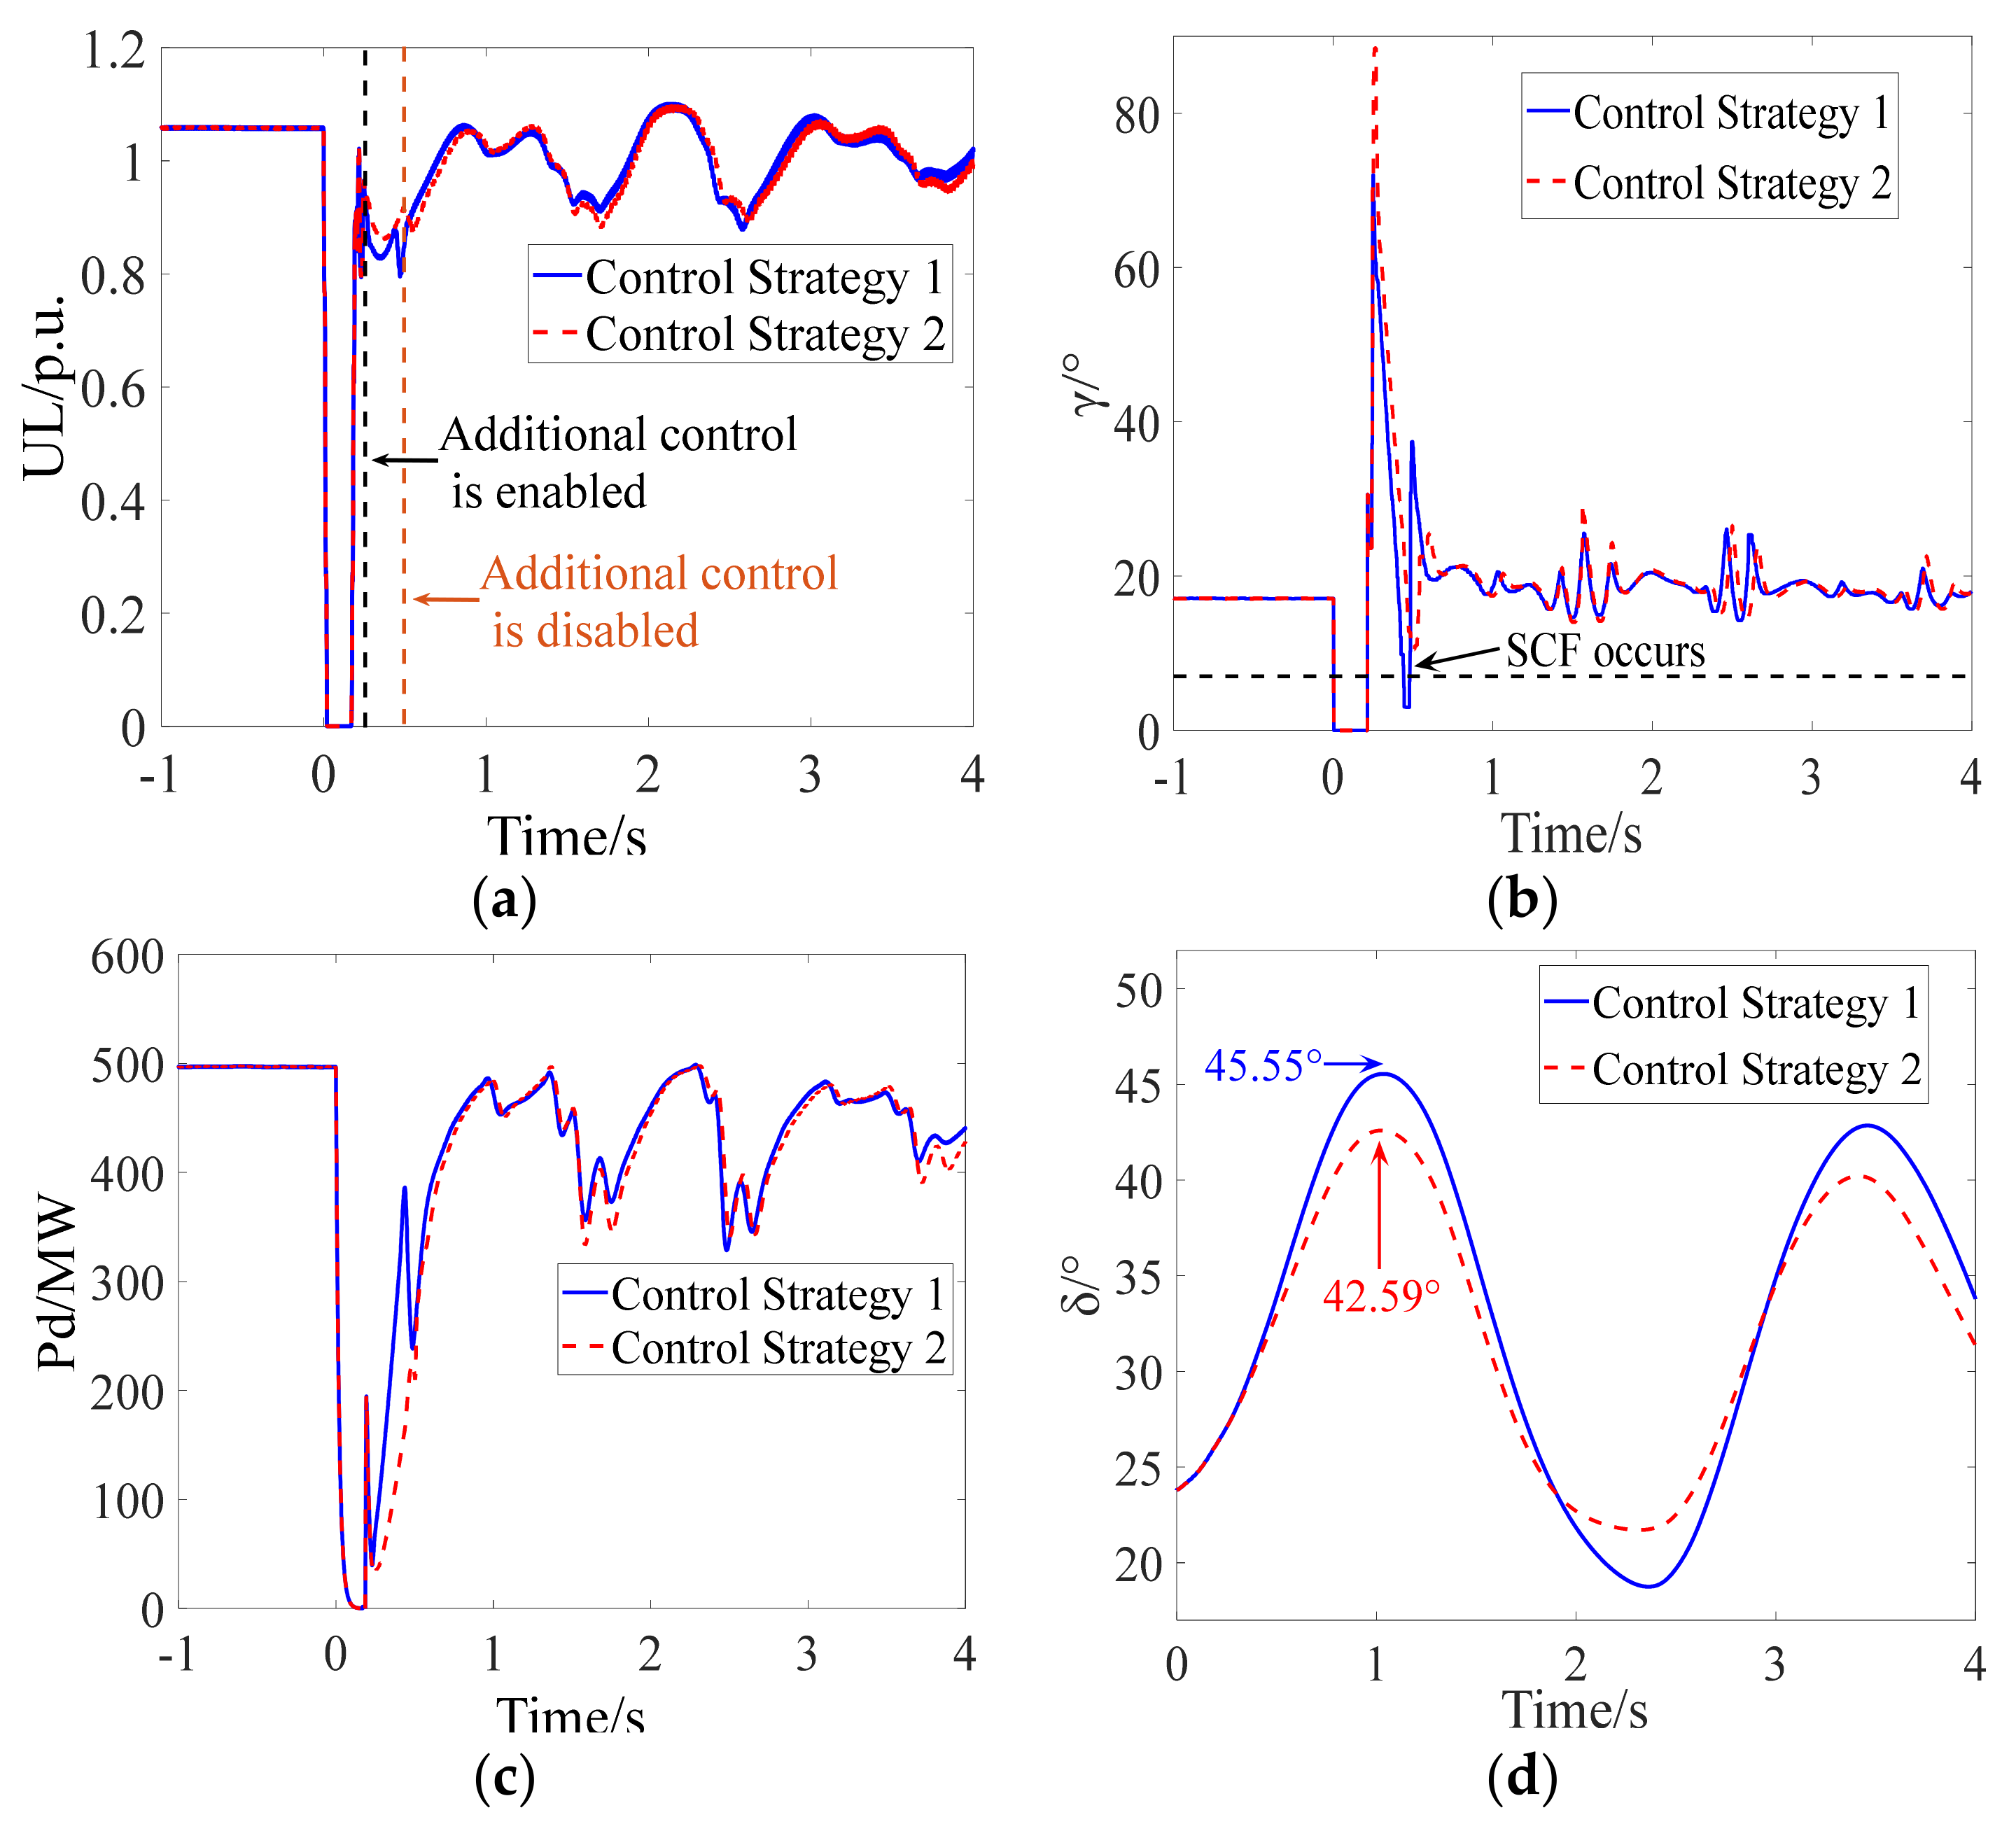
Scenario 2: A single-phase grounding fault is set at Bus-17, which starts at t = 0 s and lasts for 0.36 s.
As shown in
Figure 14a,d, the occurrence of the AC fault causes the first CF of LCC-HVDC. After the clearance of the AC fault, an SCF occurs when the DC control system adopts CS-1, while the SCF is prevented when the DC control system adopts CS-2, indicating the effectiveness of the proposed control strategy. As shown
Figure 14c,d, the transient stability margin of the sending-end power system is increased due to the fact that the severe fluctuation in DC power caused by an SCF is avoided. A comparison with Scenario 1 verified the effectiveness of the proposed control strategy in different scenarios.
5.2. Comparative Analysis with Different Fault Types and Locations
The definition of robustness is that the control strategy has the ability to maintain a certain level of performance under uncertain disturbances. In order to investigate the robustness of the proposed control strategy, at different buses in the test power system shown in
Figure 12, different types of AC faults were set near the inverter station, where the first CF caused by the AC fault was simulated. The fault duration was set to be long enough to cause an SCF in the DC system during the recovery after the clearance of the AC fault, and CS-1 and CS-2 were employed by the DC control system. The results are given in
Table 1.
Compared with the simulation results of the DC control system that adopted CS-1 in different scenarios, the occurrence of an SCF was prevented, demonstrating the robustness of the proposed control strategy. Due to the fact that the severe fluctuation in DC power was avoided, the maximum relative rotor angle of the post-fault sending-end power system when the DC control system adopted CS-2 is lower than that of the post-fault sending-end power system when the DC control system adopted CS-1, indicating an improvement in the transient stability margin of the sending-end power system when the DC control system adopted CS-2.
5.3. Comparative Analysis with Different SCRs
In addition, different types of AC faults were set at Bus-17 in the receiving-end system with different SCRs (high-SCR power systems, SCR > 3; low-SCR power systems, SCR ≤ 3) [
32]. The fault duration was set to be long enough to cause an SCF in the DC system during the recovery after the clearance of the AC fault, and CS-1 and CS-2 were employed by the DC control system. The simulation results are given in
Table 2.
Compared with the simulation results of the DC control system that adopted CS-1 in the receiving-end system with different SCRs, the occurrence of an SCF was prevented, and the transient stability margin of the sending-end power system was improved when the DC control system adopted CS-2, validating the robustness of the proposed control strategy.
5.4. Discussion
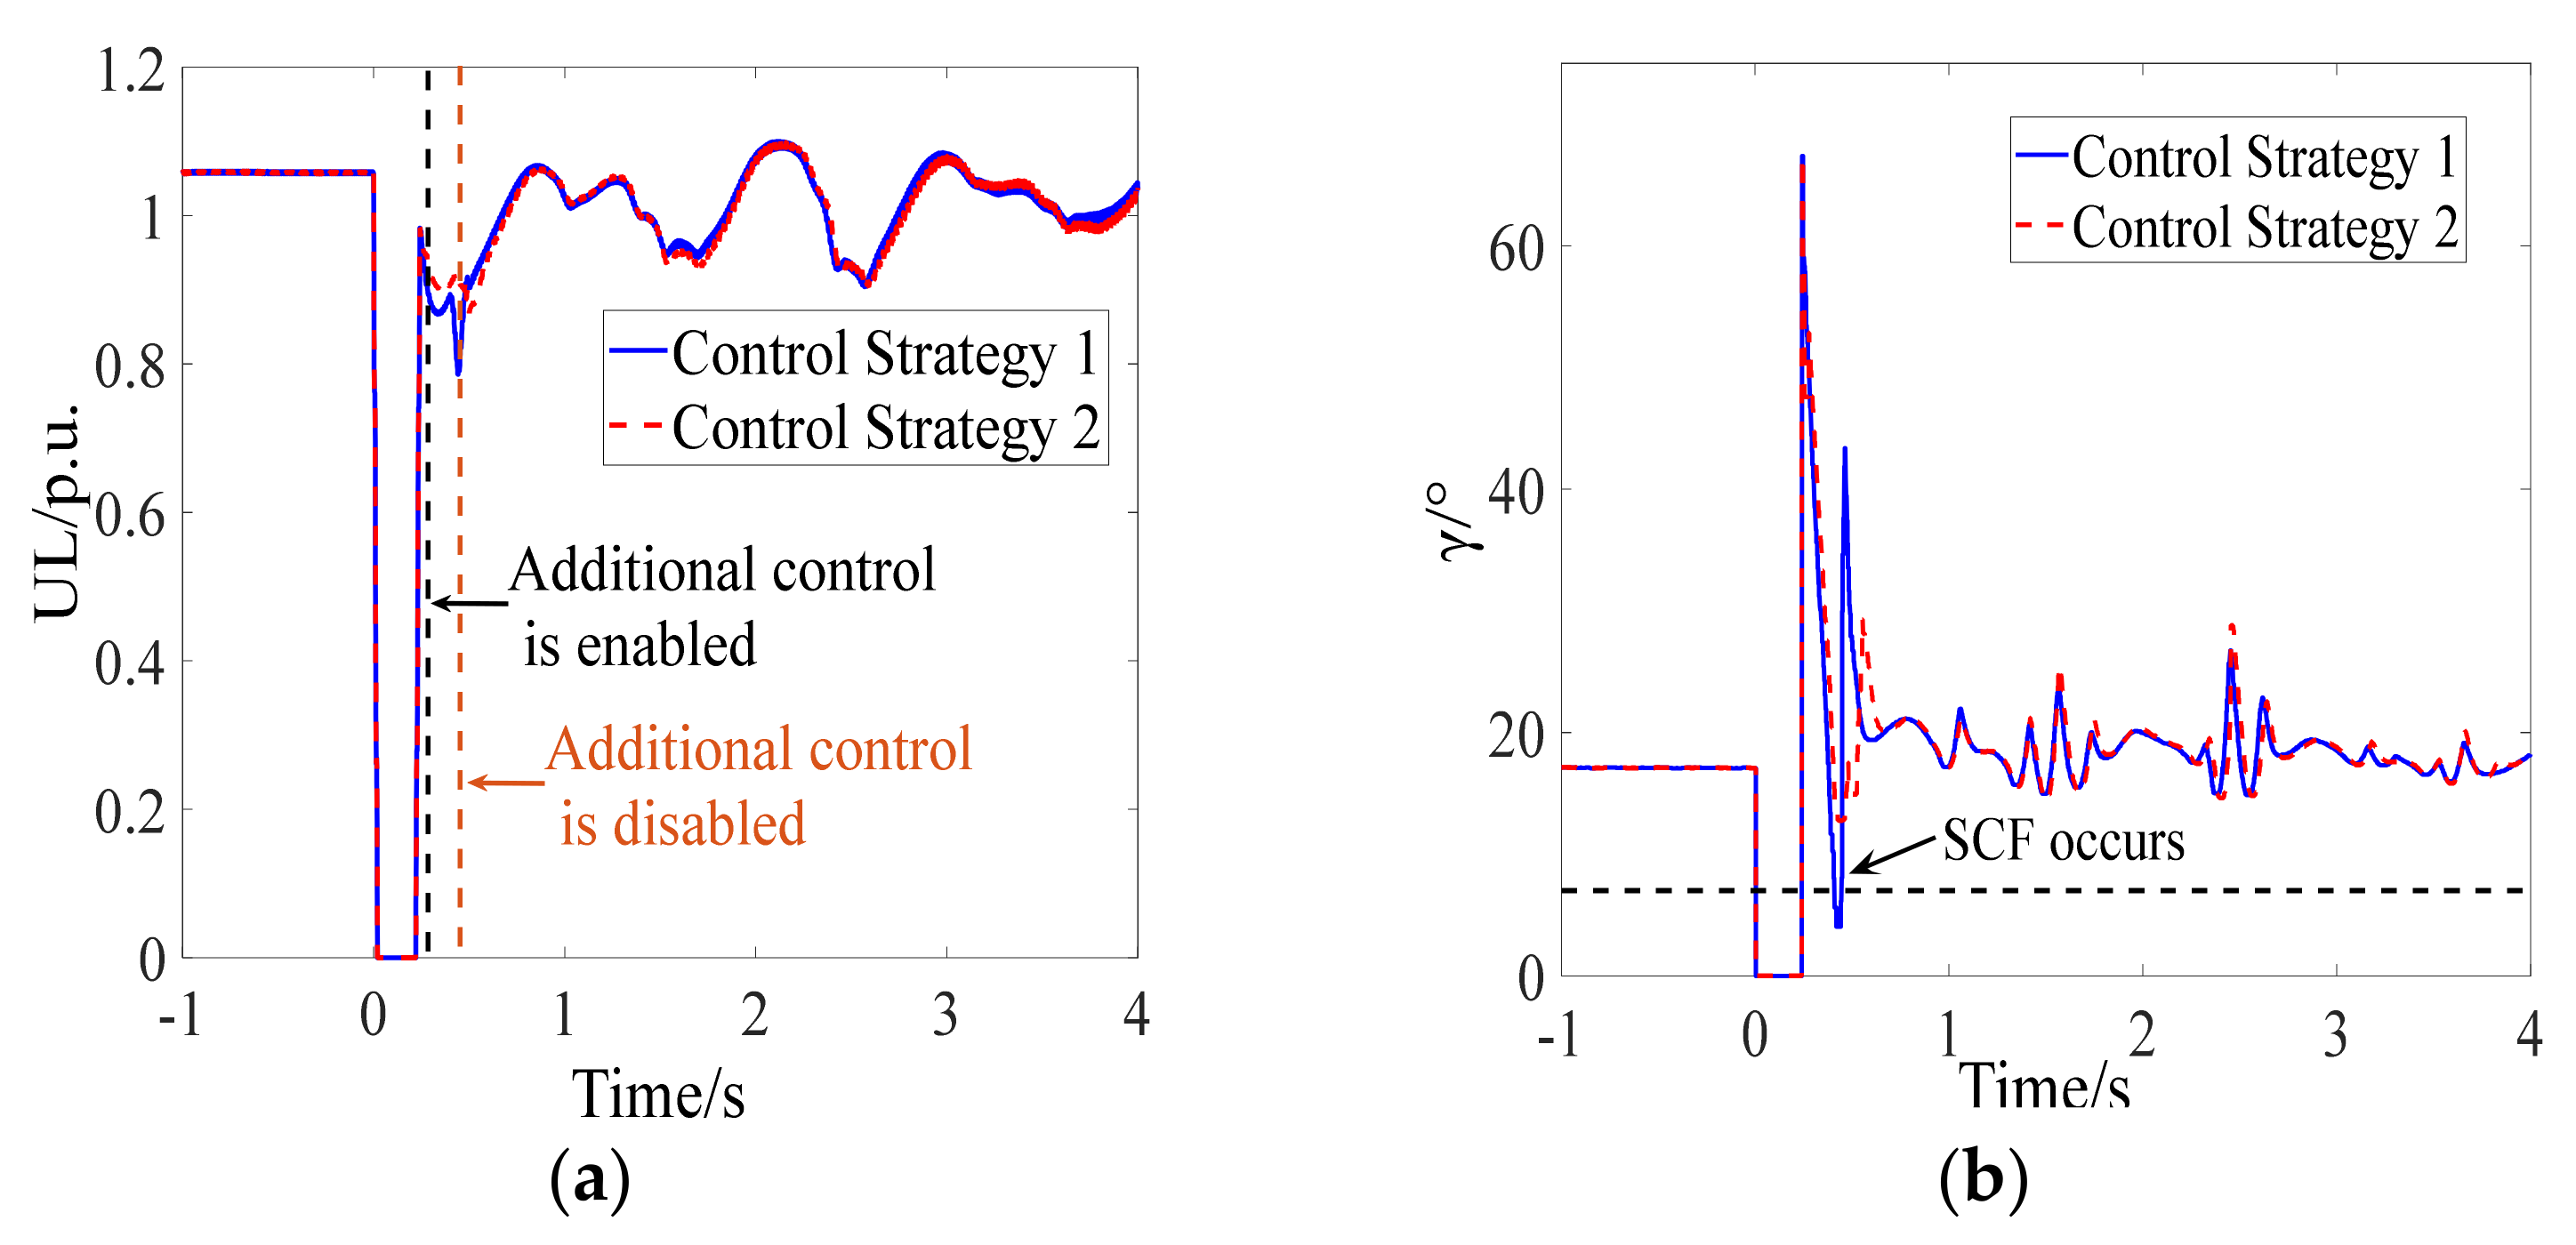
Although the electromechanical model is able to characterize the dynamics of synchronous generators, the electromagnetic model of the AC system was also employed to investigate the effectiveness and robustness of the proposed control strategy. The full electromagnetic model of the IEEE 39-bus test power system integrated with LCC-HVDC was built on ETSDAC. The simulation time step of ETSDAC was 50 us, and CS-1 and CS-2 were employed by the DC control system in the following scenarios. Due to the phase difference between the primary and secondary sides of the transformer, the steady-state rotor angles of the generators in the full electromagnetic model were different from those in the hybrid electromechanical–electromagnetic model.
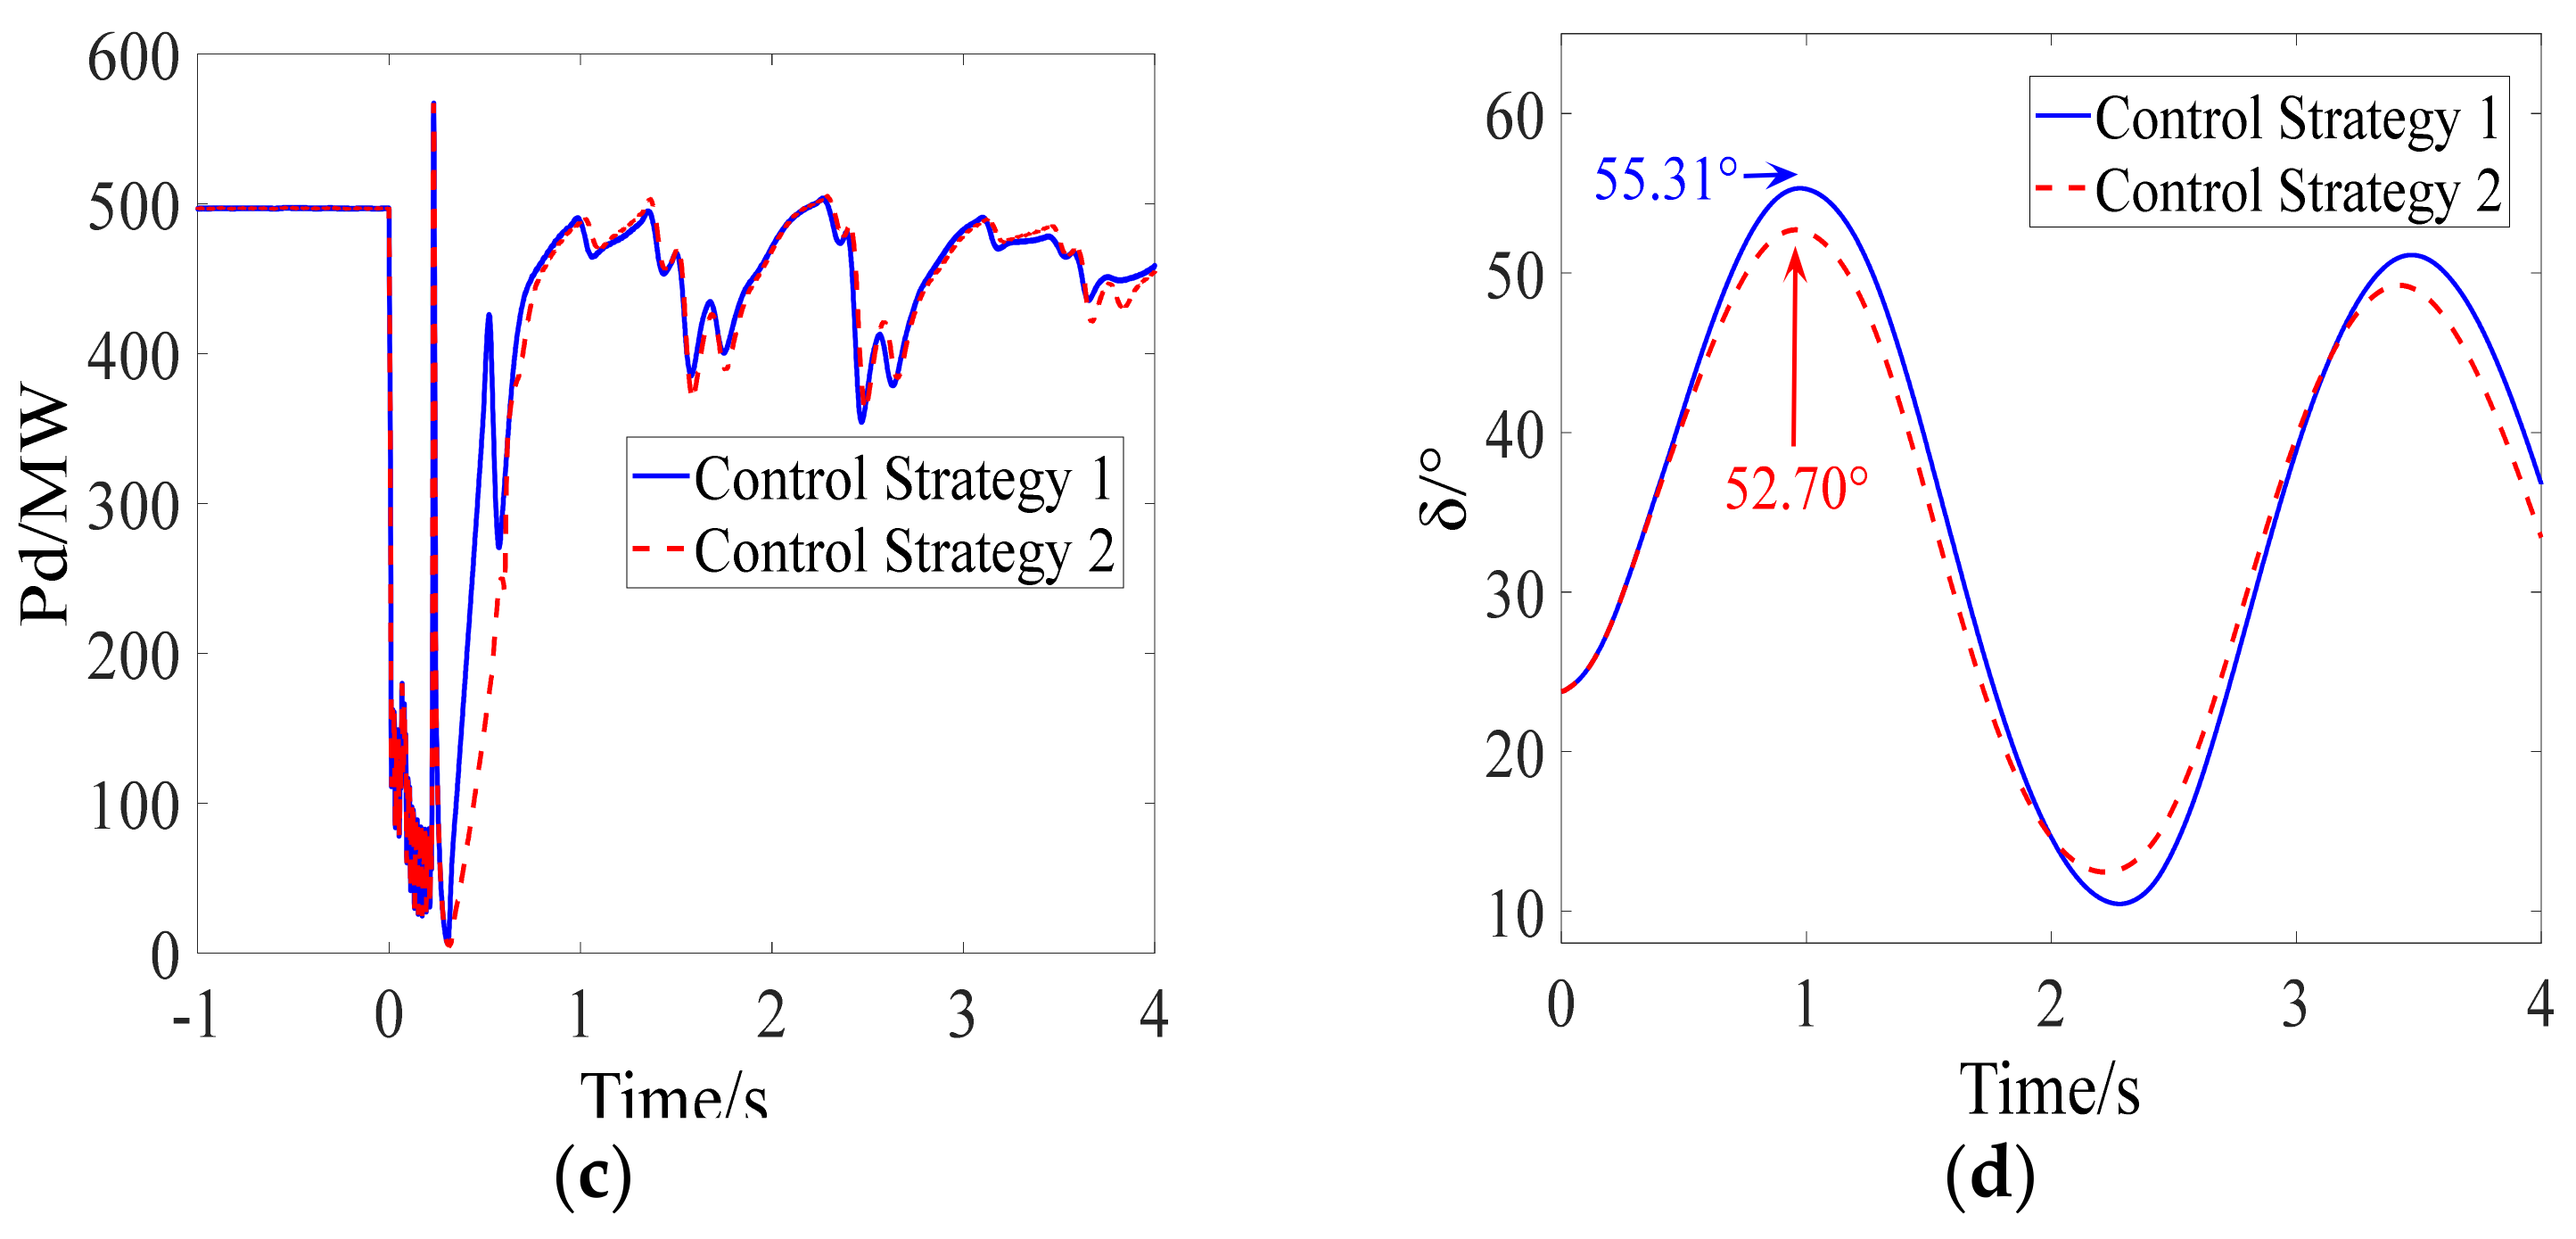
Scenario 1: A three-phase short circuit fault is set at Bus-17, which starts at t = 0 s and lasts for 0.17 s.
As shown in
Figure 15a,b, the occurrence of the AC fault causes the first CF of LCC-HVDC. After the clearance of the AC fault, it can be seen from the blue solid lines given in
Figure 15a,b that an SCF occurs during the recovery when the transient stability of the post-fault receiving-end power system seriously deteriorates, demonstrating the correctness of the mechanism analysis of SCFs as affected by transient stability. When CS-2 is adopted by the DC control system, the SCF is prevented from occurring during the recovery, indicating the effectiveness of the proposed control strategy. In addition, as shown by the red dotted line in
Figure 15c, the recovery characteristic of the DC power is improved due to the fact that the SCF had been prevented. Consequently, the maximum relative rotor angle of the post-fault sending-end power system when the DC control system adopted CS-2 is smaller than that of the post-fault sending-end power system when the DC control system adopted CS-1 as shown in
Figure 15d. The effectiveness of the proposed control strategy is confirmed by the simulation results.
Scenario 2: A two-phase short circuit grounding fault is set at Bus-17, which starts at t = 0 s and lasts for 0.22 s.
As shown in
Figure 16a,b, the occurrence of the AC fault causes the first CF of LCC-HVDC. After the clearance of the AC fault, the SCF is prevented when the DC control system adopts CS-2, indicating the effectiveness of the proposed recovery speed control strategy. As shown
Figure 16c, the DC power recovers steadily with the regulation of the proposed control strategy. Meanwhile, the transient stability margin of the sending-end power system is improved as shown in
Figure 16d.
At different buses in the test power system shown in
Figure 12, different types of AC faults were set near the inverter station, where the first CF caused by the AC fault was simulated. The fault duration was set to be long enough to cause an SCF in the DC system during the recovery after the clearance of the AC fault, and CS-1 and CS-2 were employed by the DC control system. The simulation results are shown in
Table 3.
Compared with the simulation results of the DC control system that adopted CS-1 in the different scenarios, the occurrence of the SCF was prevented, and the transient stability margin of the sending-end power system was improved when the DC control system adopted CS-2, validating the effectiveness and robustness of proposed control strategy.
Compared with the simulation results when the DC system adopted the electromagnetic model and the AC system adopted the electromechanical model or the electromagnetic model in the test power system, the proposed DC power recovery speed control strategy was able to prevent the occurrence of a Category 2 SCF. Moreover, the transient stability of the post-fault sending-end power system was improved due to the fact that the severe DC power fluctuation caused by the SCF had been avoided. Therefore, the effectiveness and robustness of the proposed control strategy are verified.
6. Conclusions
In this study, the mechanism of an SCF as affected by transient stability was analyzed, and a DC power recovery speed control strategy is presented as an additional form of control to prevent the occurrence of an SCF. In addition, the transient stability of the sending-end power system was improved due to the fact that the severe DC power fluctuation caused by the SCF was avoided. Therefore, the safe and stable operation of the post-fault LCC-HVDC and AC/DC hybrid power system is guaranteed.
The dynamic interaction characteristics between the AC system and the DC system were investigated by modeling the sending-end and receiving-end power systems as synchronous generators instead of ideal voltage sources. It was found that an SCF will occur during the recovery after the clearance of the AC fault on the condition that the transient stability of the receiving-end power system has seriously deteriorated, and the recovery speed of the DC system should be limited in order to prevent its occurrence.
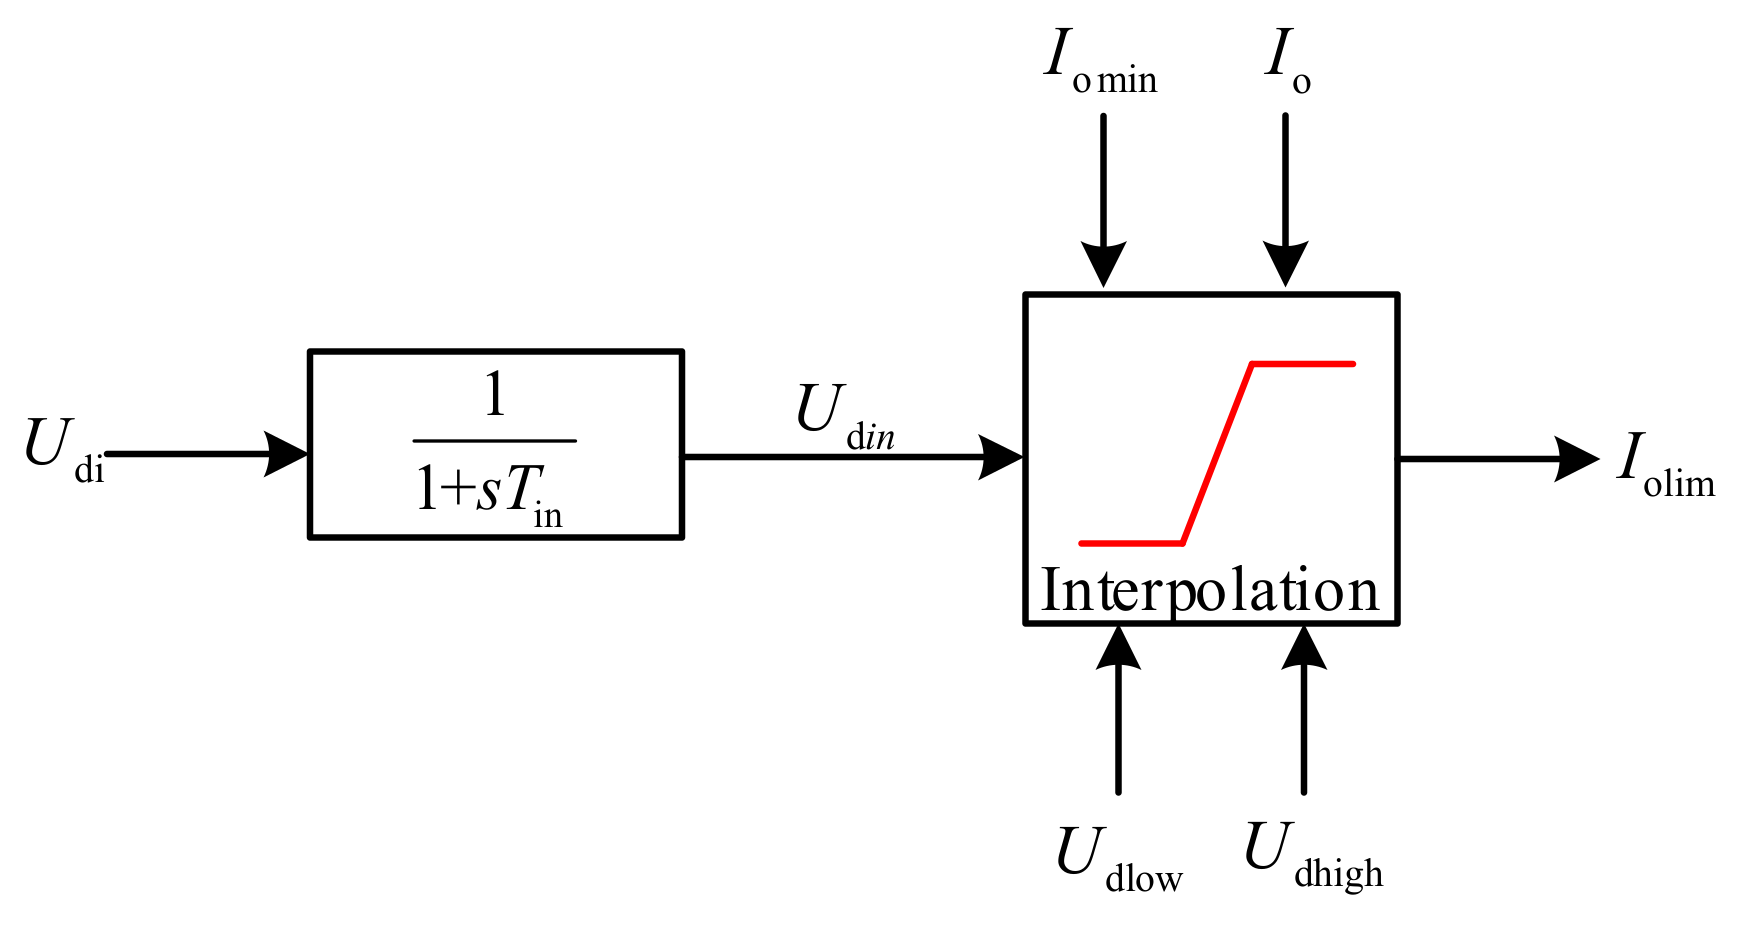
A risk assessment index for SCF was deduced based on a quasi-steady-state model of the DC system, a DC power recovery model was established based on the ramp function, and the impact of DC controller parameters on the DC power recovery speed was analyzed. Then, the DC power recovery speed control strategy was used to limit the recovery speed by modifying the output DC current order to prevent the occurrence of an SCF when there is a risk that one will occur during the recovery after the clearance of the AC fault.
In the proposed control strategy, the DC power recovery speed is limited by modifying the output DC current order Iolim to I′olim = ς2Iolim. Here, ς2 is a constant parameter, which could be further optimized to be an adaptive parameter in future work. Based on the premise that the occurrence of SCFs can be prevented, the value of parameter ς2 should be as large as possible, which represents a higher DC power recovery speed and will further increase the transient stability of the post-fault AC/DC hybrid power system.


