Article

Tobacco Spatial Data Intelligent Visual Analysis

1
China Computer Network Information Center, Chinese Academy of Sciences, Beijing 100190, China
2
Chinese Academy of Sciences, Beijing 100190, China
*
Author to whom correspondence should be addressed.
Electronics 2022, 11(7), 995; https://doi.org/10.3390/electronics11070995
Submission received: 25 February 2022 / Revised: 16 March 2022 / Accepted: 18 March 2022 / Published: 23 March 2022

Abstract

:
A multi-module visualization framework is designed and a visual analysis system called TobaccoGeoVis is implemented to analyze tobacco spatial data efficiently. The proposed system provides a visualization technology for overlaying multiple graphics on a map to enrich the form of tobacco spatial data visualization. The system also adopts artificial intelligence algorithms and multi-view linkage interactive methods and provides flexible data-attribute field mapping and graphical parameter configuration to analyze tobacco spatial data. We demonstrated that the system is user-friendly and the applied visualization methods are effective using cases selected from the three sets of data.

1. Introduction

China’s tobacco industry has accumulated massive structured and unstructured tobacco data in many scientific research fields, such as agriculture, chemistry, technology, flavors and fragrances, and quality testing in recent decades [1]. Effectively analyzing and utilizing the increasing tobacco scientific research data to assist enterprises and researchers in judging and making decisions is challenging. Statistics methods are usually used in the study of tobacco scientific research data. However, existing analysis methods are not conducive to data exploration and knowledge mining because of their single and non-intuitive expression, which is dependent on the personal experience of researchers. Data visualization is crucial in big data analysis. Abstract data are converted into easy-to-understand graphic images through the interactive visualization interface to help users understand and analyze [2]. Many fields, such as ecology, meteorology, and oceanography, have developed visual systems for data display and analysis [3,4,5]. Tobacco scientific research is closely related to geographical space. Visual analysis of spatially related scientific research data can help researchers intuitively understand rules of data spatial distribution and obtain in-depth information.
Tobacco researchers typically focus on geographical–spatial distribution characteristics of tobacco information categories [6]. According to tobacco experts, the analysis of tobacco spatial data presents the following needs:
  • Need 1: Tobacco single-field data visualization. Visualize the information about a single field of tobacco in a geographic space and analyze its overall distribution in space.
  • Need 2: Comparative visual analysis of tobacco multi-category information. Analyze the similarity of the distribution of tobacco multi-category information in the geographic space.
  • Need 3: Visual analysis of distribution characteristics and similarities of high-dimensional scientific research data of tobacco in the geographic space.
  • Need 4: Free mapping of data attribute field and flexible configuration of graphic parameters.
We introduce the TobaccoGeoVis system on the basis of these needs. The proposed system integrates visual analysis methods to analyze scientific research spatial data of tobacco, and solves problems of visualization, comparative analysis, and spatial similarity distribution of the data need.
The main contributions of this paper include:
  • Designing a set of visual analysis methods for tobacco spatial data, including reduced-dimensional clustering mapping visualization, combined with minimum spanning tree and contour, spatial distribution visualization that overlays multiple graphics on the map, and visual interaction.
  • Developing the visual analysis system—TobaccoGeoVis—for scientific research spatial data of tobacco to assist users in the rapid analysis of data.
  • Creating a set of interactive configuration methods that can flexibly configure the loading of data and selection of visual graphics.
The remainder of this paper is organized as follows. Studies on tobacco scientific research data visualization are presented in Section 2. The system design is described in Section 3. Characteristics of tobacco spatial data are analyzed and processed in Section 4. Visualization and interactive methods in the system are discussed in Section 5 and Section 6, respectively. The effectiveness of the proposed method is validated in Section 7 using three cases. Finally, the conclusions of this study are summarized in Section 8.

2. Literature Review

Many data analysis tools have been proposed and the analysis of tobacco data has become diversified with the considerable progress of computer science and technology. The tobacco data visualization can be roughly divided into three aspects: simulation, geographic information system (GIS)-based aspects, and information visualizations.

2.1. Simulation Visualization

Simulation visualization is the use of computer simulation technology to carry out 3D modeling and visual simulation expression of tobacco plants. Analysts use 3D simulation and visualization tools to model tobacco according to its appearance characteristics. Yang constructed a 3D model of tobacco root growing development on the basis of its law [7]. Wang provided a visual simulation method of plant inflorescence using morphological and structural characteristics of tobacco inflorescence. Wang carried out the 3D reconstruction and visualization of tobacco above-ground plants using a 3D digitizer to measure and extract characteristics of tobacco organs [8,9].

2.2. GIS-Based Visualization

GIS-based visualization applies GIS technology to visualize tobacco data. Business information of the tobacco industry and geographic spatial distribution are closely related. Analysis will be difficult without the support of geographic information systems. Hu designed and implemented a GIS-based visual tobacco management information system that can achieve tobacco information visualization, management networking, and graphics–attributes integration [10]. Wang and Fan built a tobacco visualization monopoly management platform based on GIS that can provide functions, such as visual information management of retail households and monopoly vehicles [11,12]. Zhang and Fang designed a GIS-based visual customer relationship management system in the tobacco industry to realize information spatialization surrounding service providers, customers, and services [13,14]. Shen used 3D GIS modeling software to investigate the 3D visualization technology of characteristic high-quality tobacco leaf data in the Jinsha River area of Lijiang, China [15]. Guo utilized GIS to visualize the cigarette sales distribution in Guizhou [16].

2.3. Information Visualization

Information visualization technology has been continuously applied in all aspects of life in the era of big data and also plays an increasingly important role in the tobacco industry. Zhuo used heat map as an example to analyze the information visualization application in tobacco monopolization management and attention matters in the application of visualization charts [17]. Deng designed a market data visualization analysis system based on heat maps to analyze temporal and spatial laws of cigarette marketing data, show the geographic distribution and organizational structure of consumer groups, and discover cigarette market development patterns and laws [18]. Deng also established a visual analysis method based on spatiotemporal grids to analyze the tobacco market development [6]. Meng visualized the equipment health status self-examination results of a blade feeder in a cigarette factory to provide a new display form for workshop data [19]. Yang utilized a high-speed camera system to visualize tobacco movement in the riser and explored tobacco flow characteristics through the tobacco movement image and velocity vector field [20]. Ouyang visualized temporality and multidimensionality of the tobacco near-infrared index data [21]. This tobacco control assessment tool used time series line charts and two-dimensional maps to examine current and past trends in tobacco use across Mexico, as well as to understand where progress has been made and gaps still exist [22]. Guindon used graphical methods to assess the trends in smoking tobacco taxes and prices in India at the national and state levels [23]. Gueorguieva applied intersection bar plots and optimized heat maps to design a visual tool and identify use patterns of various tobacco products in the population [24]. Tian developed a visual analysis system for tobacco leaf quality data to incorporate dimension reduction and correlation analysis methods [25].
Existing studies typically focus on specific data scenarios and user groups but fail to provide a general data exploration method and tool for researchers in different fields of the tobacco industry. Therefore, data visualization and data mining are combined and a visual analysis system called TobaccoGeoVis for tobacco spatial data is designed in this study. The proposed method uses multiple ways to show geographical distribution characteristics and similarities of data as well as provides strong technical support for data mining and analysis.

3. System Design

3.1. System Analysis

TobaccoGeoVis provides two main functions. The first function is geographic data visualization. Scenes, such as tobacco leaf production and allocation and cigarette product delivery, will generate mass geographically related data. The effective visual presentation of these data can help decision makers and staff members understand the data overview and overall trend. The second function is interactive data analysis. Professional data mining often needs background knowledge of computational science to prevent the deep analysis of complex data. Providing additional data exploration methods can help scientific researchers conduct multidimensional data interactive analysis and gain insights into underlying value of data.

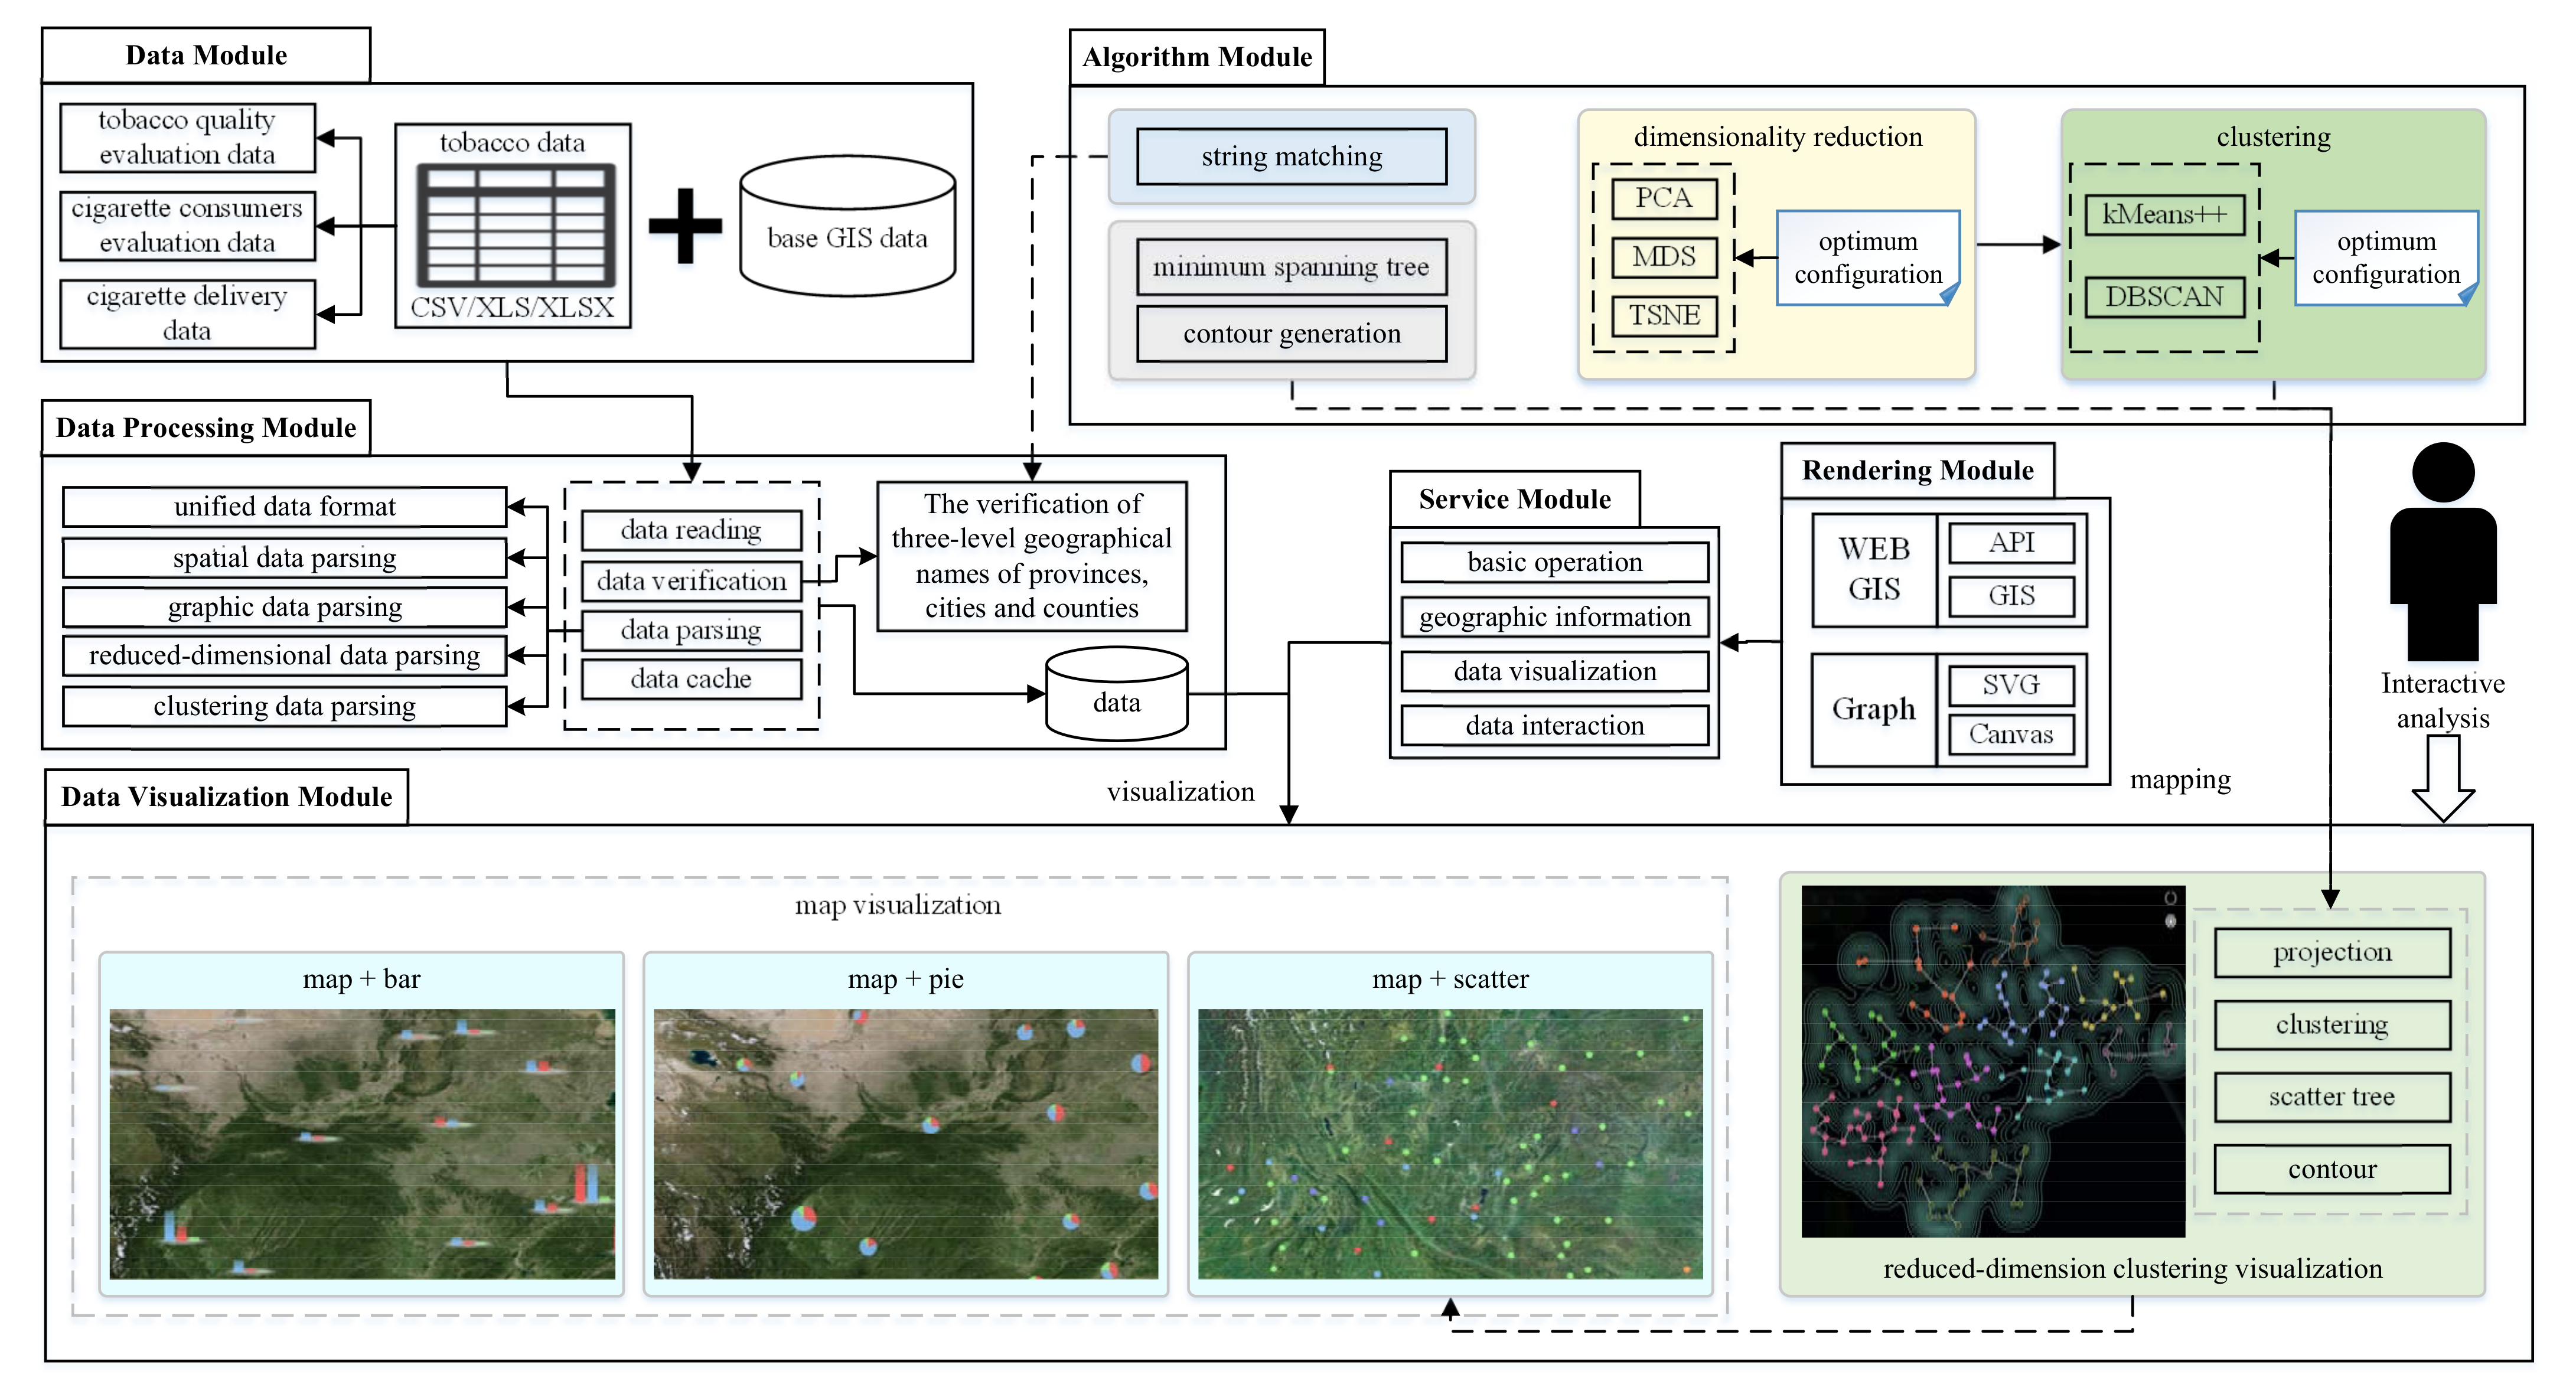
3.2. Visualization Pipeline

TobaccoGeoVis is based on Brower/Sever (B/S) architecture, using JavaScript language development. The browser-side uses a Web-GIS engine and visualization chart library Echarts.js and D3.js to visualize data. The server-side uses node.js and Nginx to build the service and the server, respectively. Figure 1 shows the visualization pipeline, including data, data processing, algorithm, rendering, service, and visualization modules.
The data module provides the storage and management of basic geographic information and tobacco scientific research data.
The data processing module provides a method interface for data processing and standard data support for data visualization. The main functions include the following:
  • Data reading: The data processing module provides remote and local data source reading functions and supports common file formats, such as CSV, XLS, and XLSX.
  • Data verification: The data processing module judges whether geographical location names and formats in data meet system requirements and provides a correction plan.
  • Data parsing: The data processing module parses names of provinces, cities, and counties in the original data into latitude and longitude coordinates in the map and converts original data into the format required by different visualization graphics.
  • Data cache: The data processing module caches parsed data to improve the visualization rendering speed.
The algorithm module provides the underlying support for the system. String matching algorithm can verify geographical location names of provinces, cities, and counties. Algorithms, such as dimensionality reduction, clustering, minimum spanning tree, and contour generation, assist dimensionality reduction projection of high-dimensional data, data cluster feature discovery, optimal connection method generation in visual graphics, and contour scatter plot generation.
The rendering module provides basic rendering support for data visualization services. WebGIS implements GIS-related operating functions and application programming interface (API), and graphs are responsible for visualization graphic construction.
The service module provides service support for the visualization module through the basic operation service, geographic information service, data visualization, and data interaction analysis service. Among them, the basic operation service realizes the map layer and visual graphic management. The geographic information service determines the geographical location name and data point mapping binding in the reduced dimensional clustering view on the map. Data visualization provides visual configuration options, such as graphic and color schemes, and achieves the mixed visualization of various basic charts and maps. The data interaction analysis service mainly provides data mining operations, such as dimension reduction and clustering, and performs dynamic interaction analysis between clustering results and maps through ranking view, lasso tool, and contour tool.
The visualization module provides system access, data visualization, and interactive functions. Users can interactively explore data through auxiliary tools as well as analyze data through map and reduced-dimension clustering visualization views.

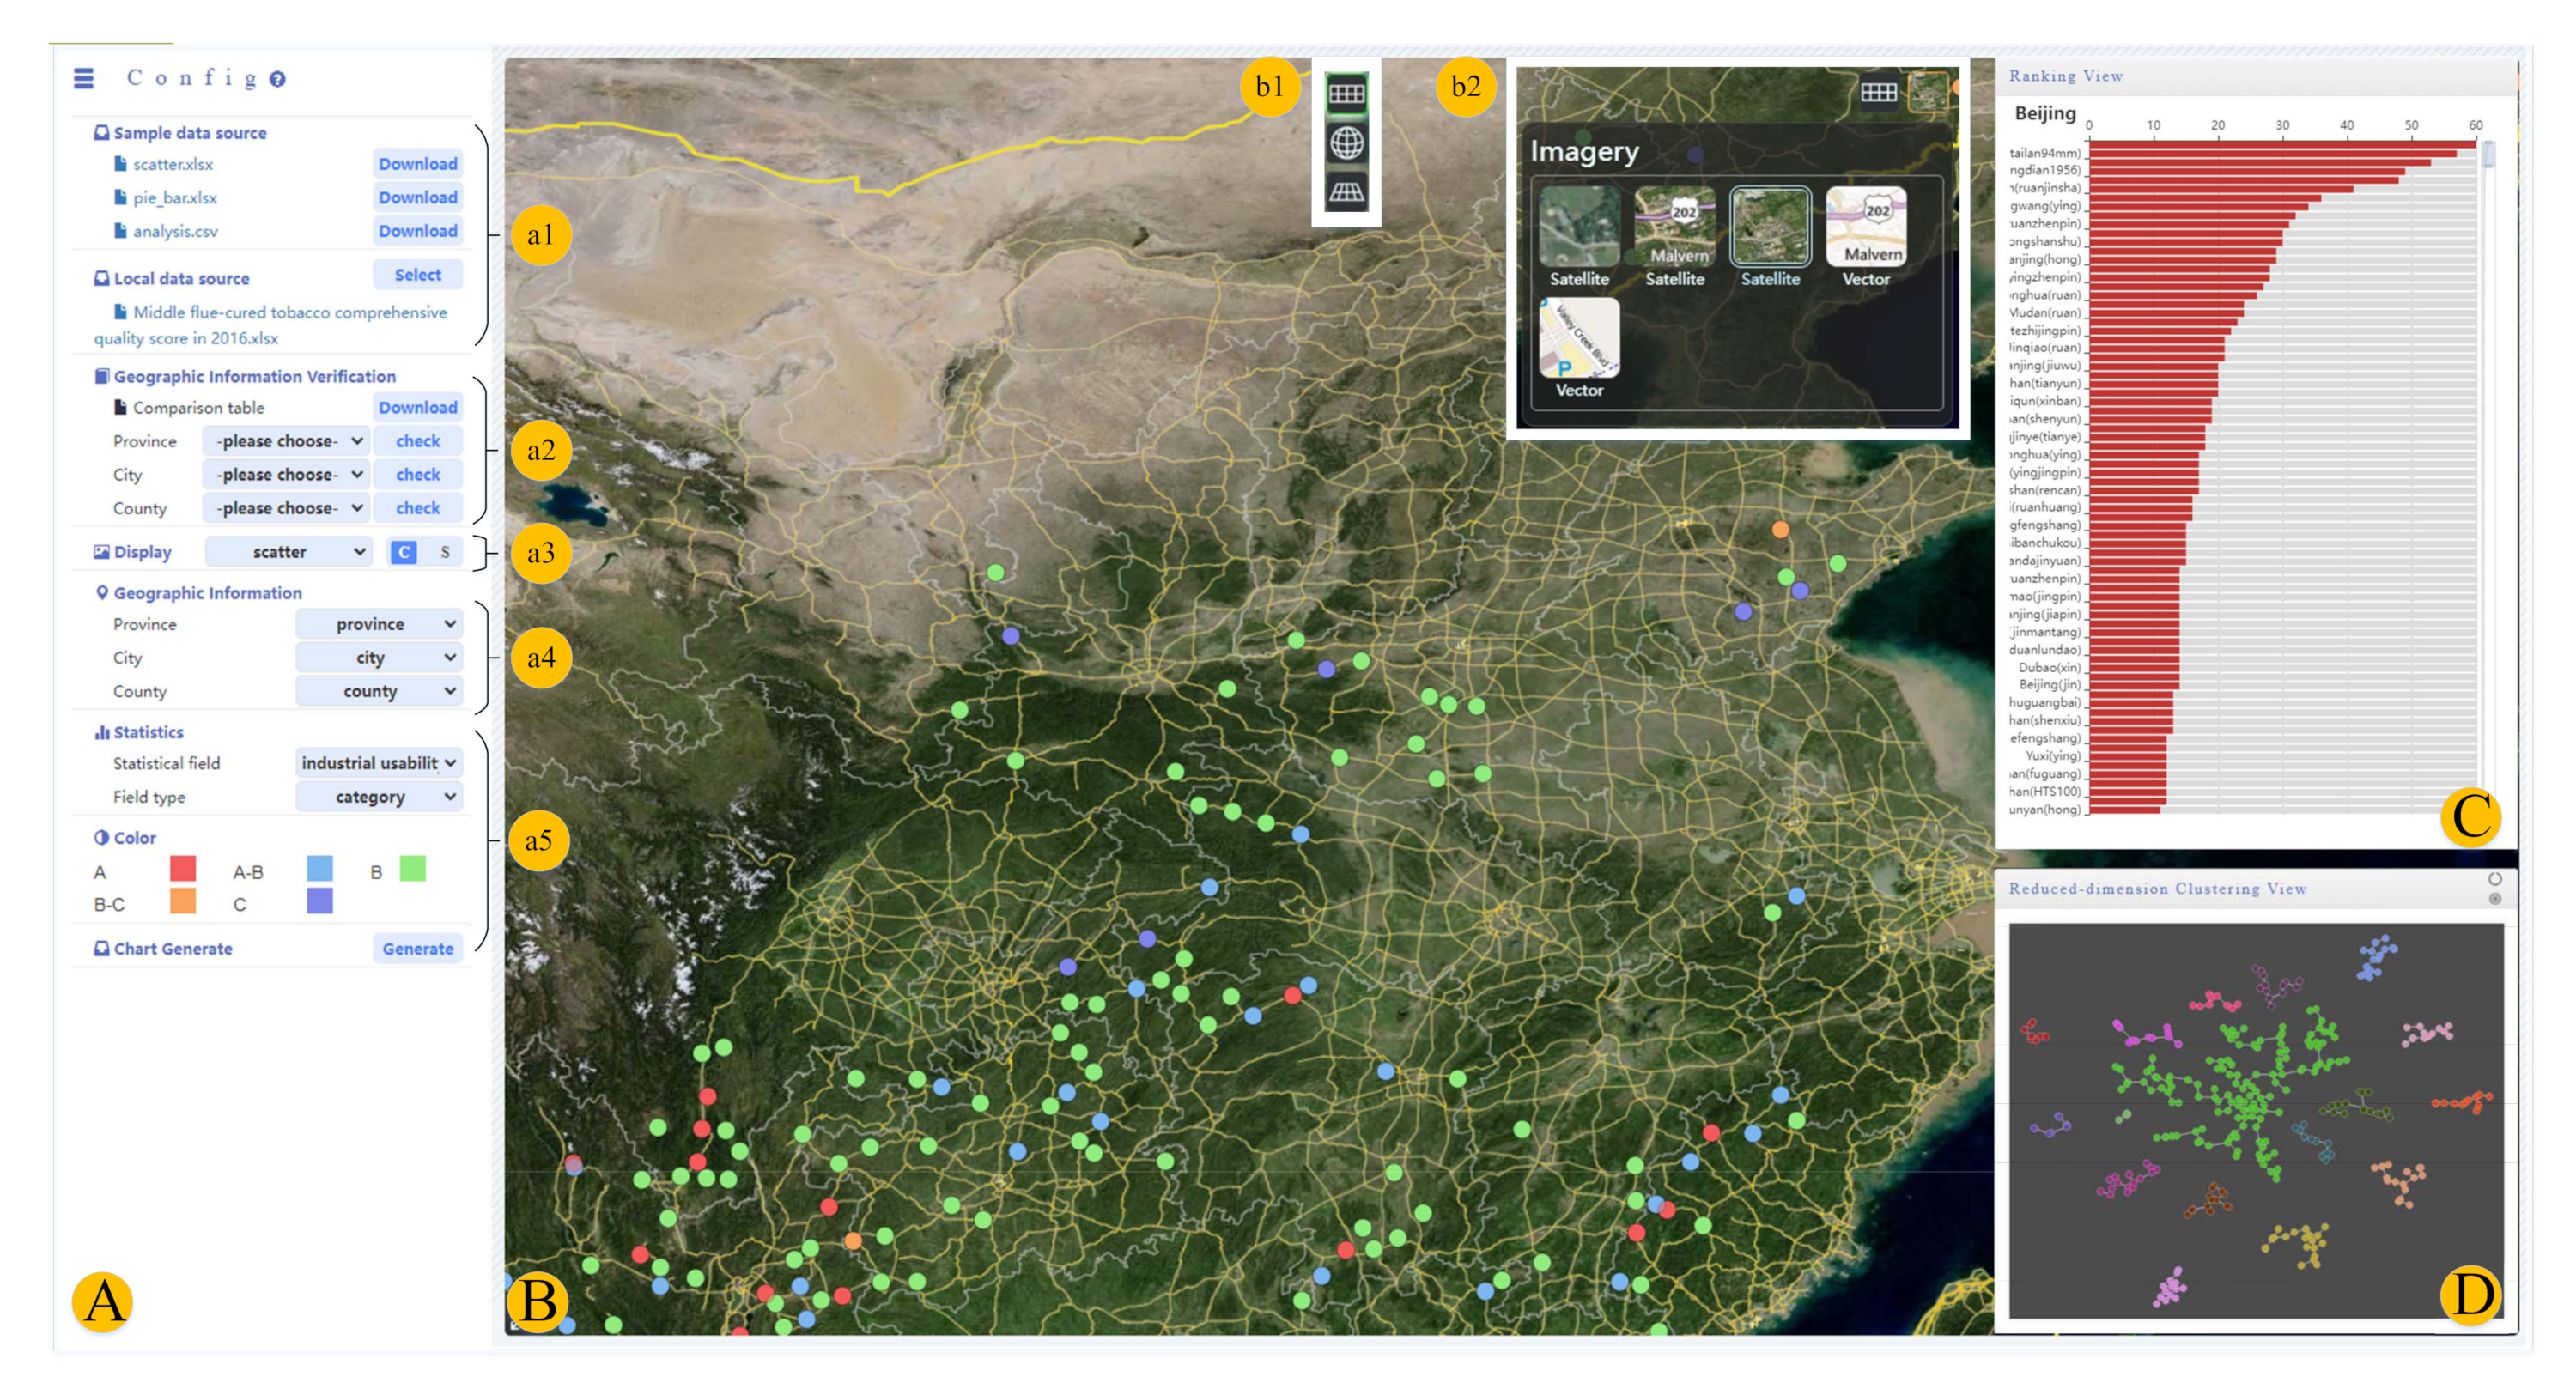
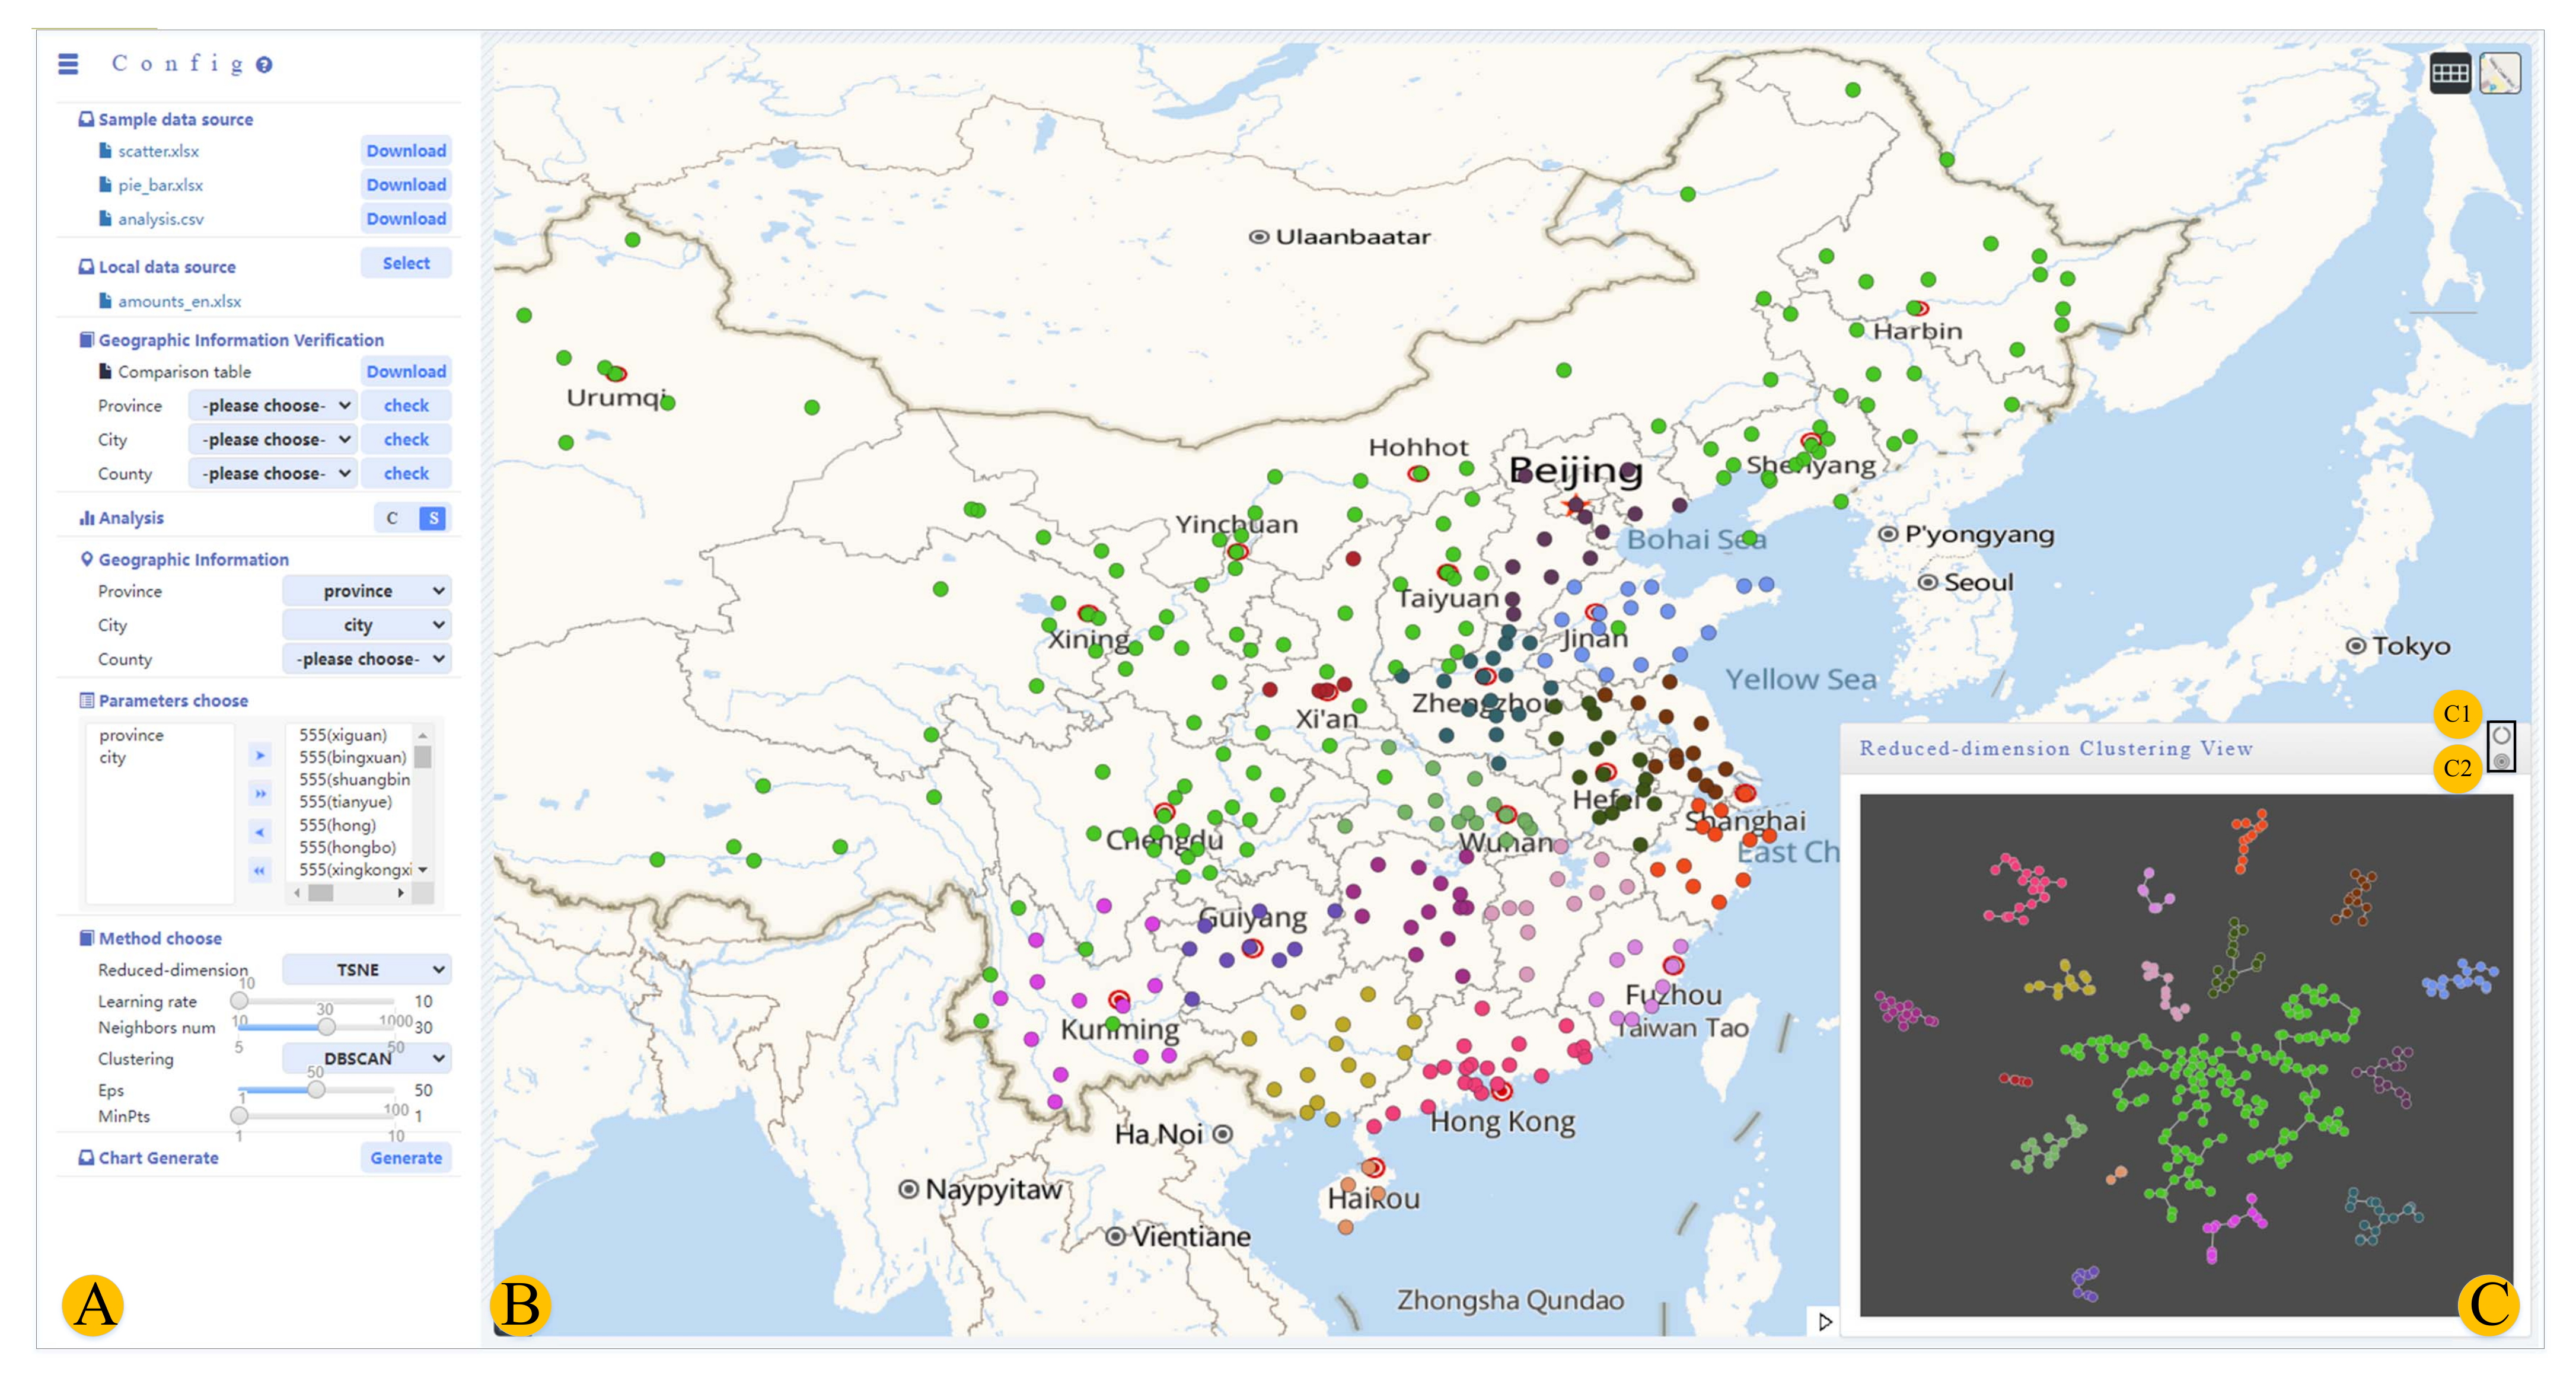
3.3. System Overview

We design and implement an interactive visual analysis system called TobaccoGeoVis according to the needs of tobacco spatial data visualization (Figure 2).

4. Data Feature Analysis and Processing

4.1. Data Feature

The main feature of scientific research spatial data on tobacco is the geographical space distribution. Appearance quality of flue-cured tobacco, such as color, maturity, leaf structure, and oil content, demonstrates regional distribution in the field of tobacco plantation [26]. Tobacco consumers demonstrate different regional tendencies in cigarette consumption [27], and their taste varies substantially in different regions [28]. Tobacco quality evaluation, cigarette consumption quality evaluation, and cigarette delivery data exhibit high-dimensional characteristics and spatial distribution.
We divide the data into two parts, namely spatial and high-dimensional data, to facilitate data analysis. Spatial data refer to data related to geographical location, including geographical names of provinces, cities, and counties; latitude and longitude coordinates; and regional boundaries. High-dimensional data refer to multidimensional tobacco data. High-dimensional attributes of different data sources, such as tobacco quality, including individual score and component content, are varied. Cigarette consumption data include consumer attention and cigarette specifications. Overview attributes of the two types of data are listed in Table 1.

4.2. Data Processing in Administrative Region

Spatial data of tobacco scientific research are related to geographic space because they involve latitude and longitude coordinates and different spatial scales. Matching the name of administrative divisions with latitude and longitude coordinates is necessary to realize data visualization and express the data spatial distribution intuitively. Locations of the provincial capital, city center, and county center represent the latitude and longitude of the region. A three-level scale of provinces, cities, and counties, corresponding to latitude and longitude coordinates of each datum, is extracted in this study. However, spatial scales of different data sources vary considerably and corresponding names of provinces, cities, and counties present their own characteristics. For example, the inconsistency between “Beijing” and “Beijing City” leads to the inability to match geographical coordinates accurately. Therefore, we propose a string matching method to facilitate the matching of political names.
We match names of provinces, cities, and counties according to their characteristics. For example, “Beijing City” is obtained by adding “City” at the end of “Beijing”. Names of forest diseases and insect pests also demonstrate similar characteristics. Yang proposed an algorithm for names of forest diseases and insect pests that addresses these problems [29]. We suggest a string matching algorithm of province, city, and county names according to this method. Jaro distance represents the minimum number of single-character transformations required to achieve conversion between the two strings. The Jaro–Winkler distance is used to measure the edit distance between two strings. A small value corresponds to high similarity in the string. The edit distance (Levenshtein distance) is the minimum number of times required to edit a single character (such as modification, insertion, and deletion) when modified from one string to another. Adding the minimum edit time, in h, of the Levenshtein distance into the Jaro distance improves the accuracy in measuring the modification, insertion, and deletion of a single character. The Jaro distance is modified as follows:
S i m j = 0 , m = 0 1 3 m S 1 + m S 2 + m min n u m / 2 + h 2 , m m , m > 0
where S 1 represents the length of string S 1 , m represents the number of matched characters, n u m is the number of characters to be converted, and n u m / 2 is the number of character transpositions.
l s , the common prefix matching length of two strings, is added to the Jaro-Winkler distance and calculated as follows:
S i m j w = S i m j + l s max S 1 , S 2 1 S i m j
This method is used to calculate the similarity of the name string of provinces, cities, and counties. High similarity is in the string denotes high ranking. This method can assist users in the calibration of geographical names.

5. Visual Design

The purpose of visualization is to obtain the maximum insight with the minimum time and visual cost to improve the analysis efficiency. The use of maps alone in the visualization of tobacco spatial data can convey limited information. The multi-view linkage between the map and visualization graphics can enhance the effect of data analysis. The system provides spatial data visualization and interactive visual analysis to illustrate rules of spatial distribution concisely and intuitively, as well as obtain in-depth information. The system designs single-field data, multi-category information contrast, and high-dimensional data space mapping visualizations.

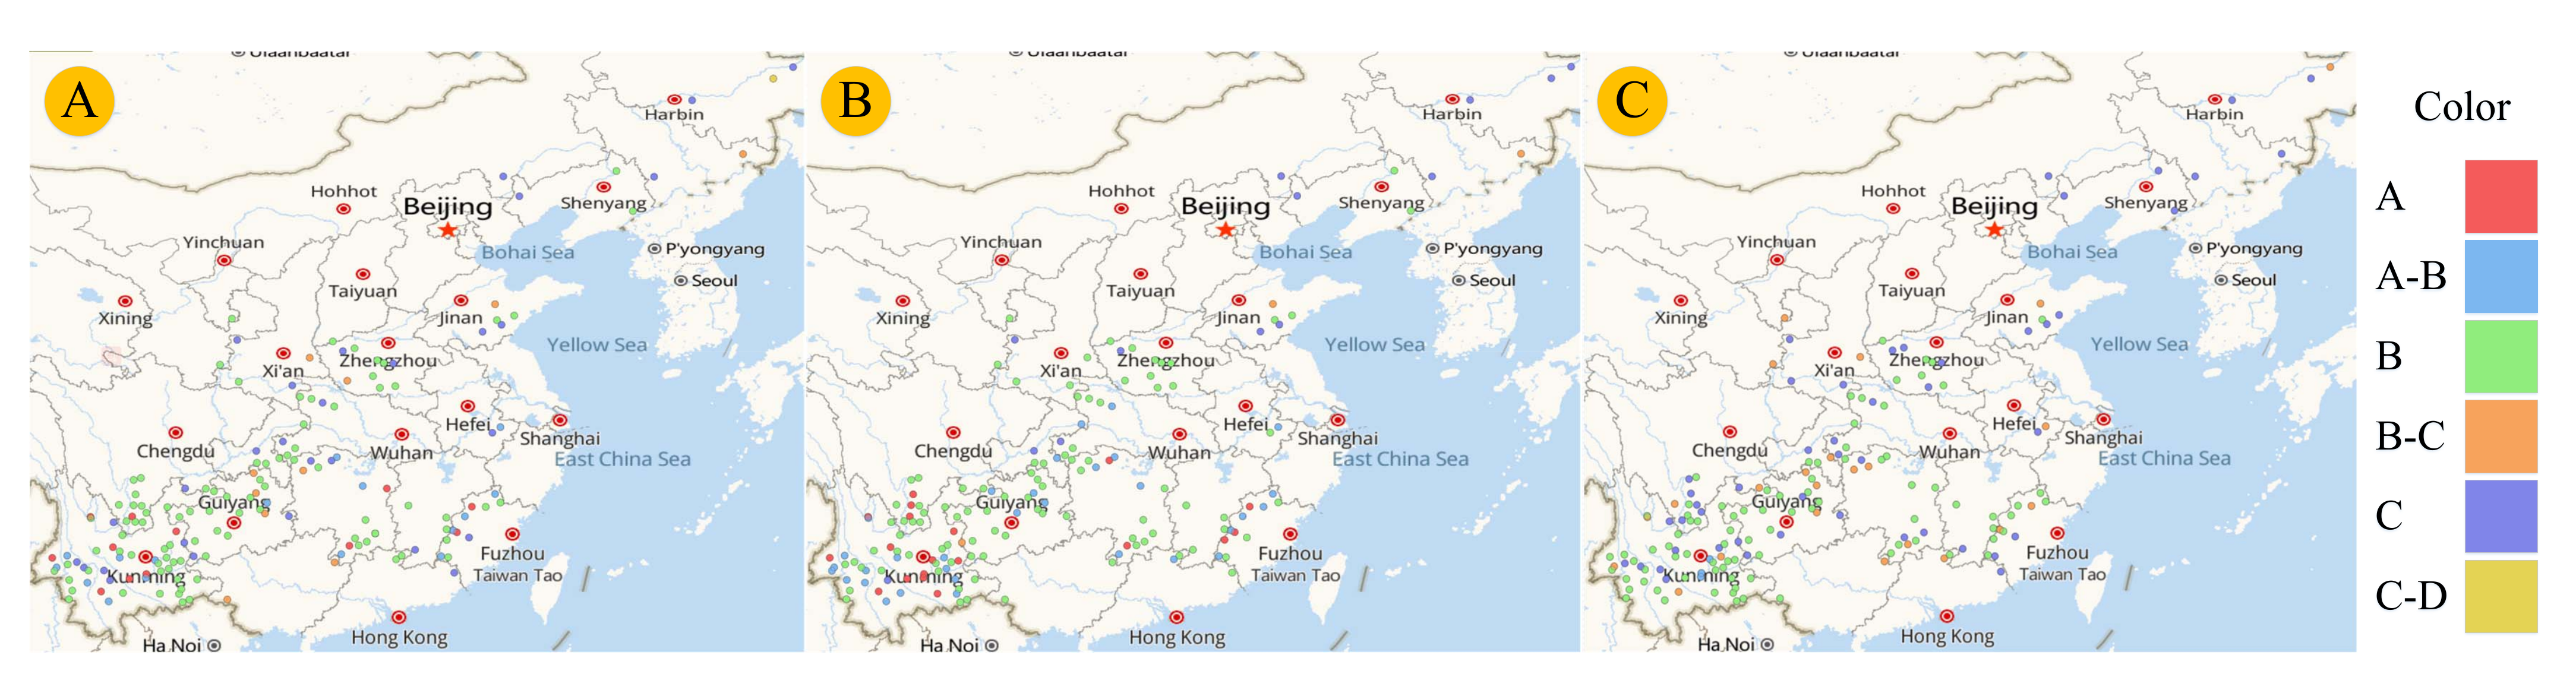
5.1. Single-Field Data Visualization

Single-field data, including numeric and category data, refer to the display of only one data index on the map. As shown in Table 2, “Evaluation Score” is numeric datum and “industrial usability” is category datum. We place scattered points on the map for visualization. As shown in Figure 2B, the location of scattered points represents the mapping of raw data on the basis of their geographic attributes. The color coding of numerical data denotes the numeric value. The color coding of categorical data denotes the category. Clicking points on the map can view detailed attribute values corresponding to the location and numerical rankings related to all geographical locations by ranking view (Figure 2C). Single-field data visualization can illustrate the spatial distribution of a single field.

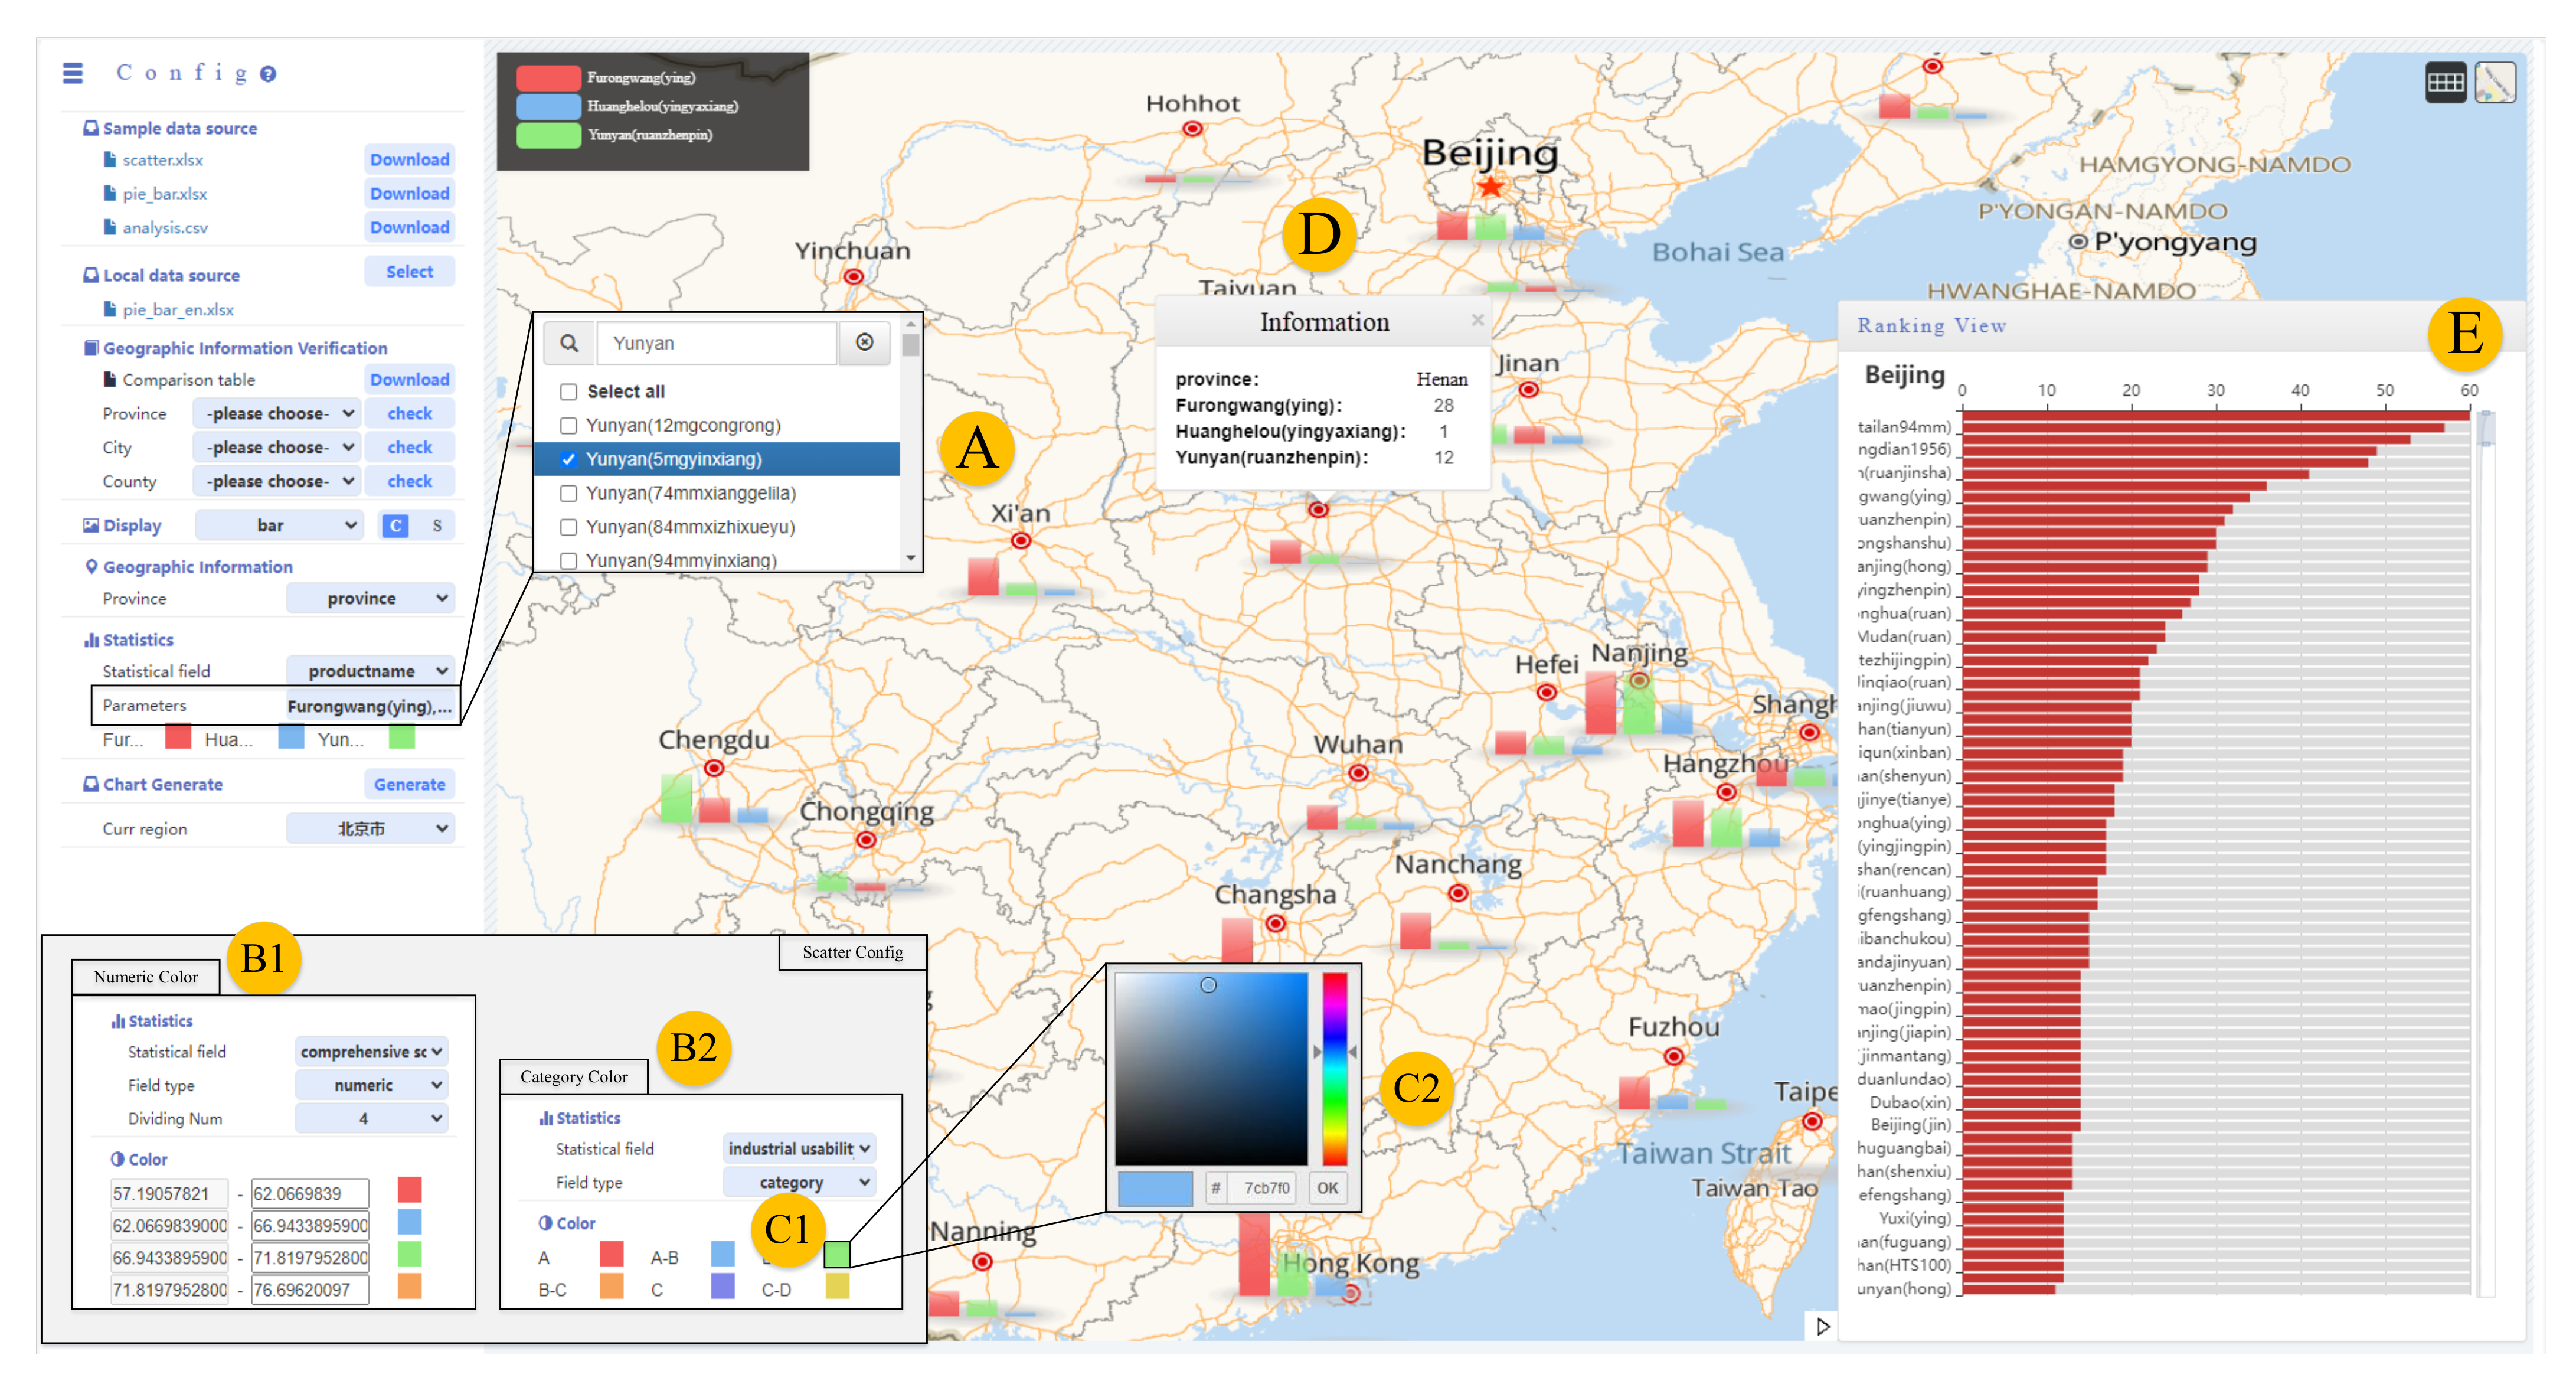
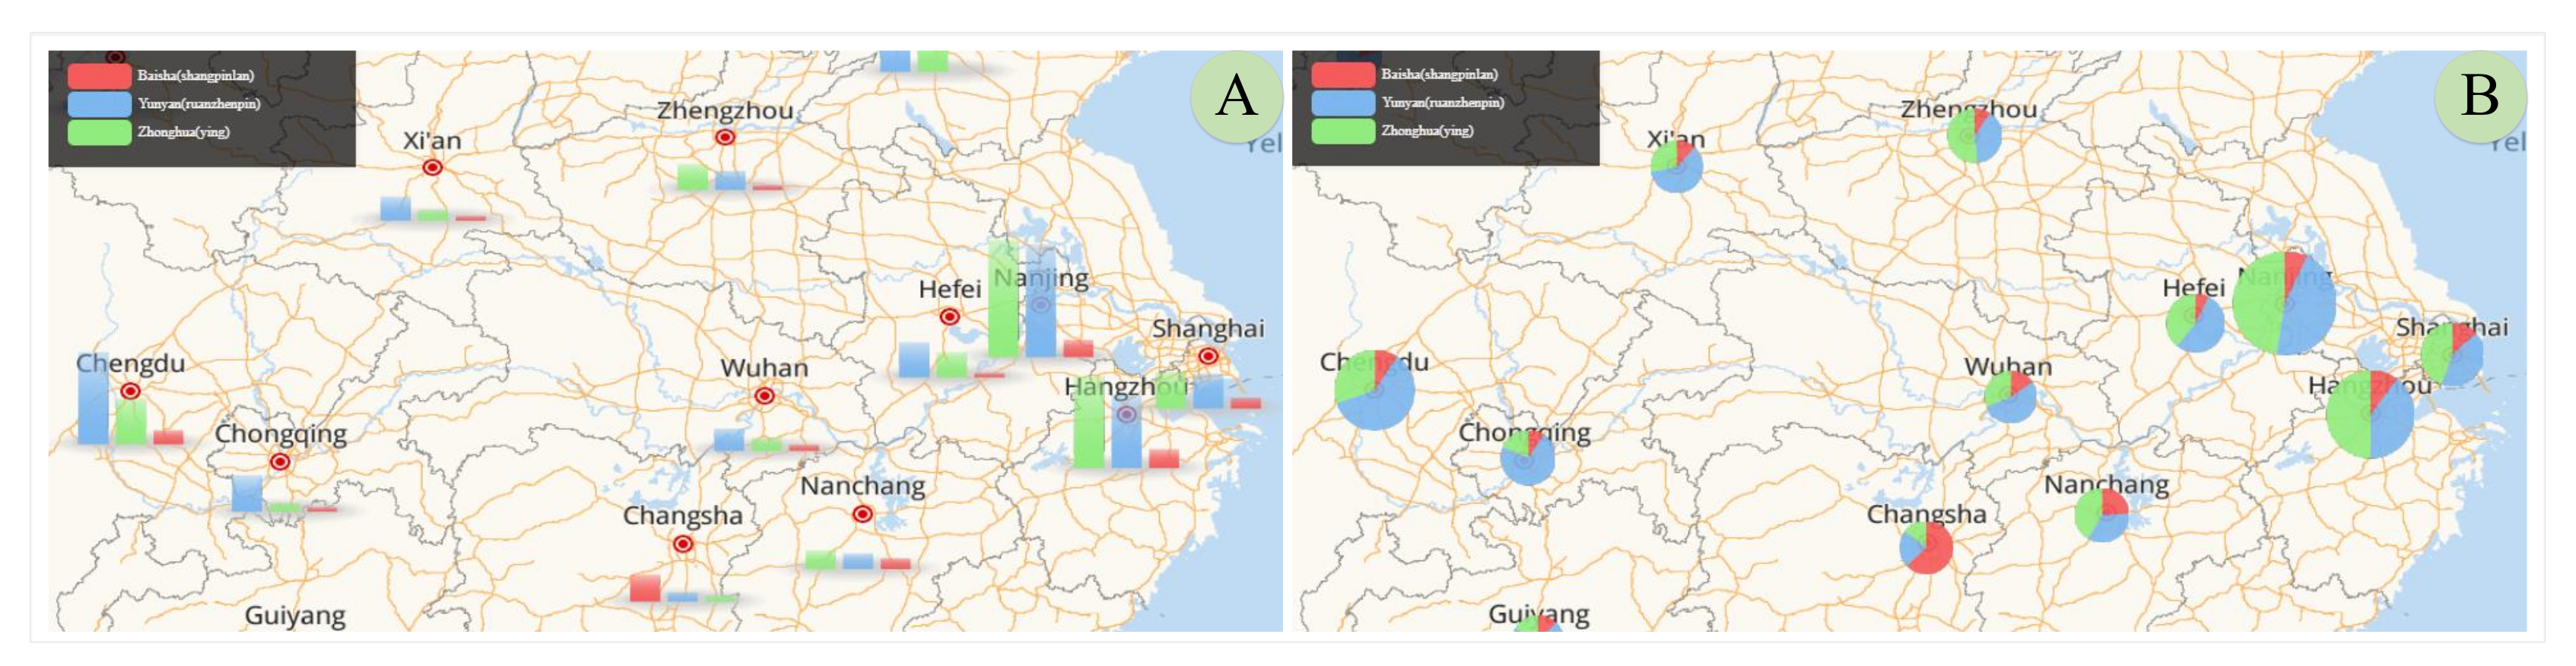
5.2. Multi-Category Information Contrast Visualization

Multi-category data refer to a data field that belongs to categorical data. The number of each category in the field, such as “Product” in Table 3, varies in different regions. The pie chart can express the percentage information of data and the bar chart can compare the difference of two or more numerical values in information visualization. Multi-category data are characterized by regional differences in various geographical locations. We designed a visualization method of overlaying pie and bar chart on the map to compare regional differences of multi-category data (Figure 3).
The position of the bar on the map represents latitude and longitude coordinates of the administrative division in Figure 3A. Color coding denotes different types of data, and the height represents the numerical value. Each sorted bar chart can analyze the relative size of different categories. The bar sets the transparency of 0.75 to enhance the integration with the map. A gray elliptical tray is superimposed below the bar chart to enhance the stereo sense.
Color coding denotes different categories of data in the pie chart (Figure 3B). The sector area of the pie represents the size of different categories of values. The size of the pie represents the sum of all categories of data in a certain area.
The mouse hover on the pie and bar to display detailed information. All information categories cannot be displayed due to the limited space on the map (Figure 3 shows only three cigarette categories). The pop-up window ranking view (Figure 2C) shows the overall ranking of all categories related to the geographical location when the pie and bar are clicked using the mouse. This visualization method can intuitively express the overall spatial distribution and local features of various regions or different multi-category data in the same region.

5.3. High-Dimensional Data Space Mapping Visualization

5.3.1. Data Dimension Reduction Analysis

Tobacco scientific research data contains multidimensional features and some collinearity among features. Direct visual analysis of multidimensional data will increase not only the complexity of the model and affect the accuracy of the model but will also likely lead to chaotic visualization results. These issues increase the difficulty for users in obtaining effective information. Therefore, reducing the data dimension before mining analysis is necessary. Principal component analysis (PCA) is a dimension reduction method that maps high-dimensional data to low-dimensional space through linear projection and reduces the data dimension while retaining characteristics of additional original data points [30]. Multidimensional scaling (MDS) can map high-dimensional data on the two-dimensional plane and maintain the equal distance between original and low-dimensional space samples [31]. The t-stochastic neighbor embedding (TSNE) [32] is an algorithm derived from stochastic neighbor embedding (SNE) [33] that regards coordinates in the low-dimensional space as the T distribution to ensure high cohesion of points in the cluster and low coupling of points between clusters. The data dimension reduction module integrates these three methods to adapt to various data and application scenarios. The reduction in multidimensional feature data of tobacco to the two-dimensional space improves the convenience of interactive exploration for users.

5.3.2. Data Clustering Analysis

Clustering can reduce the number of visual representations, improve data expression in the two-dimensional space, and enhance visual analysis efficiency in visualization. Further data clustering is necessary because showing the similarity of tobacco data after dimension reduction in a simple manner is still impossible in the space. Data obtained through exploratory analysis can be projected on the map to reflect spatial distribution regularity to a certain extent when regarded as the input of spatial visualization. K-means is a distance-based iterative clustering algorithm composed of objects close to the distance, and its ultimate goal is to obtain compact and independent clusters [34]. K-means++ is proposed to solve the defect of random initialization of clustering center in k-means by making the distance between initial cluster centers as far as possible to enhance the cluster separation [35]. Density-based spatial clustering of applications with noise (DBSCAN) defines the cluster as the maximum set of density-connected points, divides the region with sufficient high-density areas into clusters, and finds clusters of arbitrary shapes in a spatial database with noise [36]. Data clustering module integrates k-means++ and DBSCAN.

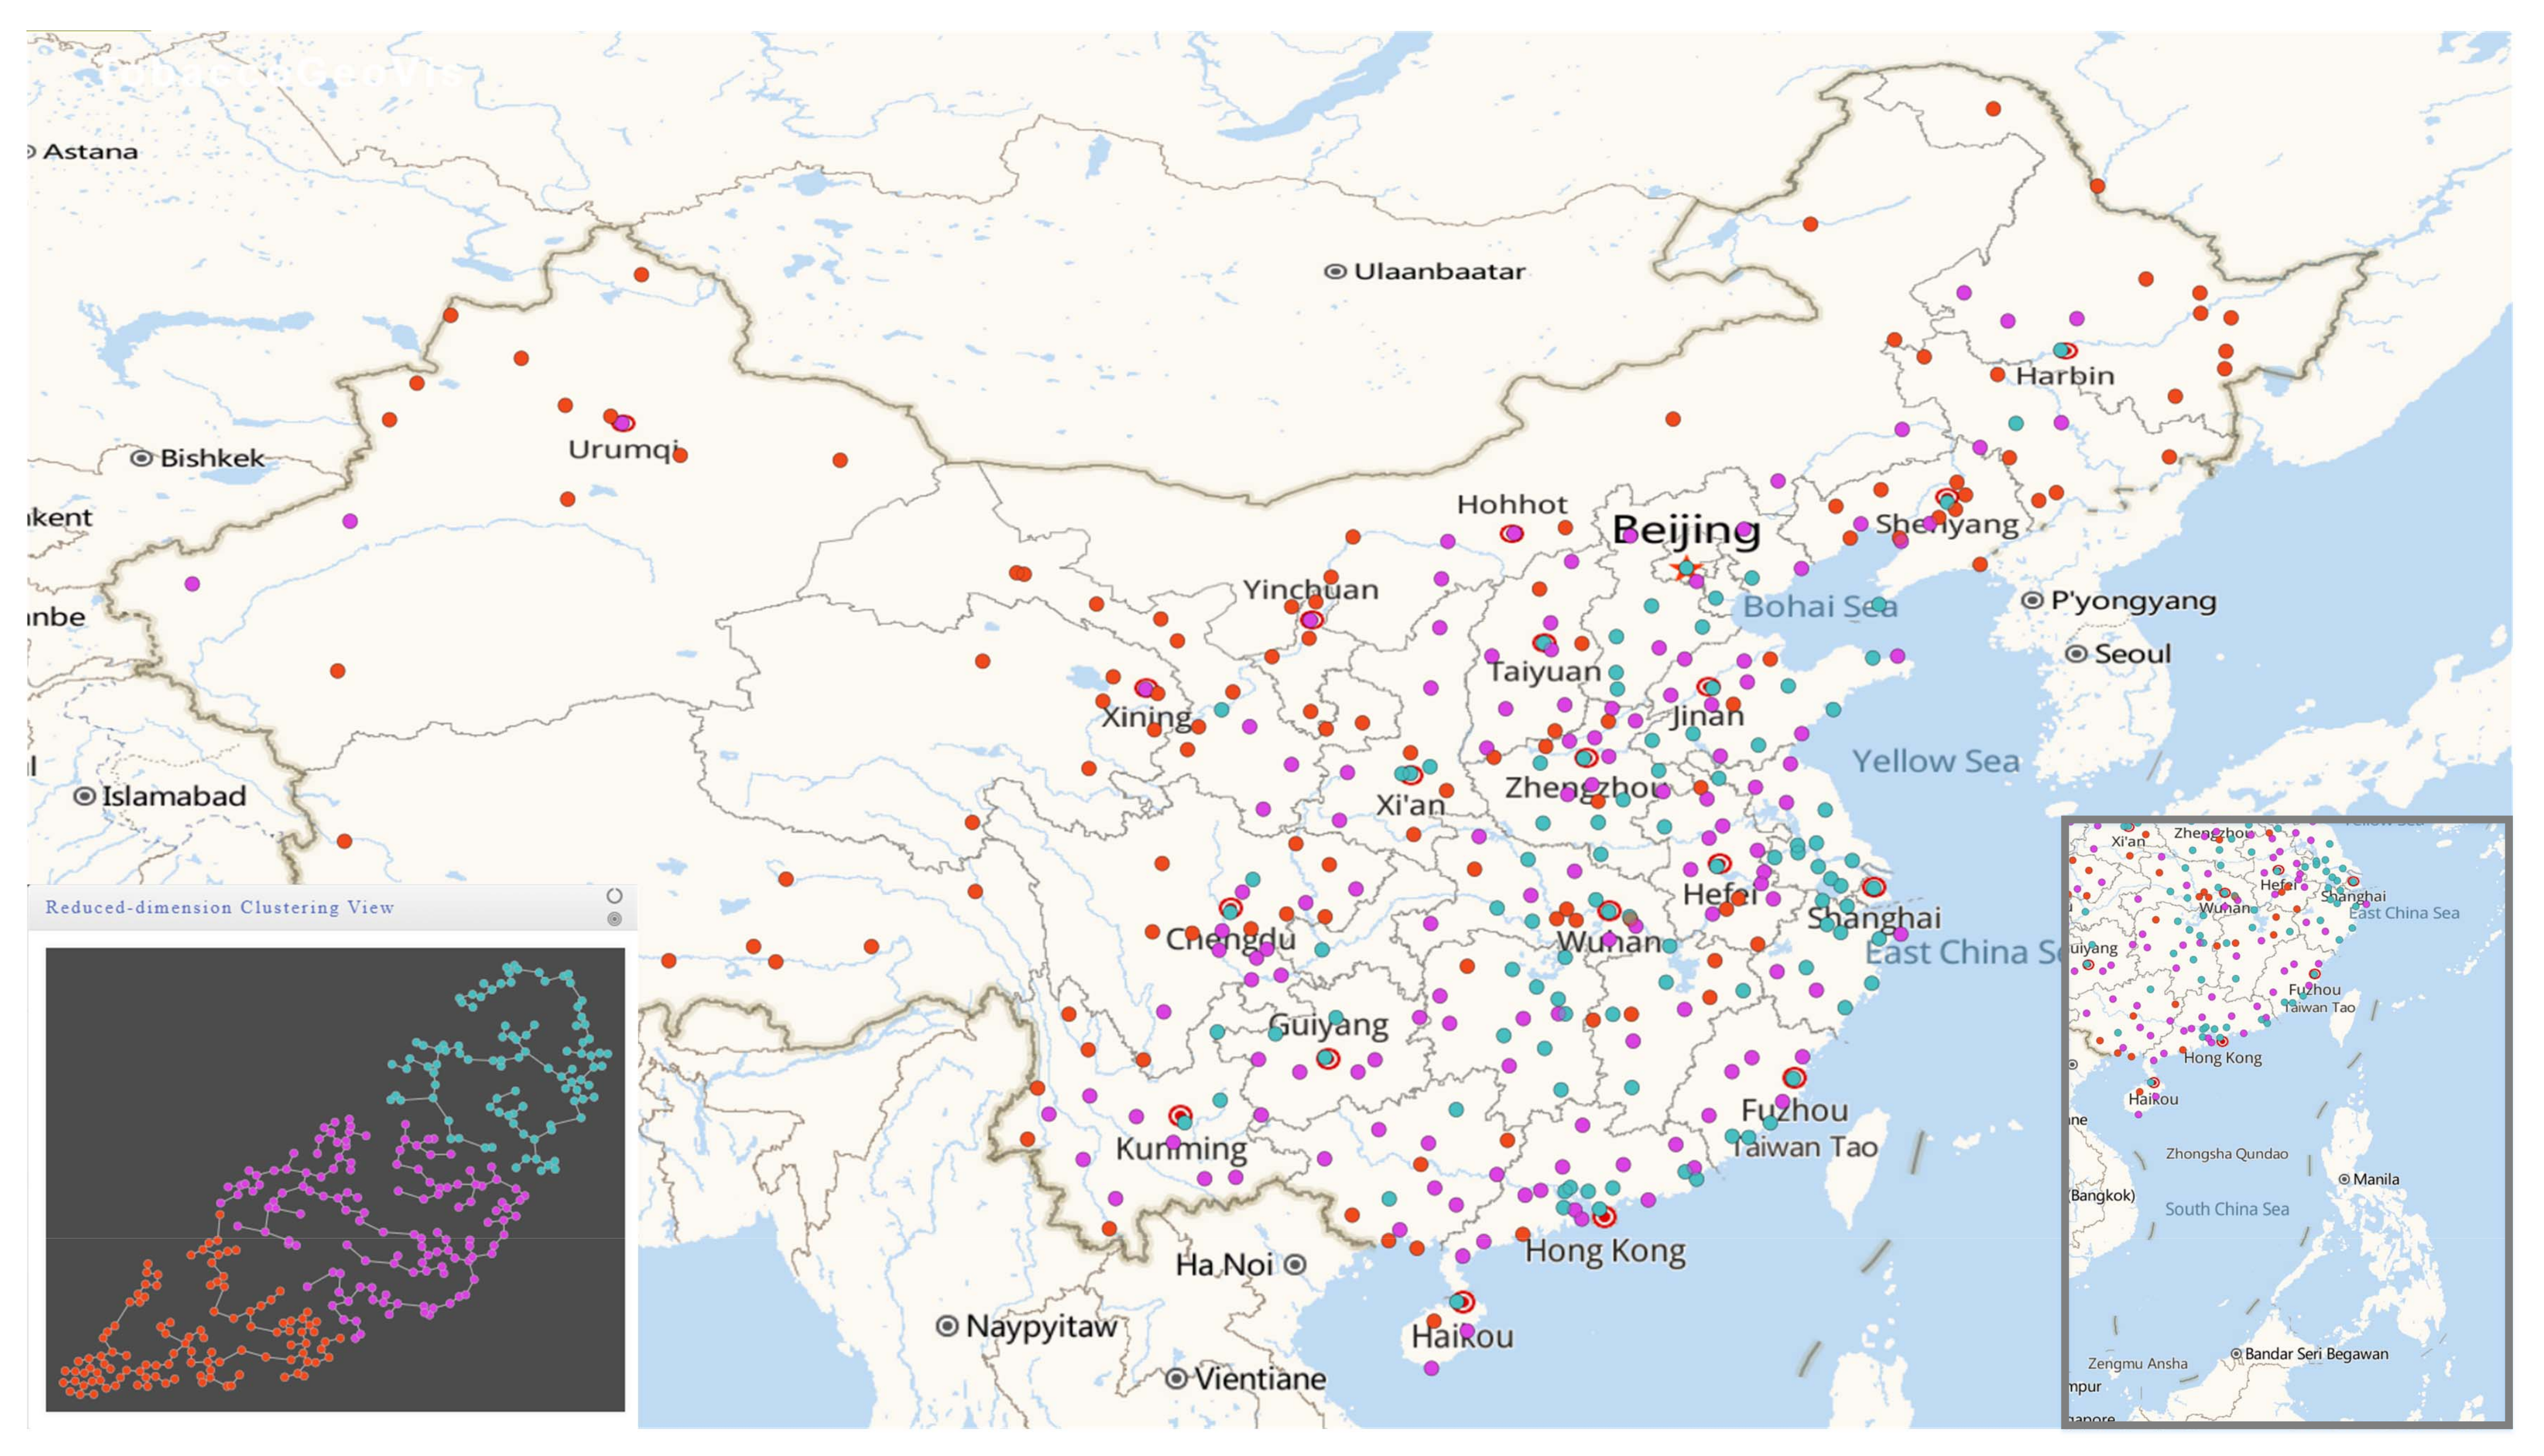
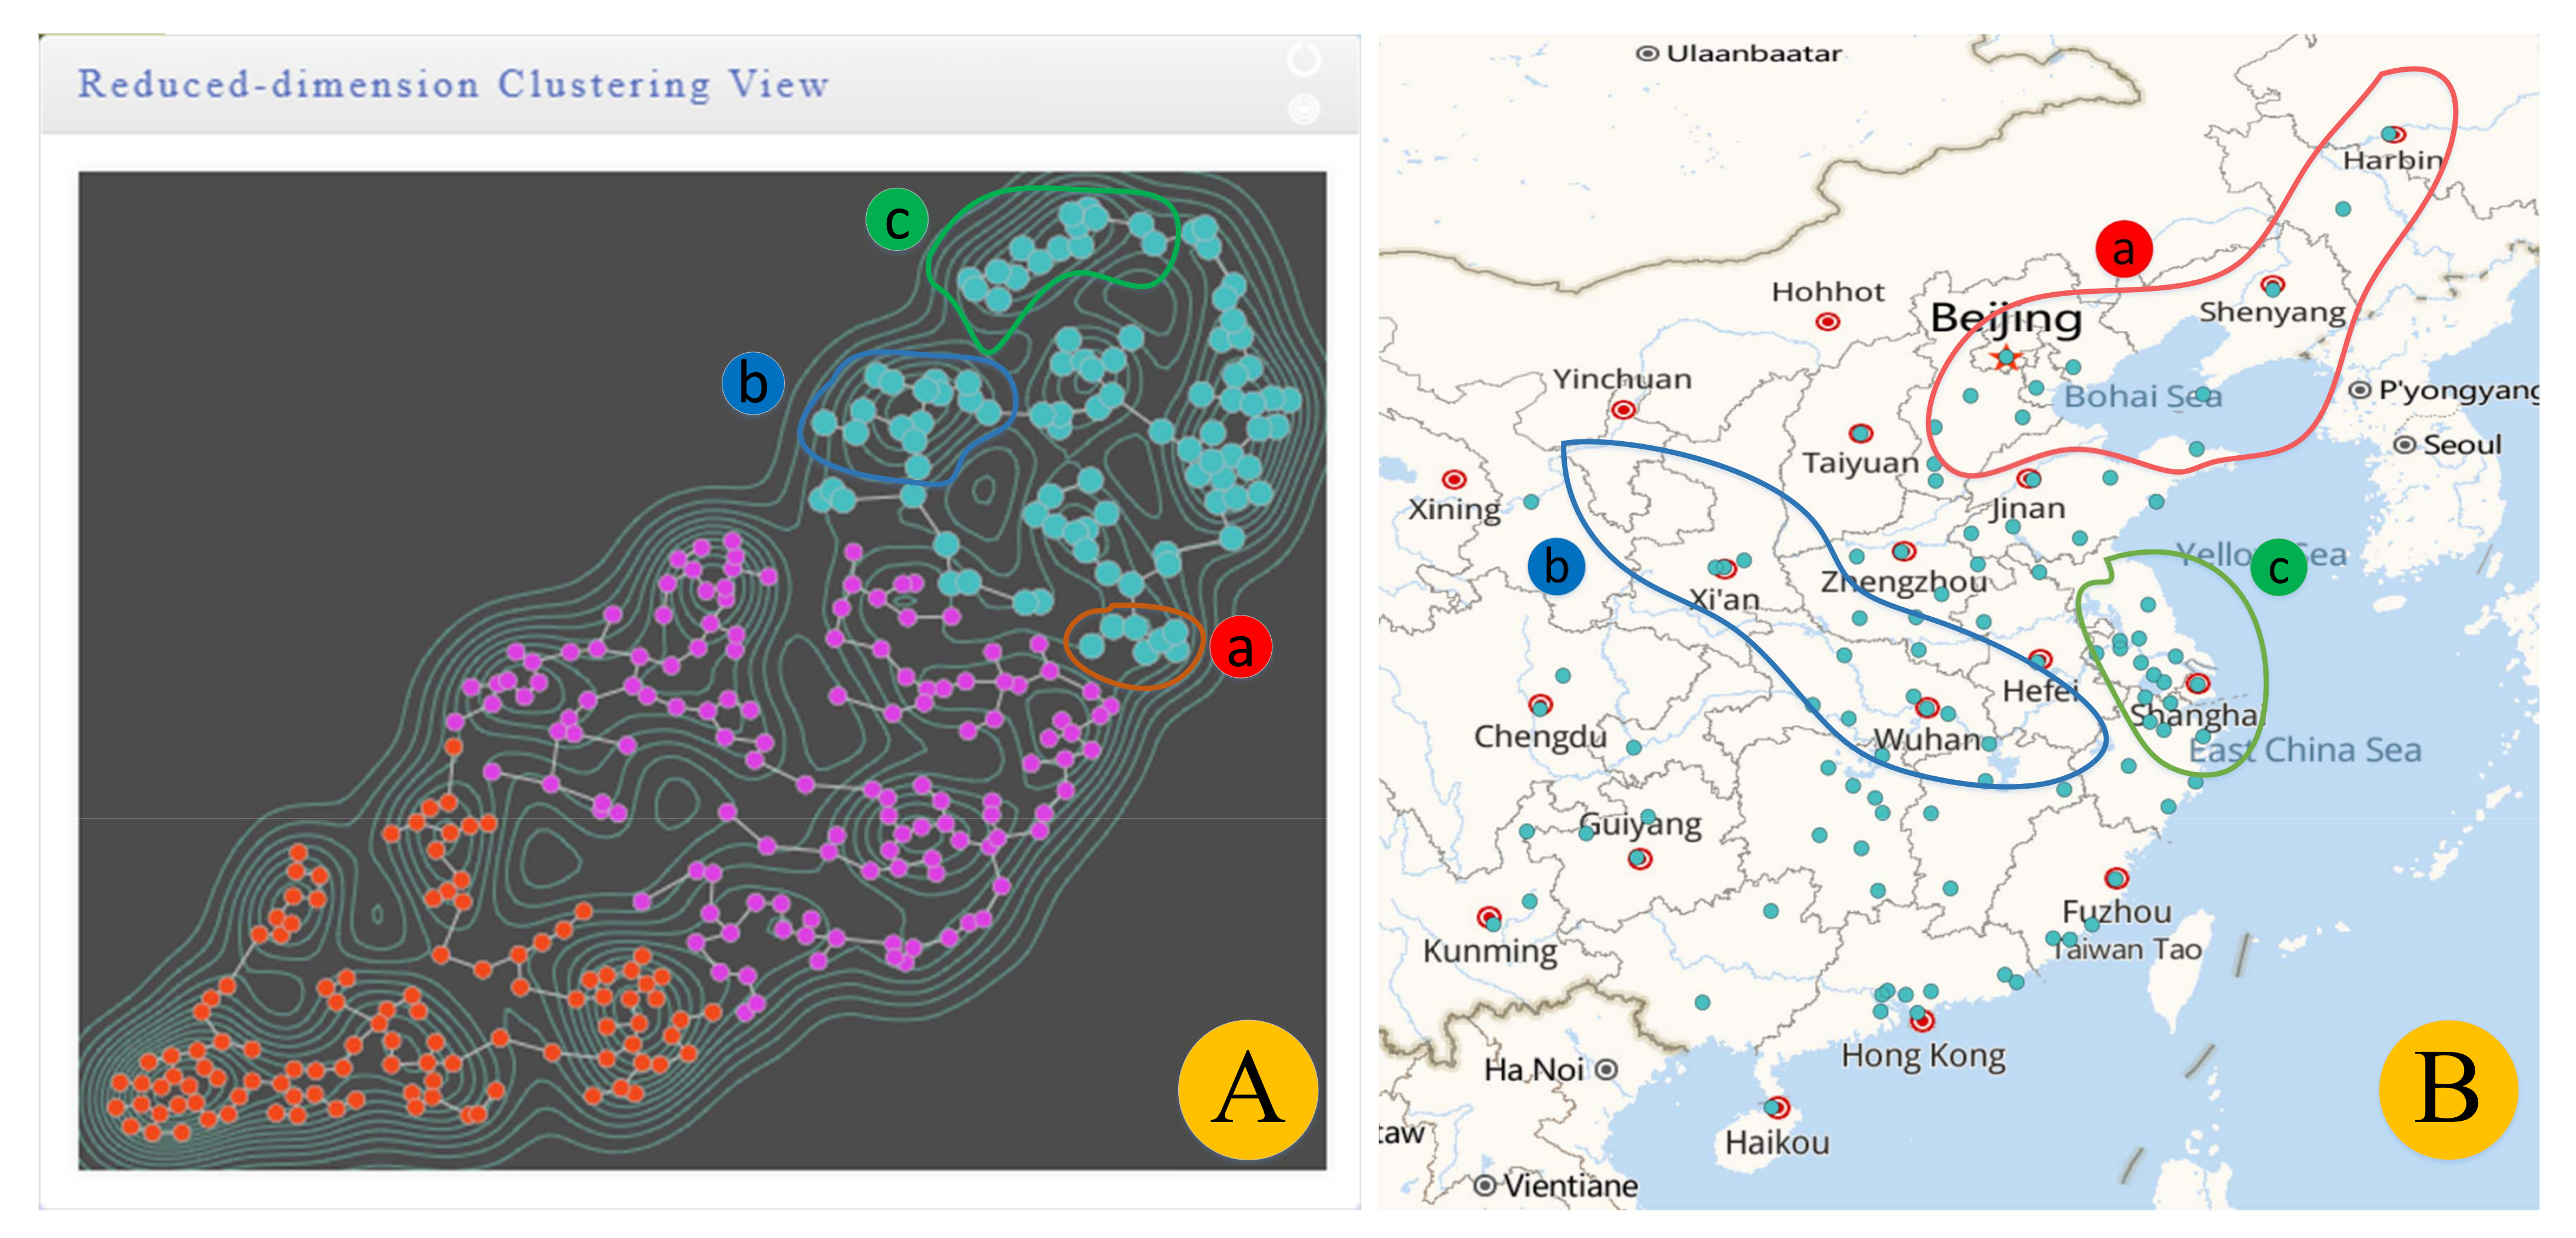
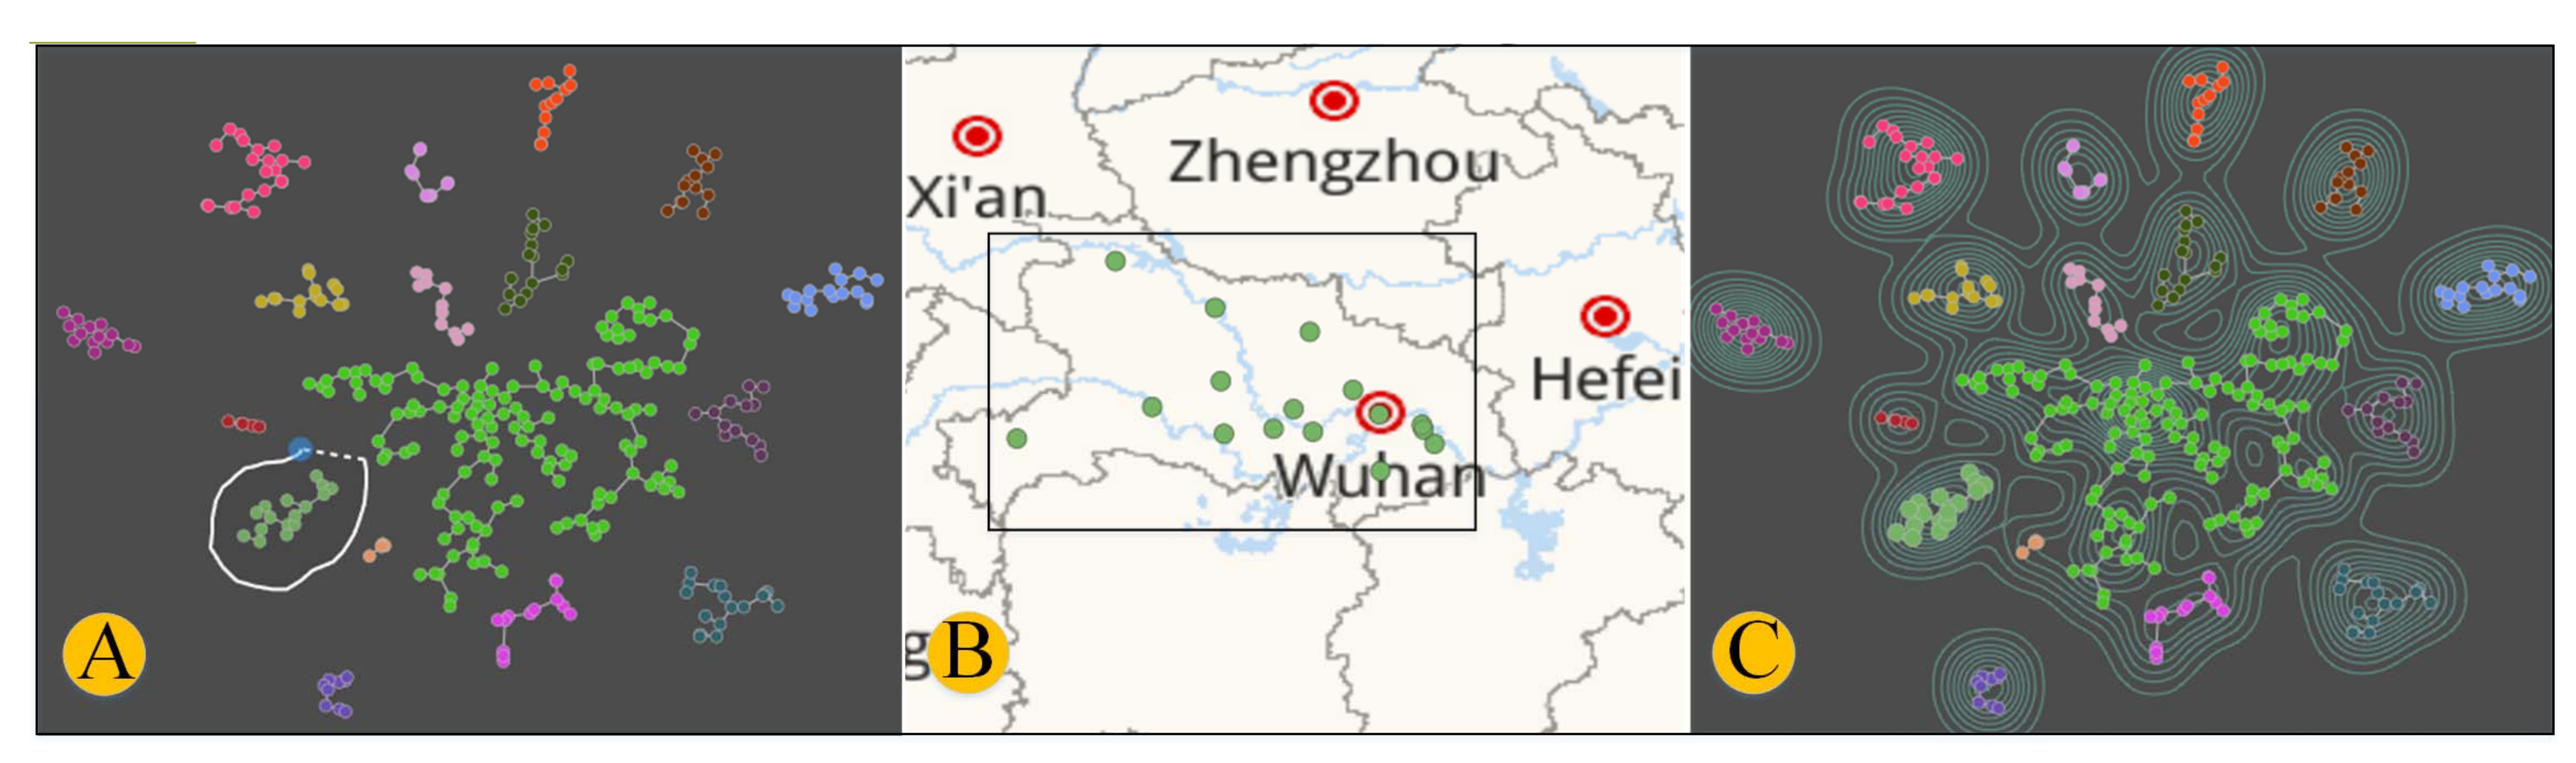
5.3.3. Reduced-Dimensional Clustering Mapping Visualization

The reduced-dimensional clustering visualization view (Figure 4C) maps abstract data objects into the space represented by the two-dimensional rectangular coordinate system. The view can intuitively and effectively reveal the relationship between two attributes. Each circular point in the scatter chart represents the projection of multiple features of original data after dimension reduction. Color coding denotes various clusters. However, the clarity distinguishing different clusters by color alone can still be improved. Therefore, the view uses minimum spanning tree algorithm to establish connections between scatters in each cluster. Thus, circular points in each cluster are connected by lines to form a connectivity graph, which can clearly identify each cluster. In addition, classification data obtained via reduced-dimension clustering are depicted on the map (Figure 4B).

6. Interactive Design

6.1. Spatial Data Visualization Interaction

Figure 5 shows the interface configuration interaction function of spatial data visualization. Users can select parameters and the chart form and complete parameter configuration after importing data. The system provides a filtering function to assist users in the selection when many attributes exist (Figure 5A). The visual expression of color is significantly greater than that of shape, and the system provides a configurable color scheme. Users can configure colors for different values according to their need for visual prominence (Figure 5(C1,C2)) to assist them in focusing on important information and achieving efficient expression.

6.2. Map-Based Data Similarity Interaction

Figure 4 presents the visual interface of data similarity interaction analysis. This function can help users explore and analyze high-dimensional tobacco data to find some connections and rules in data. Users choose the analysis pattern, dimension reduction, clustering method, and parameter from the configuration panel. Among them, users can set the learning rate and neighbors number for TSNE and clustering number for k-means++. The DBSCAN method provides two configuration parameters, namely domain radius and number. The clustering results are displayed in reduced-dimensional clustering and map views according to the user configuration.
Users can circle relevant scattered points using the lasso tool (Figure 4(C1)) in the reduced-dimensional clustering view (Figure 6A). Thus, highlighted points corresponding to selected dots in the map view (Figure 6B) enhances the convenience in the interaction between map and reduced-dimensional clustering views as well as assists users in analyzing the similarity of various regions. Users can also utilize the contour tool (Figure 4(C2)) to add contour lines in the reduced-dimensional clustering view (Figure 6C), estimate the area of each cluster, identify the core area and the node relationship in each cluster, and enhance user understanding of data.

7. Case Study

TobaccoGeoVis is designed and developed on the basis of visualization and interactive methods. We illustrate system functions using three sets of application examples and verify the effectiveness and availability of the system.

7.1. Spatial Distribution of Industrial Usability of Flue-Cured Tobacco Leaves

This section visualizes evaluation data of national flue-cured tobacco quality in China in 2016. The data involve 21 provinces, including 160 upper, 160 middle, and 160 lower tobacco samples. Industrial usability is an important indicator in the quality evaluation of flue-cured tobacco leaves. We use map overlaying scattered points to analyze differences in industrial usability of flue-cured tobacco leaves of various provinces. “Industrial usability” is a discrete attribute with values of A, A-B, B, B-C, C, and C-D in data. A represents strong usability, B represents secondary strong usability, C represents medium usability and D represents weak usability. Graphs of A, B, and C in Figure 7 show the spatial distribution of industrial usability of upper, middle, and lower tobacco leaves, respectively. The largest area covered by green points in the three graphs indicated that the industrial usability of tobacco leaves in China is the overall strength. Middle tobacco leaves obtained the best performance, followed by upper and lower tobacco leaves. The industrial usability of upper and middle tobacco leaves in each province is uneven with a large gap. Industrial usability of lower tobacco leaves is consistent. The industrial usability of tobacco leaves in different parts of Yunnan, Guizhou, Sichuan, Chongqing, Hunan, Henan, Hubei, and Fujian is stronger than that in other parts of China.

7.2. Analysis on Consumer Attention of Cigarette Products

Evaluation data of cigarette consumers of Yanyue (https://www.yanyue.cn/tobacco (accessed on 16 February 2022)) from 2008 to 2020 are analyzed in this section. The dataset contains 67,210 evaluation datum of cigarette consumers for 2128 cigarette specifications. We selected nine cigarette specifications with similar prices, namely, Furongwang (ying), Huangjinye (ruandajinyuan), Yuxi (ruan), Huanghelou (yingyaxiang), Liqun (ruanhongchangzui), Nanjing (jingpin), Jiaozi (yinggongfu), Qipilang (ruanhui), and Shuangxi (yingshijijingdian). The map overlaying pie chart in Figure 8 shows the attention of consumers to different specifications of cigarettes in each province. Yuxi (ruan) and Furongwang (ying) received high attention from consumers in most provinces and presented more advantages over other specifications. This finding demonstrated the many audiences of these two cigarette specifications that compete in provincial markets at the same price. The geographical distribution of consumer attention demonstrated that the same cigarette specifications receive high attention in the production area and adjacent provinces. For example, consumers in southwest China show higher attention to Yuxi (ruan) than Furongwang (ying), whereas those in central and southern regions present significantly higher attention to Furongwang (ying) than Yuxi (ruan).
Further analysis showed that this phenomenon may be closely related to the geographical migration of consumers. Frequent population flow between adjacent regions leads to a certain similarity in the consumer preference of cigarette products. On this basis, the cigarette delivery strategy can be analyzed further by combining the annual population migration and consumer evaluation data for cigarette delivery.
Consumers in Hubei, Guangdong, and Sichuan pay more attention to cigarette products of the other province in the price range selected by the case compared with cigarette products of the province. The analysis showed that this phenomenon may be closely related to the degree of style complementarity between local and foreign cigarette products as well as the acceptance of foreign cigarettes by local consumers. Cigarette manufacturers can refer to this result in the adjustment of their cigarette market delivery structure.
The size of the pie chart can represent the total amount of cigarette evaluation data in the corresponding area. The pie size distribution demonstrated that selected price cigarette products receive high attention in the Yangtze and Pearl River Deltas. This phenomenon may be closely related to the consumer’s consumption level and habits and internet development in these regions.
The proposed visualization method combined with cigarette consumer evaluation data for case analysis can provide a theoretical reference for cigarette product competitive analysis, cigarette consumption structure analysis, and delivery strategy research.

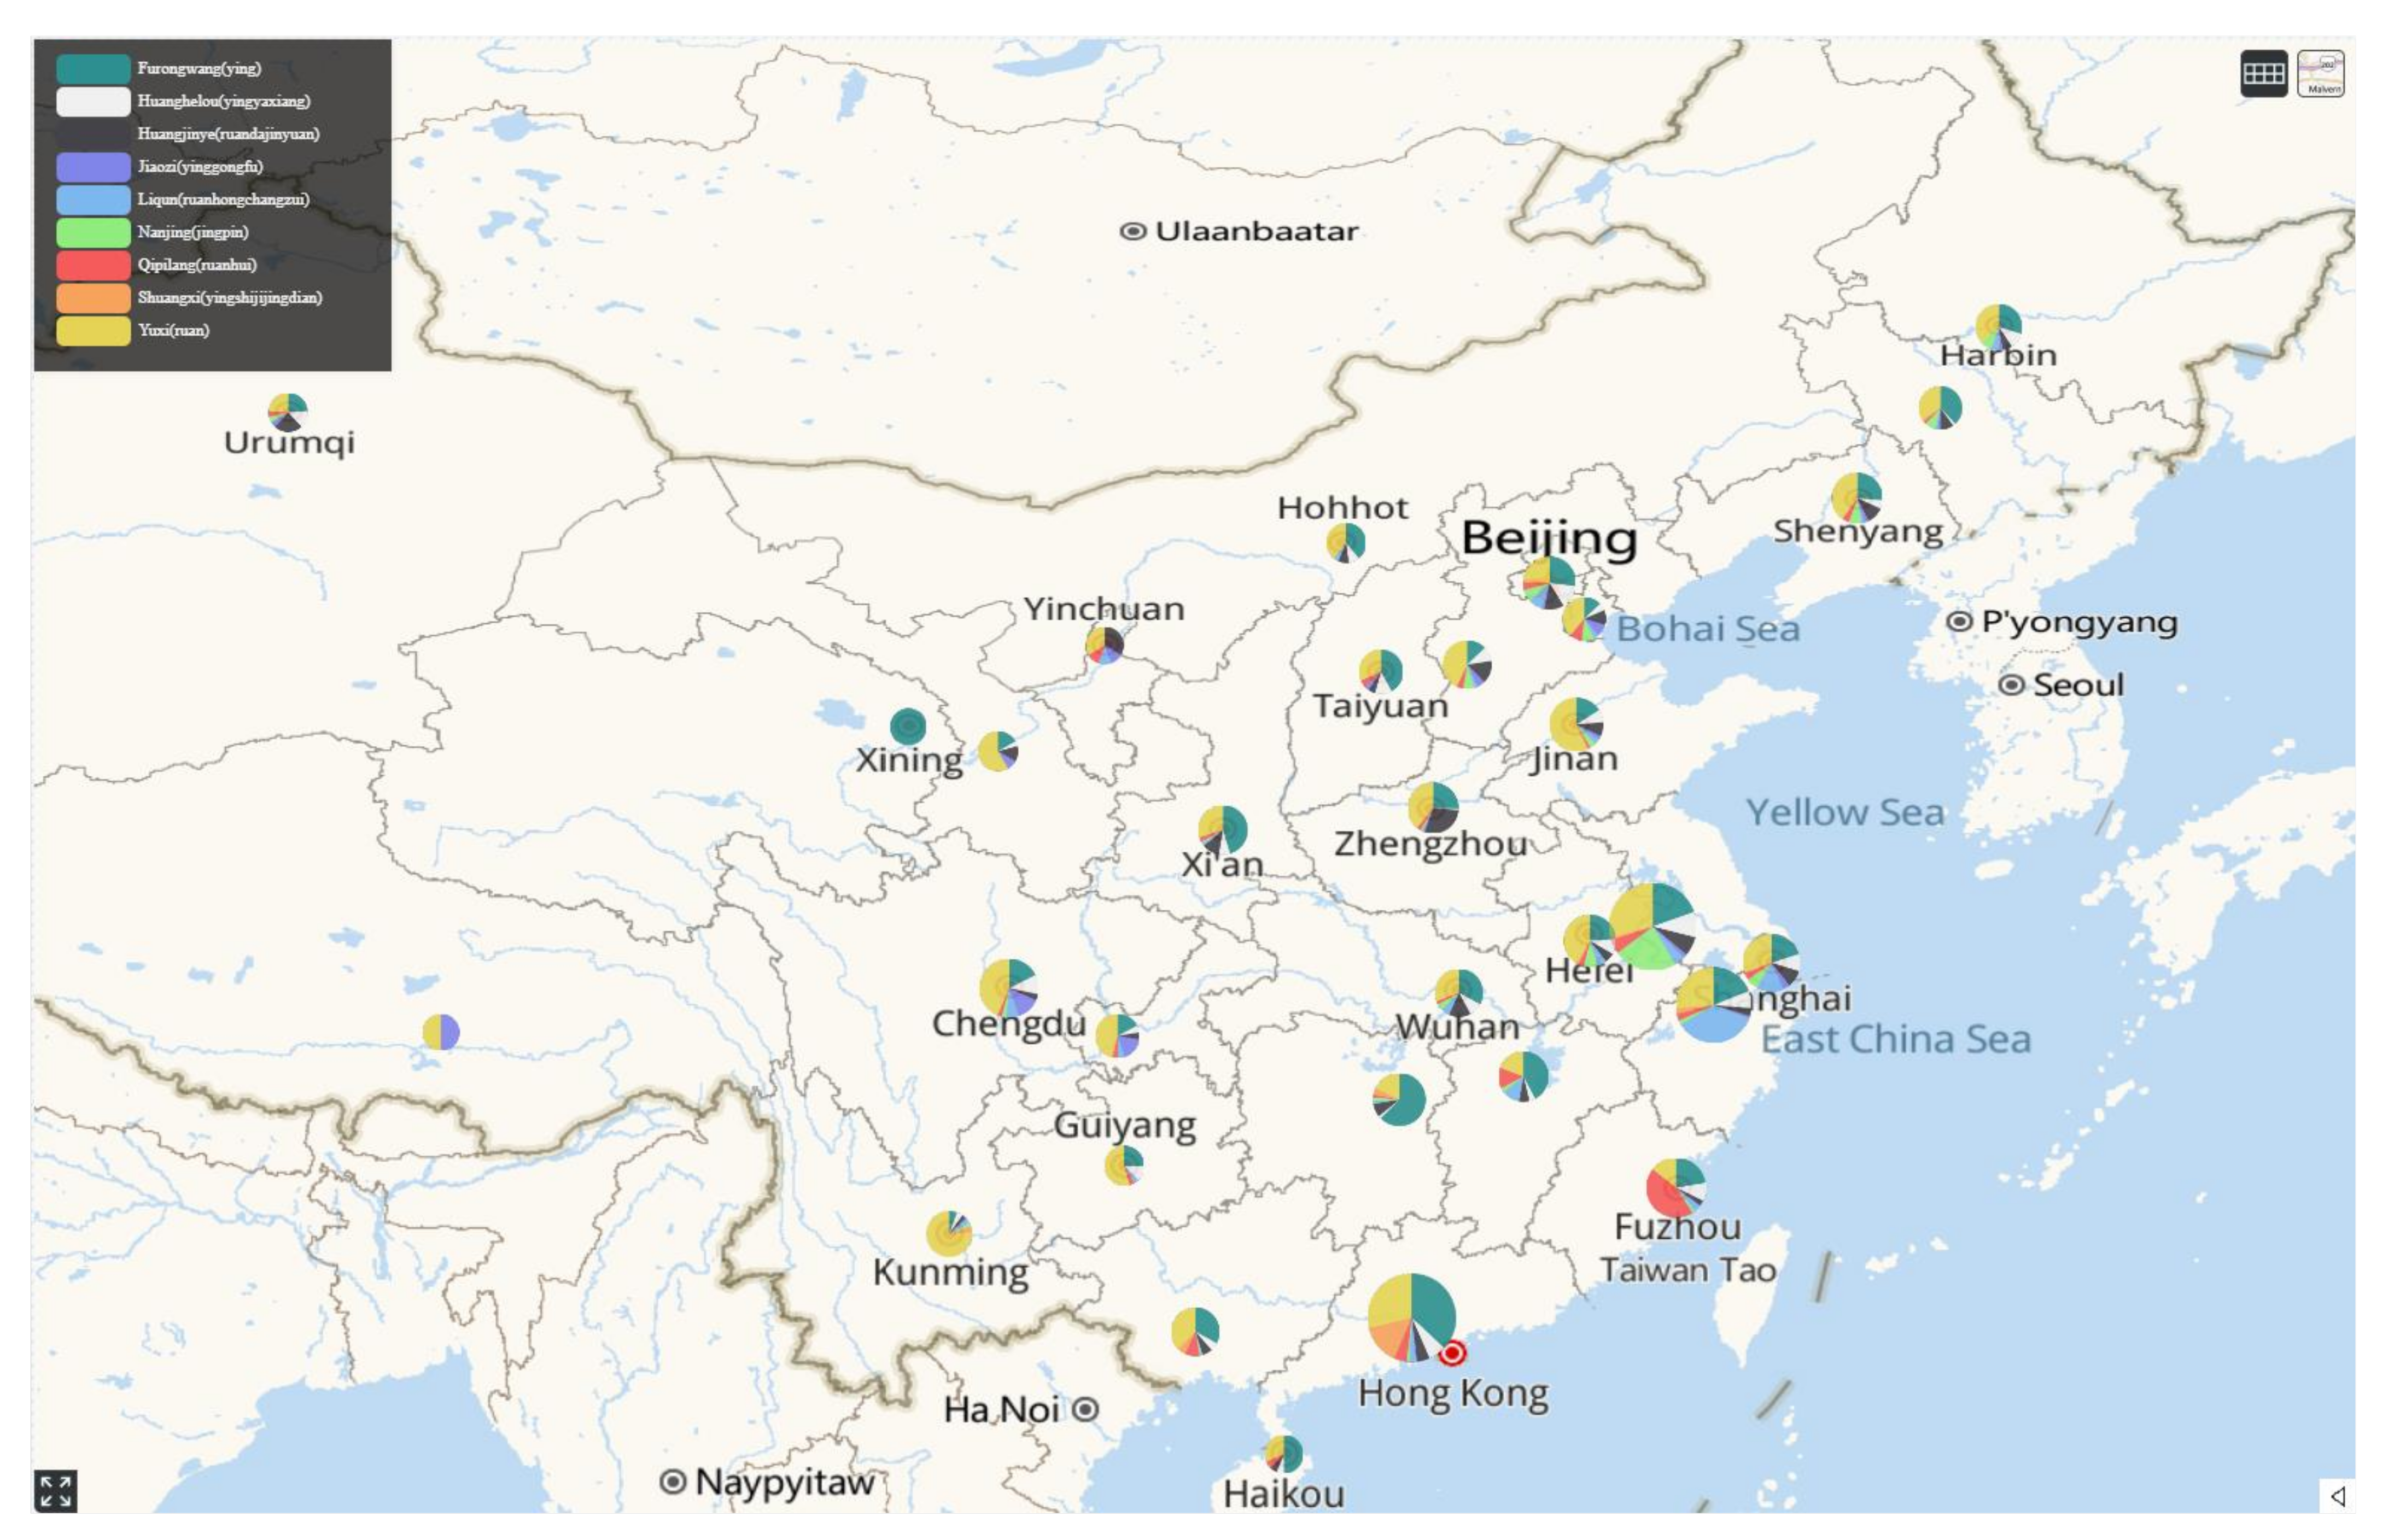
7.3. Visualization Analysis of Cigarette Laying Structure Similarity

Cigarette delivery data in China in 2019 are visually analyzed in this section. We explore characteristics of cigarette delivery through the interaction between the map and reduced-dimension clustering view. The dataset contains 942 cigarette specifications in 343 major cities in China. We process data according to the cigarette price and calculate the sum of the amount of cigarette specifications in each interval. Five characteristics of 0–3, 3–5.5, 5.5–13, 13–18, and 18–100 price intervals are constructed. The price range is basically consistent with the cigarette price classification of the tobacco industry. On the basis of these five feature selections, TSNE is used to reduce the dimension of data and k-means++ is selected to cluster data. The learning rate is set to 10, the neighbor number is set to 30, and the clustering number is set to 3. Figure 9 shows that red dots are mainly distributed in underdeveloped areas, such as northeast and northwest; green dots are mainly distributed in economically developed areas, such as coastal and provincial capital cities; and purple dots are mainly distributed in north, central, and southwest China. The structure (price) of urban cigarettes in the same color cluster is similar. This finding is consistent with the economic situation in China.
We add contour to the dimension reduction clustering results. Figure 10 shows that small groups are evident in each cluster. The lasso tool is used to encircle three small groups in the green cluster. Detailed observations showed that the distance between clusters b and c in the scatter chart is small, that is, clusters b and c are similar. The spatial distribution of clusters b and c on the map is also close. This finding indicated that cities with similar geographical locations present nearly identical cigarette delivery modes in the same category (i.e., similar consumption structure).

8. Conclusions

We introduce a visual analysis system of tobacco spatial data that assists users in their interactive exploration of tobacco data. The effectiveness and availability of the system are confirmed using three groups of visualization application of tobacco field data. The system can facilitate tobacco researchers in the intuitive visualization and interactive analysis of geographic spatial data. This work has the following limitations: (1) The existing calculation of dimensionality reduction clustering is performed on the browser side, and data rendering fails to achieve real-time performance. (2) Although the spatial distribution generally demonstrates acceptable performance, the result of dimensionality reduction clustering is unstable and the results generated each time will vary. We intend to continue the expansion of the visualization form of the system, as well as develop and integrate additional data mining algorithms and visual analysis models in combination with practical application needs of the tobacco industry for application in diverse visualization scenarios of tobacco data in future investigations. We will also analyze tobacco spatial data of different scales to enhance the system universality, continue to enrich the interactive means of the system, and guide users in understanding data further and excavating the value behind the data.

Author Contributions

Conceptualization, B.Y. and D.T.; data curation, B.Y.; formal analysis, B.Y.; funding acquisition, D.T.; investigation, B.Y.; methodology, B.Y., D.T. and G.S.; project administration, D.T.; resources, D.T.; software, B.Y.; supervision, D.T.; validation, B.Y.; visualization, B.Y.; writing—original draft preparation, B.Y.; writing—review and editing, D.T. and G.S. All authors have read and agreed to the published version of the manuscript.

Funding

This research was supported by Beijing Natural Science Foundation (4212030).

Conflicts of Interest

The authors declare no conflict of interest.

References

  1. Wang, R.; Qiu, J.; Zheng, X.; Shi, C.; Zhang, C.; Wang, Z.; Wang, J.; Liu, Y.; Jia, N.; Feng, W. Survey on Status of Scientific Research Data in Tobacco Industry. Tob. Sci. Technol. 2020, 53, 107–112. [Google Scholar]
  2. Ren, L.; Du, Y.; Ma, S.; Zhang, X.; Dai, G. Visual Analytics Towards Big Data. J. Softw. 2014, 25, 1909–1936. [Google Scholar]
  3. Tian, D.; Shan, G.; Chi, X. Visual Analysis Method of Ecosystem Changes Based on Transfer Matrix. Comput. Syst. Appl. 2020, 29, 66–73. [Google Scholar]
  4. Yang, H.; Zhang, Z.; Yang, M.; Yang, D.; Jiang, X.; Chen, J. Design and Development of Online Visualization Platform for Meteorological Grid Data. Comput. Eng. Appl. 2019, 55, 207–211. [Google Scholar]
  5. Huang, D.; Xu, C.; Zheng, X.; Zhao, D.; He, S. Research on Big Data Visualization System for Marine Forecast Missions. Comput. Eng. Appl. 2019, 55, 87–94. [Google Scholar]
  6. Deng, C.; Sun, R.; Chen, Z.; Guo, X.; Nong, Y.; Qin, Y.; Zhao, K.; Wu, Q.; Li, S. Visual Analysis of Tobacco Market Big Data Based on Spatial-Temporal Grid. Tob. Sci. Technol. 2018, 51, 106–112. [Google Scholar]
  7. Yang, J. Studies on Creation and Visualization of Dynamic Simulation Model on Root Growth and Development in Tobacco (Nicotiana tabacum L.). Master’s Thesis, Henan Agricultural University, Zhengzhou, China, 2004. [Google Scholar]
  8. Wang, Y.; Wen, W.; Guo, X.; Zhao, G.; Lu, S.; Xiao, B. Research on Three-Dimensional Reconstruction and Visualization of Above-Ground Tobacco Plant. Sci. Agric. Sin. 2013, 46, 37–44. [Google Scholar]
  9. Wang, Y.; Wen, W.; Guo, X.; Zhao, G.; Xiao, B.; Lu, S. Research on Visualized Simulation of Tobacco Inflorescence. J. Agric. Mech. Res. 2011, 33, 51–54, 58. [Google Scholar]
  10. Hu, L.; Liu, M. Design and Realization of Visual Tobacco Management Information Based on 3 - Layer System Structure. Haidian Univ. J. 2005, 65–67, 23. [Google Scholar]
  11. Fan, X.; Lu, H. Research on Visual Management Platform of Tobacco Monopoly. Sci. Technol. Innov. 2018, 108, 111. [Google Scholar]
  12. Wang, K. Construction of Geographic Information System for Tobacco Visual Monopoly Management. Fujian Comput. 2015, 31, 113, 96. [Google Scholar]
  13. Zhang, S. Research on Visual Customer Relationship Management for Tobacco Industry. Master’s Thesis, Shandong University, Qingdao, China, 2006. [Google Scholar]
  14. Fang, Q.; Zhou, S. Application of Visual Customer Relationship Management in Tobacco Industry. Enterp. Econ. 2009, 123–125. Available online: https://xueshu.baidu.com/usercenter/paper/show?paperid=9aed8ffe85ca7fc0dd95ca3aed98f958amp;sc_from=pingtai4amp;cmd=paper_forwardamp;title (accessed on 20 February 2022).
  15. Shen, L.; Ma, R.; Li, S.; Zhang, X.; Liu, Z.; Li, F. Application on the Special and High Quality Tobacco Based on 3D Visualization Technology in the Jinshajiang River within Lijiang. J. Yunnan Agric. Univ. 2011, 172–177. [Google Scholar]
  16. Guo, D.; Fan, H. Analysis and Visualization of Cigarette Sales Data Based on ETL-KETTLE. Comput. Syst. Appl. 2017, 26, 74–80. [Google Scholar]
  17. Zhuo, H. Analysis of the Application of Heat Map in Tobacco Monopolization Management Based on Information Visualization. In Proceedings of the China Tobacco Society 2016 Annual Excellent Papers Compilation—Monopoly Management Theme, Beijing, China, 1 January 2016; Volume 12, pp. 2–13. [Google Scholar]
  18. Deng, C.; Song, J.; Sun, R.; Guo, X.; Shi, Y.; Yuan, G.; Sun, C.; Deng, X.; Lu, Y. Visual Analysis System of Cigarette Marketing Data Based on Thermodynamic Diagram. Tob. Sci. Technol. 2016, 49, 91–97. [Google Scholar]
  19. Meng, K. Research on Equipment Management Data Visualization of X Cigarette Factory Based on Lean Thinking. Master’s Thesis, Shaanxi Normal University, Xi’an, China, 2016. [Google Scholar]
  20. Yang, J.; Wang, H.; Li, B.; Li, S. Visible Analysis of Tobacco Strands’ Movement in Upright Pipe. Tob. Sci. Technol. 2009, 10–13. [Google Scholar]
  21. Ouyang, K. Tobacco Near Infrared Analysis Index System Web Visualization. Master’s Thesis, Hunan Normal University, Changsha, China, 2016. [Google Scholar]
  22. The Importance of Tobacco Control in Mexico. Available online: https://www.healthdata.org/data-visualization/importance-tobacco-control-mexico (accessed on 26 November 2019).
  23. Guindon, G.; Fatima, T.; Li, D.; Joukova, A.; Sudhir, J.; Mishra, S.; Chaloupka, F.; Jha, P. Visualizing data: Trends in smoking tobacco prices and taxes in India. Gates Open Res. 2019, 3, 8. [Google Scholar] [CrossRef]
  24. Gueorguieva, R.; Buta, E.; Simon, P.; Krishnan-Sarin, S.; O’Malley, S. Data Visualization Tools of Tobacco Product Use Patterns, Transitions and Sex Differences in the PATH Youth Data. Nicotine Tob. Res. 2020, 22, 1901–1908. [Google Scholar] [CrossRef]
  25. Tian, D.; Shan, G.; Chi, X.; Zhang, Y.; Feng, W.; Wang, J.; Wang, A.; Wang, R. Visual Analysis Method of Tobacco Quality Data Based on Dimension Reduction. J. Syst. Simul. 2021, 33, 2279–2288. [Google Scholar]
  26. Wei, C.; Yang, M.; Liu, Y.; Cai, X.; Wang, X.; Song, J.; Yin, Q. Spatial Feature Analysis of Apparent Quality Index in Flue-cured Tobacco at County Level. Acta Tabacaria Sin. 2010, 16, 45–49. [Google Scholar]
  27. Yang, J.; Zhang, Y.; Wang, J.; Hu, A.; Wang, H. Regional Differences in Smoking Preferences. Tob. Sci. Technol. 2012, 57–59. [Google Scholar]
  28. Lin, Y.; Yang, G.; Miao, M.; Yang, D.; Chen, X. Analysis on Regional Differences of Smoking Quality Indicators. Hubei Agric. Sci. 2009, 48, 3063–3067. [Google Scholar]
  29. Yang, B. Research on Visual Analysis Method of the Forest Disease and Pest Data. Ph.D. Thesis, Beijing Forestry University, Beijing, China, 2019. [Google Scholar]
  30. Han, J.; Kamber, M.; Pei, J. Data Mining: Concepts and Techniques, 3rd ed.; Morgan Kaufmann: Boston, MA, USA, 2012; pp. 83–124. [Google Scholar]
  31. Borg, I.; Groenen, P. Modern Multidimensional Scaling: Theory and Applications. J. Educ. Meas. 2010, 40, 277–280. [Google Scholar] [CrossRef]
  32. Maaten, L.; Hinton, G. Visualizing High-dimensional Data Using t-SNE. J. Mach. Learn. Res. 2008, 9, 2579–2605. [Google Scholar]
  33. Hinton, G.; Roweis, S. Stochastic Neighbor Embedding. In Proceedings of the 15th International Conference on Neural Information Processing Systems, Cambridge, MA, USA, 1 January 2002; pp. 857–864. [Google Scholar]
  34. Agarwal, P.; Mustafa, N. K-Means Projective Clustering. In Proceedings of the Twenty-Third ACM SIGACT-SIGMOD-SIGART Symposium on Principles of Database Systems, Paris, France, 14–16 June 2004; pp. 155–165. [Google Scholar]
  35. Arthur, D.; Vassilvitskii, S. K-means++: The Advantages of Careful Seeding. In Proceedings of the Eighteenth Annual ACM-SIAM Symposium on Discrete Algorithms, New Orleans, LA, USA, 7–9 January 2007; pp. 1027–1035. [Google Scholar]
  36. Ester, M.; Kriegel, H.; Sander, J.; Xu, X. A Density-Based Algorithm for Discovering Clusters in Large Spatial Databases with Noise. In Proceedings of the Second International Conference on Knowledge Discovery and Data Mining (KDD’96), Portland, Oregon, 2–4 August 1996; pp. 226–231. [Google Scholar]
Figure 1. Visual pipeline.
Electronics 11 00995 g001
Figure 2. System interface. (A) Configuration panel provides configuration information for the system. (a1) Data import reads remote and local data. (a2) Geographic information verification performs accurate matching of provincial, municipal, and county names. (a3) Analysis pattern selection determines multiple data analysis patterns. (a4) Geographic information configuration matches corresponding fields of provinces, cities, and counties in the data set. (a5) Different parameter configurations are provided for multiple patterns. (B) The map view shows the data spatial distribution by combining scatter, pie, and bar graphics. The system presents the three map perspective modes—(b1) 3D, 2D, and 2.5D—and five map layers (b2) of the image and vector map to visualize different perspectives and map conveniently. (C) Ranking view cooperates with the map to show data details and values of data points. (D) The reduced-dimensional clustering view cooperates with the map to analyze the similarity distribution of tobacco high-dimensional data in the geographical space.
Electronics 11 00995 g002
Figure 3. Comparative visualization. (A) Overlaying bar chart on the map. (B) Overlaying pie chart on the map.
Electronics 11 00995 g003
Figure 4. Data similarity interaction analysis. (A) Configuration panel. (B) Map view of spatial distribution features of data. (C) Analysis of reduced-dimension clustering view of the similarity distribution of tobacco high-dimensional data in the geographical space. (C1) is the lasso tool and (C2) is the contour tool.
Electronics 11 00995 g004
Figure 5. Spatial data visualization. The user can select parameters with multiple selectors (A). The color configuration scheme includes continuous data segmentation (B1) and enumeration data color configuration (B2). Configure the attribute color (C1) using the color selector (C2). Hover the mouse on the bar chart (D) to display details about a given region. The ranking view (E) shows the current attribute ranking in a given region.
Electronics 11 00995 g005
Figure 6. Interaction between the map and reduced-dimension clustering view. (A) Selection of relevant data using the lasso tool. (B) Highlighted points corresponding to selected dots in the map view. (C) Effect of the overlaying contour on the scatter chart.
Electronics 11 00995 g006
Figure 7. Spatial distribution of industrial usability of flue-cured tobacco leaves. Spatial distribution of industrial usability of (A) upper, (B) middle, and (C) lower tobacco leaves.
Electronics 11 00995 g007
Figure 8. Spatial distribution of industrial usability of flue-cured tobacco leaves.
Electronics 11 00995 g008
Figure 9. Similarity visualization of the cigarette delivery structure.
Electronics 11 00995 g009
Figure 10. Interactive analysis of clustering results. (A) Selection of three parts in the reduced-dimensional clustering view using the lasso tool. (B) Three parts related to (A) in the map view.
Electronics 11 00995 g010
Table 1. Tobacco scientific research spatial data.
CategoryFeatureValueFunction
space categorylongitude and latitudenumericspatial feature
high-dimensionalhigh dimensionnumeric, categoryfeature analysis
Table 2. Tobacco quality evaluation data.
ProvinceCityCountyEvaluation ScoreIndustrial Usability
YunnanBaoshanLongyang73.39A
HunanChangshaLiuyang67.97A
FujianLongyanShanghang70.45B
JilinTonghuaLiuhe62.14C
Sample data from the national flue-cured tobacco quality evaluation dataset in China in 2016. The evaluation score is calculated by combining chemical and physical compositions of tobacco.
Table 3. The evaluation data of cigarette consumers.
ProvinceProductNumber of Favorable Comments
BeijingZhonghua37
BeijingYunyan15
BeijingFurongwang10
YunnanZhonghua20
YunnanYunyan50
YunnanFurongwang10
Sample data from evaluation data of cigarette consumers from 2008 to 2020 of Yanyue website. The number of favorable comments is calculated according to the number of favorable comments of tobacco consumers to cigarette products on the website.
Publisher’s Note: MDPI stays neutral with regard to jurisdictional claims in published maps and institutional affiliations.

