Article

A Smart Tourism Case Study: Classification of Accommodation Using Machine Learning Models Based on Accommodation Characteristics and Online Guest Reviews

by
Nola Čumlievski
,
Marija Brkić Bakarić
* and
Maja Matetić
Faculty of Informatics and Digital Technologies, University of Rijeka, Radmile Matejčić 2, 51 000 Rijeka, Croatia
*
Author to whom correspondence should be addressed.
Electronics 2022, 11(6), 913; https://doi.org/10.3390/electronics11060913
Submission received: 14 February 2022 / Revised: 3 March 2022 / Accepted: 14 March 2022 / Published: 15 March 2022

Abstract

:
This paper deals with the analysis of data retrieved from a web page for booking accommodation. The main idea of the research is to analyze the relationship between accommodation factors and customer reviews in order to determine the factors that have the greatest influence on customer reviews. Machine learning methods are applied to the collected data and models that can predict the review category for those accommodations that are not evaluated by users are trained. The relationship between certain accommodation factors and classification accuracy of the models is examined in order to get detailed insight into the data used for model training, as well as to make the models more interpretable. The classification accuracy of each model is tested and the precision and recall of the models are examined and compared.

1. Introduction

The concept of a Smart City refers to an environment in which modern technology is embedded within the city system. As cities become increasingly competitive and complex throughout the years, Information and Communication Technology (ICT) gradually starts to coordinate all activities and functions of the city and blends into city’s social components in order to improve the quality of life while also improving the efficiency of city services [1]. The smart tourism destination concept, as an example of a smart city service, emerged from the development of smart cities. It can be perceived as places employing technological tools and techniques that can potentially reinforce the customer experience by offering services that are more adapted to the visitor’s needs and preferences, with the aim to enable demand, value, pleasure, and experience for the customers (tourist), and profit, wealth, and many other benefits for the organizations and destinations [2].
The volume of created data challenges the tourism sector and opens the door for the use of Artificial Intelligence (AI). Machine Learning (ML) is the most applicable area of AI for the tourism sector, due to its focus on predictive and perspective analytics. It includes the possibility of training models that can learn from data and experiences with the goal of gaining a thorough understanding about the nature of the process [3].
The rapid growth in the number of tourism-related Internet applications has led to an enormous number of personal reviews, as well as to more information about the accommodation itself. Information in these applications is valuable to both customers and organizations for various understanding and planning processes [4].
With the help of sentiment analysis, key characteristics of customer reviews can be analyzed. These characteristics include views on tourist attractions and tourism infrastructure, such as parking, shops, coffee shops, Wi-Fi, and basically any content surrounding the accommodation that can help tourism managers and organizations to improve and therefore attract more customers [5].
Furthermore, machine learning algorithms can be applied to smart retail and tourism domains. With their ability to learn from past preferences and user behavior, these algorithms create an opportunity for finding patterns that explain consumer preferences, behavior, or taste, and predicting hotel performance by analyzing customer reviews and hotel aspects, which can lead to improving the decision-making process of organizations [6].

2. Related Work

Web scraping is commonly used in order to get the hotel and booking data needed for applying machine learning methods in the process of predicting certain accommodation attributes. Annisa et al. [7] process data and apply the Latent Dirichlet Allocation (LDA) modeling method to the data on booking hotels. The LDA method, which is commonly applied in this type of research, is used to extract the review topics from the keywords that are frequently reviewed by tourists. The results show that there are certain topics in hotel reviews that are more often discussed by customers.
Natural language processing and machine learning methods can be used to understand customer requirements and therefore improve the quality of hotel services [8]. The study in [8] aims to estimate the number of topics in both positive and negative reviews. The Bag of Words (BoW) approach is used in order to extract the most relevant text attributes for representing customer reviews as vectors and subsequently interpret them. Clustering is used for grouping attributes in relation to whether the review is positive or negative and it is shown that this kind of information enables managers and researchers to identify service topics that affect (positively or negatively) the quality of service, thus providing information for improvement strategies.
In relation to customer review analysis, word frequency analysis can be conducted in order to explore words commonly used in relation to a specific hotel category. Numerous methods can be used for this analysis. Djuraidah et al. [9] use a three-level hierarchical Bayesian model to identify latent topics from documents using the BoW approach. The authors pre-process (tokenize, normalize, and remove stop words and punctuation) and analyze customer reviews posted on the hotel booking platform named Pegipegi (Indonesia). The research shows that the most frequent words in customer reviews differ in relation to the hotel rating, with the emphasis on hotels with considerably lower ratings (less than 6.0) that have the most frequent words that are completely different from hotels with considerably higher ratings (between 8.1 and 10) and hotels with medium ratings (between 6.1 and 8.0).
Beside the review content, technical attributes of customer reviews as well as customer involvement in the review community can also be analyzed to predict the overall customer satisfaction. The linguistic attributes of online text reviews remain largely under-explored because of the general open-structure characteristic of texts. The analysis of this kind of information could be used by hoteliers in order to get a better understanding of customer needs as well as to enhance the hotel performance [4].
Adjacent to customer review analysis, the research of Chu and Huang [10] focuses on the correlation analysis between hotel properties and hotel ratings. The hotel information is obtained from the booking pages (hotel name, location, overall rating, reviews, hotel price, and many more) and its relation to the hotel rating is explored with the emphasis on the effects that cultural difference and visual information (visual information and country information) have on the hotel rating prediction. Wang, Lu and Zhai [11] propose Latent Aspect Rating Analysis (LARA) in their research and Chu and Huang [10] show that their method, which uses the factorization machine predictor for the rating prediction (which is a predictor similar to Support Vector Machine (SVM)), is competitive or even better.
In their study, Wang et al. [12] focus on the comparison of the predicting power of several models used for predicting customer satisfaction based on text reviews. The study includes the acquisition and pre-processing of text data and a Back Propagation (BP) neural network-based regression model for predicting customer satisfaction. The authors analyze reviews from an online travel page. The results indicate that BP neural networks have the smallest Mean Square of Error (MSE) and the largest fitting coefficient in comparison to Deep Belief Networks (DBN), SVM, and Random Forest (RF).
In relation to the neural network-based models, the study of Shoukry and Aldeek [13] uses three sorts of algorithms: Deep Learning Convolutional Neural Network (CNN-DL), Artificial Neural Network (ANN), and Deep Learning Support Vector Machine (SVM-DL) to predict the attributes of hotel reviews. IoT-enabled devices are used to collect data from 33,214 hotel reviews on TripAdvisor and, using the mentioned algorithms, the reviews are separated into four classes: Luxury, Medium, Budget, and Cheap. The obtained results are then compared using three measures: positive predictive value (PPV), sensitivity, and F-score. The results reveal that most consumers prefer budget type hotels, and that the CNN-DL algorithm has better classification accuracy (0.92) and a lower error rate compared to other algorithms.

3. Methodology

This paper aims to apply several data science and machine learning methods in order to determine accommodation factors (location, price, reviews, popular sites nearby, etc.) that have the greatest influence on customer satisfaction. Beside the data analysis phase, during which the data are acquired, properly cleaned, and analyzed, several machine learning algorithms are used separately to predict the hotel category (okay, good, very good, etc.) based on customer reviews and accommodation factors alone. The results are compared in relation to the model accuracy rate, precision, and recall.

3.1. Data Acquisition

For the purpose of data acquisition, a web crawler that paginates through booking search results (separately for every country province) is used. It extracts hyperlinks to available accommodations as well as additional information such as name, location, type (hotel, mansion, apartment, etc.), number of stars (star rating), numerical and categorical rating, reviews, and other similar factors.

3.2. Feature Selection

For the selection of relevant features (in this case, accommodation factors), Pearson correlation is used. It quantifies the relationship between the target feature (hotel rating) and predictors (hotel factors). The Pearson correlation coefficient represents a measure of linear correlation between two sets of data—in this case, an accommodation factor that is a potential predictor and the target feature (rating) [14]. The formula used in order to calculate the linear relationship between the features is given in the following equation:
r = x i x ¯ y y ¯ x i x ¯ 2 y y ¯ 2 ,
where x i represents the values of the variable x (predictor) in the sample, and x ¯ the mean of the predictor values. By analogy, the same applies to the target feature (y). The correlation coefficient ranges from −1 to 1, where 1 represents a strong positive linear correlation (an increase in a predictor causes an increase in the target), and −1 represents a strong negative linear correlation (an increase in a predictor causes a decrease in the target). As the correlation coefficient approaches zero, the assumption that there is no linear relationship between variables increases. In this study, the inspection of the correlation coefficients of predictors is performed in order to define the coefficient threshold. In this way the predictors that are correlated to the target feature are discovered and later used to train the models.

3.3. Oversampling

An oversampling technique is used in order to balance the number of observations between rating categories. The booking data are the data collected from real accommodation users. Since these kinds of data are usually imbalanced, an oversampling method should be used in order to avoid overfitting the model on the majority classes, which would cause the model to learn patterns only for the dominant categories and lead to the accuracy paradox [15]. This research uses SMOTE, an oversampling technique that selects minority examples close in the feature space and creates new, synthesized data points based on vector calculations [16]. The equation used to generate new minority class samples is determined as follows:
x = x + r a n d 0 , 1 × x x k ,
where x refers to the new generated minority class sample, x to the minority sample, and x k to the k-nearest neighbor, which is obtained by calculating the Euclidean distance between x and every other sample in the minority class A, as given below:
d   x ,   y = i = 1 n x i y i 2   ;     y   A ,
where the number of nearest neighbors is chosen relative to the percentage increase of the minority sample (i.e., in the case of 200% minority subset increase, two nearest neighbors would be used to generate the synthesized data).

3.4. Classification Algorithms

Multinomial Naïve Bayes is the most frequently used algorithm in natural language processing [17]. It is based on the Bayes’ theorem which can be explained by the following equation:
P A | B = P ( B | A ) × P A P B ,
where A represents a certain accommodation category and B a predictor. As evident from the equation, the probability of a class A given predictor B is equal to the probability of the predictor B given class A multiplied by the probability of class A and divided by the probability of predictor B. In this research, this algorithm is used to predict hotel ratings based on English and Croatian text reviews.
Decision Trees are used, along with other algorithms, to predict the rating category of the accommodation based on certain accommodation factors [18]. Decision trees are based on the best Attribute Selection Measure (ASM), where the root feature (parent) is selected with respect to measures like Entropy, Gini index, and Information gain. Subsequent records are used for branching to leaves and the forementioned measures are used to quantify the variability of the target variable distribution in child nodes compared to the parent node.
Random Forest represents an ensemble of decision trees which are generated using the Bootstrap method on the same dataset. During tree branching, a new sample of m predictors is used, where m is equal to the square root of the number of predictors p that is used by the algorithm [19]. Each tree makes the prediction independently of other trees in the ensemble and the final prediction is based on the majority of “votes” obtained by each tree.
Support Vector Machine (SVM) is a supervised machine learning algorithm that uses geometry for predictions—the data points are mapped, and a hyperplane is created so as to ensure the largest possible gap between data points of different classes in order to maximize the size of the margin between classes [15]. The function for classification, in case of binary classification, is determined as follows:
y i = 1   if   w T x i + b 1         1   if   w T x i + b       1 ,
where y is the predicted class (output of SVM), x is the feature vector (input of SVM), w T and b are the parameters of SVM (they are learned using the training set), and ( y i , x i ) represent the ith sample in the dataset.

4. Dataset

The data used in this research are collected from the web page Booking.com (5 May 2021). Accommodations are searched separately for every Croatian county in order to collect more data (due to a limit of 1000 results per search query). For the accommodation price to appear in the search results, setting certain search filters is mandatory. Therefore, the search query specifies two adults who are looking for one overnight stay.
After scraping, a total of 8433 accommodations are collected that were available to customers on the night from the fourth of May 2021 to the fifth of May 2021, along with 18 variables/accommodation factors (not including the customer reviews, which were separately obtained and analyzed). After data manipulation and cleaning, the final dataset consists of 8113 observations (accommodations) and 31 columns (factors) comprising of the name of the accommodation, type, location, number of stars, numerical and categorical review, number of customer reviews, accommodation size and price, reviews based on specific properties of the accommodation (personnel, hotel facilities, cleanliness, comfort, value, location and internet), and binary variables for accommodation properties (whether smoking, parties or pets are allowed, the existence of a bar, pool, free Wi-Fi, breakfast, parking, beach, and transportation to the airport), as well as the county and region of the accommodation (one region consists of multiple counties). The description of a pre-processed dataset is given in Table 1.

5. Data Analysis and Results

5.1. Data Analysis in Relation to the Hotel Category

The relationship between different factors and the rating category of the accommodation is explored in order to gain a better understand of the rating category.
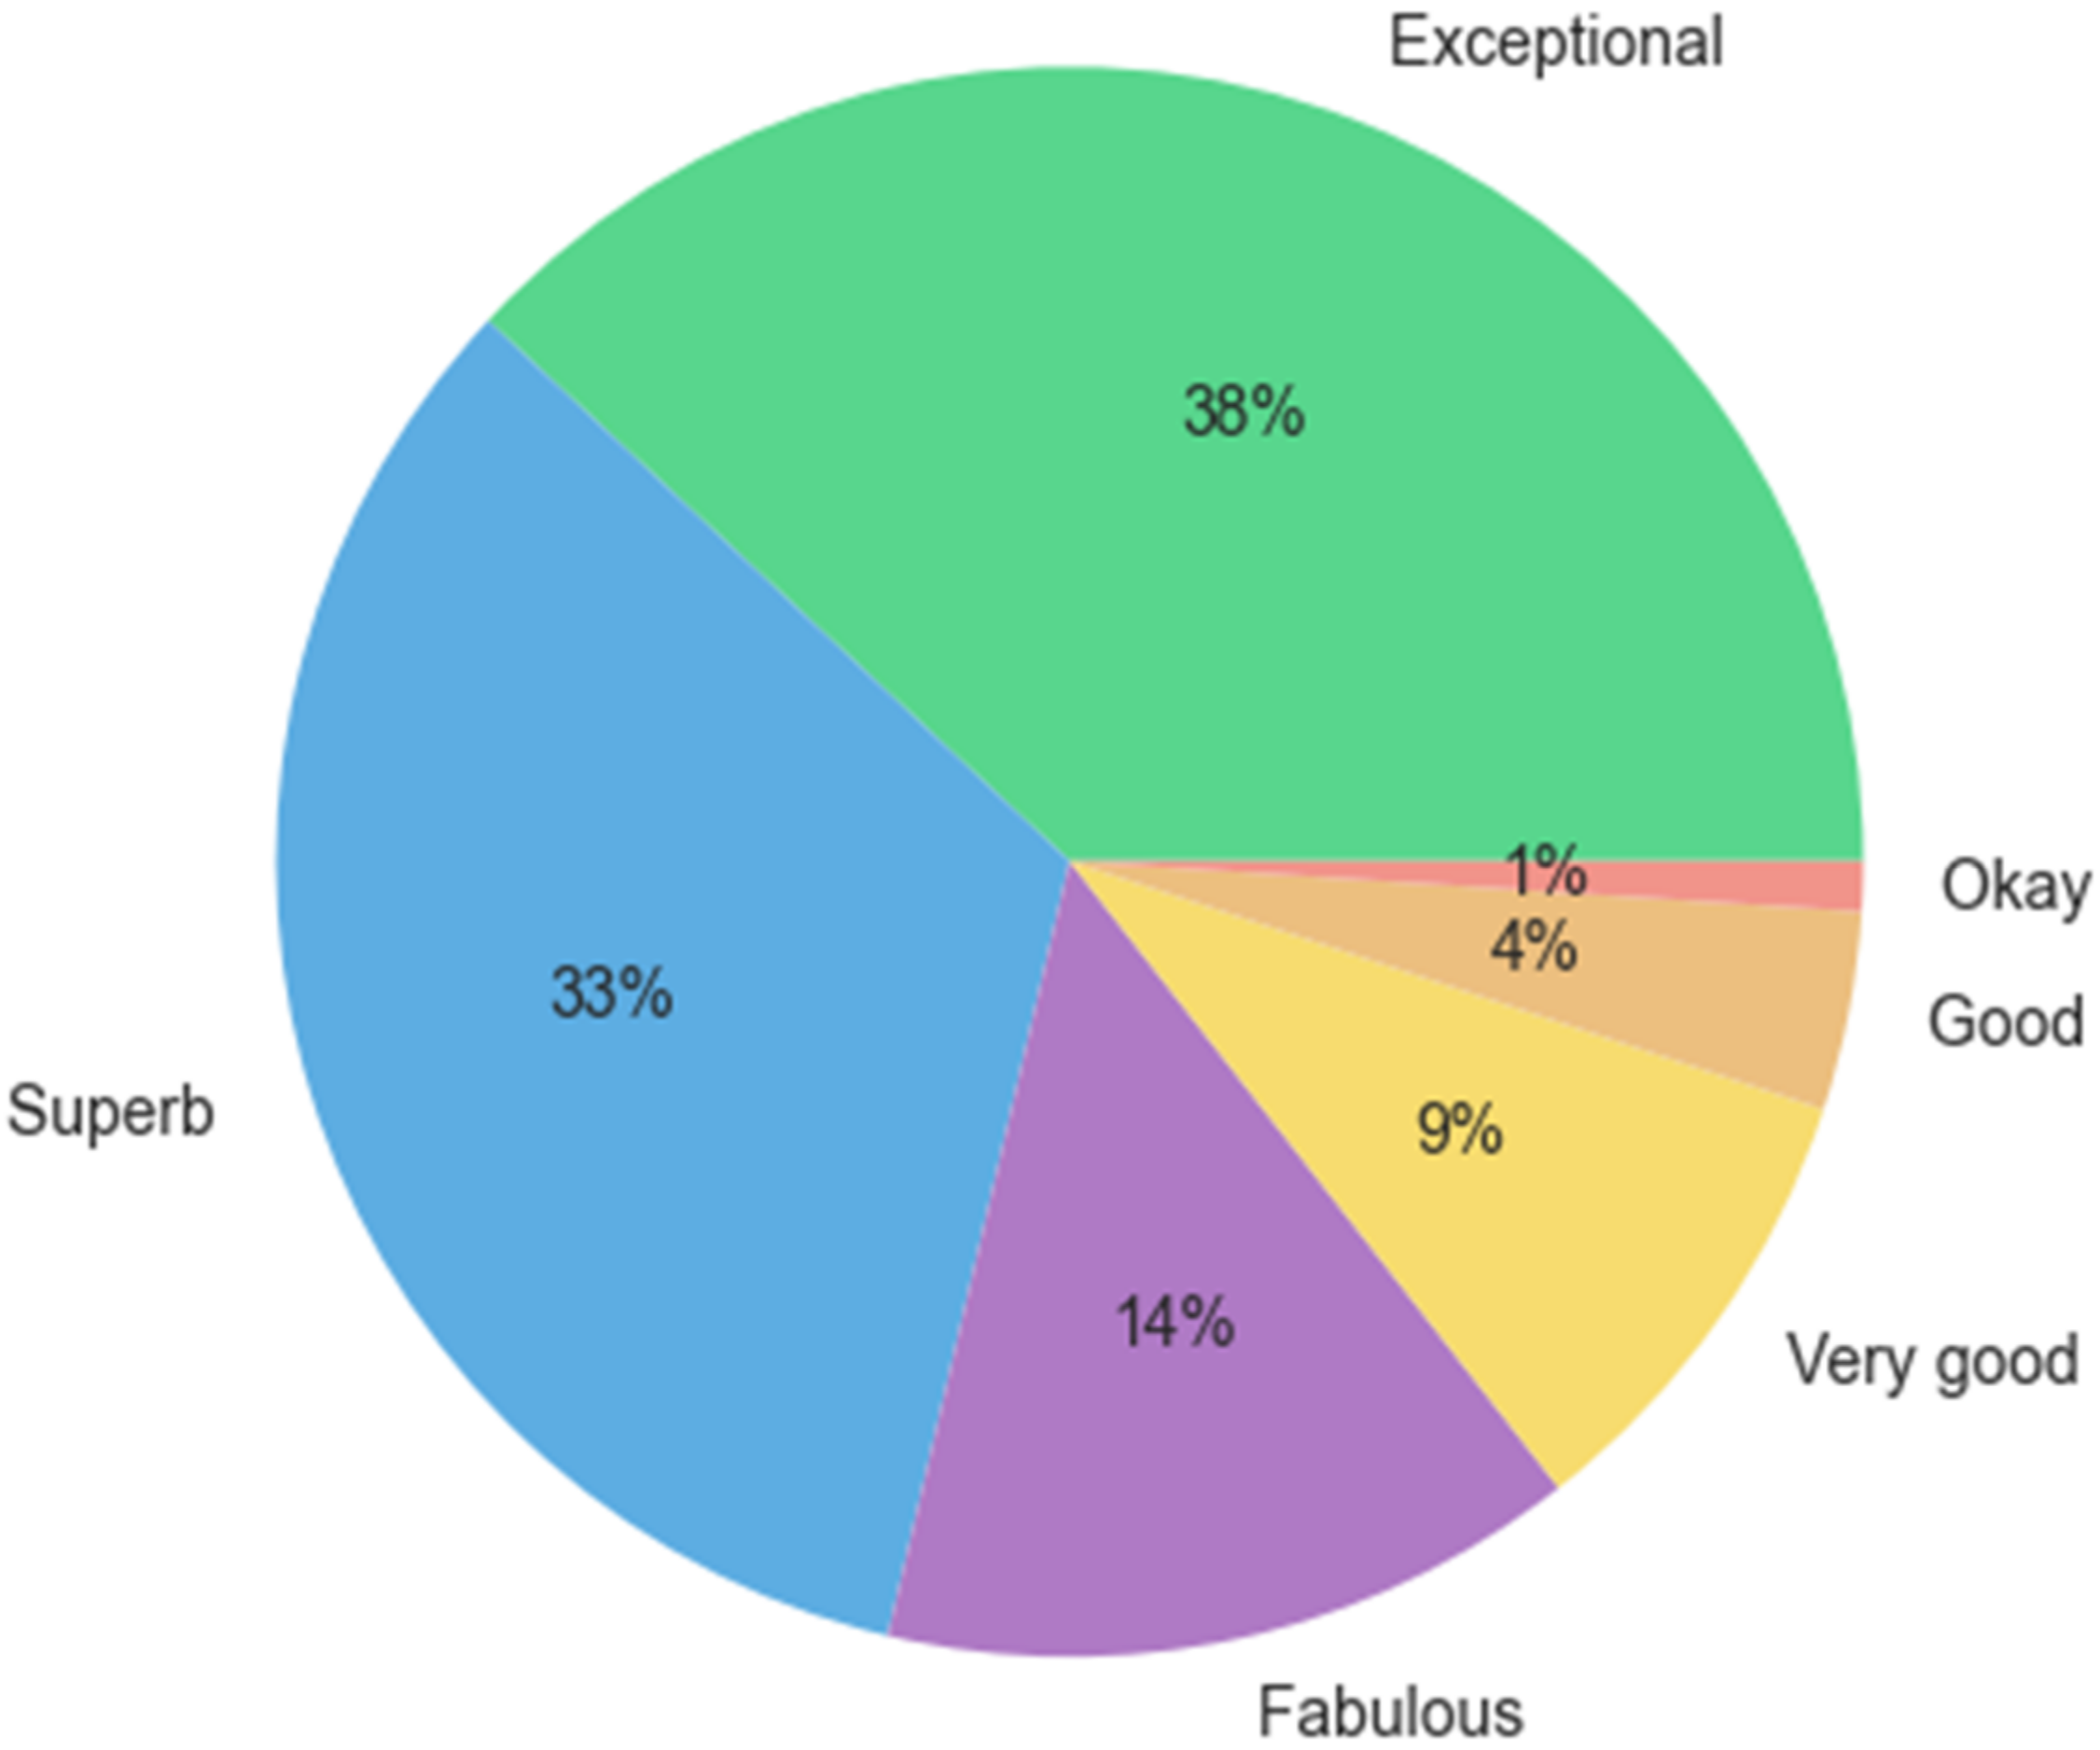
First the general properties of the dataset are explored, including the proportion of accommodations in each category. The largest share of observations belongs to two categories—Exceptional and Superb to be precise. The second largest are the categories Fabulous and Very good, followed by the categories Good and Okay, which have the lowest number of accommodations (Figure 1).
The accommodations with the lowest ratings belong to the category Okay, having a minimum rating of 4.9 (which is the lowest rating of this dataset) and a maximum of 6.9. The next worst category is Good, which includes accommodations with a numerical rating ranging from 7.0 to 7.9, followed by Very good with ratings from 8.0 to 8.5, Fabulous with ratings from 8.6 to 8.9, Superb with ratings from 9.0 and 9.4, and, lastly, Exceptional with ratings from 9.5 to 10. The average number of reviews and the average size of the accommodation are explored to find out that the middle categories (Very good, Fabulous, Superb) have on average more reviews than the extremely low or high categories (Okay, Good, and Exceptional), and that the size of accommodation positively correlates with the accommodation category (Table 2).
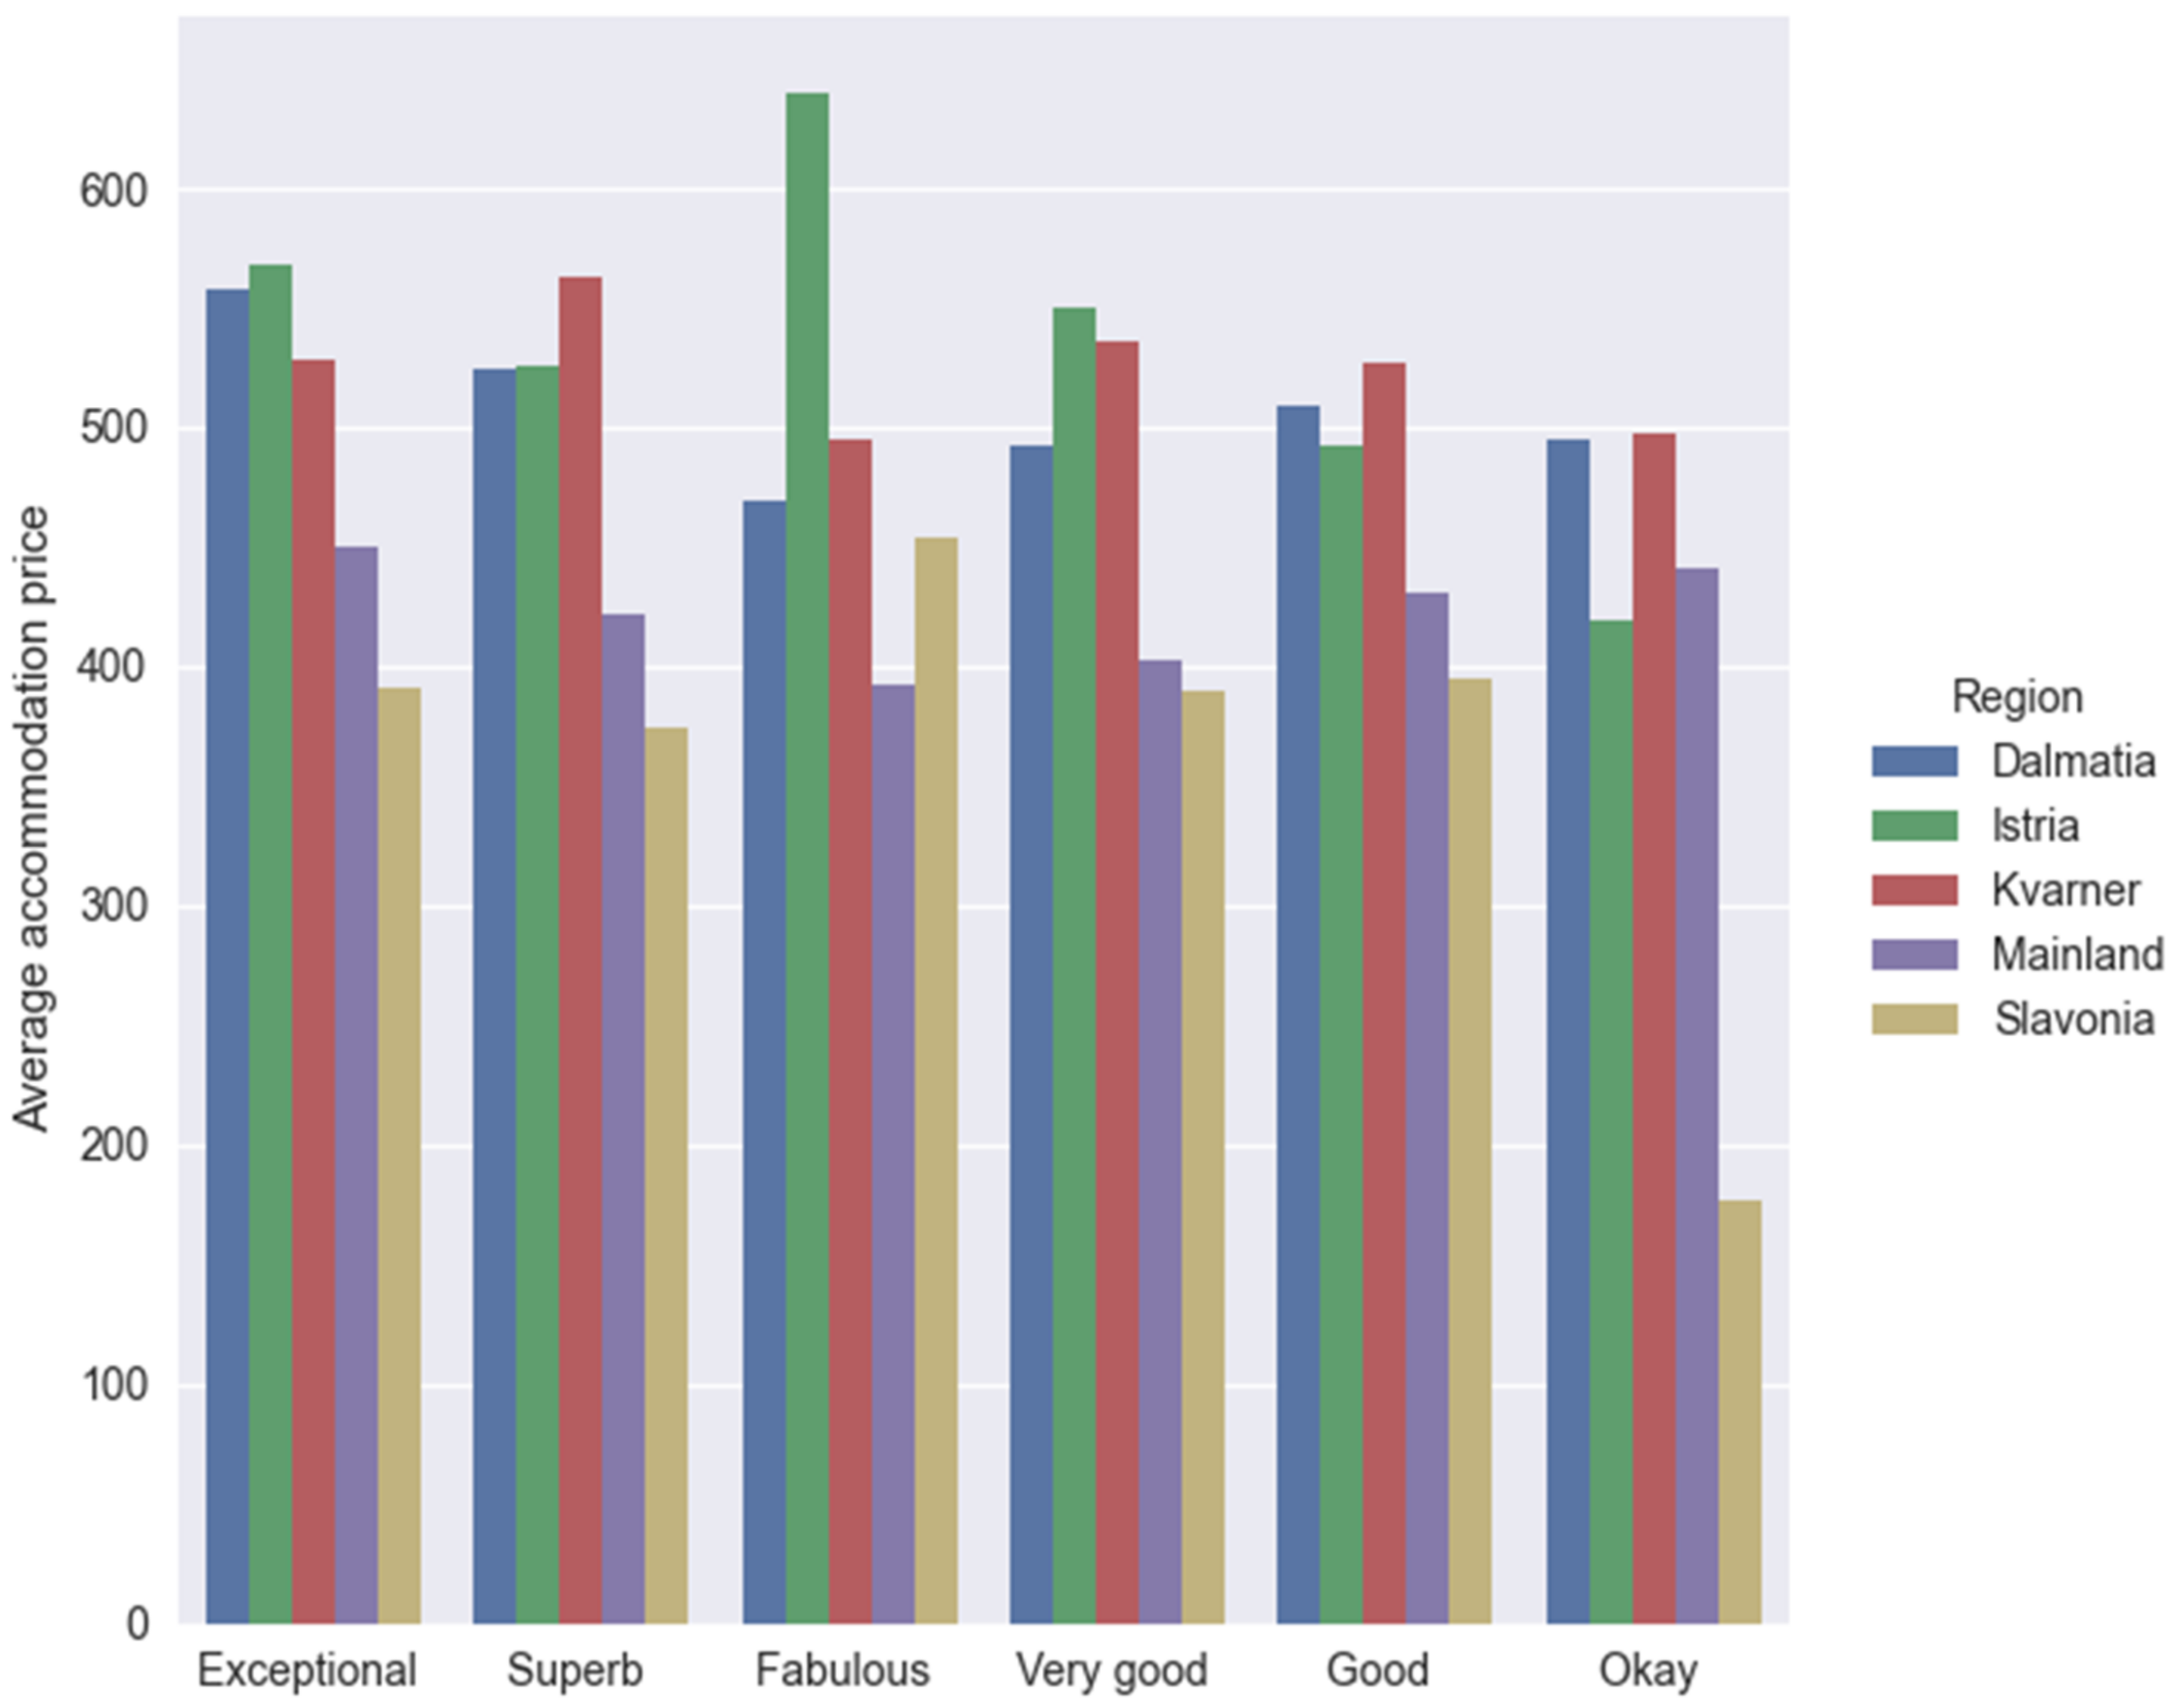
The analysis of average accommodation prices in relation to the region and category of the accommodation (Figure 2) reveals that the region Mainland has the lowest deviations in prices between accommodation categories, as well as the region Kvarner and possibly Dalmatia. In other regions, there is a significant variation in prices between some of the categories. For example, Istria has on average more expensive accommodations of the category Fabulous (the average price of accommodations in that category is above HRK 600 per night whilst all other categories have an average price well below HRK 600). A similar but different pattern can be observed for Slavonia. It has similar average prices for all categories except the category Okay, which is the only category in the region with the average price below HRK 300 or even below HRK 200, to be precise.
Given the overall percentage of categories (Figure 1), the category ratio per region provides insights on what to expect. This sort of analysis is important for determining that the category ratio per region is not unbalanced (e.g., 90% of the category Exceptional belongs to one region and the remaining percentage is dispersed in other regions). Table 3 shows that the distribution of accommodation categories per each region is approximately the same as the distribution on the overall dataset (with a slight exception in the region Slavonia, which has more than 50% of accommodations assigned to the category Exceptional).
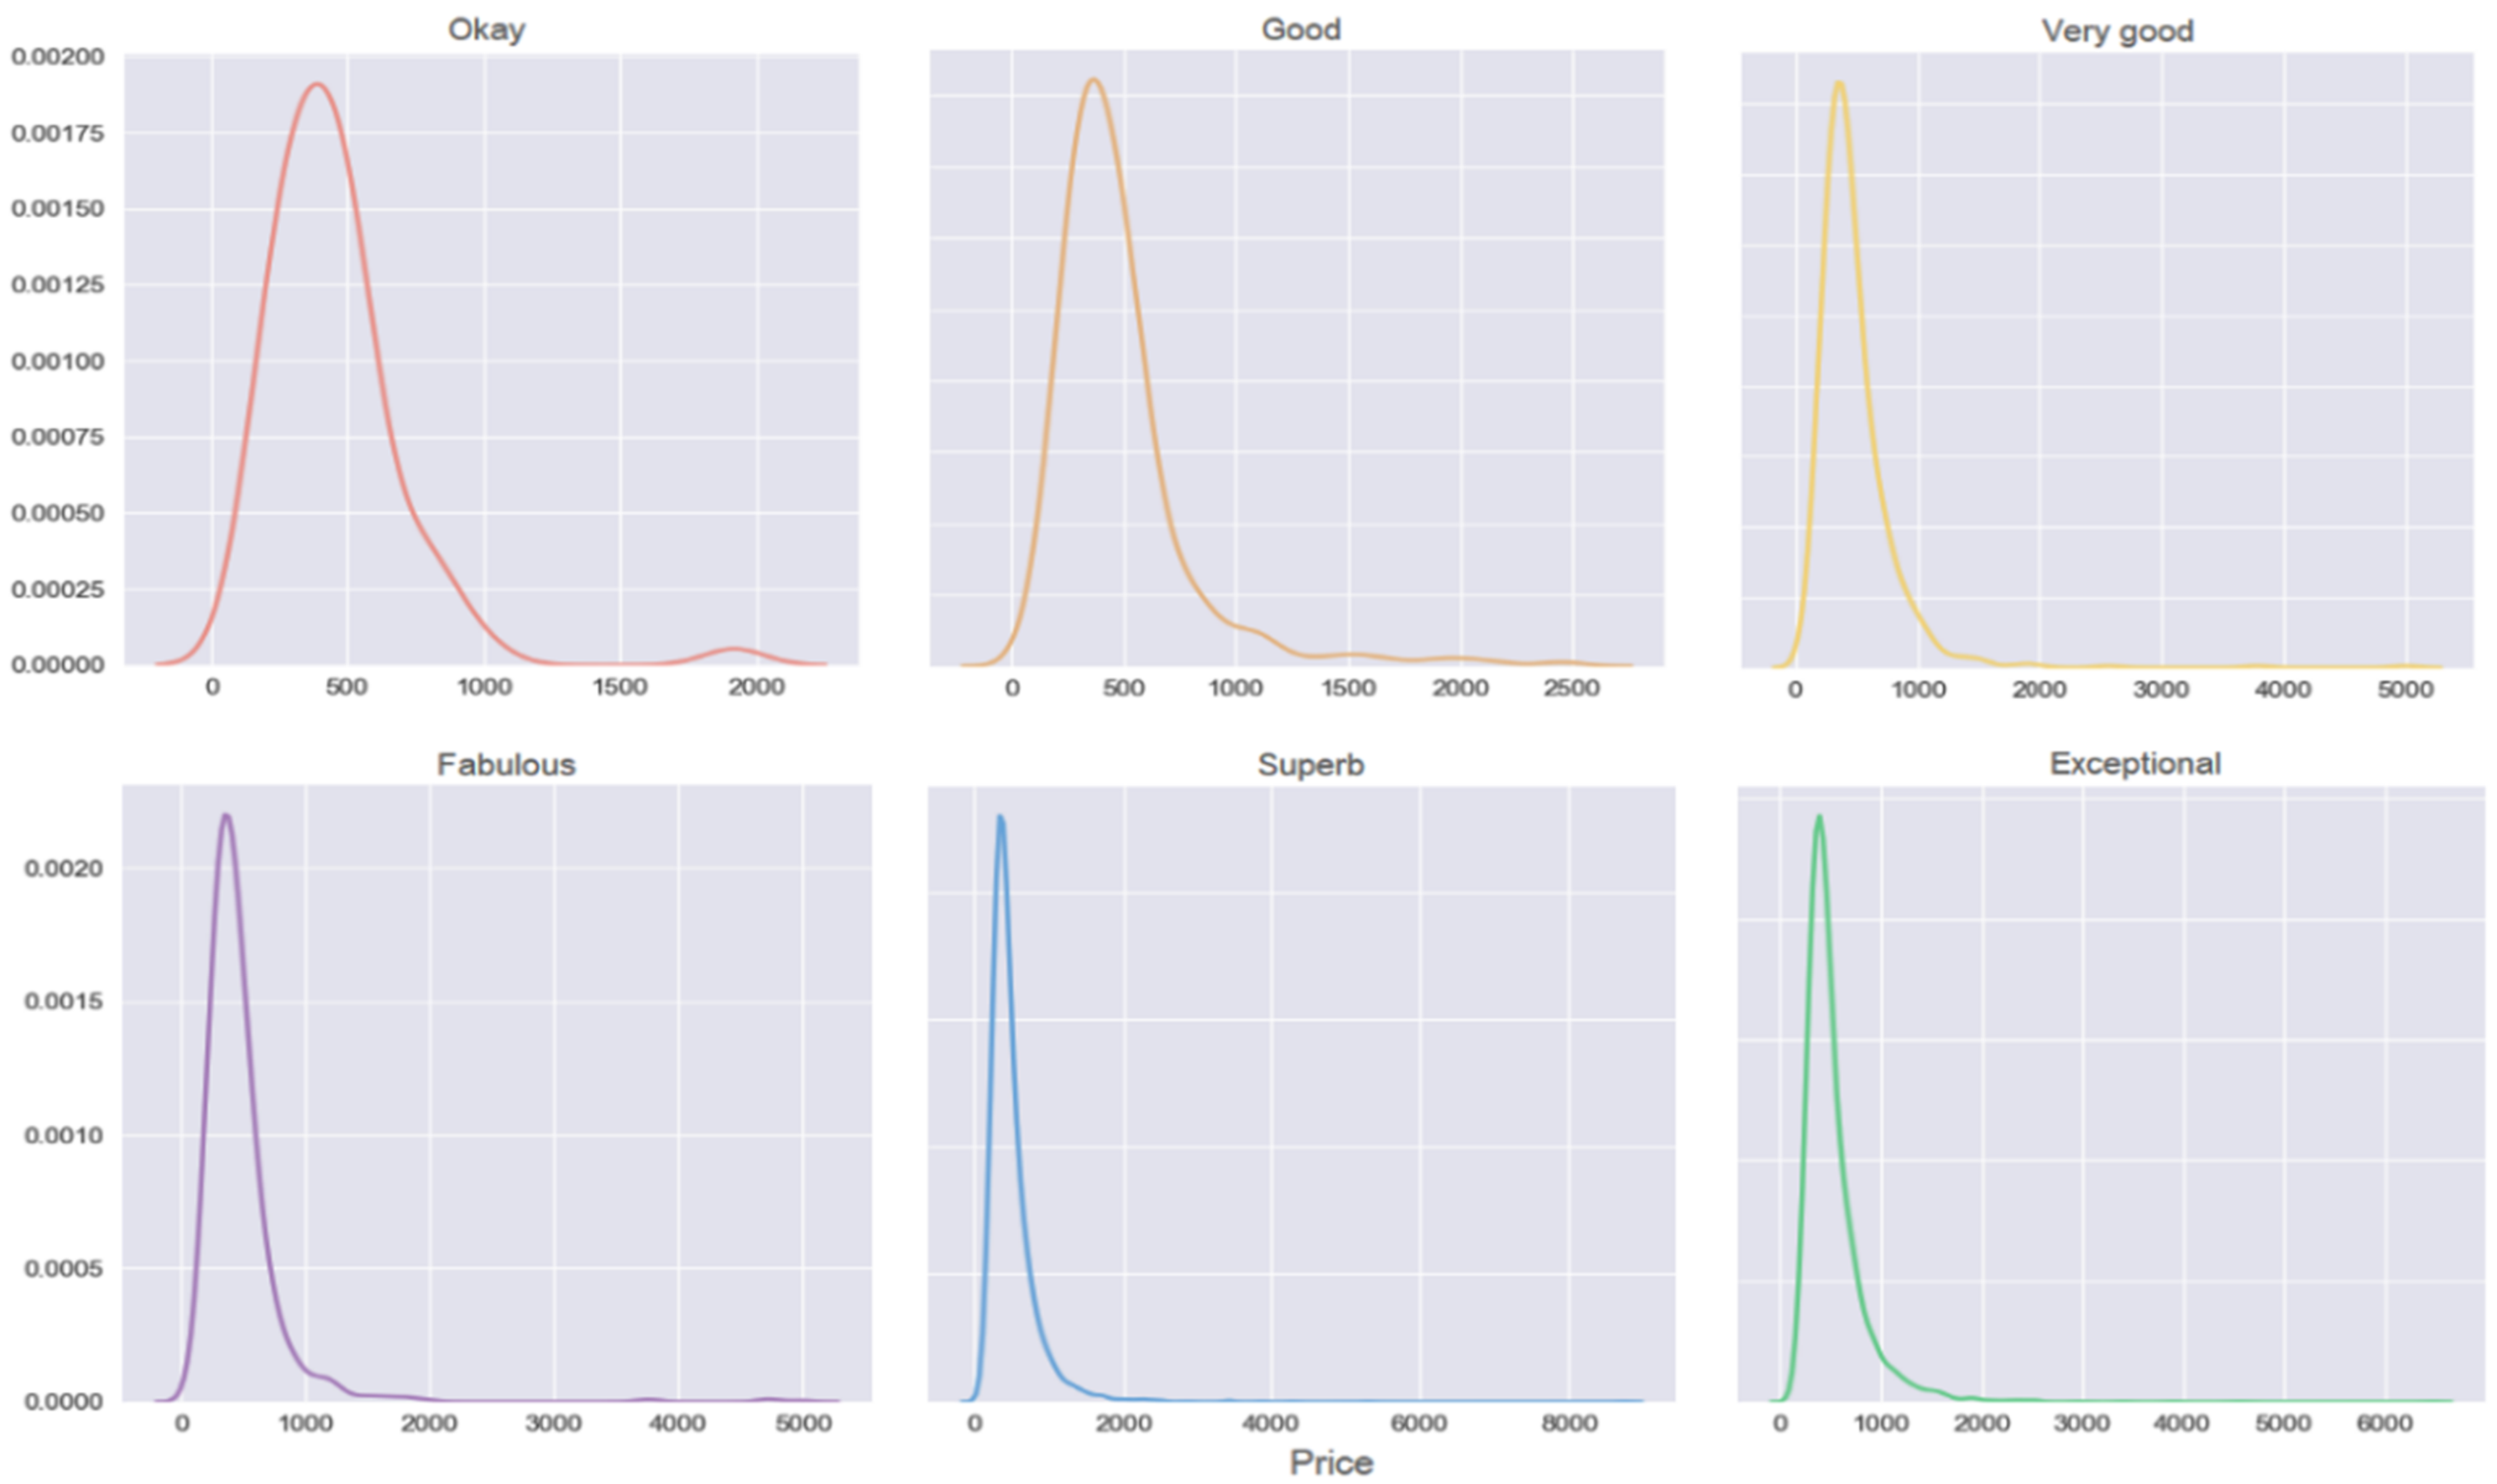
Price distribution per accommodation category is also explored. Given the distribution representation (Figure 3) it is shown that all categories have approximately the same price distribution, which is right skewed, meaning that majority of accommodations associated with a category have an overnight price below HRK 1000, and that a minority of accommodations have an overnight stay cost of HRK 1000 or higher. Outliers (data points with an overnight price above HRK 1000) are further examined.
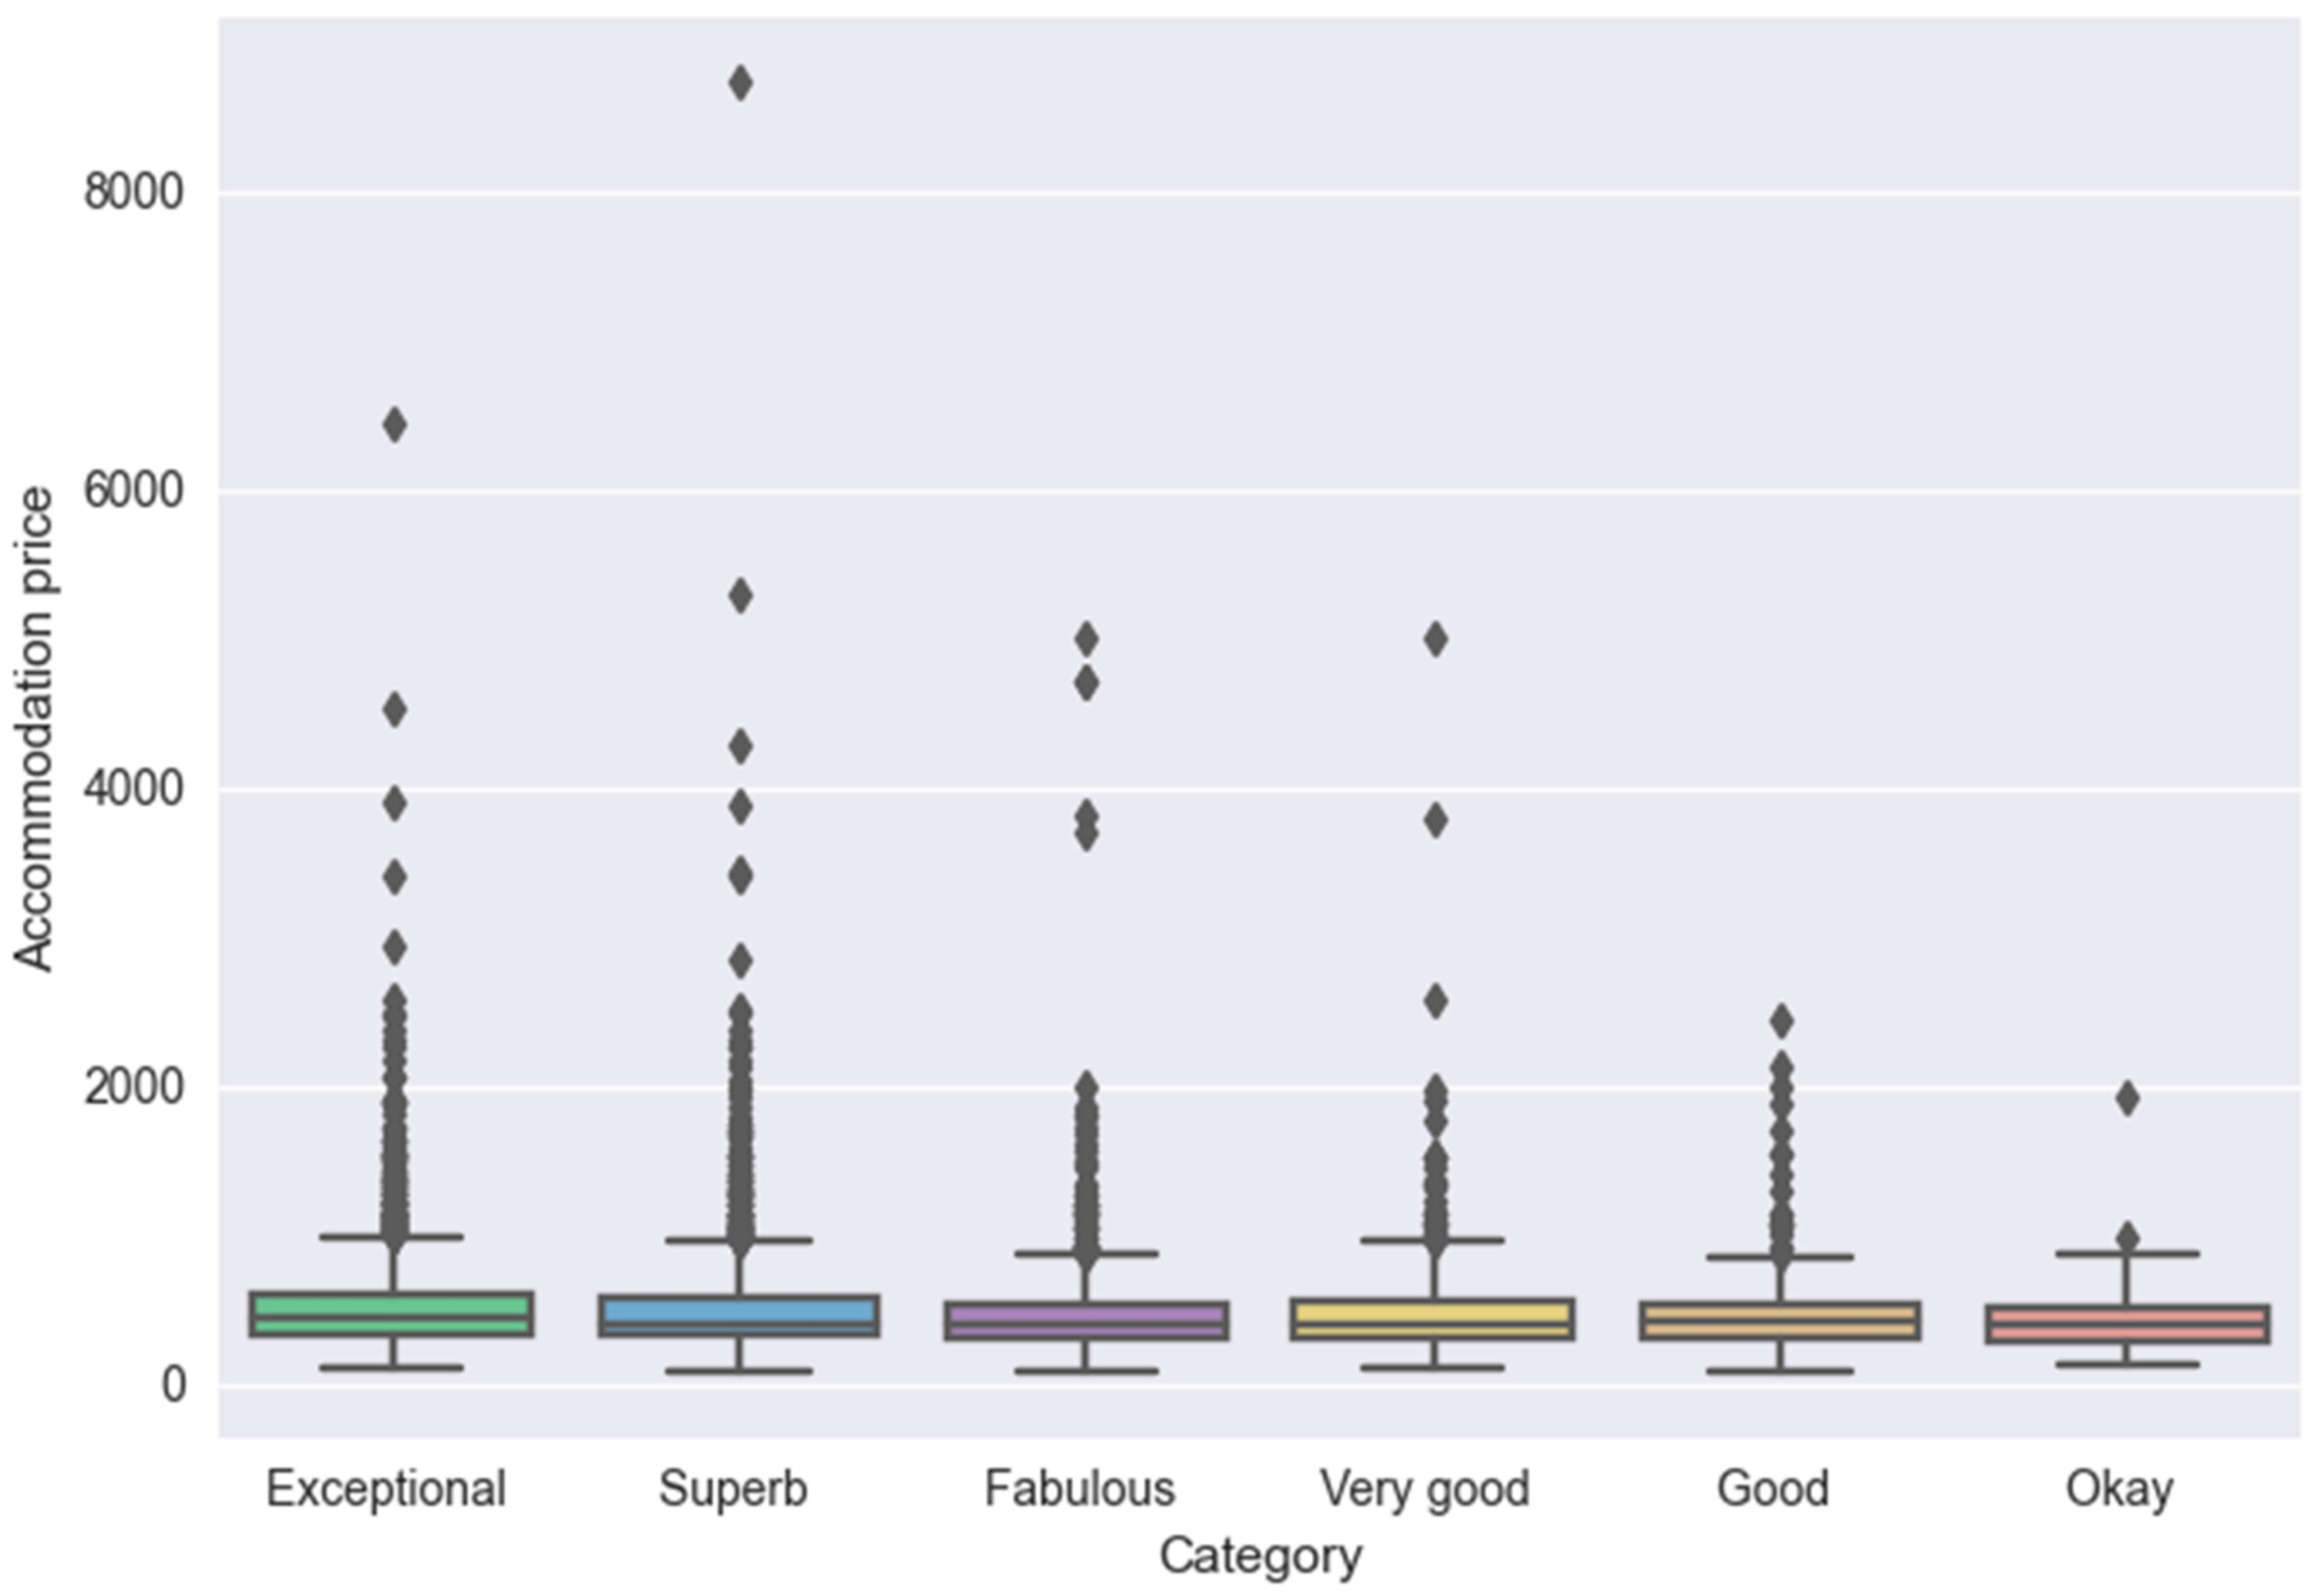
Figure 4 shows the interquartile price range for each accommodation category. The interquartile range (IQR) measures data dispersion. The width of the box represents the IQR, which shows the data points between the 25th (Q1) and 75th (Q3) quartile. The lines (whiskers) represent the data points between the minimum ( Q 1 1.5 ×   IQR ) and the maximum ( Q 3 + 1.5 × IQR ). Data points outside the whiskers (lines) are outliers, which are observations that do not share the same characteristics as the majority of the data in the category distribution (represented by the ‘tail’ in the distributions in Figure 3). In terms of outliers, the categories share similar data characteristics, and the category price distributions differ to a lesser extent for all but the Okay category.
Table 4 shows the percentage of accommodation properties with respect to the accommodation category. This table highlights several interesting facts about accommodation properties regarding the accommodation category:
  • Smoking, House pets and Parties have a higher approval rate in the accommodations with considerably lower ratings (Okay, Good, Very good) although the approval rate difference is more emphasized for Smoking and Parties.
  • Parking and Wi-Fi are widely available across all accommodation categories, even though Wi-Fi availability increases with better ratings.
  • No house rules are related to quiet hours. The percentage represents those accommodations which do not have house rules. It turns out that accommodations with lower ratings often have no house rules and that the percentage progressively decreases with an increase in rating. It means that accommodations with higher ratings are more prone to establish certain house rules that guests are obliged to respect.

5.2. One-Way Analysis of Variance (ANOVA) and Variable Correlation

ANOVA is a variance analysis method that is used to determine statistical differences in group means between three or more independent groups [20]. In this study, it is used to check differences in review means between region groups. Variability is measured as follows:
F = M S T M S E ,
M S T = i = 1 k T i 2 n i G 2 n k 1 ,
M S E = i = 1 k j = 1 n i Y i j 2 i = 1 k T i 2 n i n k ,
where F is the variance, Mean Square of Treatments (MST) is the mean square between two groups, and MSE is the mean square within groups (residual mean square). T represents the group total, n i the size of the group i, G a grand total of all observations, n the total number of observations, and Y i j stands for an observation. To summarize, this analysis measures two sources of data variance and compares their relative sizes. Two sources refer to the variance between groups (difference between the mean of a specific group and the overall mean of all groups) and the variance within groups (difference between a single value inside a group and the mean of that specific group. The following two hypotheses are examined:
H0: 
(null hypothesis) = the difference in means is not statistically significant.
H1: 
(alternative hypothesis) = the difference in means is statistically significant.
F measure: the ratio of variance between categories and within categories. High value of F provides evidence against H0 hypothesis because it indicates that the difference between groups is greater than the difference within groups. As is evident from Table 5, F value equals to 14.07 (which is considered as high variance) so the p value is checked to ensure that the null hypothesis can be rejected.
p value (value of probability): small p value, beside high F measure, proves that there is enough evidence for rejecting the null hypothesis, i.e., the differences between group means are statistically significant. Since p value equals to 1.99· e 11 , which is a low p value (every p value lower than 0.05 indicates statistical significance), the result is statistically significant.
One of the disadvantages of the ANOVA test is that it does not indicate groups between which the statistical difference exists. To overcome this issue, the Tukey HSD post hoc test can be applied. It shows the statistical difference between every pair of groups used in the ANOVA test.
Table 6 shows the results of the Tukey HSD test. Each row shows the compared groups, difference between the group means, p value, and whether the null hypothesis should be rejected or approved. It can be asserted that statistically significant difference between means of the groups exists for the following group pairs:
  • Mainland and Dalmatia (p value of 0.001)
  • Mainland and Istria (p value of 0.001)
  • Mainland and Kvarner (p value of 0.001)
  • Dalmatia and Slavonia (p value of 0.001)
  • Istria and Slavonia (p value of 0.001)
  • Kvarner and Slavonia (p value of 0.001)
Taking a closer look at a specific group such as Mainland reveals that it is statistically different from all regions except Slavonia, which is actually its neighboring region. Likewise, Dalmatia and Slavonia, which are geographically far apart, also prove to be statistically different. More precisely, all regions that prove to be significantly different are located far apart from one another, whilst the regions that are not significantly different (e.g., Istria and Kvarner, Dalmatia and Kvarner) are neighbors in terms of geographical location.
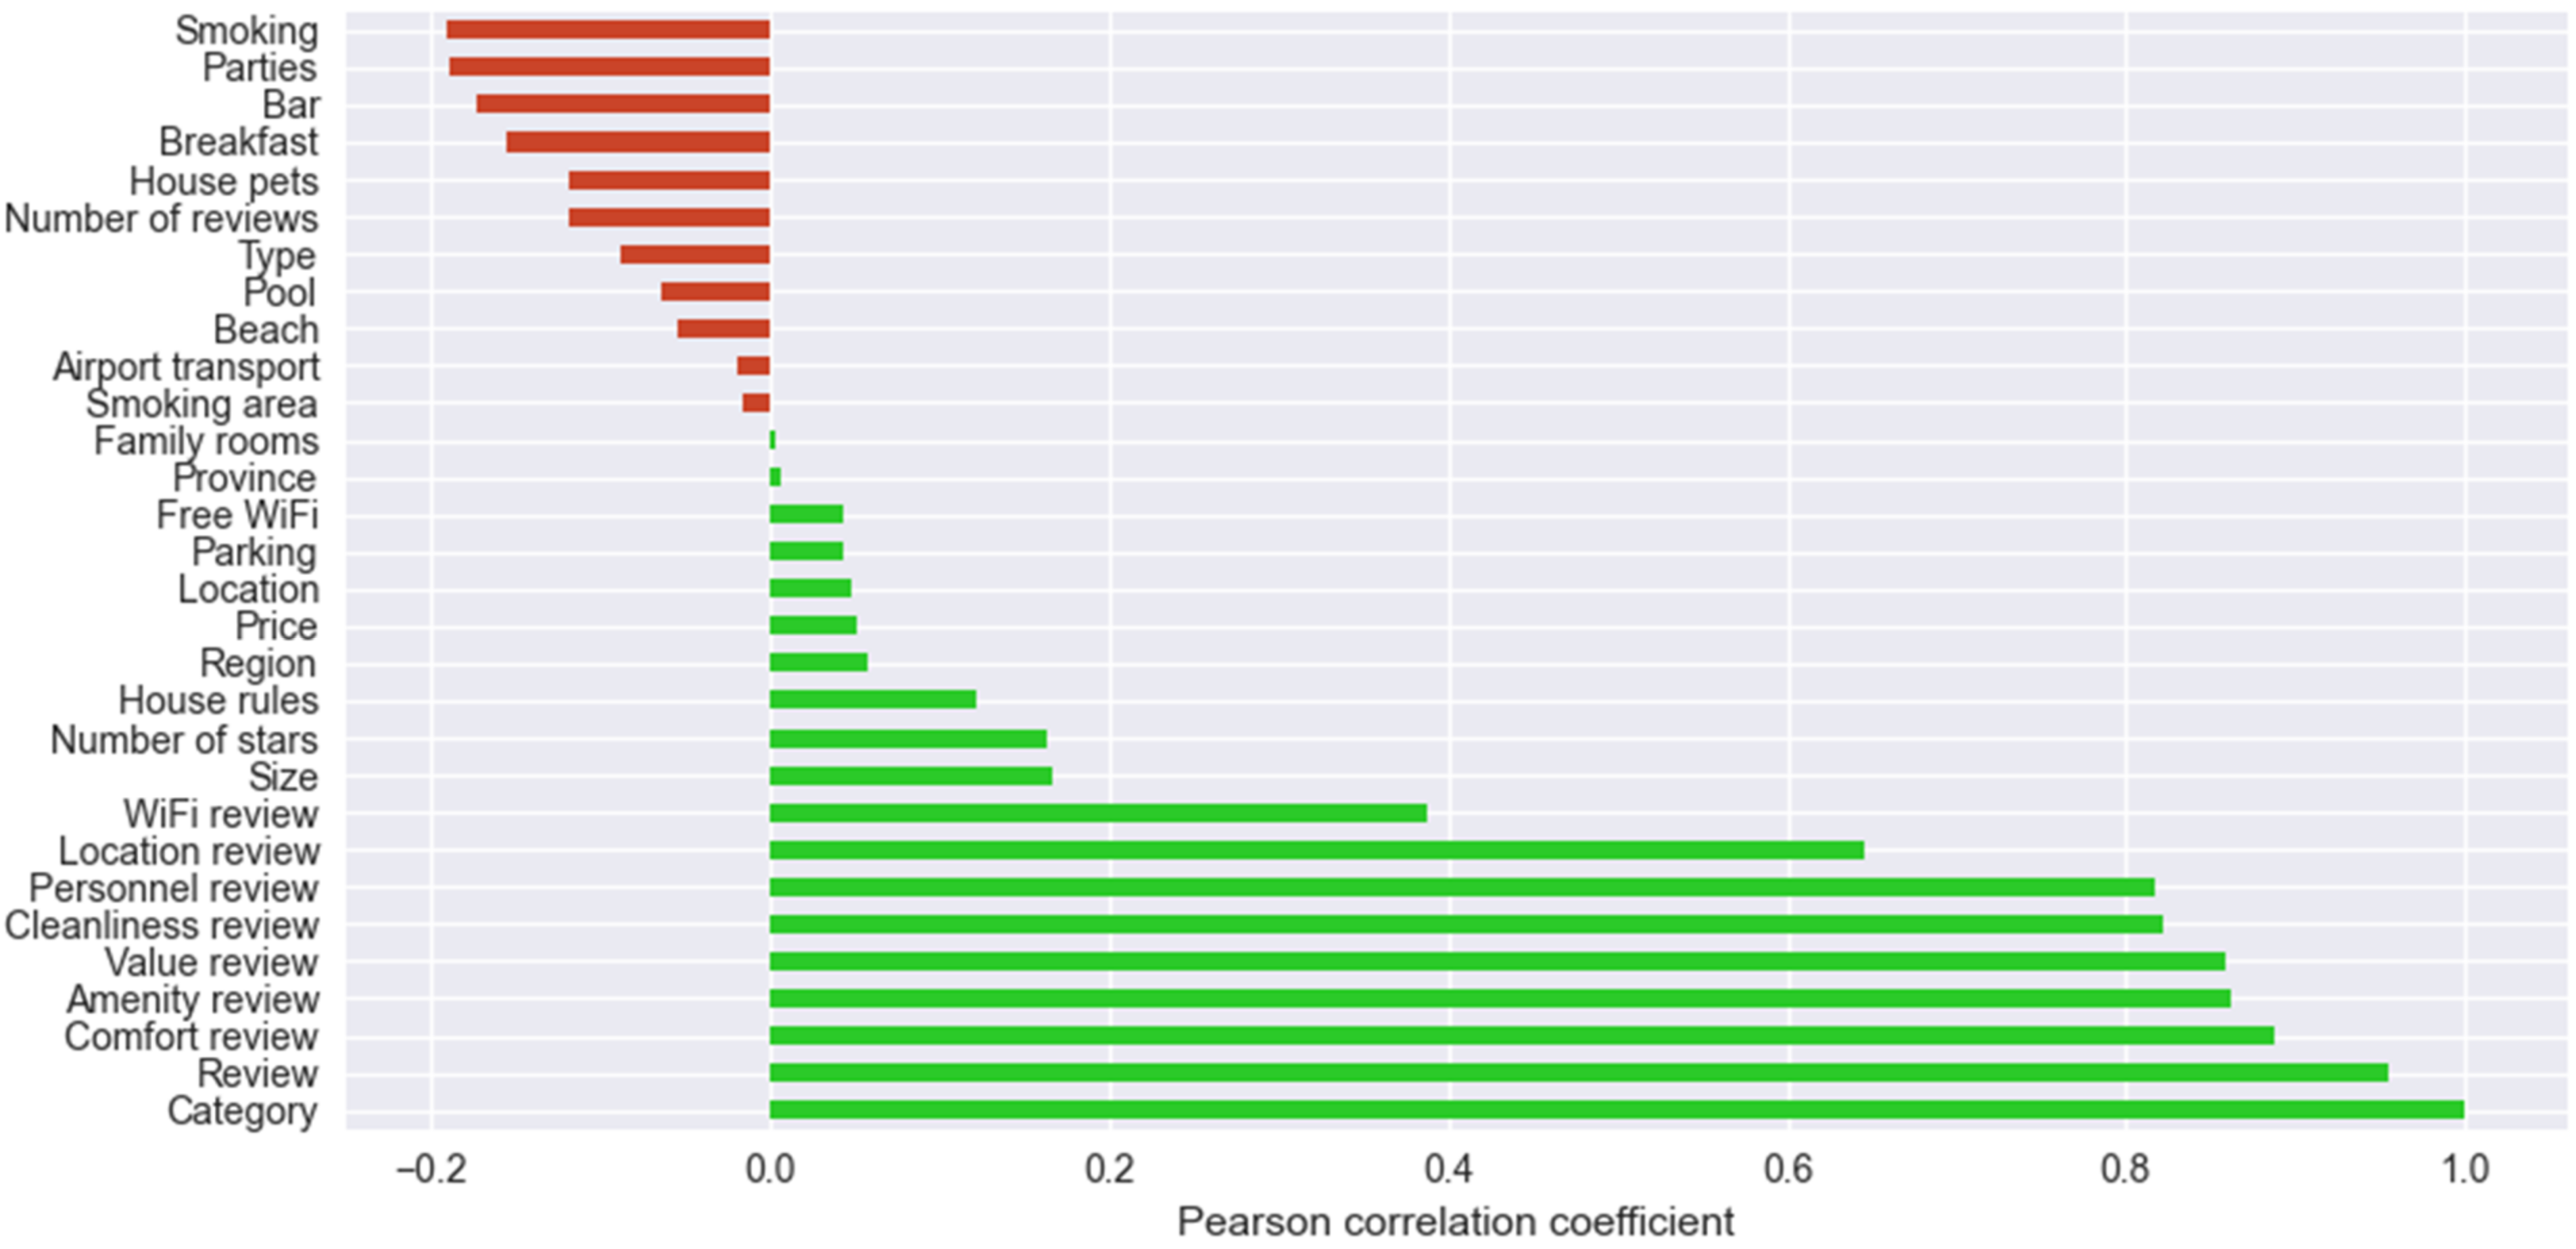
In order to define the subset of parameters (accommodation factors) to be used in the model training, the correlation analysis is conducted on all accommodation factors and their relationship with the accommodation category is explored (Figure 5). The highest correlation in relation to the accommodation category expectedly belongs to the guest review (the accommodation category is based on the review score). The review factor is therefore discarded from the dataset. Furthermore, high correlations (above 0.6, which is a strong linear relationship) are detected for certain accommodation properties (personnel, hotel facilities, cleanliness, comfort, value, location, and internet), the highest being for comfort and the lowest for location.
Additionally, a verification is performed in order to determine whether the accommodation review is simply a mean of more specific reviews (in regard to the high correlation coefficient). Since the results do not overlap, i.e., the review does not match the mean, it can be concluded that the accommodation category is associated with the accommodation regardless of the reviews for accommodation properties (but they imply that higher or lower reviews for certain properties, such as accommodation comfort, have some kind of influence on the overall accommodation category, and that, e.g., comfort or cleanliness of the accommodation have greater influence on the final accommodation category than its location or Wi-Fi availability).

5.3. Guest Review Analysis

Complementary to the accommodation factors, scraping is performed for guest reviews in Croatian and English. Due to differences in the methods and tools available for the two languages, the obtained data are analyzed separately for each language. The reviews for each accommodation unit are shown separately and can be reached by following appropriate hyperlinks. Since the original dataset is imbalanced, reviews of the same number of accommodations are taken into account for each class. That number is based on the category with the smallest number of accommodations. The aim of this filtering procedure is to reduce the original imbalance (all categories have a final count of review sets equal to 68, which is the number of accommodations belonging to the category Okay). The number of individual reviews fetched within each review set varies and depends solely on the accommodation. After scraping, two separate datasets for English and Croatian reviews are collected, each containing the attributes numerical grade, title, and text.
In order to extract important information, data cleaning is performed prior to the review analysis. Lowercasing and stop words removal (e.g., “the”, “a”, “is” or “and”) is performed first. Next, Part of Speech (POS) tagging is conducted and all nouns are extracted. Finally, lemmatization is performed in order to remove inflectional endings and return the base forms of nouns (lemmas) [21]. The description of the dataset is given in Table 7. The English and Croatian review datasets have 10,361 and 3857 observations, respectively.

5.3.1. Word Frequency Analysis

Unigram and bigram analysis is conducted in order to analyze words that are most frequently used in reviews with respect to the accommodation category [22].
Table 8 shows the results of the bigram word frequency analysis for English guest reviews. Approximately the same bigrams appear across all accommodation categories (“city-center”, “value-money”, “location-hotel”, etc.) but they have a rather different order of appearance (bigrams are presented in a descending order by the frequency count and the top ten bigrams are extracted). For example, unlike the other categories, the bigram “value-money” does not appear in the most frequently used bigrams for the category Okay. Additionally, the bigram “staff-stay” (accommodation personnel) is among the most frequently used bigrams across all categories, though it is differently ordered.
Table 9 presents the results of the bigram word frequency analysis for Croatian guest reviews. In Croatian guest reviews, similarly to English reviews, approximately the same bigrams appear in the same accommodation categories, though they are differently ordered (e.g., regarding the category Okay, guests mostly refer to the accommodation location and personnel; regarding categories with higher ratings, such as Superb and Exceptional, guests mostly refer to the proximity of the accommodation to the city center, given value for money, and also peace and quiet inside the accommodation).
Accommodation location is found across all categories, though in some categories it is the most frequently used of all other accommodation properties, while in others it only appears after personnel, parking, and peace and quiet. This indicates that comfort has the highest importance in certain categories. Evidence that comfort has a high influence on the accommodation category can also be found in Figure 5, which shows that accommodation comfort review (of all guest reviews) has the largest influence on the accommodation category.
With respect to the accommodation category, the most frequent words in guest reviews do not differ much (Table 10). Similar words are used throughout the reviews (such as personnel, location, view, city, etc.) with a few exceptions (kindness in the category Exceptional in English reviews, pool in the category Fabulous in English reviews, etc.) and a slightly different ordering (e.g., according to the guest reviews, the most important aspects of the accommodation in the category Okay are location, room, view, and breakfast, while words related to the kindness of the host and rest in the accommodation start to appear in the top ten frequent words in the categories with higher ratings (Fabulous, Superb and Exceptional), beside the accommodation location and personnel).

5.3.2. Jaccard Index

The Jaccard index represents a measure of similarity between texts based on tokens (words). It is calculated as the division between the number of common words between texts and the overall total of unique words [23]. The equation for the index calculation is given as follows:
J A ,   B = A     B A     B = A     B A + B A     B ,
where A and B represent two different sets of text, A     B is the intersection of words between the sets (common words), and A     B is the union of unique words in the two sets. The value of the Jaccard index ranges from 0 to 1. The closer the value is to one, the more similar the texts are.
The Jaccard index for each pair of accommodation categories for English reviews can be seen in Table 11. The largest similarity between guest reviews is found for the categories with lower ratings (beside Fabulous, it is found for Okay, Good, and Very good), with the lowest index being 0.89 (which is considered really high). Categories Superb and Exceptional differ the most from the other four categories. Moreover, the content of the Exceptional category differs greatly from the first four categories (the Jaccard index of approximately 0.2). Even though it is still small, the category Superb has greater similarity to the other four categories (Jaccard index of approximately 0.5).
The Jaccard index for each pair of accommodation categories for Croatia is given in Table 12. The table differs greatly from Table 11. Guest reviews for the category Fabulous have the smallest similarity with other categories of guest reviews, while the category Okay has the largest similarity to the other accommodation categories (followed by the category Superb).

5.4. Naïve Bayes Classification Based on Guest Reviews

The Multinomial Naïve Bayes algorithm is trained separately for English and Croatian guest reviews. Since verbs and adjectives proved to have high predictive potential, they are used along with nouns for predicting accommodation categories.
Prior to training, the BOW approach is applied in order to extract text properties [8], and the dataset is split into the training set, which comprises 70% of the dataset (7252 observations and 8981 variables for the English dataset, and 2.699 observations and 2.000 variables for Croatian—a variable/feature is a word extracted using the BOW vectorizer), and the test set which comprises 30% of the original dataset (3.109 observations for the English dataset, and 1158 for Croatian).
Furthermore, the SMOTE procedure is applied for balancing the observation ratios between categories. Since the oversampling method is used on the training sets, the samples increase in size, hence the English training dataset has a total of 26,412 observations while the Croatian training dataset has a total of 10,242 observations. Each category takes an equal proportion of the training set (16,667%), thus there are 4402 observations for each category in the English dataset and 1707 observations for each category in the Croatian dataset. The algorithms are hence trained on the oversampled and thus balanced training sets and tested on the imbalanced datasets.
Table 13 and Table 14 show the results of the Multinomial Naïve Bayes models based on English and Croatian guest reviews. The tables report the following:
  • Model precision—the ratio between true positive cases (the number of correctly predicted cases) and the overall number of predicted cases for a specific category (regardless of whether they are true or false positives). The models achieve the greatest precision on the category Exceptional. The precision approaches approximately 80% for English and 90% for Croatian reviews, meaning that 20% and 10% of forementioned reviews are false positives.
  • Model recall—the ratio of correctly predicted cases of a specific category and the overall total number of cases of that specific category. Models have a recall of about 90% for the category Exceptional, meaning that the models correctly predict 90% of the Exceptional category cases.
  • F1 score—the ratio of precision and recall. F1 score is calculated based on the following equation:
F 1 = 2 × P r e c i s i o n × R e c a l l P r e c i s i o n + R e c a l l .
4.
Support—the number of observations in a specific category inside the test set. These numbers are imbalanced since the SMOTE procedure is applied only to the training set to ensure the model is trained on the same number of observations per class (in order to learn patterns for all classes).
The overall model accuracy for the English model (based on all observations in the test set, irrelevant of the accommodation category) equals to 0.7125 (approximately 71%). Hyperparameter optimization is performed by changing one parameter value (alpha) while keeping all other parameters fixed for testing. It is found that the default option is the most optimal one (Table 15).
Table 16 represents a confusion matrix for the Multinomial Naïve Bayes model of English reviews. This type of visualization is used for presenting correct and incorrect classifications. The rows represent actual categories and columns represent the categories predicted by the model. The intersections represent percentages of overlap between the real and predicted categories. For example, the model incorrectly predicted 1% of the category Superb as Okay, 6% as Good, 3% as Very Good, 3% as Fabulous, and 35% as Exceptional, concluding that the model correctly predicted 52% of the observations of the Superb category. The diagonal represents correct predictions per category. The results indicate that the model predicts Exceptional with the highest accuracy (85%) and Fabulous with the lowest accuracy (33%).
Similarly, the algorithm is trained and tested on Croatian guest reviews in order to compare the accuracy on the two datasets. Hyperparameter optimization slightly improved the initial model accuracy, which ended up at 79% (Table 17).
Table 18 represents a confusion matrix for the Multinomial Naïve Bayes model of Croatian reviews. In line with the overall accuracy results, the accuracy rate is higher in several categories when compared with the results obtained on English guest reviews—Okay is 19% higher, Fabulous 43%, Superb 16%, and Exceptional 5%. In the remaining two categories (Good and Very good), the accuracy rate is 7% and 19% lower, respectively.

5.5. Classification Based on Accommodation Factors

All accommodation factors with the absolute value of the correlation coefficient above 0.15 are selected for model training and appropriately preprocessed (SMOTE requires encoding textual values in a numerical form). Prior to applying SMOTE, the dataset size equals to 6133 observations and 14 variables, out of which 4293 are used for training and 1840 for testing (the same splitting procedure is applied as for the guest review datasets).
The final dataset (after SMOTE application) used for model training consists of 9654 accommodations, out of which every category has 1609 accommodations (observations) and the following 14 accommodation factors—guest reviews for comfort, accommodation value, accommodation facilities, cleanliness, personnel, location and internet, accommodation size, number of stars, variables based on accommodation properties (whether the accommodation provides breakfast, whether it has a bar, room for smokers, and whether it allows parties) (Table 19).
The initial Decision Tree (DT) model consists of 655 nodes and 328 leaves with an accuracy of 79%. After excluding variables with low feature importance and after conducting hyperparameter tuning (the parameter of tree maximum depth was changed from None to 10) (Table 20), the model accuracy equals 82%. The results per category are presented in Table 21. The confusion matrix (Table 22) reveals that the model is slightly prone to misclassify categories with lower ratings, Okay and Good, into their neighboring categories (35% of the category Okay is misclassified as Good, and 22% of the category Good is misclassified as Very good). Categories with higher ratings are predicted with accuracy above 75%.
In the Random Forest (RF) model several parameters are changed—the number of estimators (the number of decision trees changed from 100 to 150), criterion (function for measuring the quality of branching changed from Gini to entropy), maximum depth of trees is changed from None to 20, maximum features parameter (number of predictors used for data splitting) is changed from auto to 3 and OOB score parameter (which instructs to use or not to use out-of-bag samples to estimate the generalization score) is changed from False to True (Table 20). Accuracy after parameter tuning equals to 87.5%. The results per category are presented in Table 23.
According to the confusion matrix (Table 24), and in comparison to the DT model, the RF model has higher accuracy in every category except Fabulous, for which the accuracy rate is 1% lower. Like the DT model, the RF model is also slightly prone to misclassify categories with lower ratings into their neighboring categories (misclassification rate ranging from 13 to 30%) but its overall precision and recall (Table 23) are much higher than those of the DT model (Table 21).
The initial Support Vector Machine (SVM) model has an accuracy of 73%. The parameter optimization procedure results in changing the values of two parameters—the kernel parameter (type of kernel used in the algorithm) is changed from rbf (Radial Basis Function) to linear since rbf kernel is more appropriate when the data are not linearly correlated and the break ties parameter is changed from false to true (if true, it breaks ties for predictions according to the confidence values of the decision function) (Table 20). After parameter optimization, the accuracy equals 90%. The results are given in Table 25. The confusion matrix (Table 26) shows that the SVM model has the best overall accuracy, predicting each category correctly in approximately 80% of the cases or above, except the category Okay which is correctly classified in 70% of cases. The RF model performs better on accommodations with considerably low ratings (Okay and Good), while the SVM model performs the best on accommodations with considerably higher rating (Superb and Exceptional).
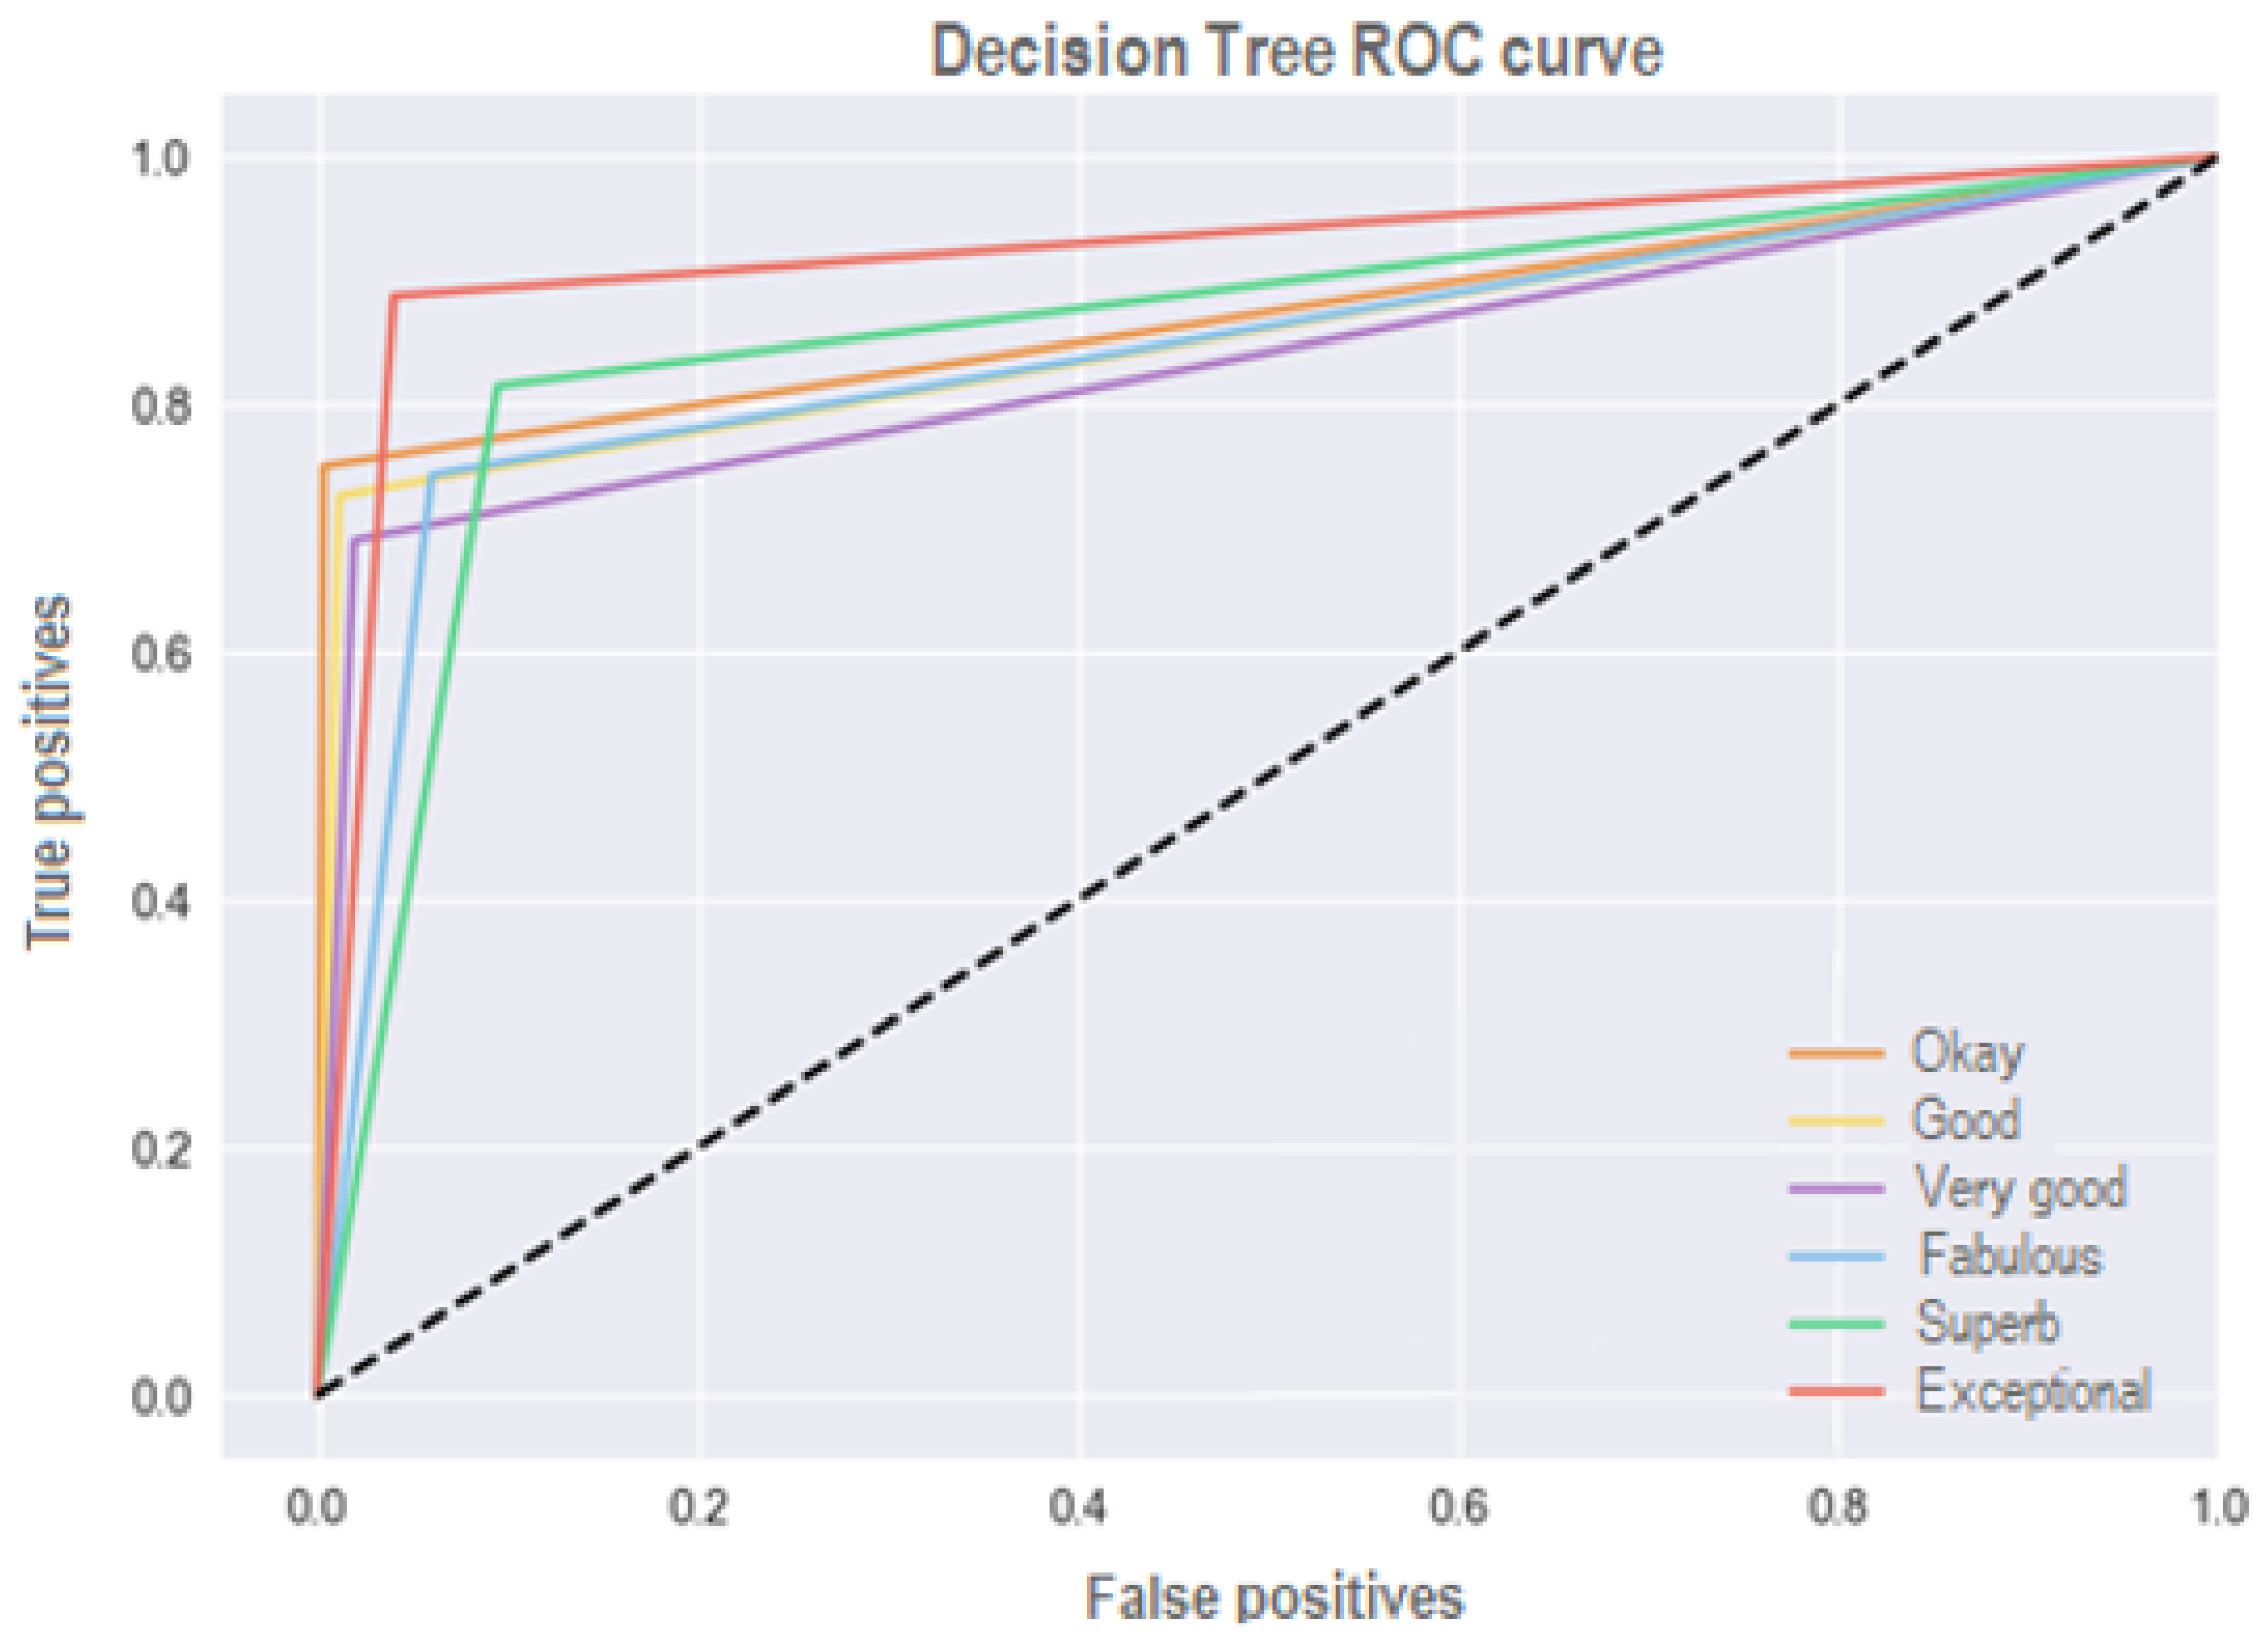
The Receiver Operating Characteristic (ROC) curve is used in order to visualize the ratio of true and false positive observations [10]. The ROC curve visualization represents the accuracy of the test, i.e., the closer the category to the upper left corner, the more accurate the test. Test accuracy, in this case, is commonly referred to as area under the curve (AUC), i.e., the bigger the area under the curve, the more accurate the model is in predicting the specific category. If a model follows the diagonal line of the test it means that it has an equal probability of guessing the category, like a random coin toss.
The DT model has the largest AUC for the category Exceptional (0.92), followed by Okay (0.87), Good and Superb (0.86) and, lastly, Very good and Fabulous (0.84) (Figure 6).
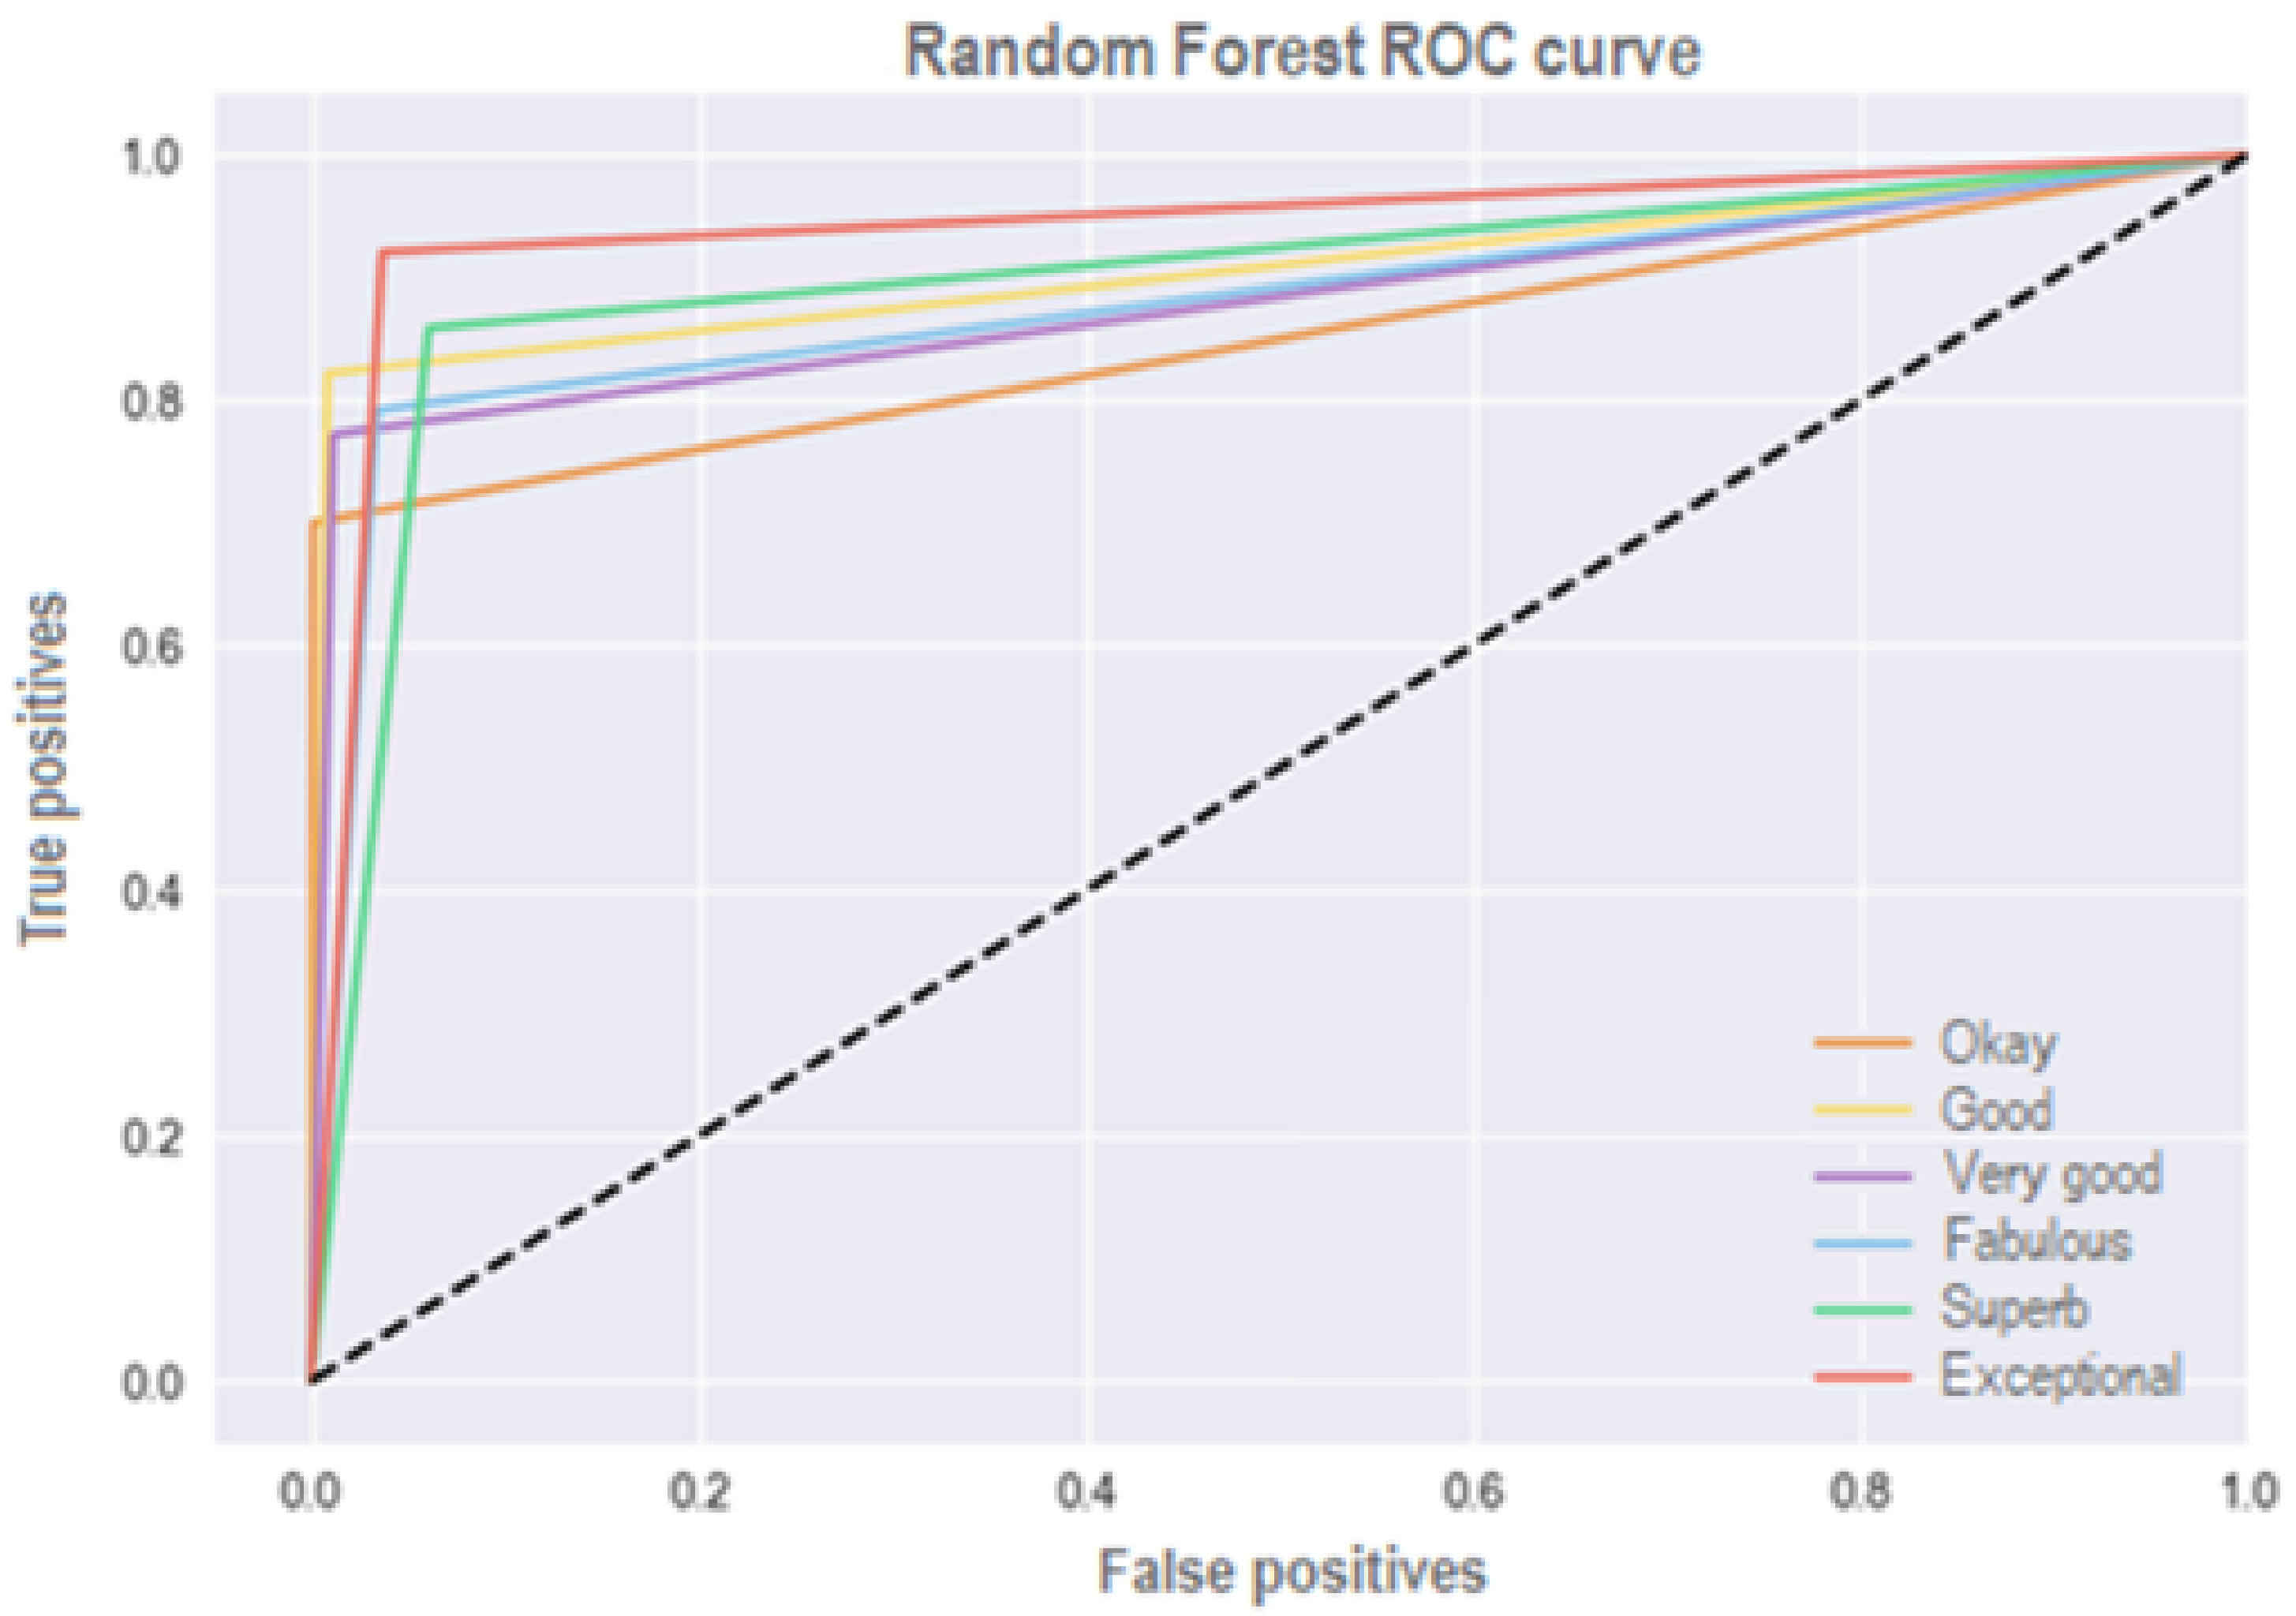
The RF model has the largest AUC for the category Exceptional (0.94), followed by Good (0.91), Superb (0.90), Very good and Fabulous (0.88) and, lastly, Okay with the lowest AUC (0.85) (Figure 7).
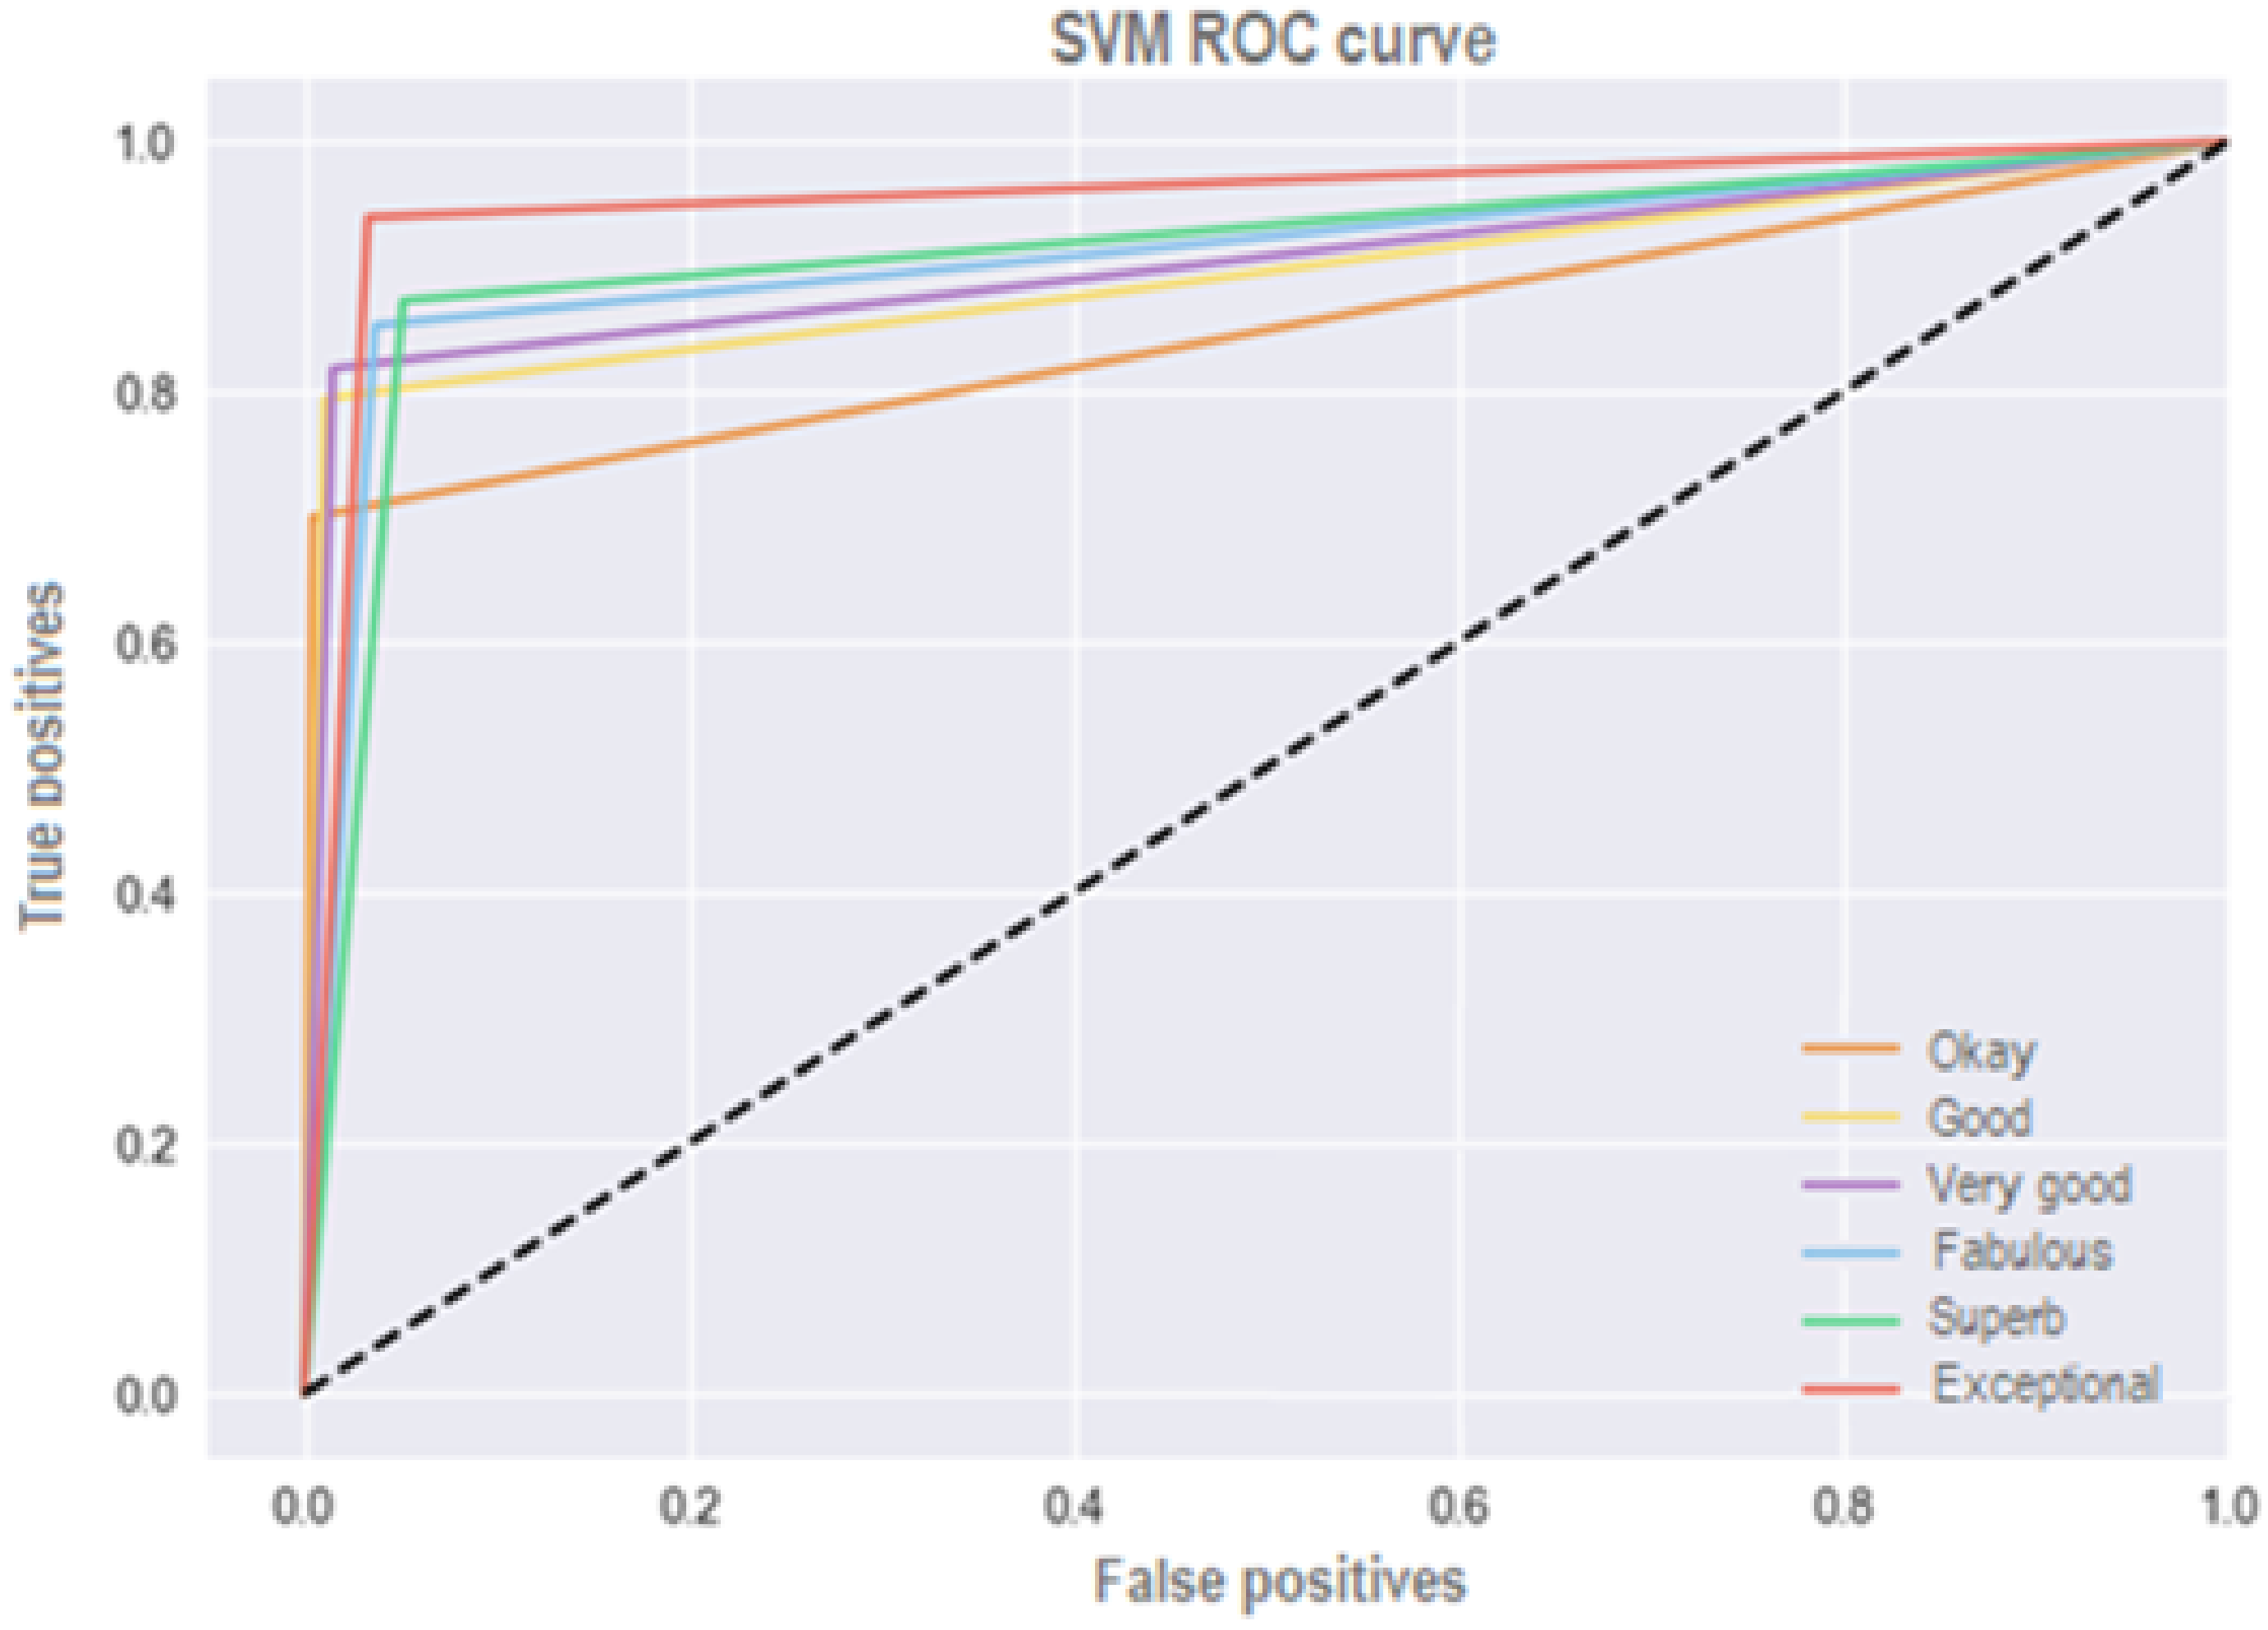
ROC curve for the SVM model (Figure 8) somewhat resembles that of the RF model. Both have the largest AUC for categories with higher ratings, while the DT model has largest AUC for the category Okay. The final rank list is created by summing up all AUC scores separately for each model and dividing it by the number of categories. In that way an average AUC for each model is obtained (Table 27).
The RF model has higher precision and recall (including the F1 score) in the categories with lower ratings (Okay, Good and Very good), while the SVM model outperforms the DT and RF model in the categories with higher ratings (Table 28). The DT model outperforms the other two models by the AUC statistic for the category Okay even though not by much (2% difference).

6. Conclusions and Future Work

Accommodation factors such as satisfaction with the comfort, value, cleanliness, and similar have the greatest influence on the guest satisfaction, unlike more general factors such as region or county, price, permission for parties, and others that do not have a direct connection to the accommodation category (and review).
The obtained result is confirmed through the analysis of guest reviews. Reviews of accommodations with higher ratings have proven that guests refer more to accommodation comfort and properties such as a friendly host, peace and quiet, and value for given money. More generally (in overall reviews), guests refer to the location in terms of how close the accommodation is to the city center or bus station, the kindness of the personnel, and also the accommodation room and available breakfast.
This study shows that machine learning algorithms can be used to predict guest satisfaction based on specific accommodation properties (such as personnel, cleanliness, comfort, etc.) beside the more general accommodation size, type, and the number of stars. The highest precision and AUC (the largest percentage of correctly predicted categories) are obtained by the SVM model, which successfully predicts 90% of the accommodation categories.
One of the constraints of this study is related to the web page limit of 1000 search results (by dividing the search results by counties, 8444 accommodations are collected from a total of over 70,000 available). Another constraint is the overall processing power of the computer used for the study (Lenovo L430, 298 HDD, 8 GB RAM, Intel Core 2.50 Gz), which has proven weak during the execution of certain requests (e.g., the grid search for hyperparameter optimization was canceled due to long execution, Google API was unable to translate reviews from foreign languages such as German or Chinese to English or Croatian due to request overload).
In future work, a larger volume of data should be obtained, and requests should be executed over a cloud platform or a virtual machine which has greater computational power than a laptop. Since this research is limited with respect to the location (Croatia) and the web source (Booking.com), future work should include reviews and accommodations from a broader perspective in terms of both location (comparing customer satisfaction in adjacent countries or Europe as a whole) and web sources (instead of using only Booking, other platforms such as Trivago, Airbnb, or TripAdvisor could be used in order to expand the research).

Author Contributions

Conceptualization, N.Č. and M.M.; data curation, N.Č.; Formal analysis, N.Č.; funding acquisition, M.M.; investigation, N.Č.; methodology, N.Č. and M.M.; project administration, M.B.B. and M.M.; resources, M.M.; software, N.Č.; supervision, M.B.B. and M.M.; validation, M.B.B. and M.M.; visualization, N.Č. and M.B.B.; writing—original draft preparation, N.Č., M.B.B. and M.M.; writing—review and editing, M.B.B. and M.M. All authors have read and agreed to the published version of the manuscript.

Funding

This research was funded by the University of Rijeka, grant number uniri-drustv-18-122.

Data Availability Statement

Not applicable.

Conflicts of Interest

The authors declare no conflict of interest.

References

  1. Boes, K.; Buhalis, D.; Inversini, A. Conceptualising Smart Tourism Destination Dimensions. In Information and Communication Tech-Nologies in Tourism 2015; Springer: Cham, Switzerland, 2015; pp. 391–403. [Google Scholar]
  2. Buhalis, D.; Amaranggana, A. Smart Tourism Destinations. In Information and Communication Technologies in Tourism 2014; Springer: Cham, Switzerland, 2013; pp. 553–564. [Google Scholar]
  3. Gajdošík, T.; Marciš, M. Artificial Intelligence Tools for Smart Tourism Development. In Computer Science Online Conference; Springer: Cham, Switzerland, 2019; pp. 392–402. [Google Scholar]
  4. Zhao, Y.; Xu, X.; Wang, M. Predicting Overall Customer Satisfaction: Big Data Evidence from Hotel Online Textual Reviews. Int. J. Hosp. Manag. 2019, 76, 111–121. [Google Scholar] [CrossRef]
  5. Afsahhosseini, F.; Al-Mulla, Y. Machine Learning in Tourism. In Proceedings of the the 3rd International Conference on Machine Learning and Machine Intelligence 2020, Hangzhou, China, 18–20 September 2020; pp. 53–57. [Google Scholar]
  6. Rodríguez-Pardo, C.; Patricio, M.A.; Berlanga, A.; Molina, J.M. Machine Learning for Smart Tourism and Retail. In Handbook of Research on Big Data Clustering and Machine Learning; IGI Global: Hershey, PA, USA, 2020; pp. 311–333. [Google Scholar]
  7. Annisa, R.; Surjandari, I. Opinion Mining on Mandalika Hotel Reviews Using Latent Dirichlet Allocation. Procedia Comput. Sci. 2019, 161, 739–746. [Google Scholar] [CrossRef]
  8. Vargas-Calderón, V.; Moros Ochoa, A.; Castro Nieto, G.Y.; Camargo, J.E. Machine learning for assessing quality of service in the hospitality sector based on customer reviews. Inf. Technol. Tour. 2021, 23, 351–379. [Google Scholar] [CrossRef]
  9. Djuraidah, A.; Putranto, Y.; Sartono, B. Topic modelling and hotel rating prediction based on customer review in Indonesia. Int. J. Manag. Decis. Mak. 2021, 20, 282–307. [Google Scholar] [CrossRef]
  10. Chu, W.T.; Huang, W.H. Cultural difference and visual information on hotel rating prediction. World Wide Web 2017, 20, 595–619. [Google Scholar] [CrossRef]
  11. Wang, H.; Lu, Y.; Zhai, C. Latent aspect rating analysis on review text data: A rating regression approach. In Proceedings of the 16th ACM SIGKDD International Conference on Knowledge Discovery and Data Mining, Washington, DC, USA, 24–28 July 2010; pp. 783–792. [Google Scholar]
  12. Wang, J.; Zhao, Z.; Liu, Y.; Guo, Y. Research on the Role of Influencing Factors on Hotel Customer Satisfaction Based on BP Neural Network and Text Mining. Information 2021, 12, 99. [Google Scholar] [CrossRef]
  13. Shoukry, A.; Aldeek, F. Attributes prediction from IoT consumer reviews in the hotel sectors using conventional neural network: Deep learning techniques. Electron. Commer. Res. 2020, 20, 223–240. [Google Scholar] [CrossRef]
  14. Pearson, K. Notes on the History of Correlation. Biometrika 1920, 13, 25–45. [Google Scholar] [CrossRef]
  15. James, G.; Witten, D.; Hastie, T.; Tibshirani, R. An Introduction to Statistical Learning; Springer: New York, NY, USA, 2013. [Google Scholar]
  16. Chawla, N.V.; Bowyer, K.W.; Hall, L.O.; Kegelmeyer, W.P. SMOTE: Synthetic minority over-sampling technique. J. Artif. Intell. Res. 2002, 16, 321–357. [Google Scholar] [CrossRef]
  17. Kibriya, A.M.; Frank, E.; Pfahringer, B.; Holmes, G. Multinomial naive bayes for text categorization revisited. In Proceedings of the Australasian Joint Conference on Artificial Intelligence, Cairns, QLD, Australia, 4–6 December 2004; Springer: Berlin/Heidelberg, Germany; pp. 488–499. [Google Scholar]
  18. Mohammed, M.; Khan, M.B.; Bashier, E.B.M. Machine Learning: Algorithms and Applications, 1st ed.; CRC Press: Boca Raton, FL, USA, 2016; pp. 37–44. [Google Scholar]
  19. Lingjun, H.; Levine, R.A.; Fan, J.; Beemer, J.; Stronach, J. Random Forest as a Predictive Analytics Alternative to Regression in Institutional Research. Pract. Assess. Res. Eval. 2018, 23, 1. [Google Scholar]
  20. Johnson, R.A.; Wichern, D.W. Applied Multivariate Statistical Analysis; Pearson: London, UK, 2014. [Google Scholar]
  21. Kao, A.; Poteet, S.R. (Eds.) Natural Language Processing and Text Mining; Springer: Berlin/Heidelberg, Germany, 2007. [Google Scholar]
  22. Eisenstein, J. Introduction to Natural Language Processing; MIT Press: Cambridge, UK, 2019. [Google Scholar]
  23. Niwattanakul, S.; Singthongchai, J.; Naenudorn, E.; Wanapu, S. Using of Jaccard coefficient for keywords similarity. In Proceedings of the International Multiconference of Engineers and Computer Scientists, Hong Kong, China, 13–15 March 2013; Volume 1, pp. 380–384. [Google Scholar]
Figure 1. Proportion of observations per category.
Electronics 11 00913 g001
Figure 2. Average accommodation price per region and category.
Electronics 11 00913 g002
Figure 3. Distribution of accommodation categories by overnight price.
Electronics 11 00913 g003
Figure 4. Price outliers per accommodation category.
Electronics 11 00913 g004
Figure 5. Factor correlation analysis.
Electronics 11 00913 g005
Figure 6. ROC curve for the DT model.
Electronics 11 00913 g006
Figure 7. ROC curve for the Random Forest model.
Electronics 11 00913 g007
Figure 8. ROC curve for the SVM model.
Electronics 11 00913 g008
Table 1. Dataset description.
Column/VariableNon-Null CountData Type
Accommodation name8.113object
Accommodation type8.113category
Location8.113object
Number of stars6.660float64
Accommodation review6.729float64
Accommodation category6.729category
Number of reviews6.729float64
Accommodation size8.113int32
Accommodation price8.113int32
Personnel review6.729float65
Facility review6.729float64
Cleanliness review6.729float64
Comfort review6.729float64
Value review6.729float64
Location review6.729float64
Wi-Fi review6.729float64
Smoking8.113int32
House pets8.113int32
Parties8.113int32
No house rules8.113int32
Pool8.113int32
Free Wi-Fi8.113int32
Breakfast8.113int32
Bar8.113int32
Airport transportation8.113int32
Parking8.113int32
Beach8.113int32
Family rooms8.113int32
Smoker room8.113int32
County8.113category
Region8.113category
Table 2. Basic properties per accommodation category.
Accommodation CategoryMinimum ReviewMaximum ReviewAverage No. of ReviewsAverage Size (in m2)
Okay4.96.96137.2
Good7.07.99537.4
Very good8.08.513036.9
Fabulous8.68.910439.2
Superb9.09.410443.0
Exceptional9.510.06951.2
Table 3. Ratio of categories per region (the color intensity indicates the percentage).
MainlandDalmatiaIstriaKvarnerSlavonia
Okay1%1%2%1%0%
Good3%4%4%5%4%
Very good9%9%10%11%7%
Fabulous12%14%16%15%12%
Superb30%35%34%34%18%
Exceptional45%36%35%34%58%
Table 4. Accommodation properties per accommodation category.
OkayGoodVery GoodFabulousSuperbExceptional
Smoking73%65%57%49%43%33%
House pets41%55%47%44%38%32%
Parties68%69%62%59%49%38%
Bar19%25%23%21%12%7%
Pool7%9%12%13%11%6%
Breakfast5%16%18%17%10%3%
No house rules82%81%69%66%59%57%
Parking88%84%85%84%86%90%
Beach22%23%19%20%19%15%
Wifi75%84%86%86%87%88%
Table 5. ANOVA results.
MeasureValue
F14.07
p 1.99 · e 11
Table 6. Tukey HSD test.
Group 1Group 2Mean Diffp-ValueLowerUpperReject
MainlandDalmatia−0.0980.001−0.155−0.04True
MainlandIstria−0.1080.001−0.184−0.032True
MainlandKvarner−0.1310.001−0.193−0.063True
MainlandSlavonia−0.1040.091−0.010.218False
DalmatiaIstria−0.010.9−0.0770.057False
DalmatiaKvarner−0.0330.517−0.0910.025False
DalmatiaSlavonia0.2020.0010.0940.309True
IstriaKvarner−0.0230.9−0.0990.0528False
IstriaSlavonia0.2120.0010.0930.33True
KvarnerSlavonia0.2350.0010.1210.349True
Table 7. An excerpt from the review dataset.
ReviewCategoryLanguageText
8.8FabulousEnglishgreat breakfast good choose private beach lot people quite free…
7.1GoodEnglishfix lunch problems children perfect hotel…
9.6ExceptionalEnglishbeautiful place unwind relax scheduled spa beautiful gem absolute privacy…
Table 8. Bigram analysis for English guest reviews.
Accommodation
Category
Most Frequently Referenced in Guest Reviews
Okayview of the ocean, location view, accommodation personnel, city center, accommodation breakfast
Goodaccommodation personnel, city center, value for money, accommodation location (regarding the city)
Very goodvalue for money, city center, accommodation location, accommodation room, breakfast, accommodation personnel
Fabulousaccommodation personnel, bus station, city center, accommodation location, breakfast, value for money
Superbaccommodation personnel, city center, value for money, accommodation location, accommodation city
Exceptionalaccommodation location regarding city location, accommodation personnel, value for money
Table 9. Bigram analysis of Croatian guest reviews.
Accommodation
Category
Most Frequently Referenced in Guest Reviews
Okayaccommodation location, accommodation personnel, reception personnel, proximity to city center, room and bathroom, breakfast, parking
Goodcity center proximity, parking, accommodation personnel, breakfast, location in relation to price, ratio of quality and price
Very goodbreakfast, accommodation personnel, city center proximity, value for money, time needed to get to the city center
Fabulouslocation quality, porch, room, breakfast, room interior, city center proximity, parking, accommodation personnel, reception personnel
Superbcity center proximity, location quality, accommodation personnel, breakfast, value for money, peace and quiet, price and quality ratio
Exceptionalcity center proximity, peace and quiet, location quality, value for money, accommodation personnel, breakfast, parking, host courtesy
Table 10. Unigram analysis for English and Croatian reviews.
Accommodation
Category
English ReviewsCroatian Reviews
Okaylocation, room, view, hotel, personnel, breakfast, apartment, city, accommodation, sealocation, personnel, room, bed, breakfast, hotel, proximity, object, stay, price
Goodlocation, room, personnel, hotel, apartment, view, city, accommodation, breakfast, surroundingslocation, personnel, breakfast, parking, city, room, center, hotel, view, bed
Very goodlocation, room, personnel, hotel, apartment, breakfast, city, view, accommodation, hostlocation, breakfast, personnel, city, room, parking, center, hotel, proximity, view
Fabulouslocation, personnel, room, apartment, breakfast, hotel, view, host, pool, arealocation, room, personnel, parking, object, city, proximity, food, host
Superblocation, personnel, room, apartment, hotel, breakfast, view, city, host, arealocation, personnel, breakfast, city, stay, hotel, room, host, center, proximity, bed
Exceptionallocation, apartment, personnel, room, hotel, host, breakfast, city, view, kindnesslocation, personnel, apartment, breakfast, stay, host, praise, room, city, rest
Table 11. Jaccard index for English guest reviews (higher color intensity indicates higher index).
OkayGoodVery GoodFabulousSuperbExceptional
Okay10.890.920.960.510.22
Good0.8910.950.890.560.24
Very good0.920.9510.910.550.23
Fabulous0.960.890.9110.50.21
Superb0.510.560.550.510.43
Exceptional0.220.240.230.210.431
Table 12. Jaccard index for Croatian guest reviews (higher color intensity indicates higher index).
OkayGoodVery GoodFabulousSuperbExceptional
Okay10.240.740.280.820.26
Good0.2410.180.070.30.94
Very good0.740.1810.380.610.19
Fabulous0.280.070.3810.230.07
Superb0.820.30.610.2310.32
Exceptional0.260.940.190.070.321
Table 13. Classification results of the Multinomial Naïve Bayes English model.
CategoryPrecisionRecallF1 ScoreAccuracySupport
Okay0.690.530.60.56170
Good0.450.320.370.36248
Very good0.610.460.520.46197
Fabulous0.390.30.340.33151
Superb0.530.490.510.52434
Exceptional0.790.890.840.851917
Table 14. Classification results of the Multinomial Naïve Bayes Croatian model.
CategoryPrecisionRecallF1 ScoreAccuracySupport
Okay0.780.750.760.7592
Good0.270.330.300.2955
Very good0.250.240.240.2763
Fabulous0.810.760.790.7634
Superb0.490.660.680.66161
Exceptional0.900.910.910.9753
Table 15. Parameters of Multinomial Naive Bayes for English reviews.
ParameterTypeDefault ValueUsed Value
alphafloat1.01.0
fit_priorboolTrueTrue
class_priorarray-likeNoneNone
Table 16. Classification confusion matrix for the Multinomial Naive Bayes model based on English reviews (higher color intensity indicates higher value).
OkayGoodVery GoodFabulousSuperbExceptional
Okay0.560.10.030.030.080.2
Good0.090.360.10.060.10.28
Very good0.030.110.460.040.110.26
Fabulous00.050.040.330.130.45
Superb0.010.060.030.030.520.35
Exceptional0.010.020.010.030.080.85
Table 17. Parameters for Multinomial Naive Bayes for Croatian reviews.
ParameterTypeDefault ValueUsed Value
alphafloat1.00.95
fit_priorboolTrueTrue
class_priorarray-likeNoneNone
Table 18. Classification confusion matrix for Multinomial Naive Bayes model based on Croatian reviews (higher color intensity indicates higher value).
OkayGoodVery GoodFabulousSuperbExceptional
Okay0.750.050.040.010.070.08
Good0.020.290.3800.110.2
Very good0.080.430.2700.030.19
Fabulous0.0600.030.760.060.09
Superb0.020.020.050.010.660.24
Exceptional0.010.010.0300.060.9
Table 19. Training set description.
VariableNon-Null CountData Type
Bar6.133int32
Breakfast6.133int32
Number of stars6.133int32
Location review6.133float64
Personnel review6.133float64
Facility review6.133float64
Comfort review6.133float64
Value review6.133float64
Wi-Fi review6.133float64
Cleanliness review6.133float64
Accommodation size6.133int32
Accommodation type6.133category
Smoker room6.133int32
Parties6.133int32
Table 20. Parameters used in classification models.
ModelParameterDefault Value
DTrandom_stateNone1
Splitter“best”“best”
max_depthNone10
min_samples_split22
RFrandom_stateNone1
n_estimators100150
criterion“Gini”“Entropy”
max_depthNone20
max_samplesNoneNone
max_features“auto”3
bootstrapTrueTrue
oob_scoreFalseTrue
min_samples_split22
SVMkernel“rbf”“linear”
random_stateNone1
decision_function_shape“ovr”“ovr”
break_tiesFalseTrue
Table 21. Classification results for the DT model.
CategoryPrecisionRecallF1 ScoreAccuracy
Okay0.670.700.680.65
Good0.700.750.720.71
Very good0.780.700.740.79
Fabulous0.650.710.680.75
Superb0.790.780.790.80
Exceptional0.890.880.880.91
Table 22. Confusion matrix for the DT model (higher color intensity indicates higher value).
OkayGoodVery GoodFabulousSuperbExceptional
Okay0.650.350000
Good0.050.710.220.0100
Very good00.080.790.120.020
Fabulous000.120.750.120.01
Superb000.010.110.80.08
Exceptional00000.090.91
Table 23. Classification results for the RF model.
CategoryPrecisionRecallF1 ScoreAccuracy
Okay10.700.820.7
Good0.840.810.830.81
Very good0.860.810.830.81
Fabulous0.770.740.750.74
Superb0.840.880.860.89
Exceptional0.930.930.930.93
Table 24. Confusion matrix for the RF model (higher color intensity indicates higher value).
OkayGoodVery GoodFabulousSuperbExceptional
Okay0.70.30000
Good00.810.180.0100
Very good00.030.810.130.020.01
Fabulous000.040.740.220
Superb0000.050.890.07
Exceptional00000.070.93
Table 25. Classification results for the SVM model.
CategoryPrecisionRecallF1 ScoreAccuracy
Okay0.640.700.670.7
Good0.750.790.770.79
Very good0.850.810.830.82
Fabulous0.780.850.810.85
Superb0.900.870.880.87
Exceptional0.940.940.940.94
Table 26. Confusion matrix for the SVM model (higher color intensity indicates higher value).
OkayGoodVery GoodFabulousSuperbExceptional
Okay0.70.30000
Good0.110.790.1000
Very good00.080.820.090.010.01
Fabulous000.070.850.080
Superb0000.070.870.06
Exceptional00000.060.94
Table 27. Model comparison by AUC.
ModelAverage AUC
SVM0.901
RF0.893
DT0.865
Table 28. The best performing models per category with respect to the evaluation measure.
Evaluation Measure
PrecisionRecallF1AccuracyAUC
OkayRFALLRFRF, SVMDT
GoodRFRFRFRFRF
Very goodRFRF, SVMRF, SVMSVMSVM
FabulousSVMSVMSVMSVMSVM
SuperbSVMSVMSVMRFSVM
ExceptionalSVMSVMSVMSVMSVM
Publisher’s Note: MDPI stays neutral with regard to jurisdictional claims in published maps and institutional affiliations.

