
Emergency Blower-Based Ventilator with Novel-Designed Ventilation Sensor and Actuator

Abstract
:1. Introduction
- (1)
- This paper presents a development of a low-cost full-function blower-type emergency pressure-control ventilator which is based on proportional integral derivative (PID) control.
- (2)
- The proposed ventilator can be controlled and monitored remotely by using a WIFI or 4G network, making it suitable to be used during pandemics of a highly contagious disease.
- (3)
- Our proposed ventilator is designed to provide a fully functional ventilation operation suitable for life-support commensurate with the strict requirements of the FDA for life-support ventilators, even in a pandemic.
- (4)
- Our proposed blower-based ventilator is equipped with a pulse oximeter to monitor the treatment of the patient.
- (5)
- We introduce a novel-designed integrated flow and pressure sensor, electronic PEEP valve, and proportional controlled valve. We designed the sensor so that it can measure both flow and pressure at the same time. A low-cost proportional control valve was also introduced by mounting a servo motor onto the ball valve. By controlling the rotational angle of the servo motor, the flow and pressure can be controlled proportionally.
2. Related Works
3. Materials and Methods
- (i)
- It is pressure-controlled ventilation;
- (ii)
- There are two ventilator modes, including continuous mandatory control (CMV) and assisted controlled mode (ACV);
- (iii)
- Peak inspired pressure range is 1–30 cmH2O;
- (iv)
- Respiration rate is 8–40 bpm;
- (v)
- I:E ratio is 1:1, 1:2, 1:3, 1:4, and 2:1;
- (vi)
- The fractional concentration of oxygen range (FiO2) is 21–100%;
- (vii)
- Inspired time range is 0.5–3 s;
- (viii)
- Positive End Expiratory Pressure (PEEP) range is 5–20 cmH2O;
- (ix)
- Trigger mode is pressure and flow trigger;
- (x)
- The alarm is available for high/low-peak inspired pressure, high/low tidal volume, and low/high flow rate;
- (xi)
- The graph is available for pressure, flow, and volume;
- (xii)
- Remote control and monitor using web service are available.
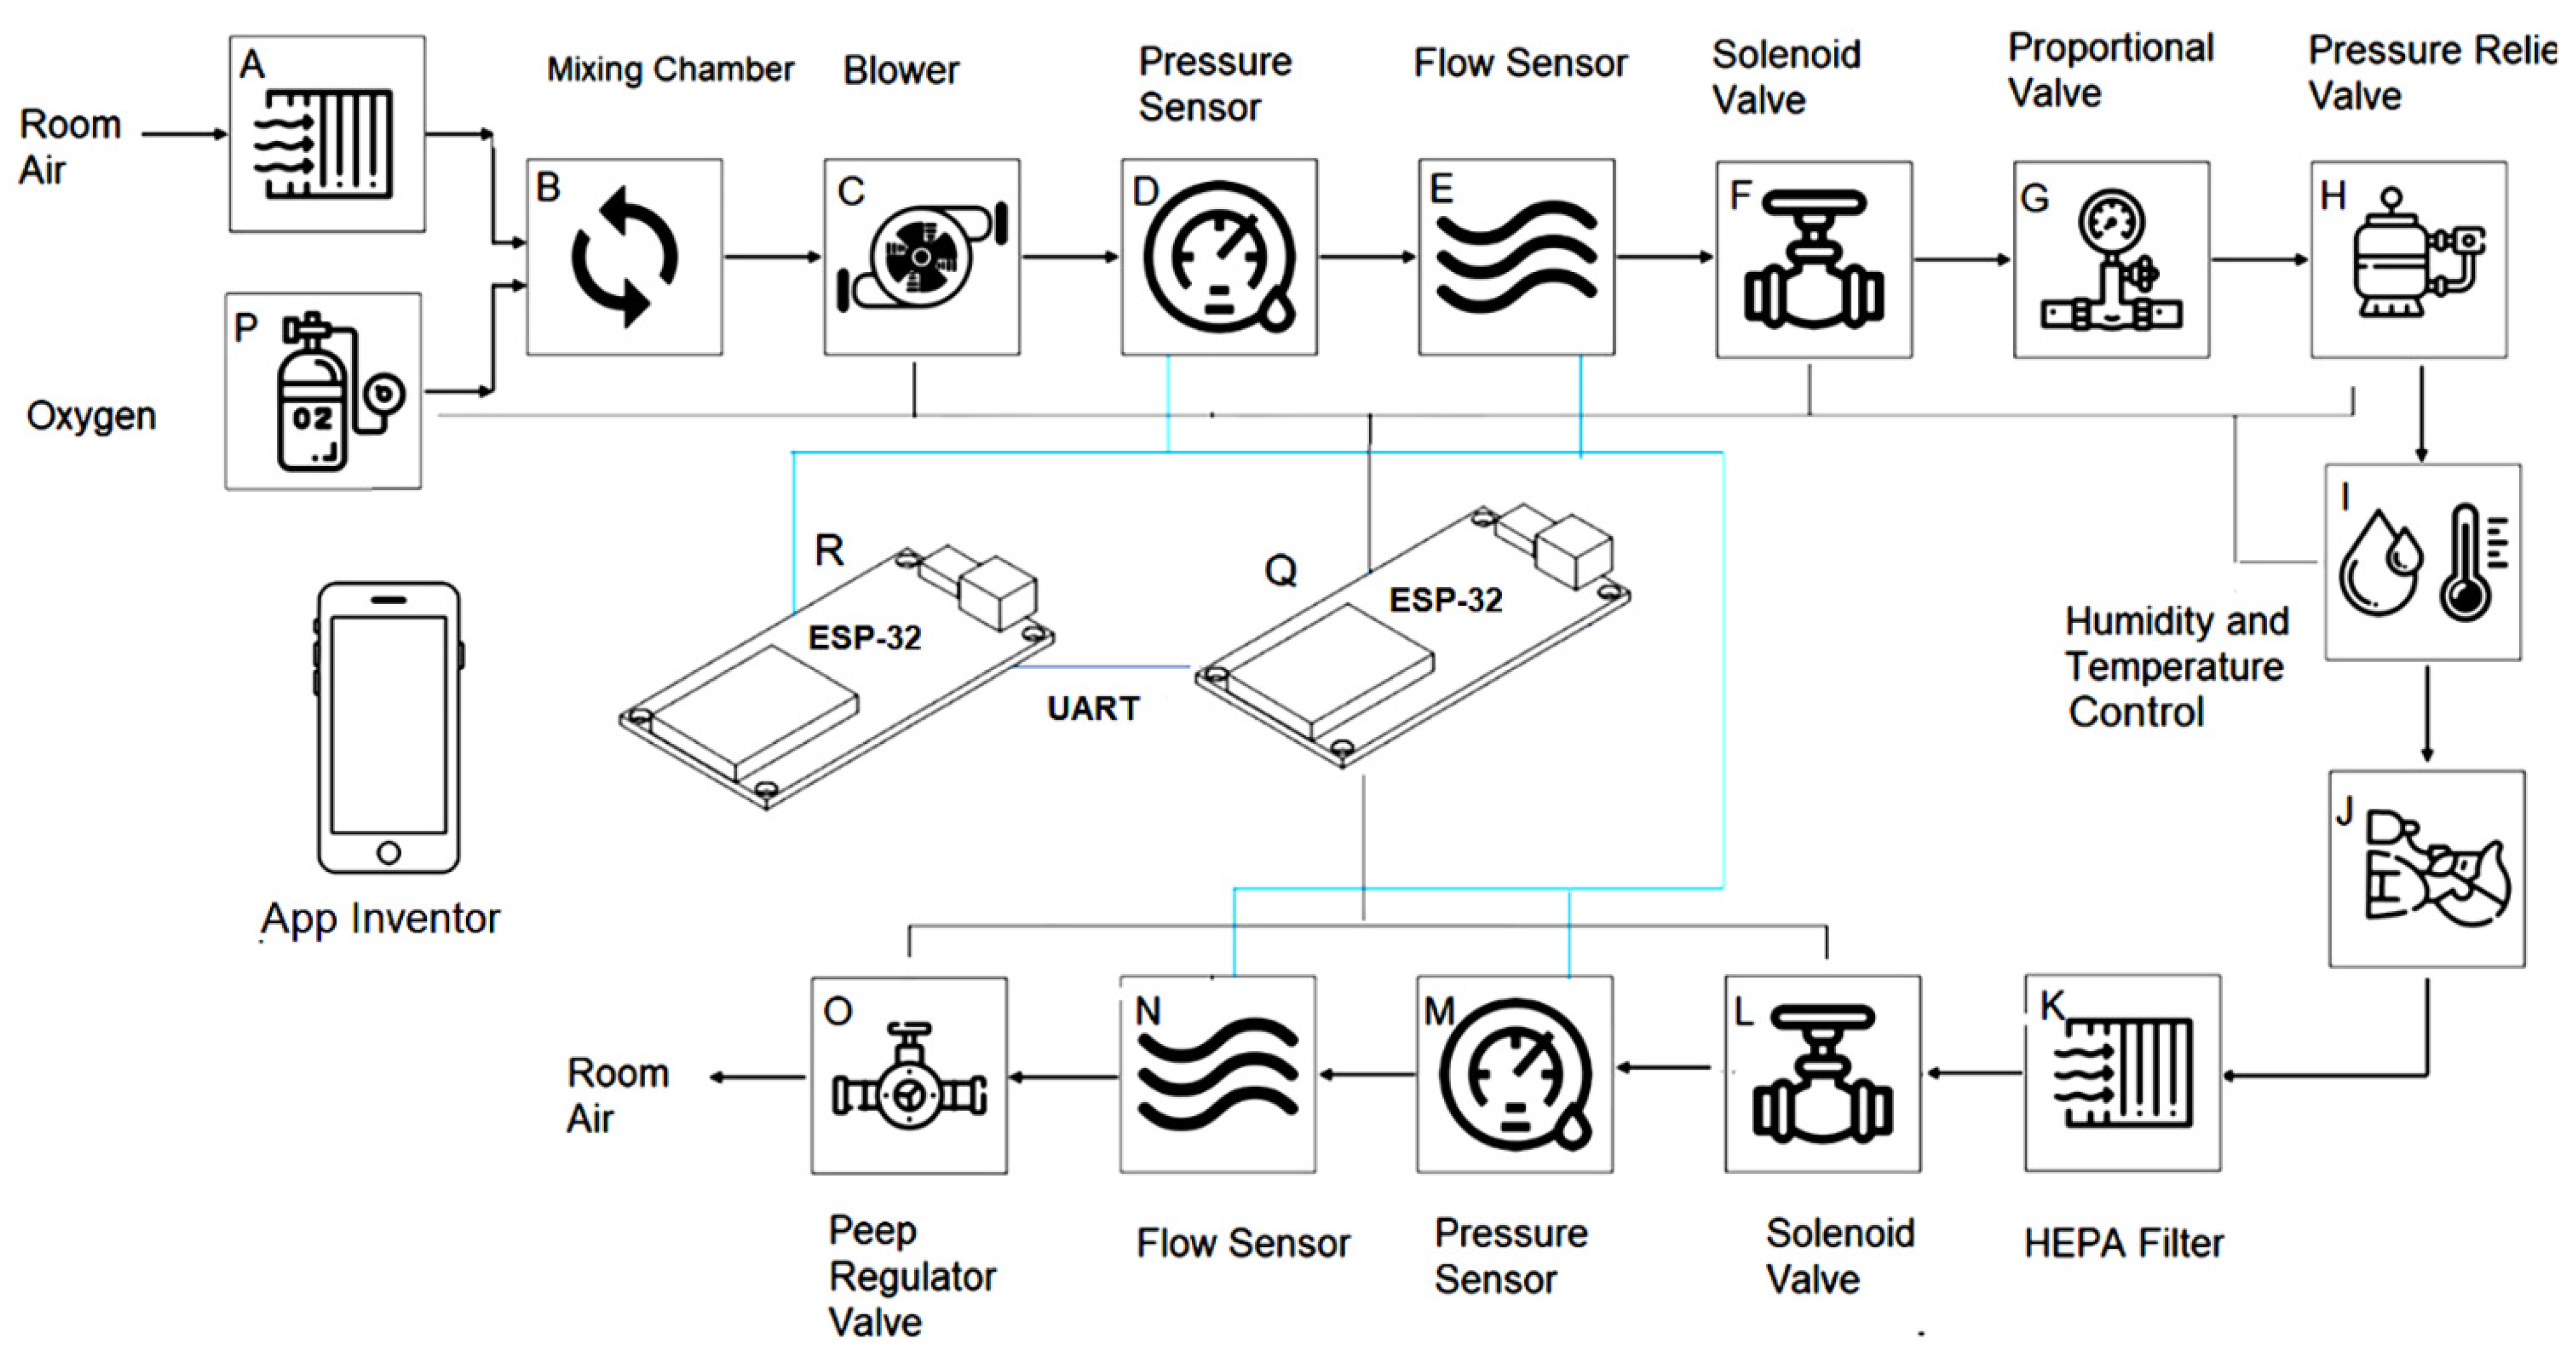
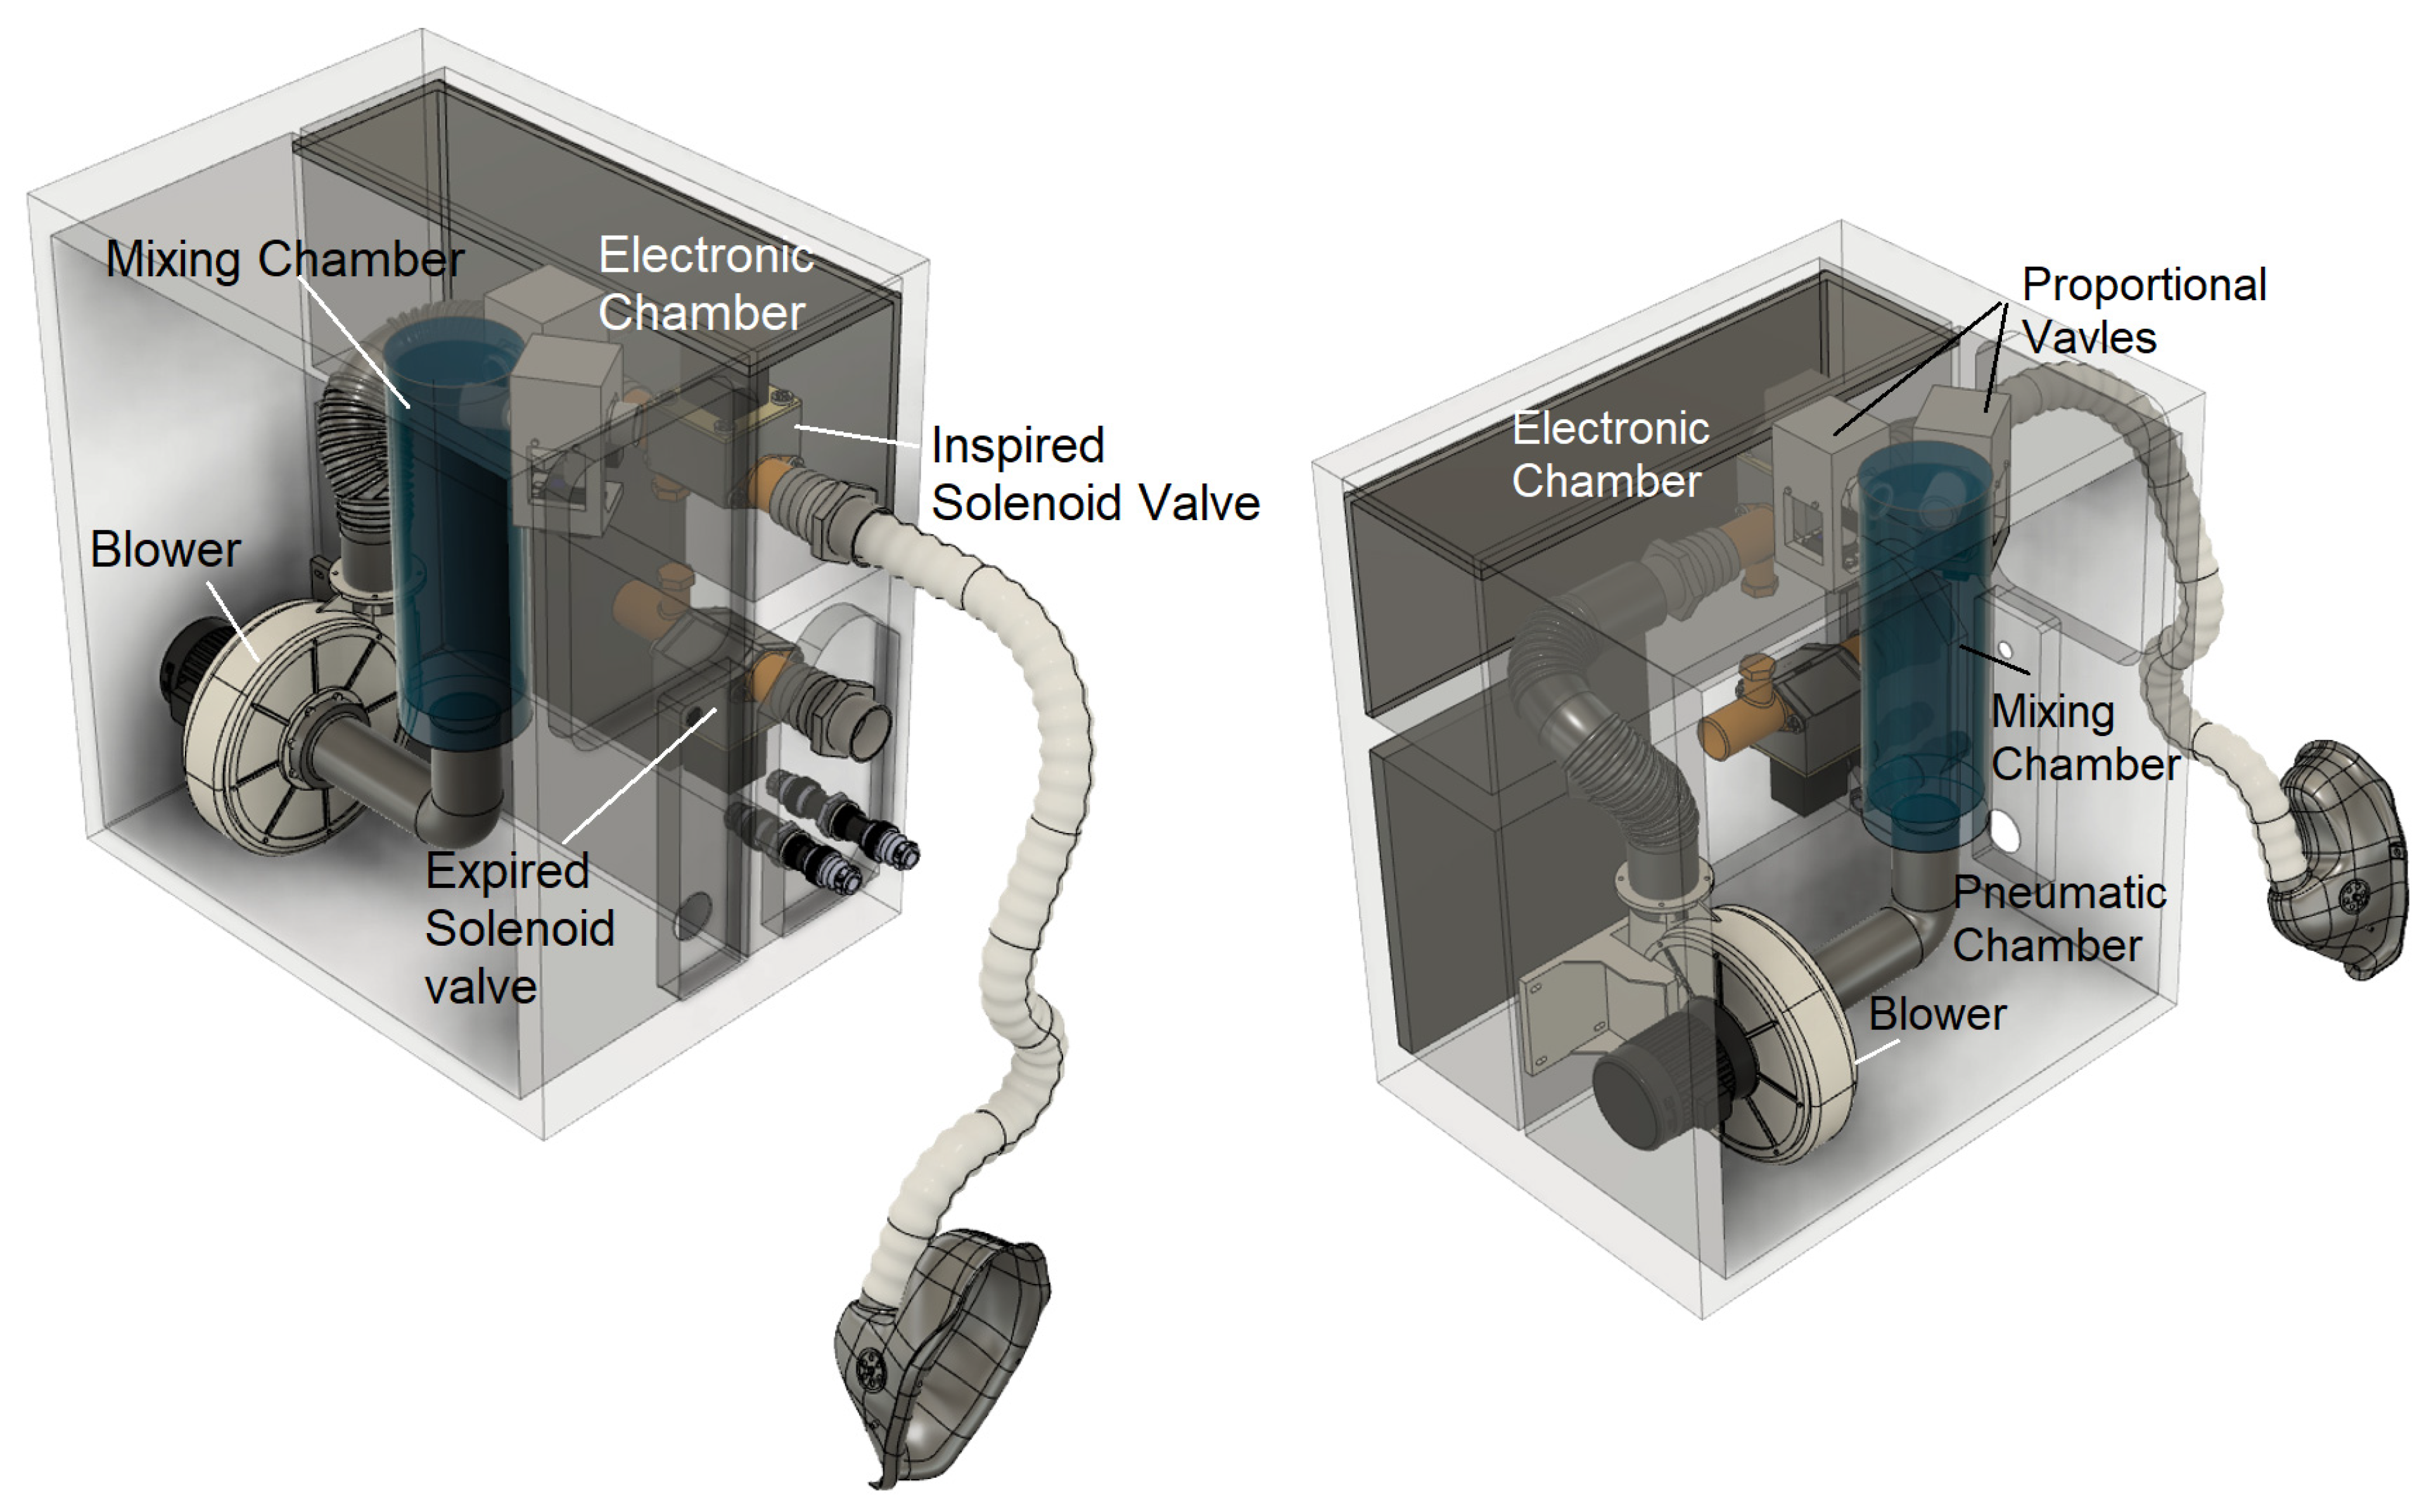
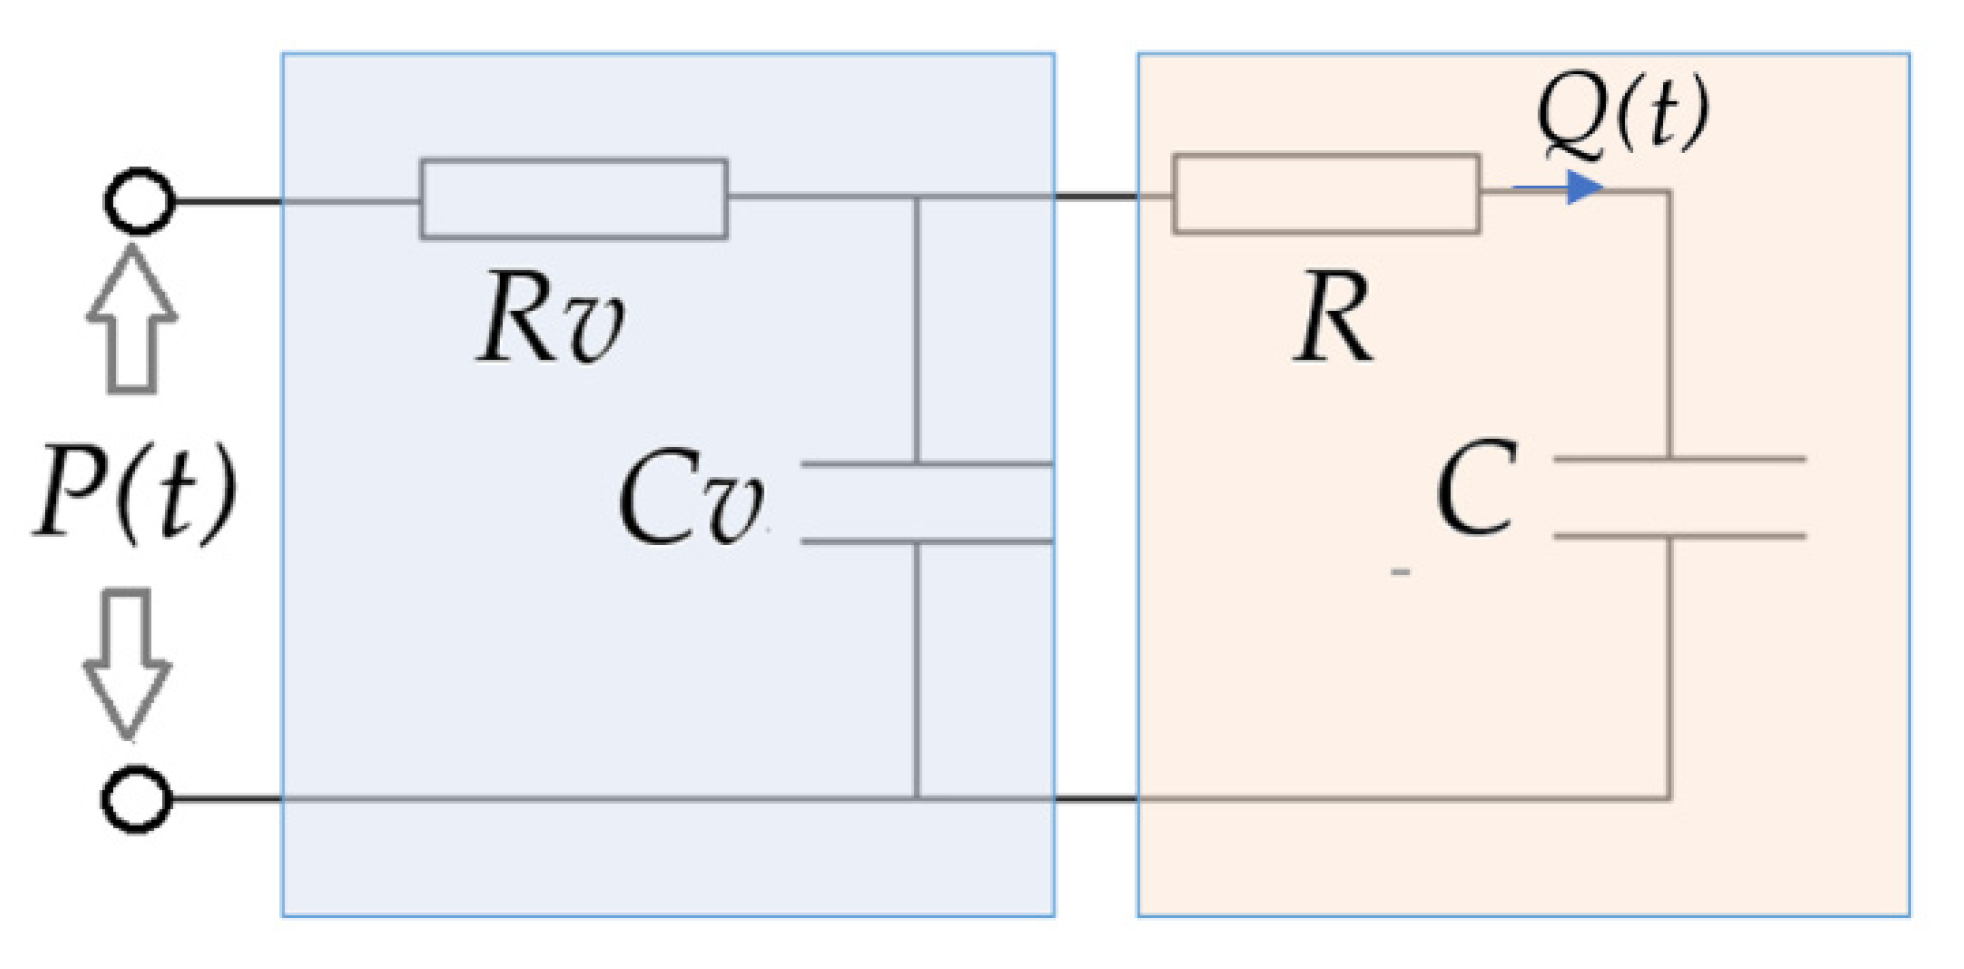
3.1. Designed Ventilator Pneumatic Circuit Diagram
3.2. Designed Microcontroller and Electronic Part
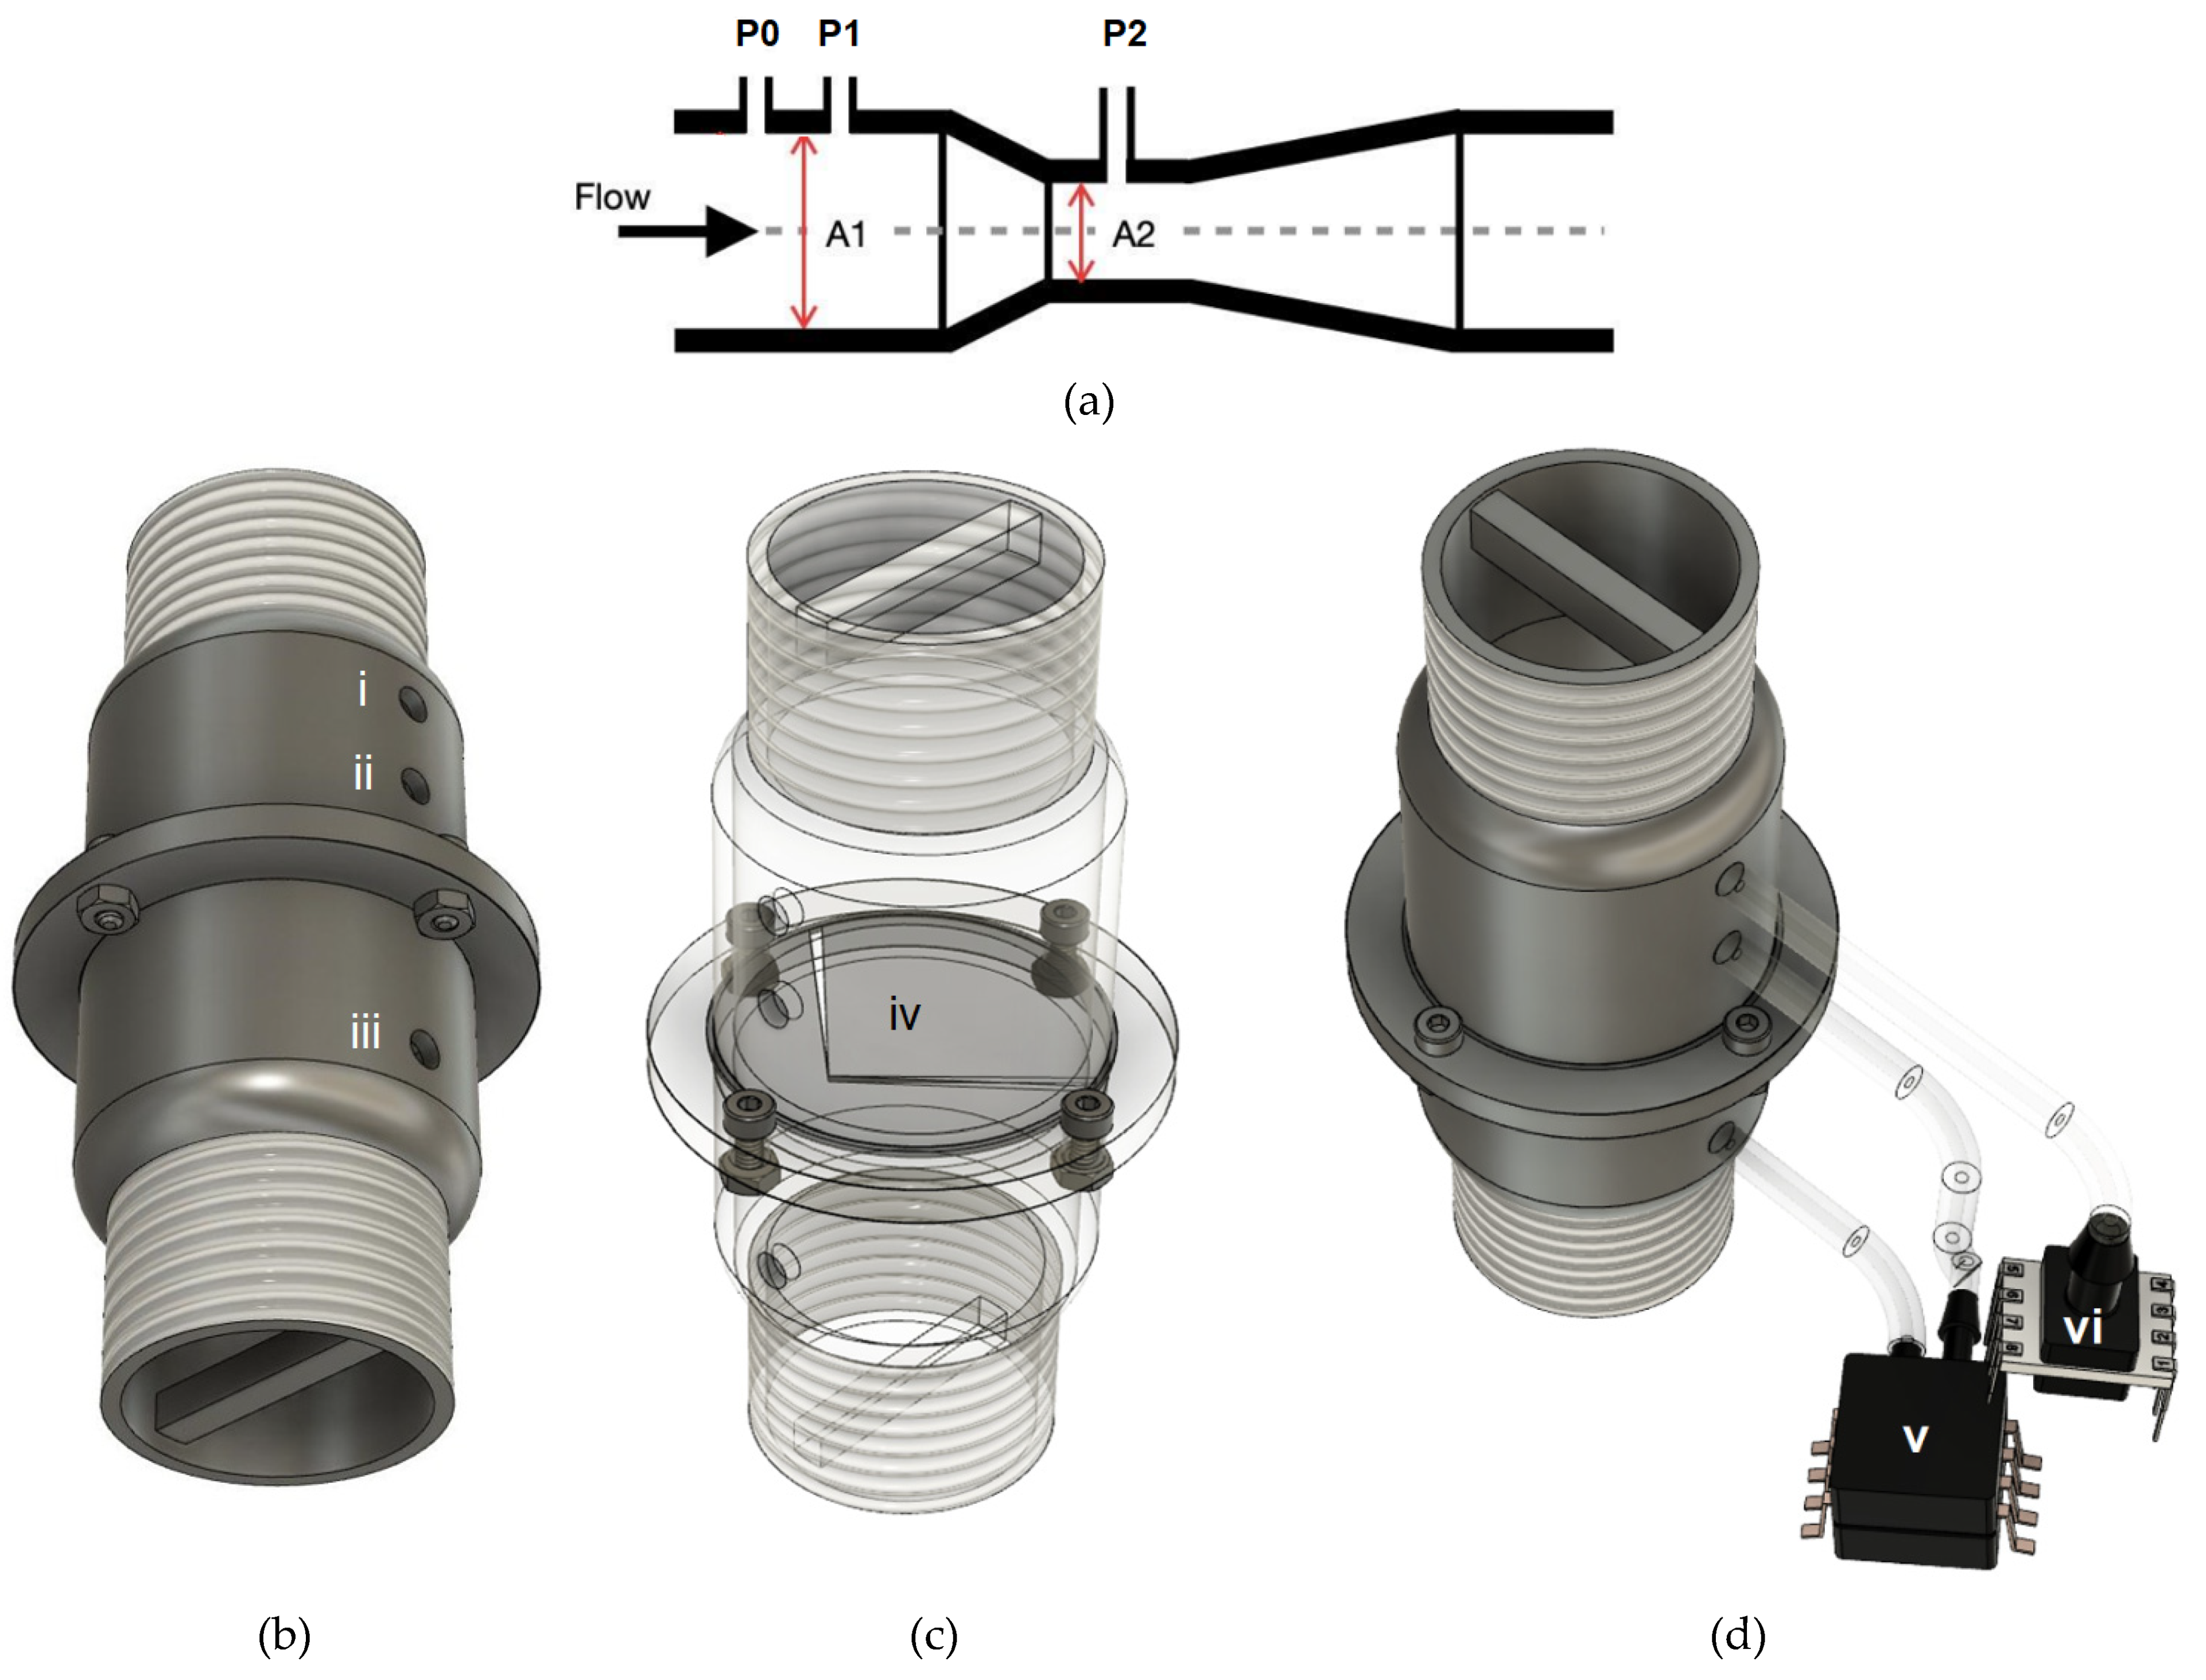
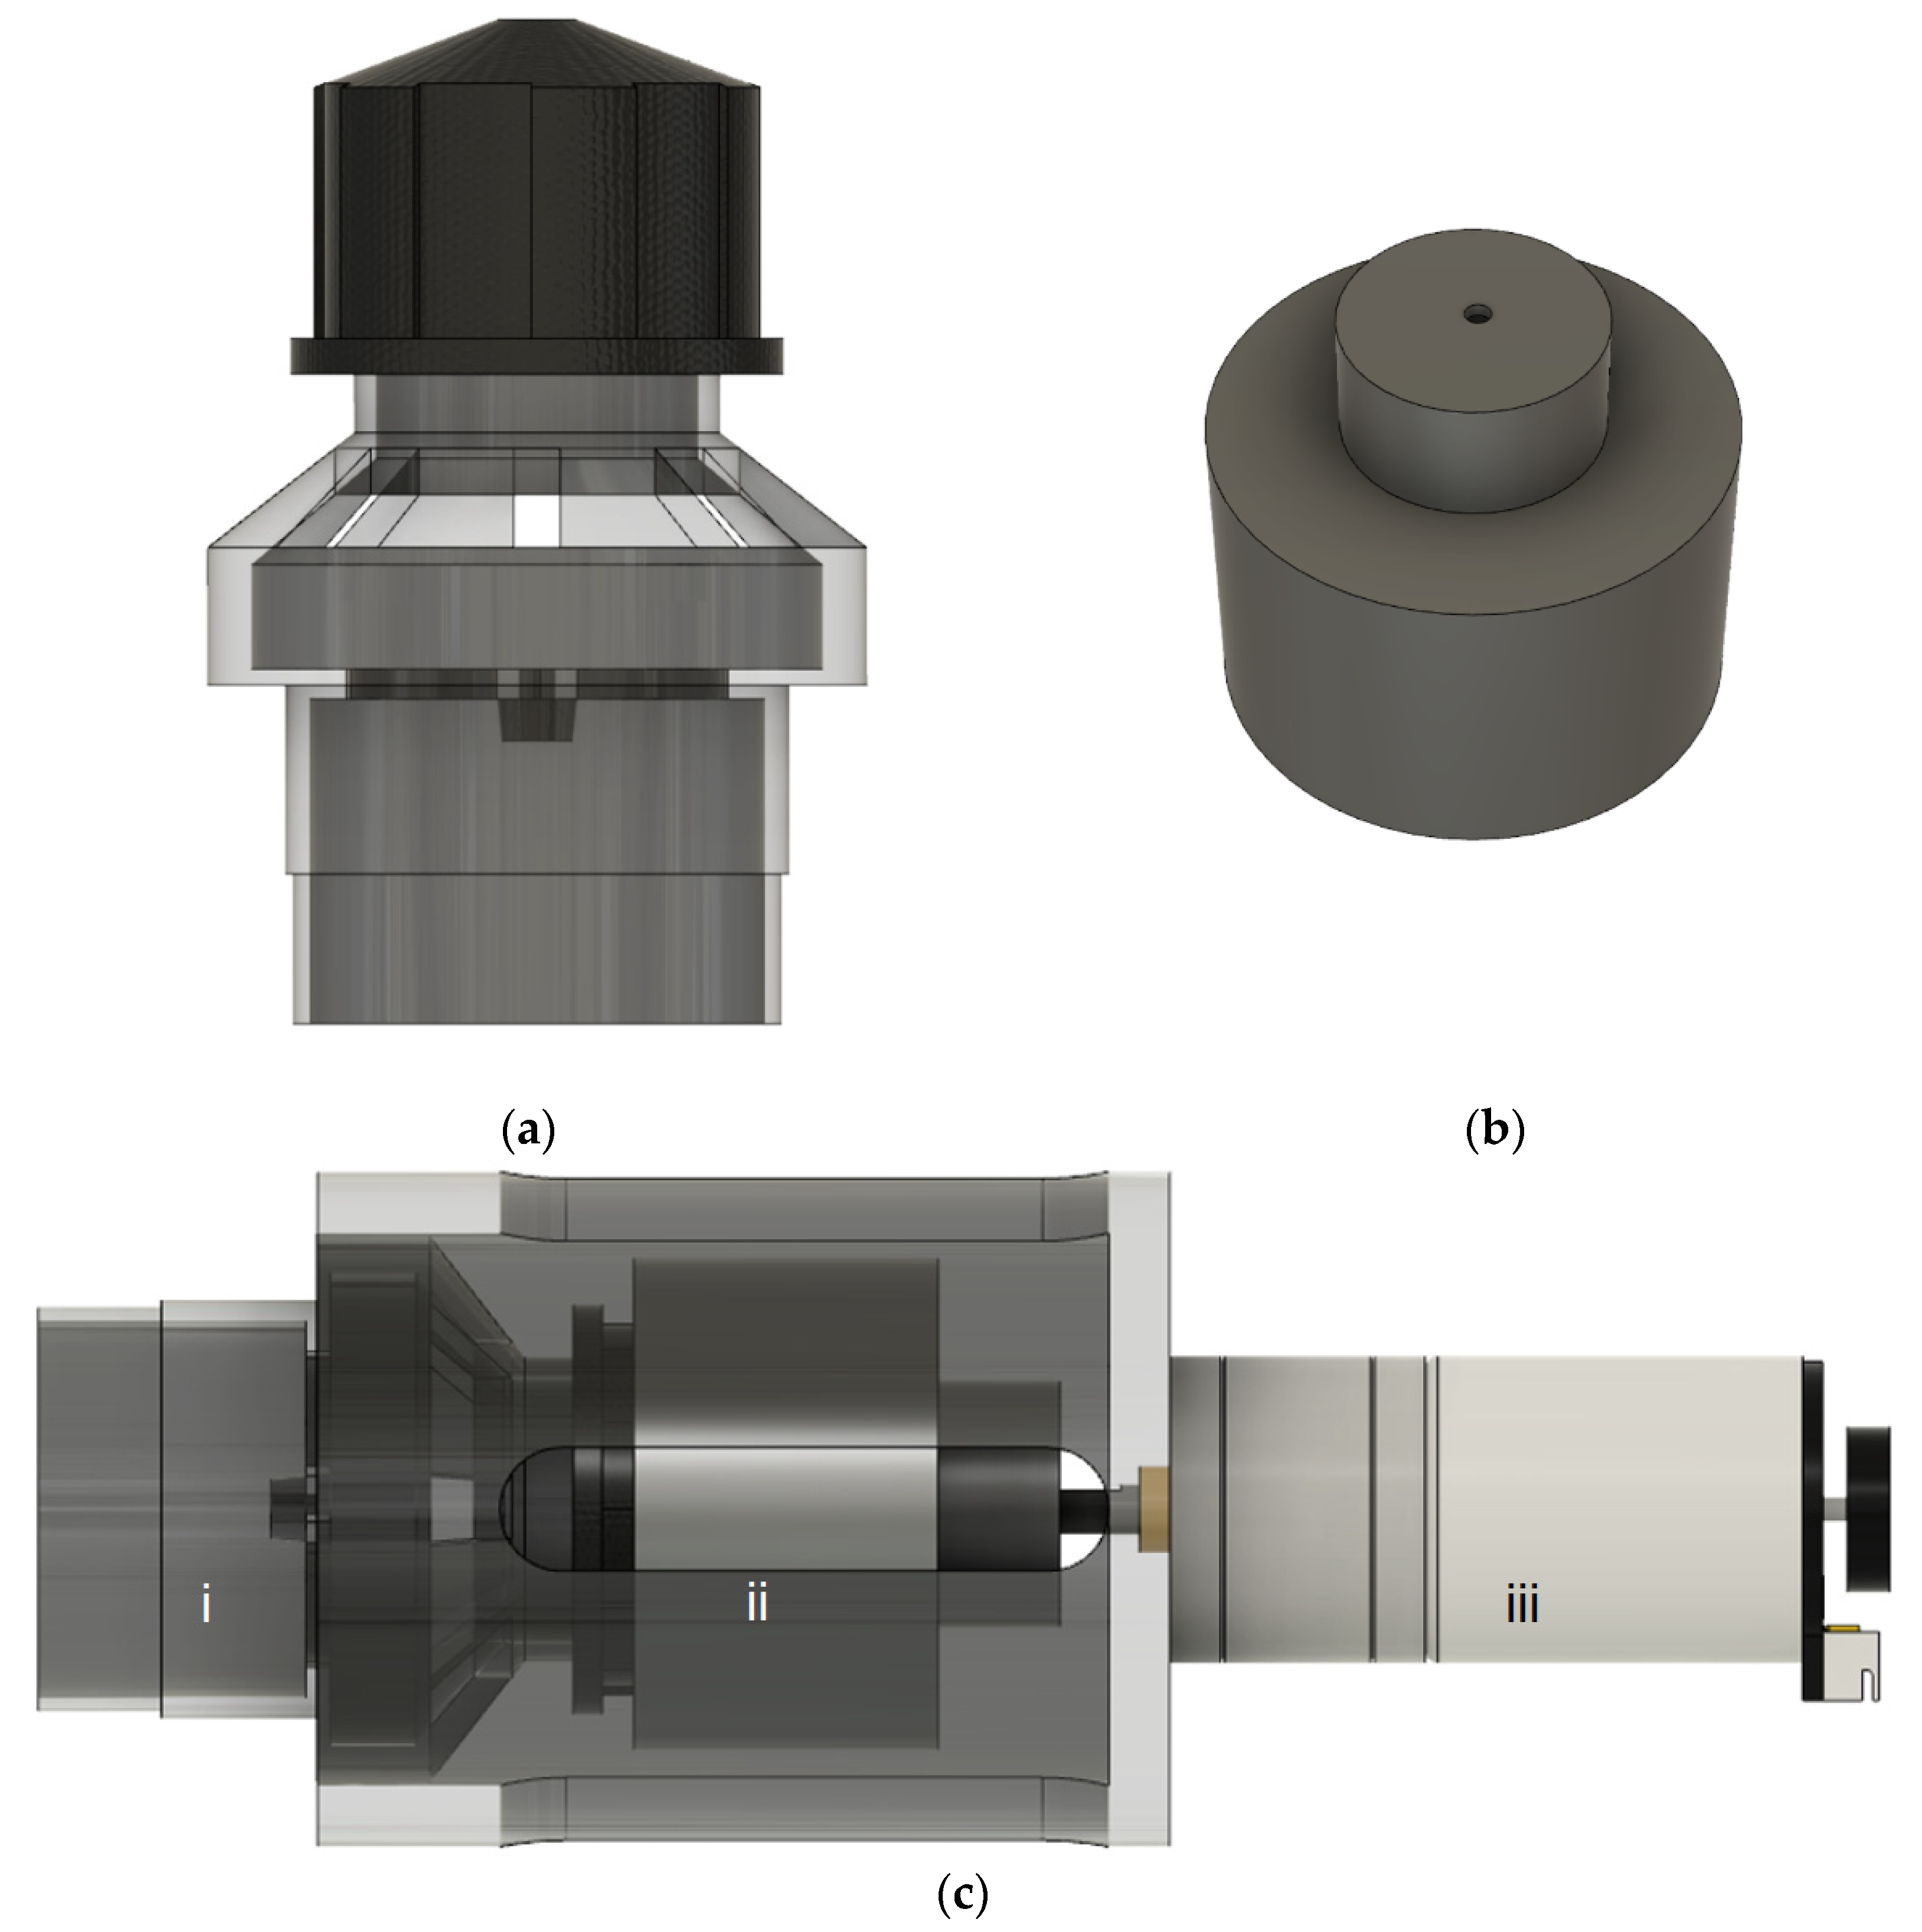
3.2.1. Integrated Flow and Pressure Sensor
3.2.2. Blower
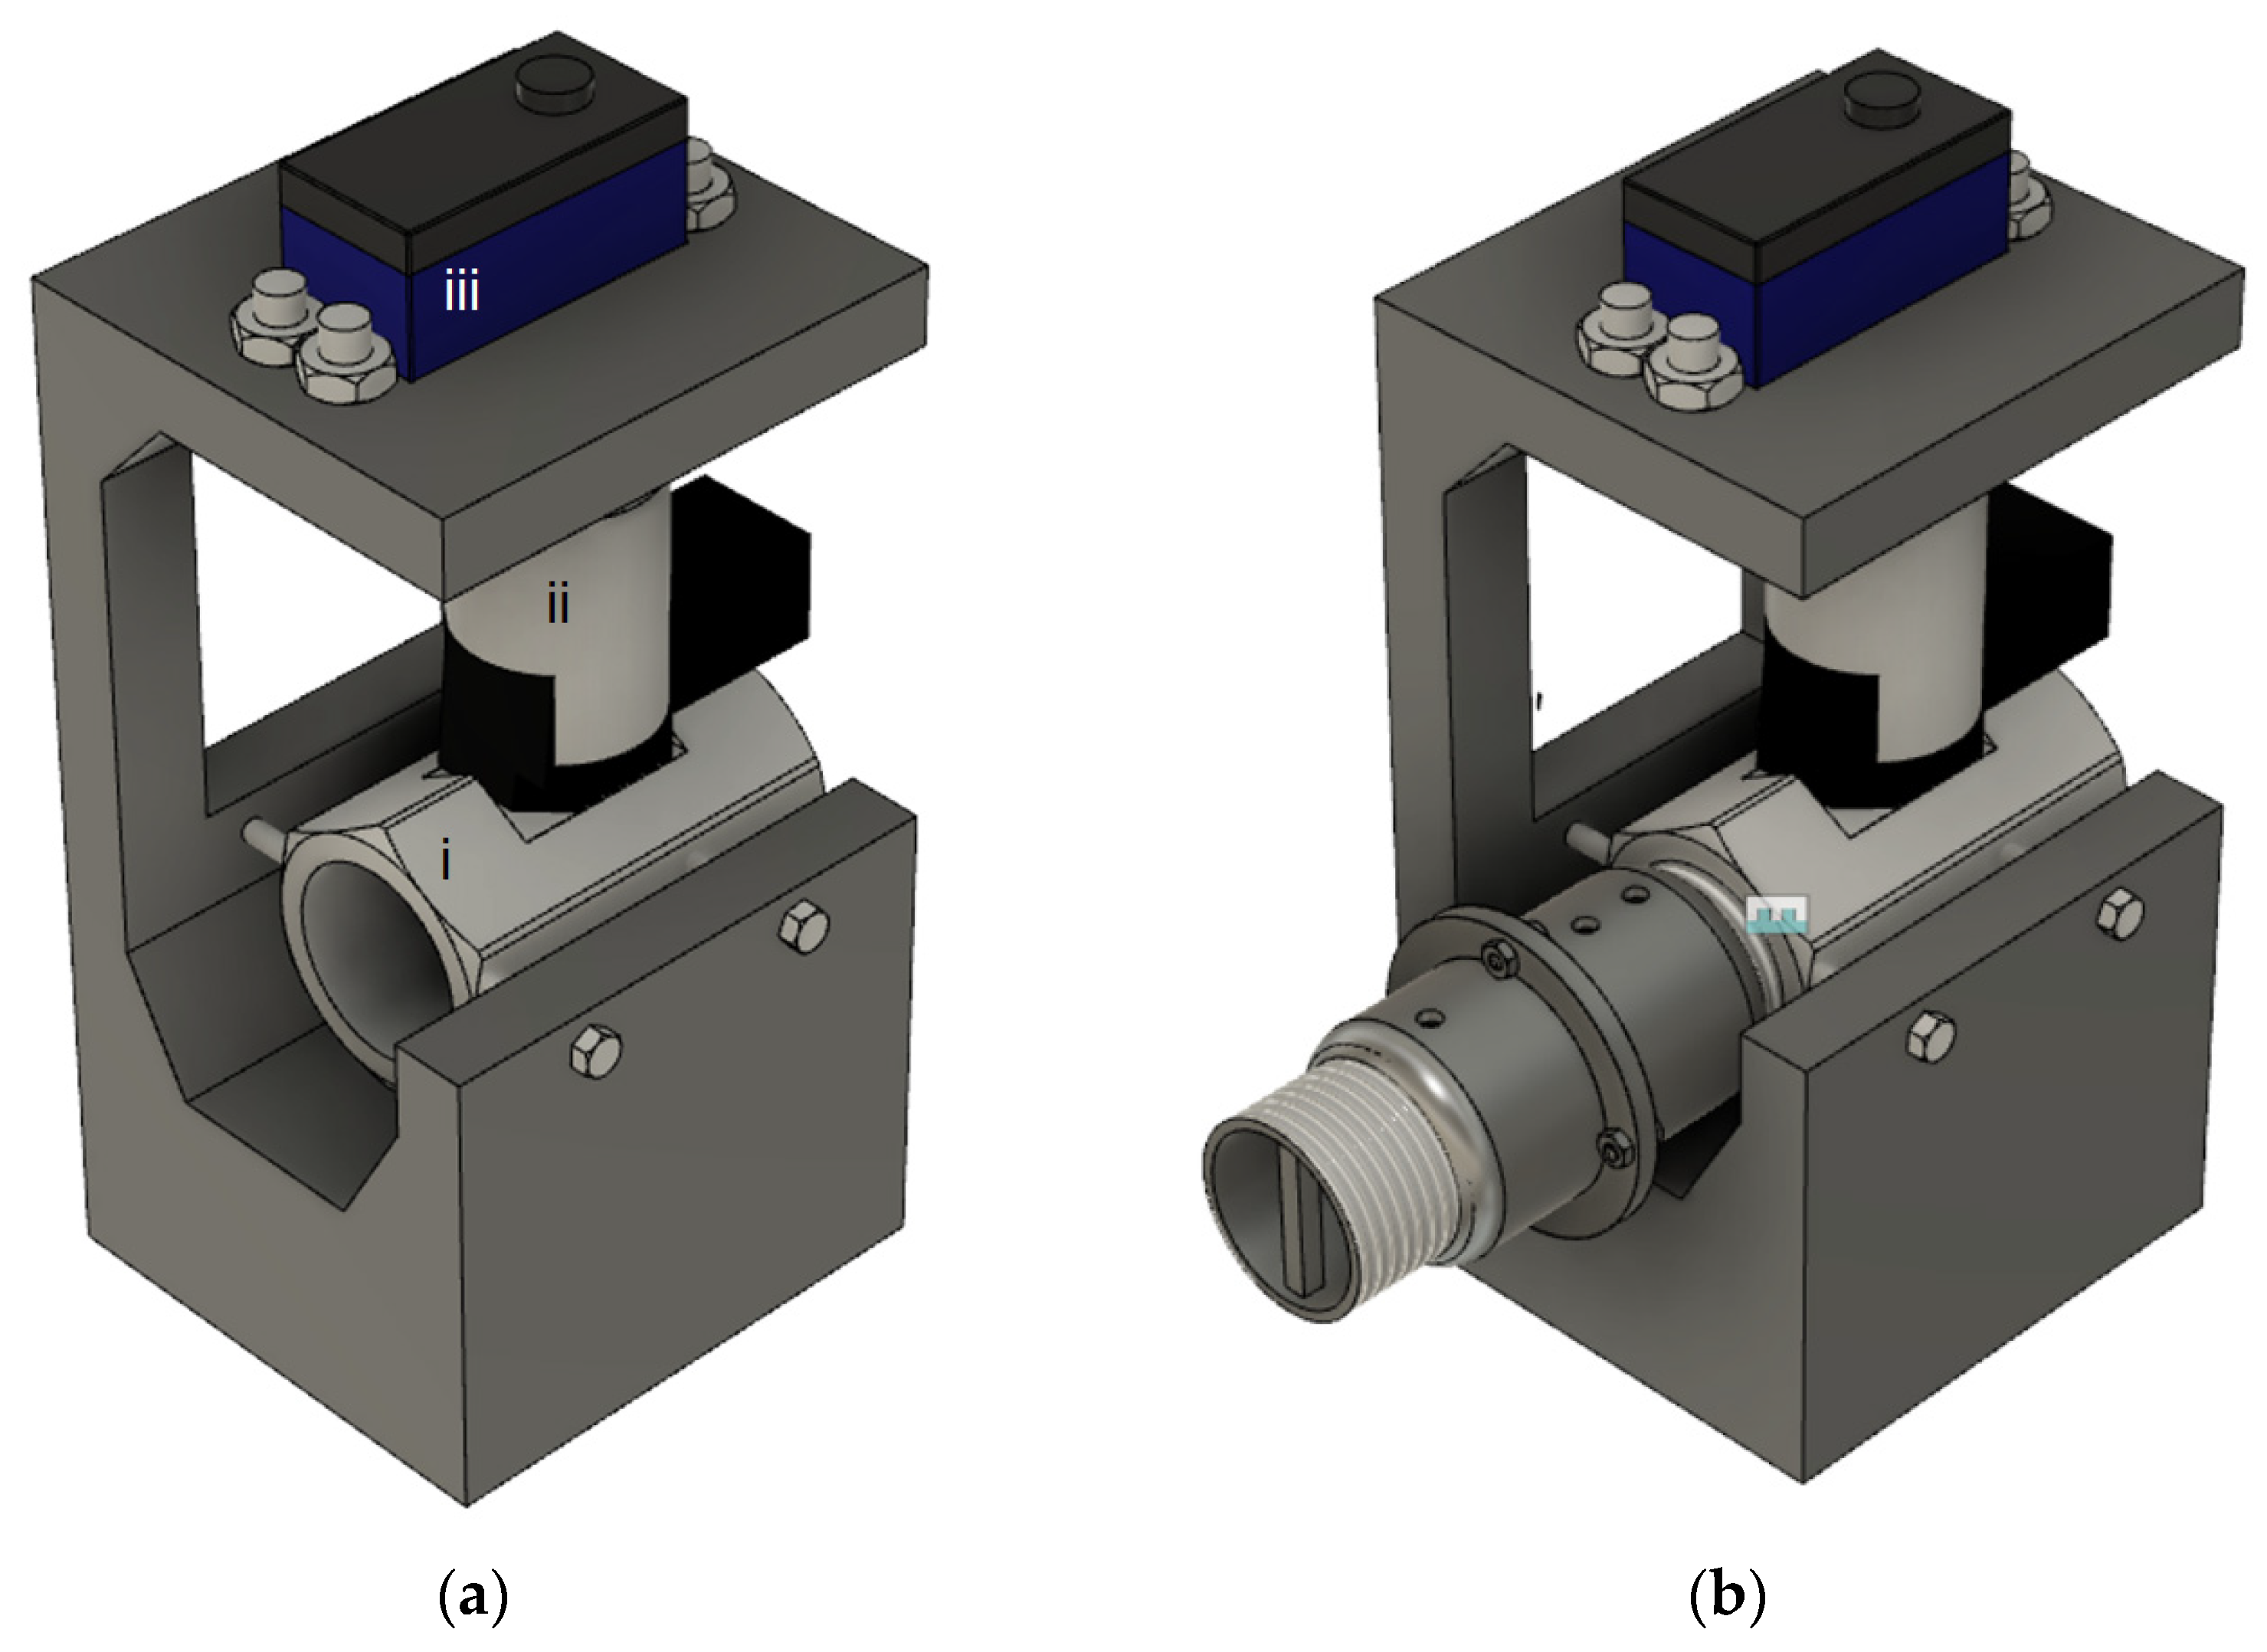
3.2.3. Proportion Flow Control Valve
3.2.4. Electronic Peep Valve
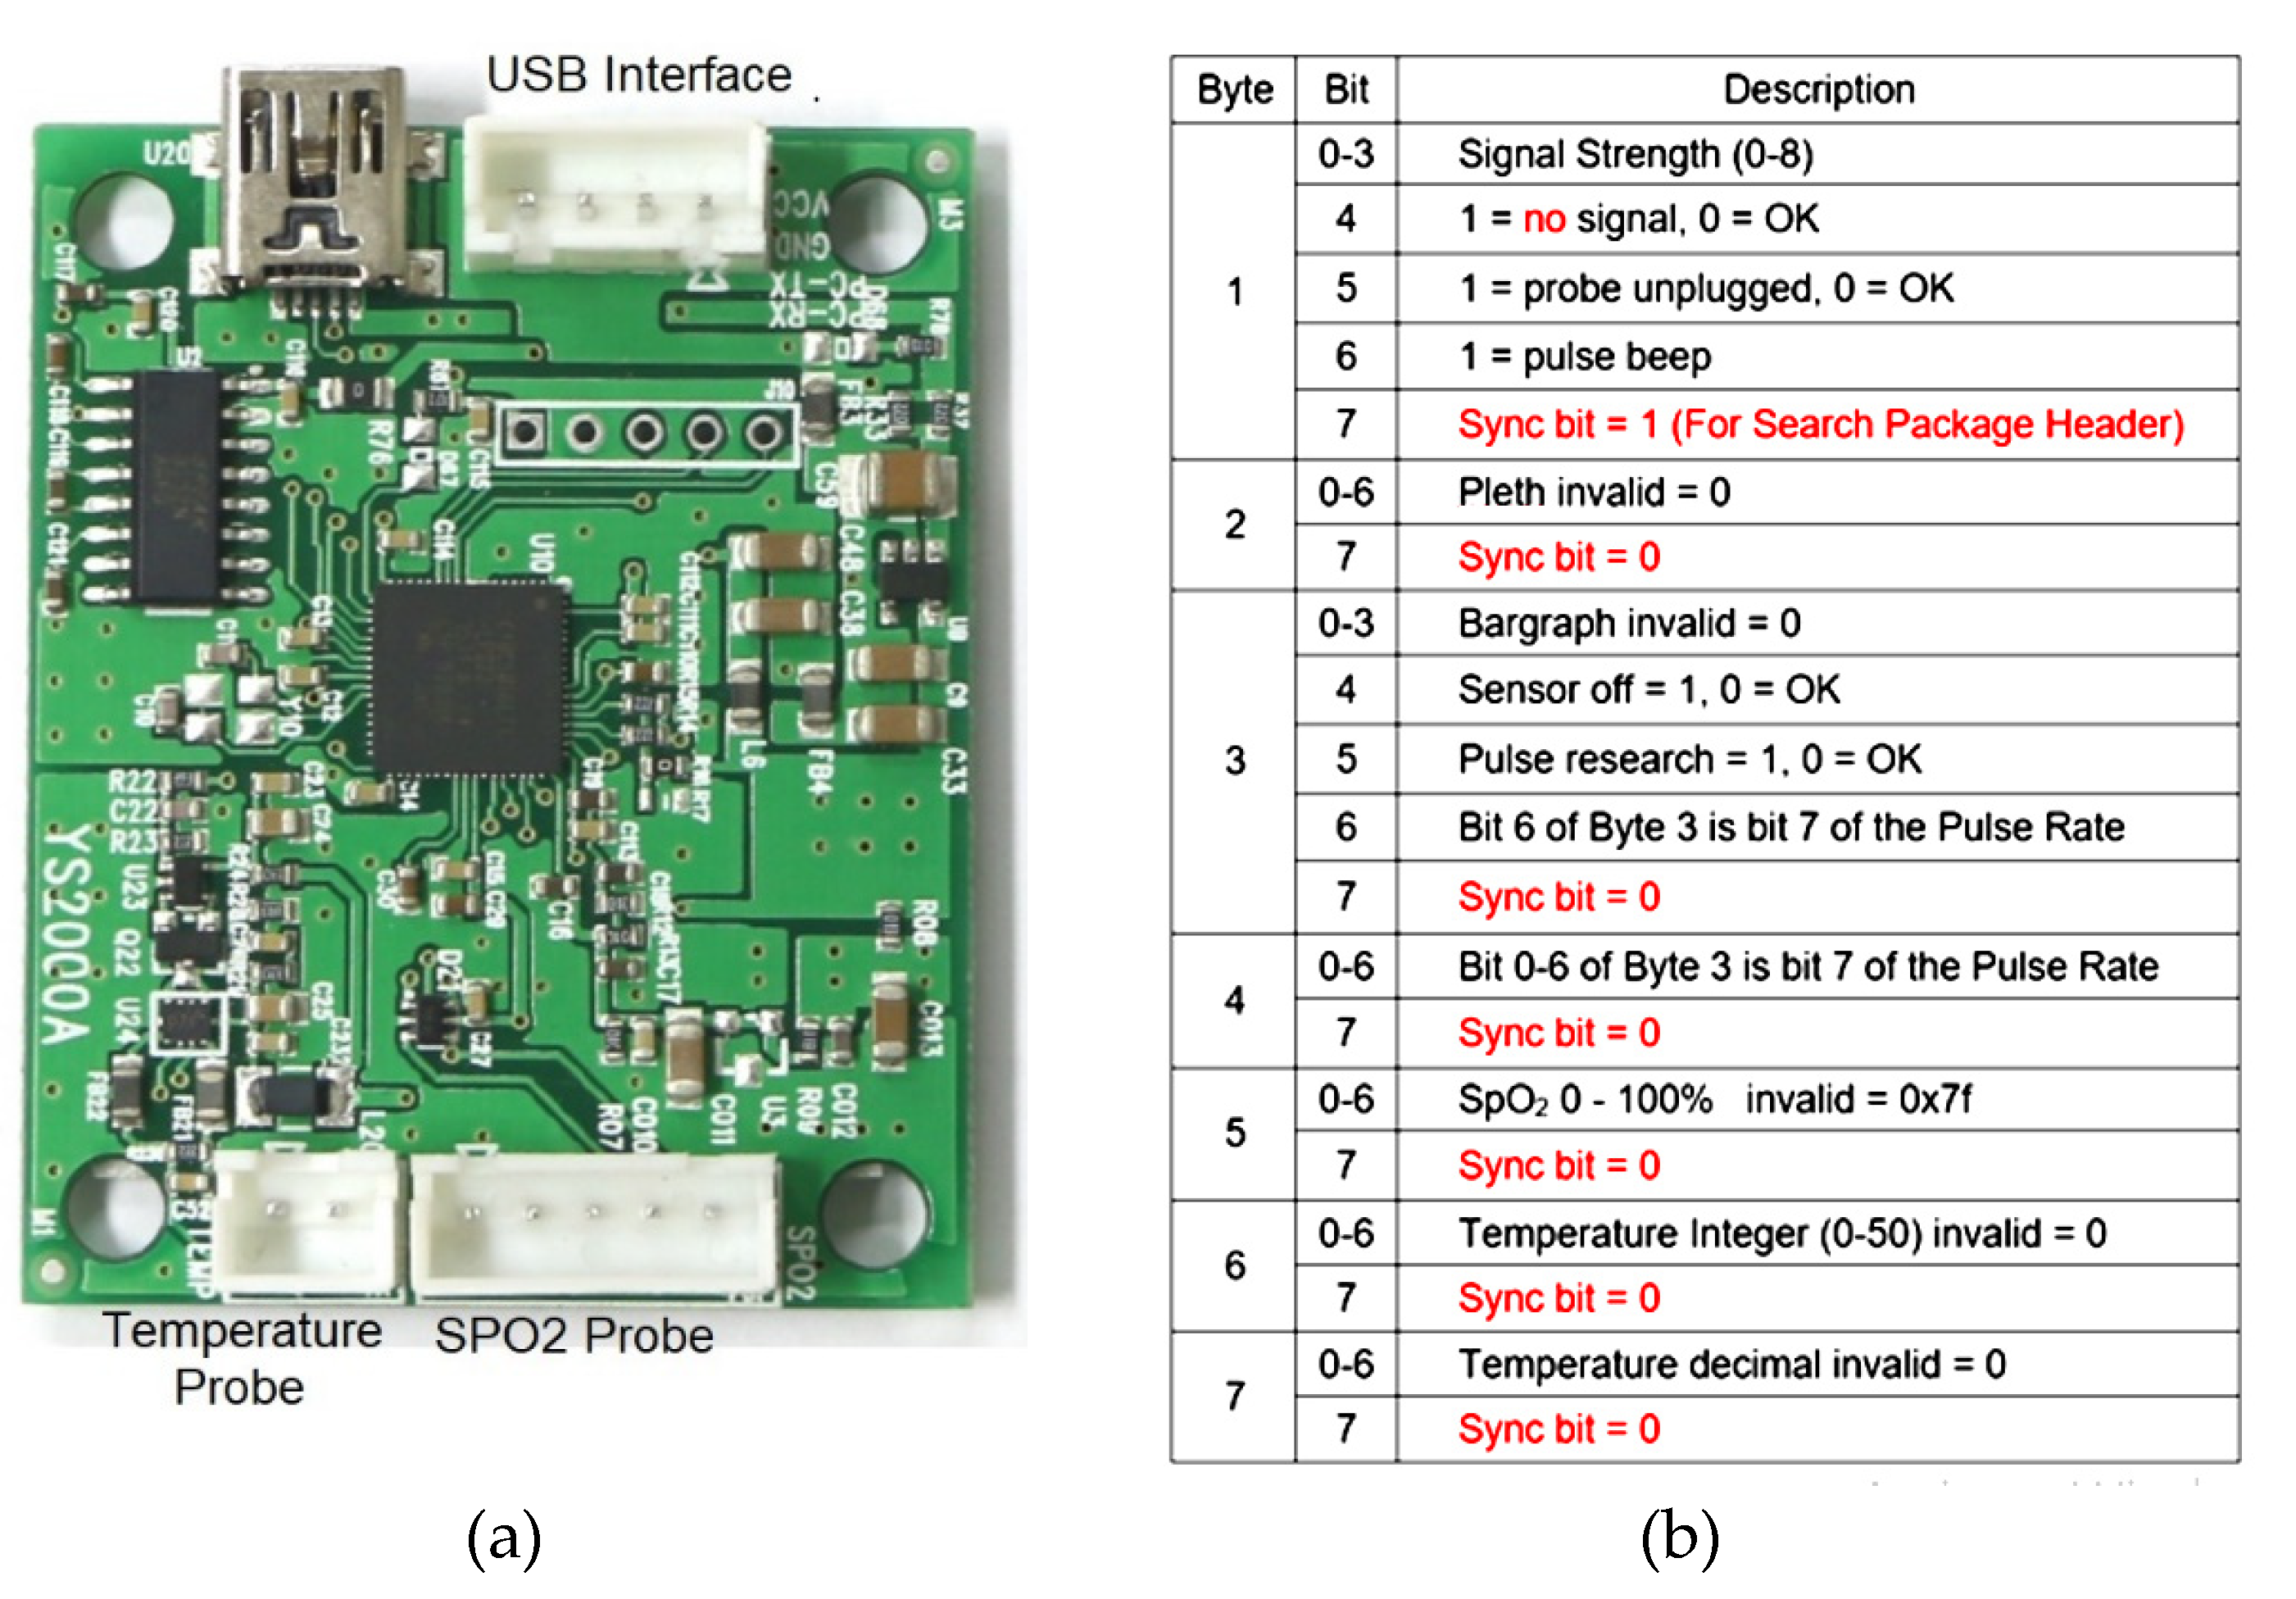
3.2.5. Pulse Oximeter
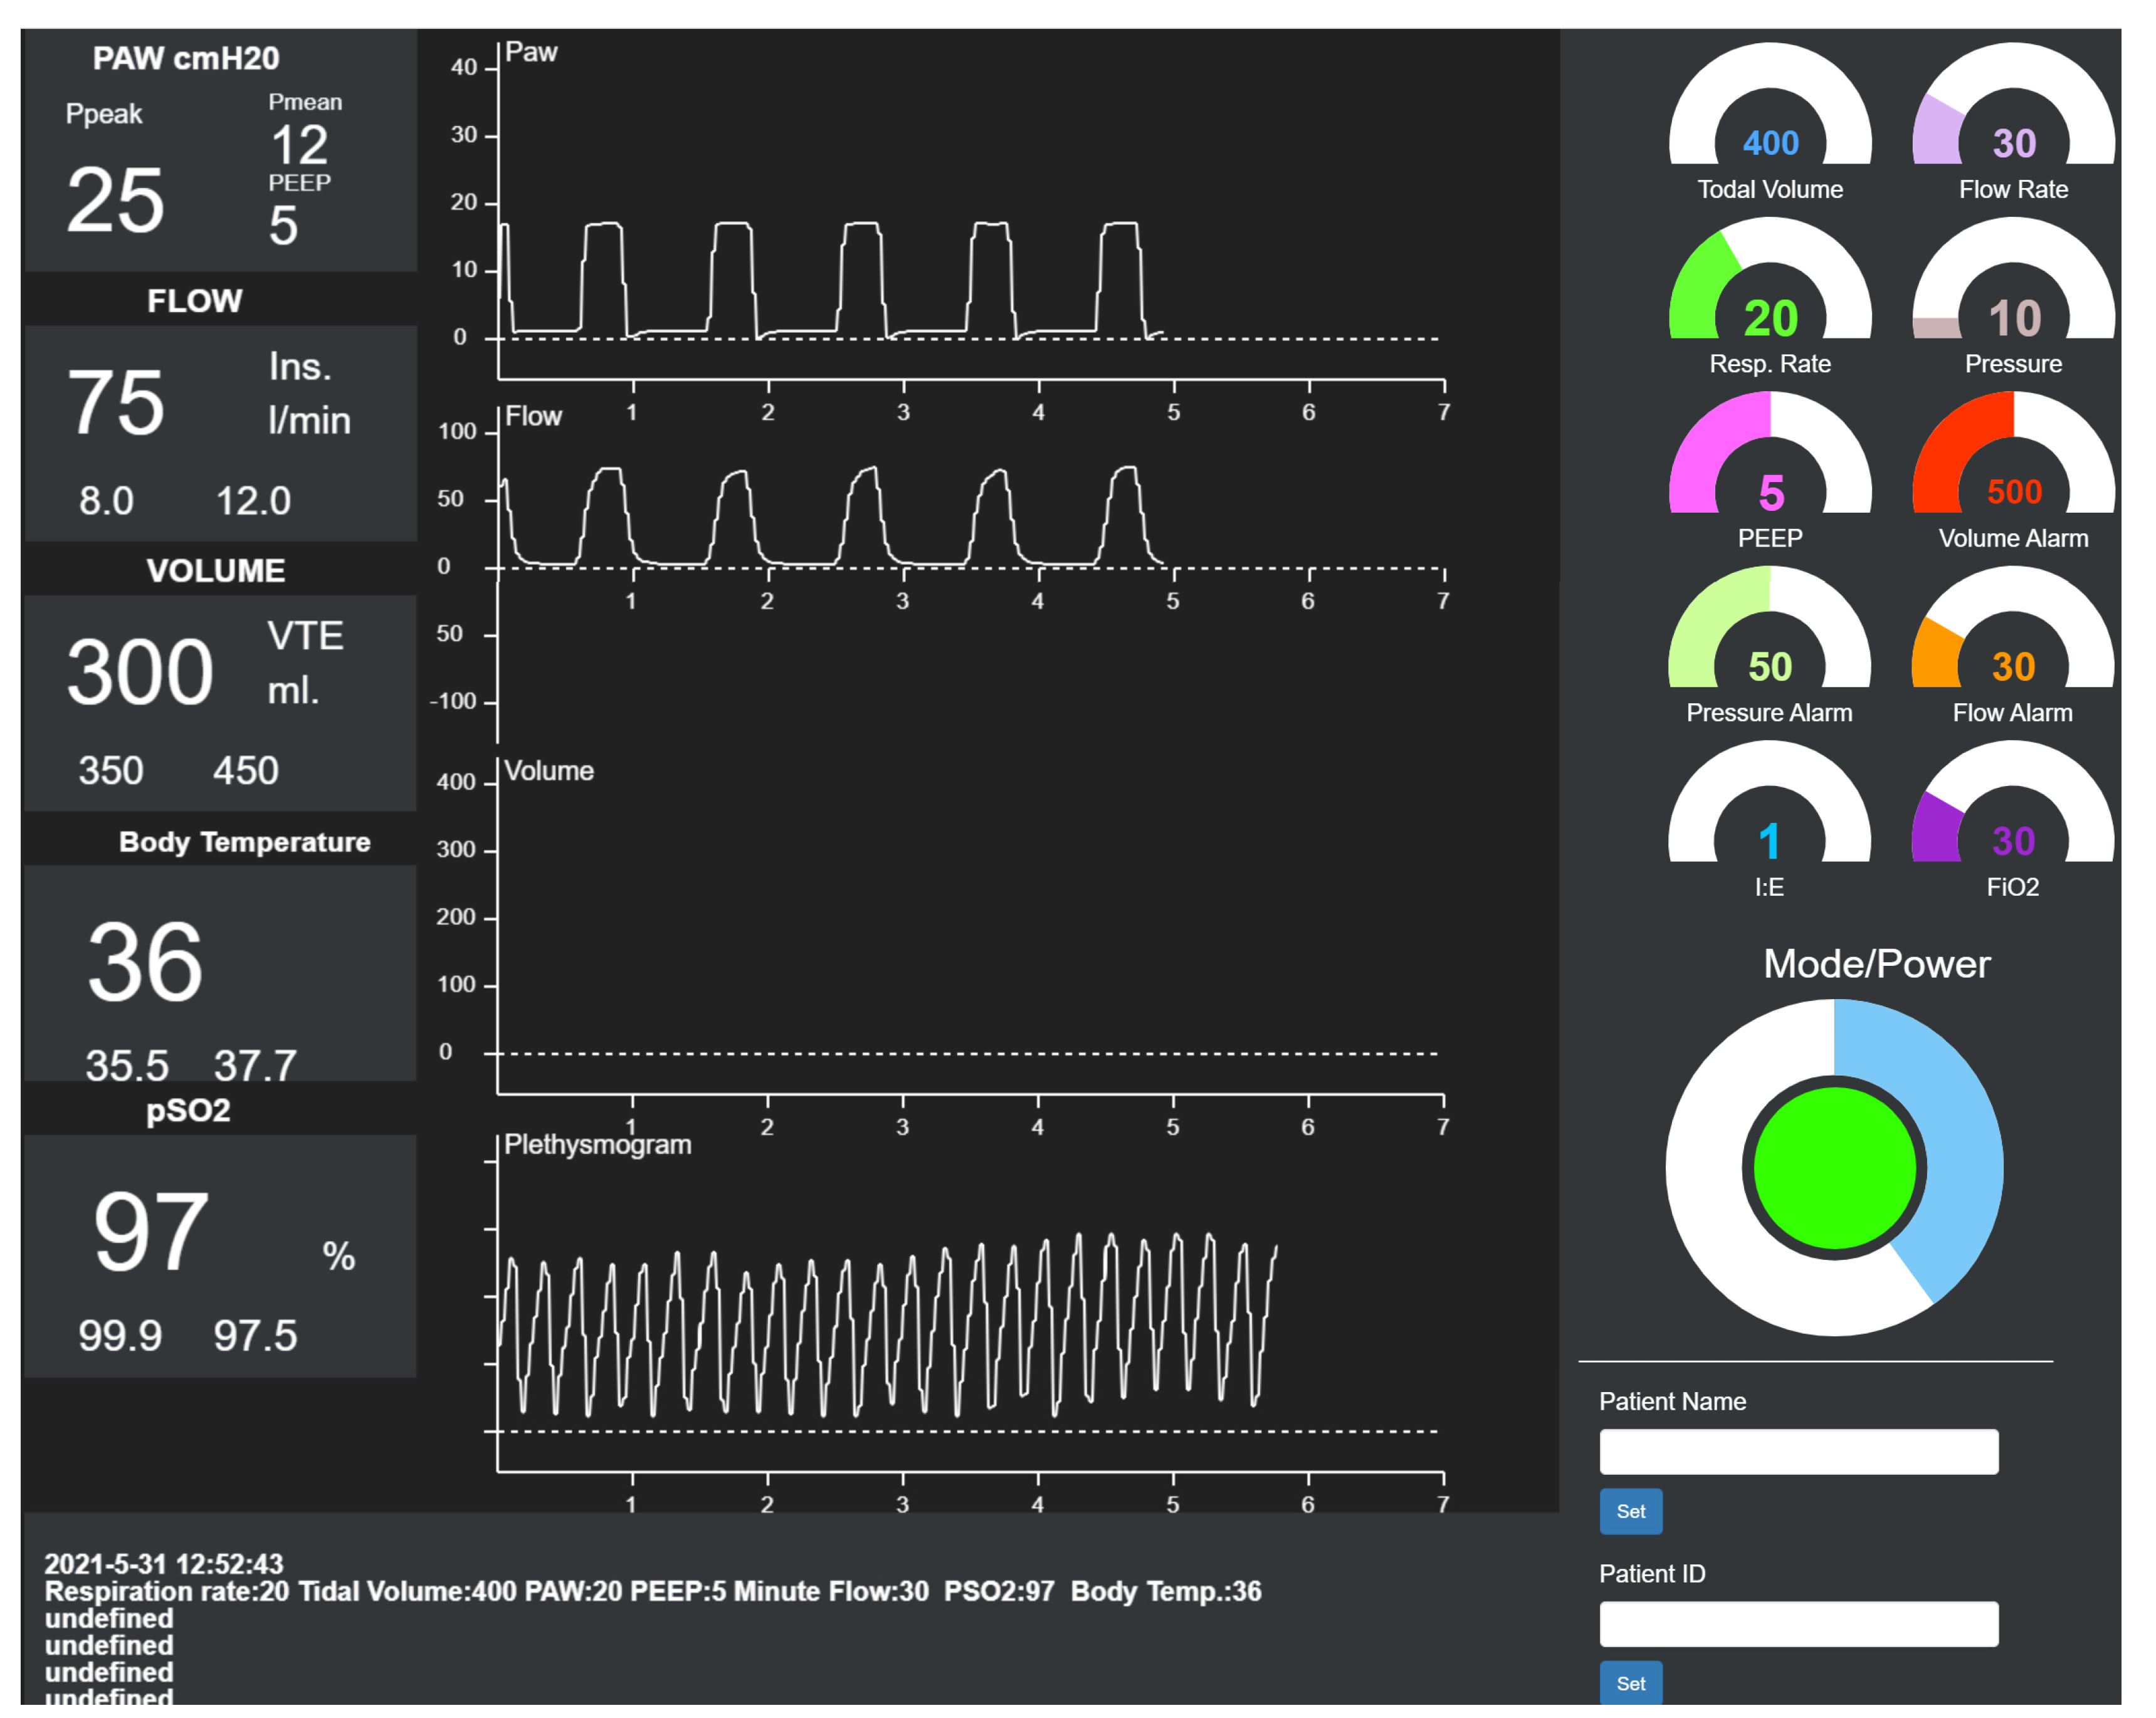
3.2.6. Ventilator Platform
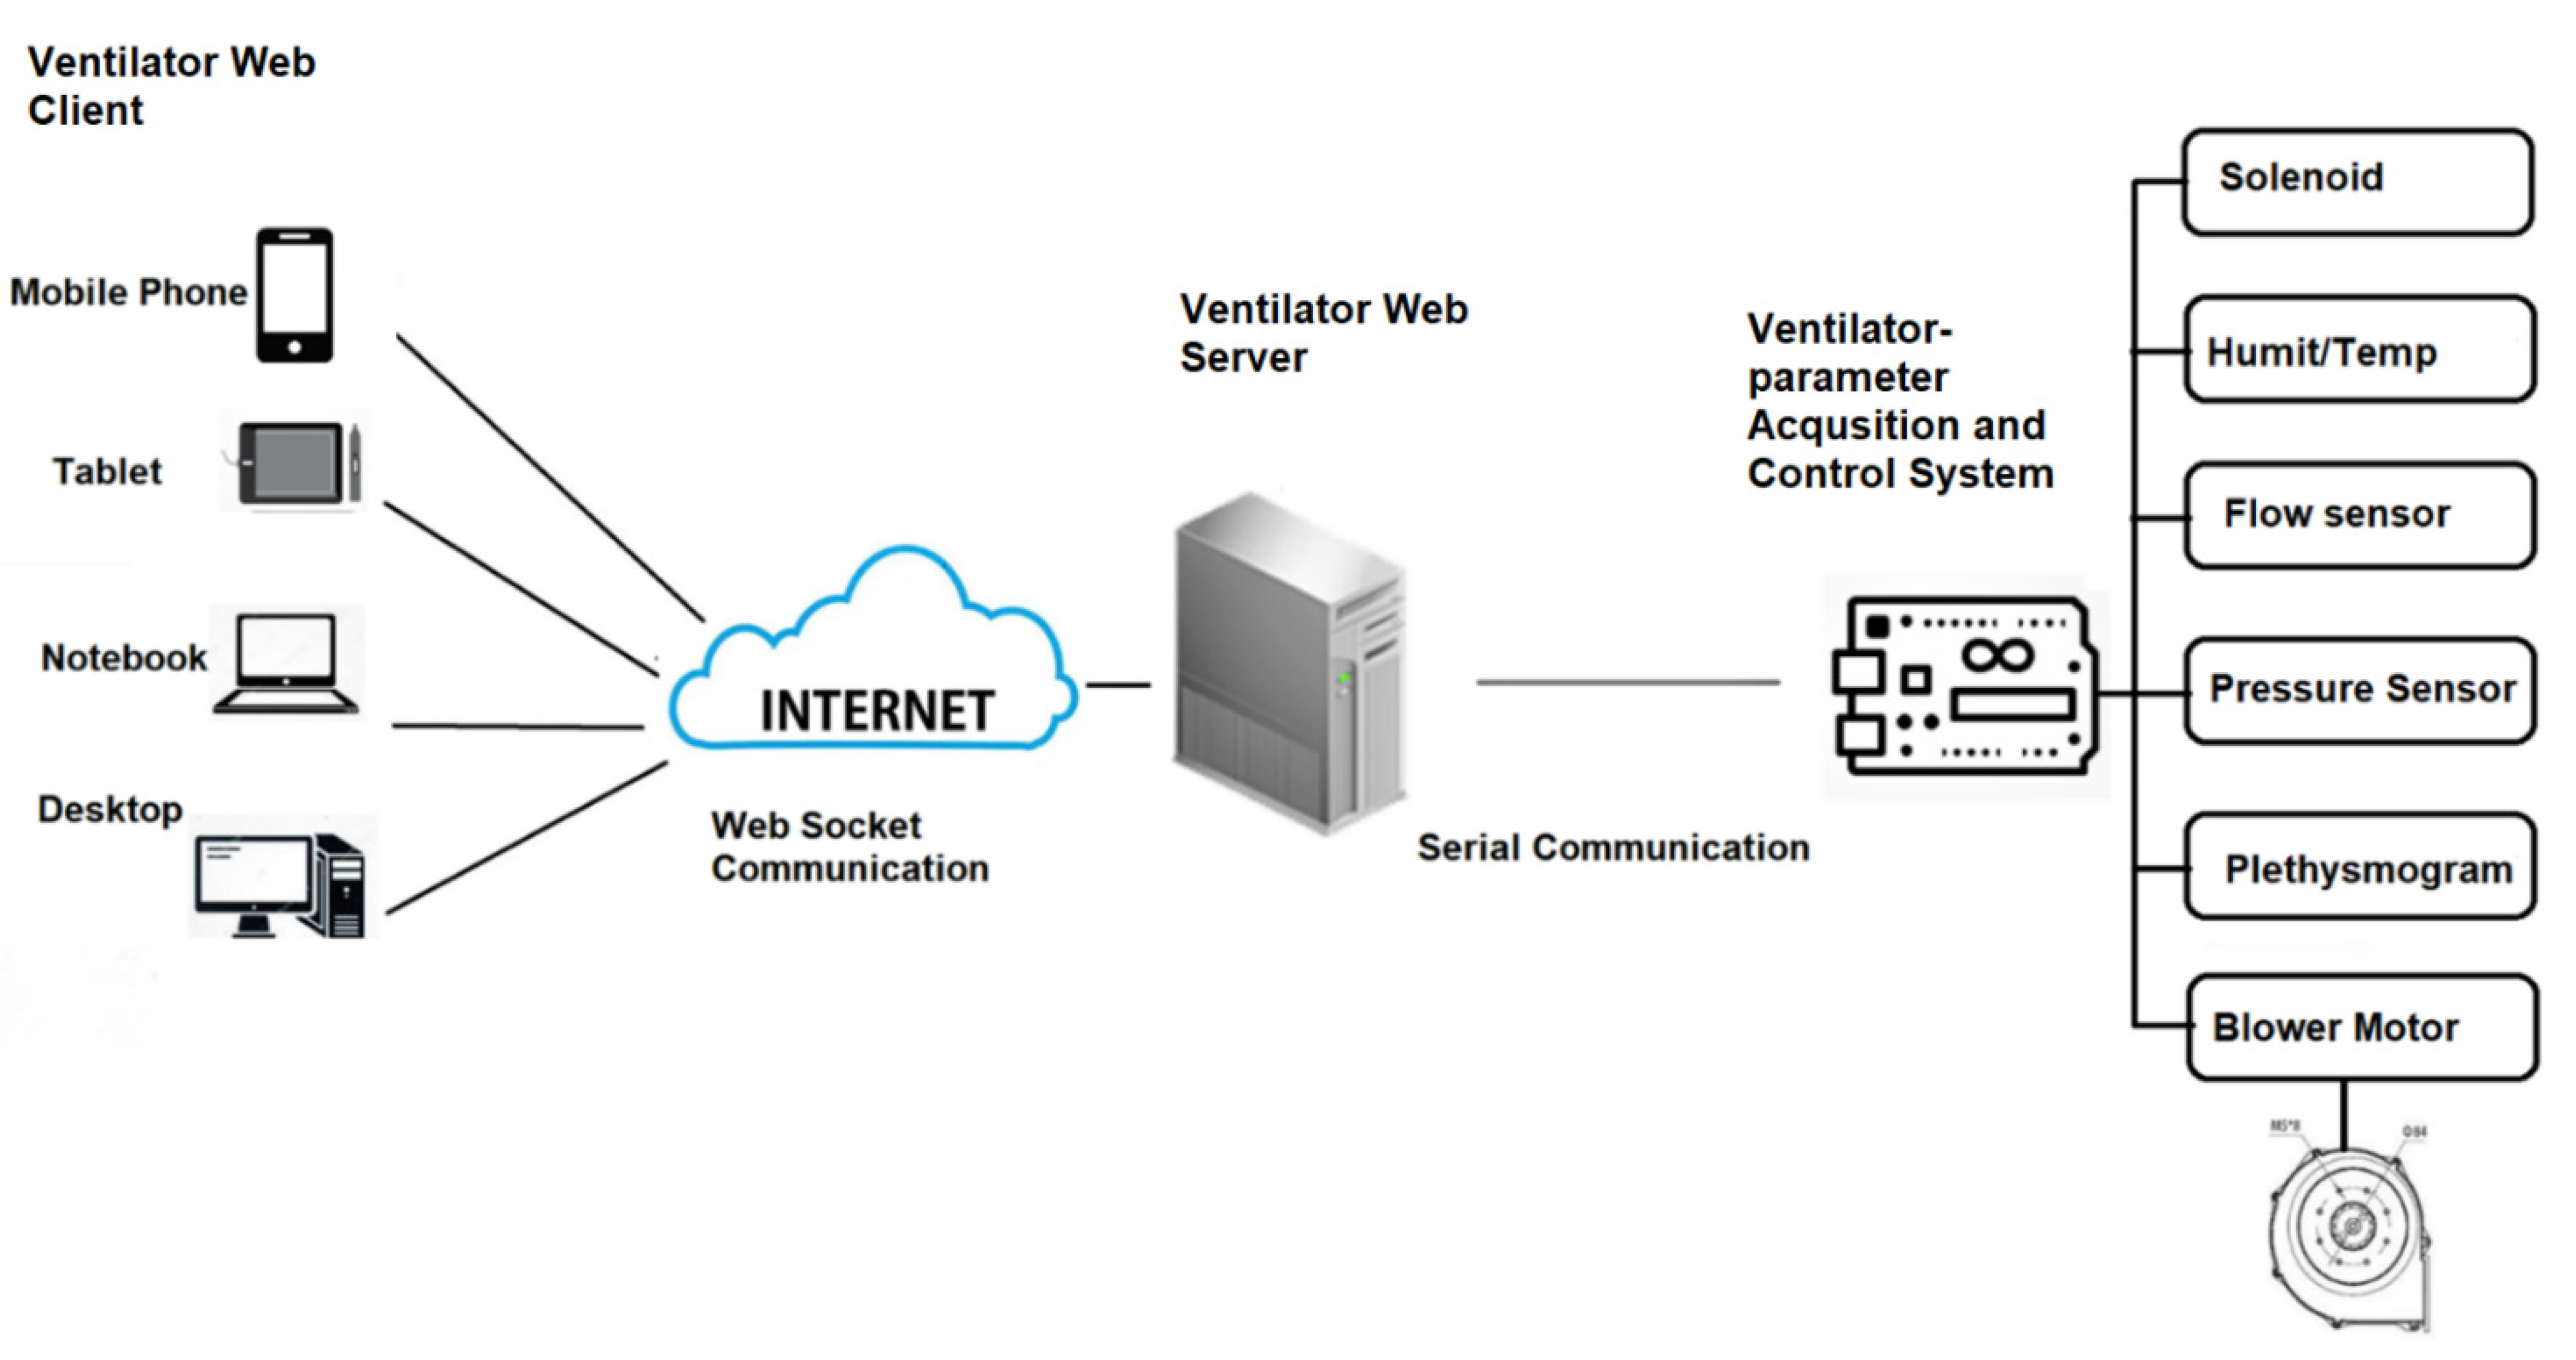
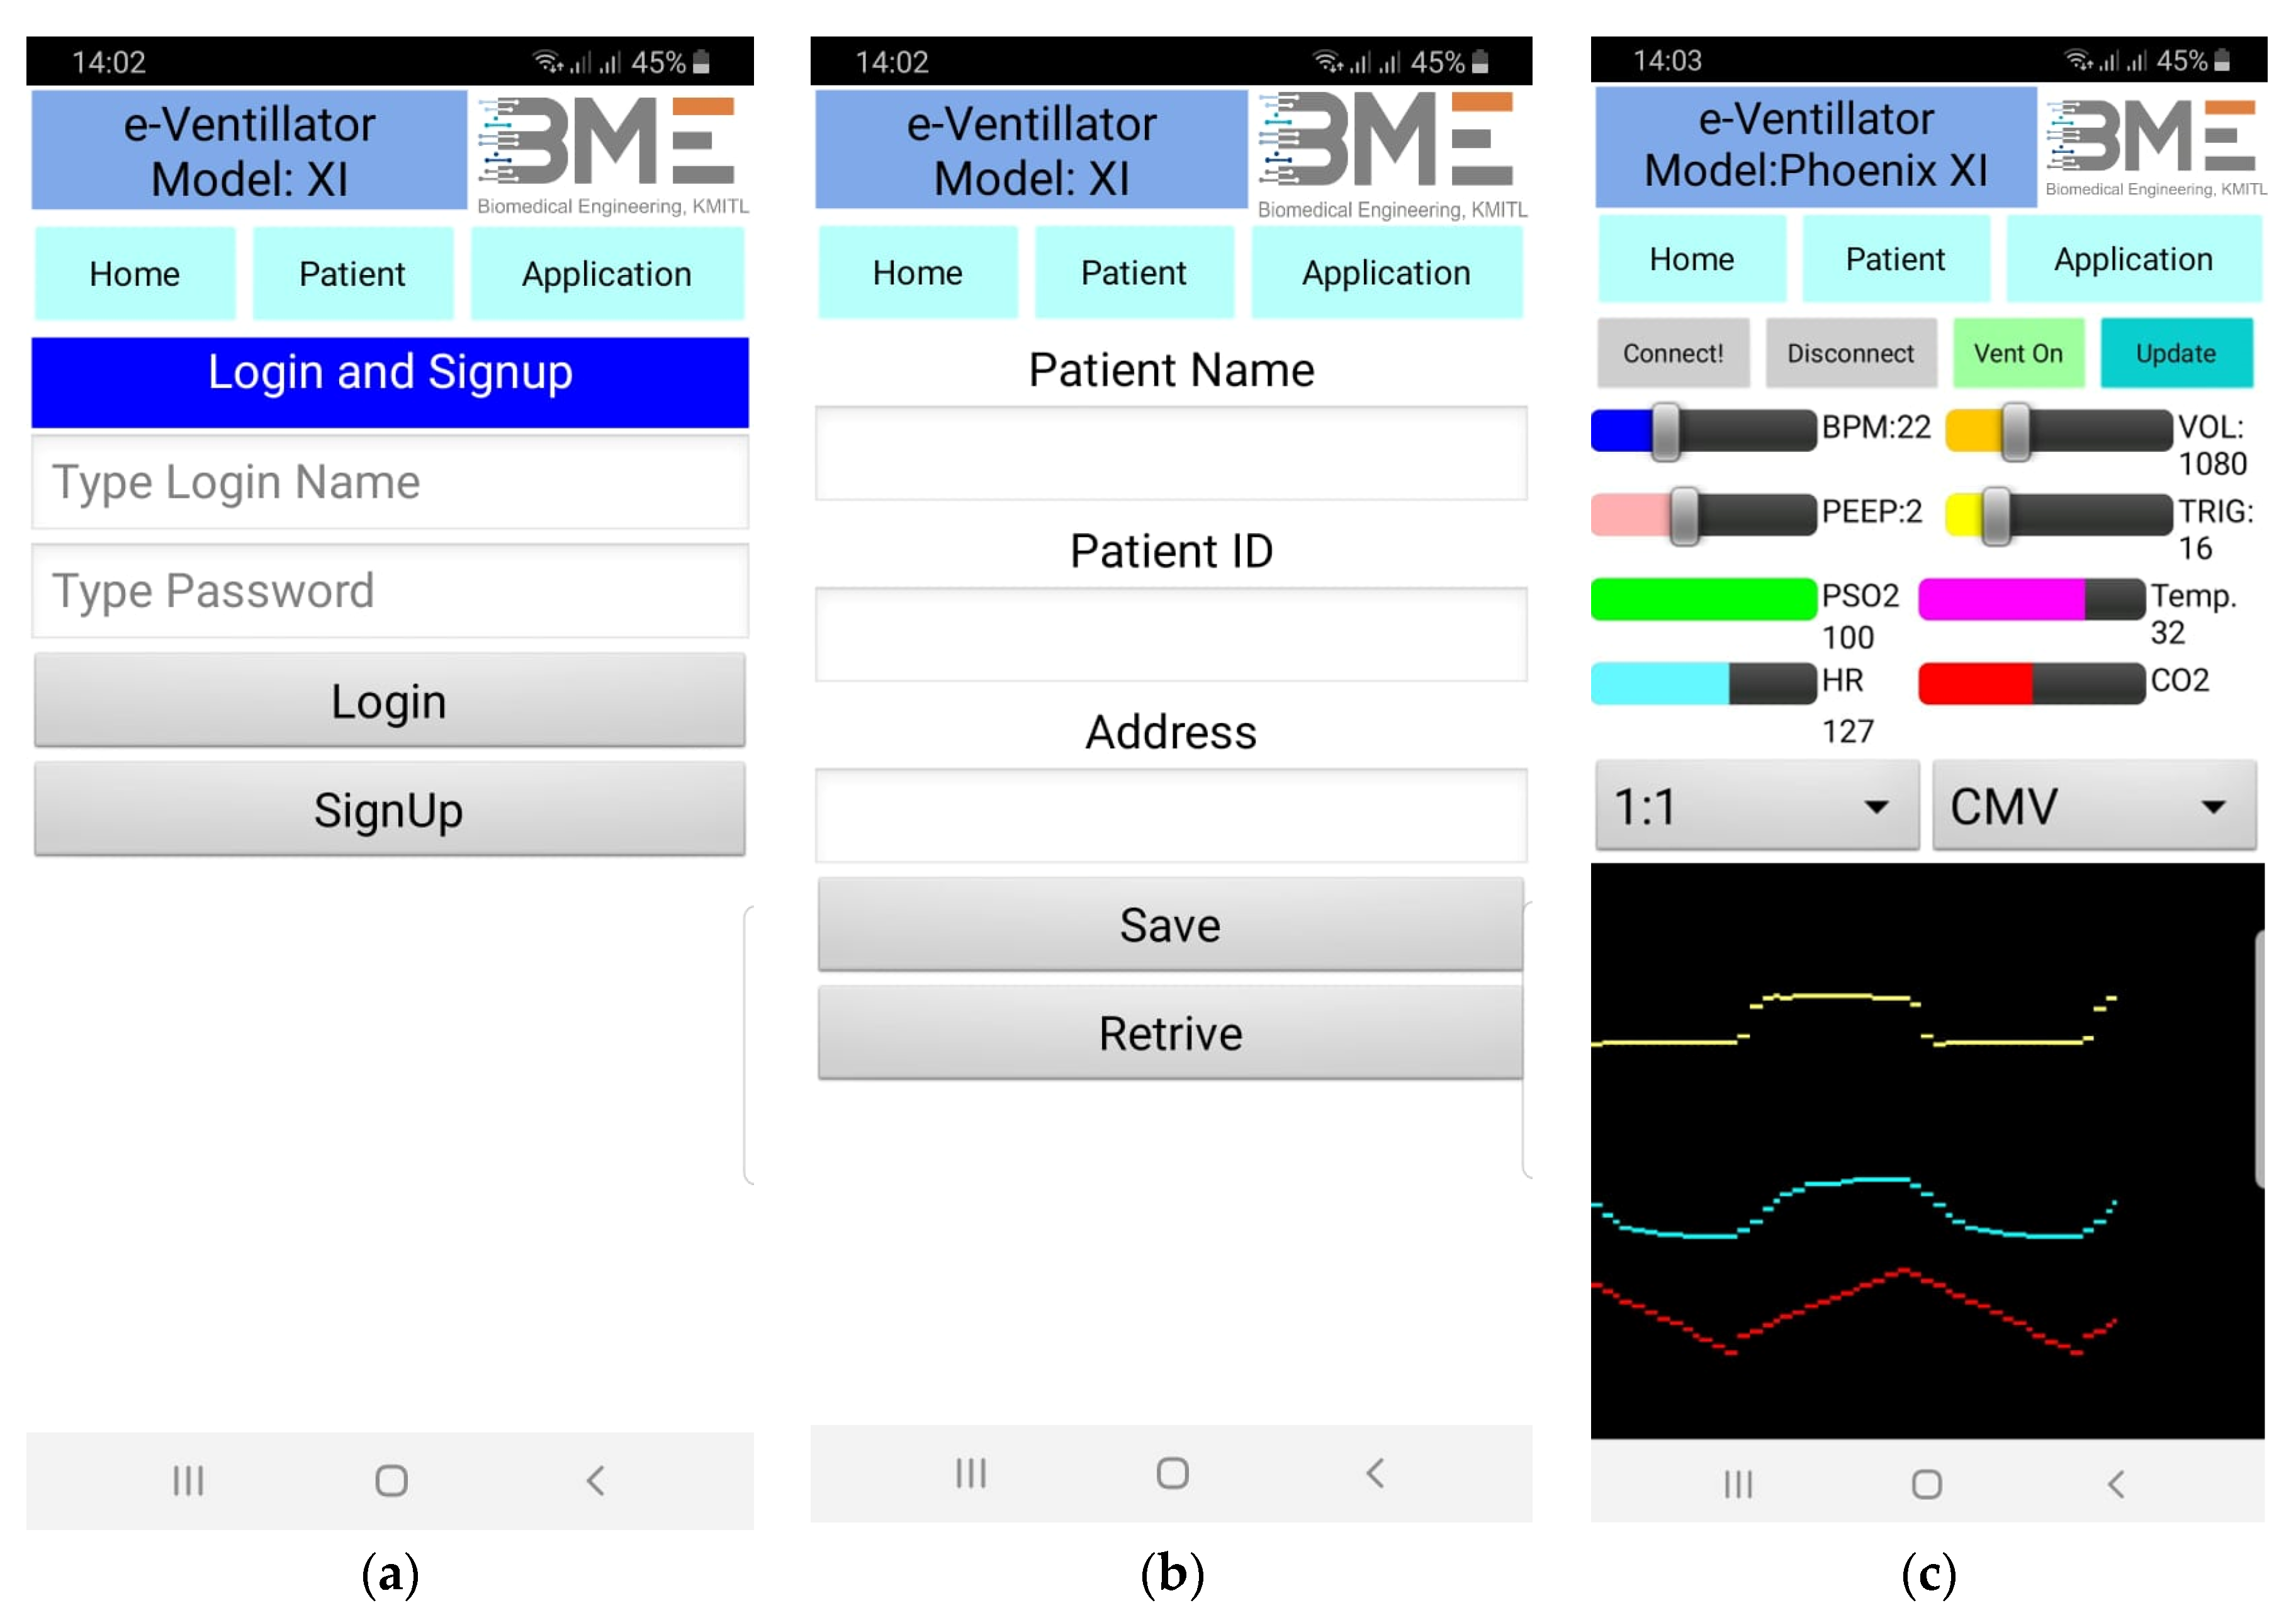
3.3. Ventilator Server for Remoted Control and Monitoring
- Step (i): Start serial communication protocol to establish serial communication with ventilator telemedicine acquisition system.
- Step (ii): Start the Web Socket package to prepare for client connection via the setting port.
- Step (iii): Wait for the client to connect.
- Step (iv): If the client connects, broadcast the received data and start the index.html file.
- Step (i): Prepare call-back function to run if there is data sent from the server by the Web Socket package.
- Step (ii): If data are received, encode the data into separated parameters.
3.4. Preprogramed Initial Setting for Blower-Based Ventilator
- Step (i):
- Input patient weight, height, and gender.
- Step (ii):
- Compute patient body weight by using the formula:
- -
- For females: PBW (kg) = 45.5 + 0.91 × (height (cm) = 152.4);
- -
- For males: PBW (kg) = 50 + 0.91 × (height (cm) = 152.4).
- Step (iii):
- Set initial pressure 5–10 cmH2O. The initial tidal volume should be observed at 6 mL/kg PBW (not being set directly).
- Step (iv):
- Set the initial respiratory rate as 10–20 breaths per minute.(Most often, the setting is between 14 and 22 breaths/minute.) With initial inspiration time at 0.7–1.0 s.
- Step (v):
- Set PEEP and FiO2 by using SpO2 shown in Table 2.
- Step (vi):
- The ventilator is running at the setting parameter.

| SpO2 | 91% | 92% | 93% | 94% | 95% |
| FiO2 (%) | 70 | 60 | 50 | 40 | 30 |
| PEEP (cmH2O) | 12 | 10 | 9 | 7 | 5 |
3.5. Ventilator Mode
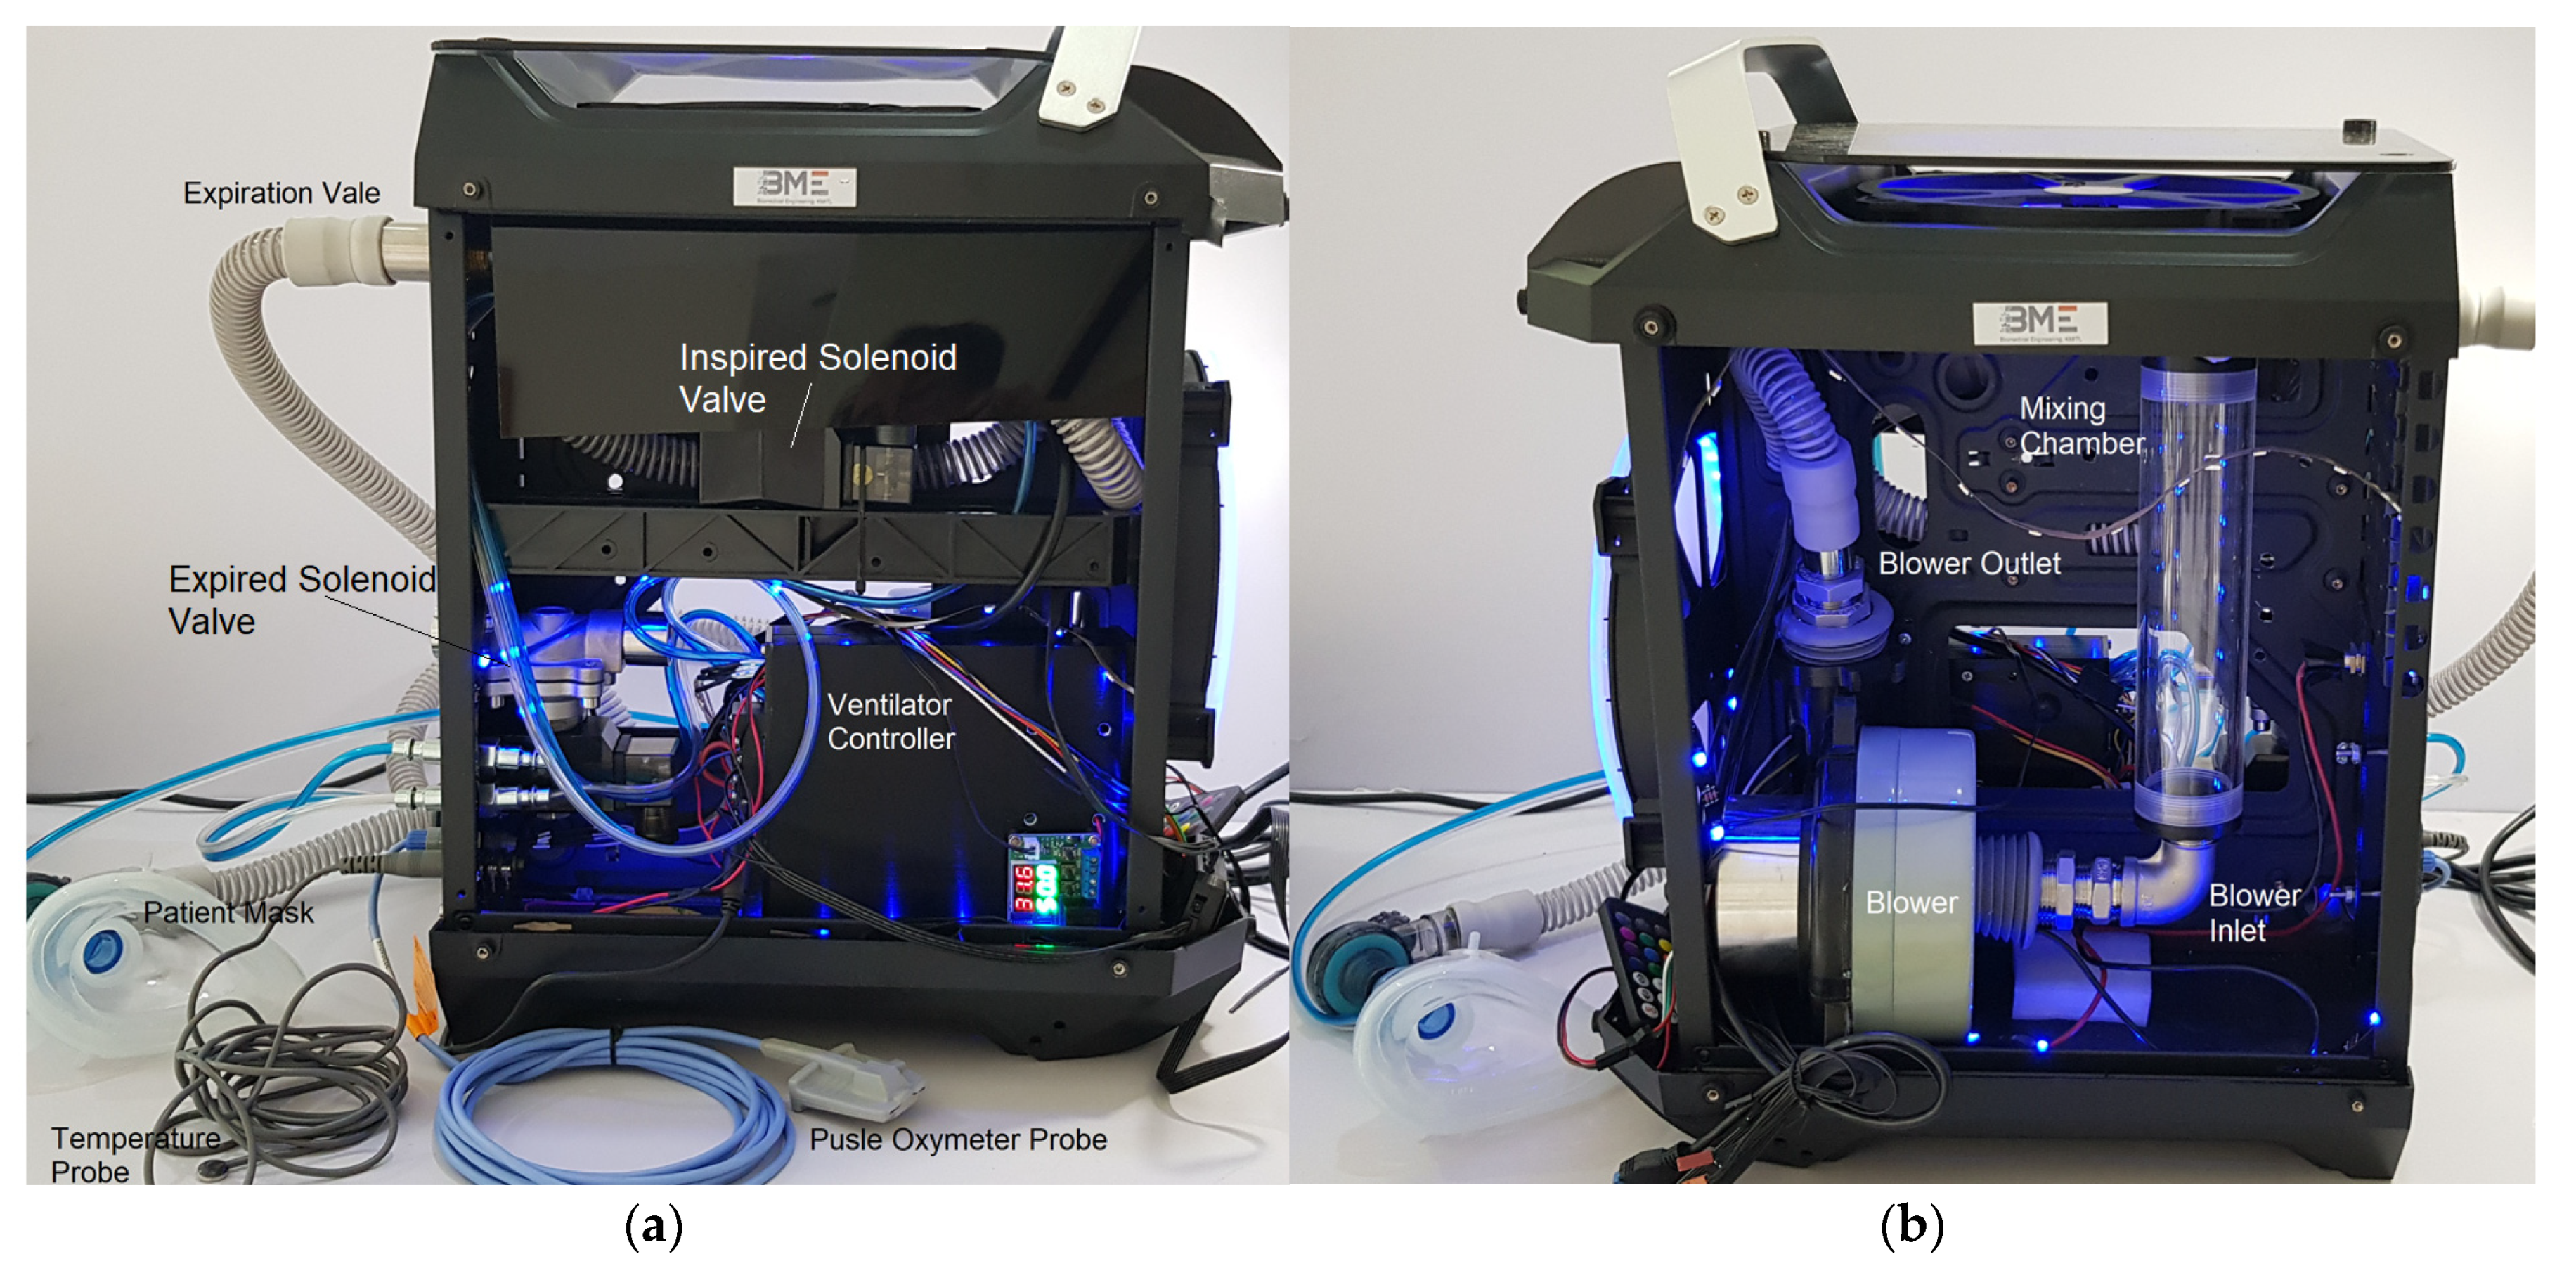
3.6. Ventilator Chassis and Assemble
3.7. Ventilator Model
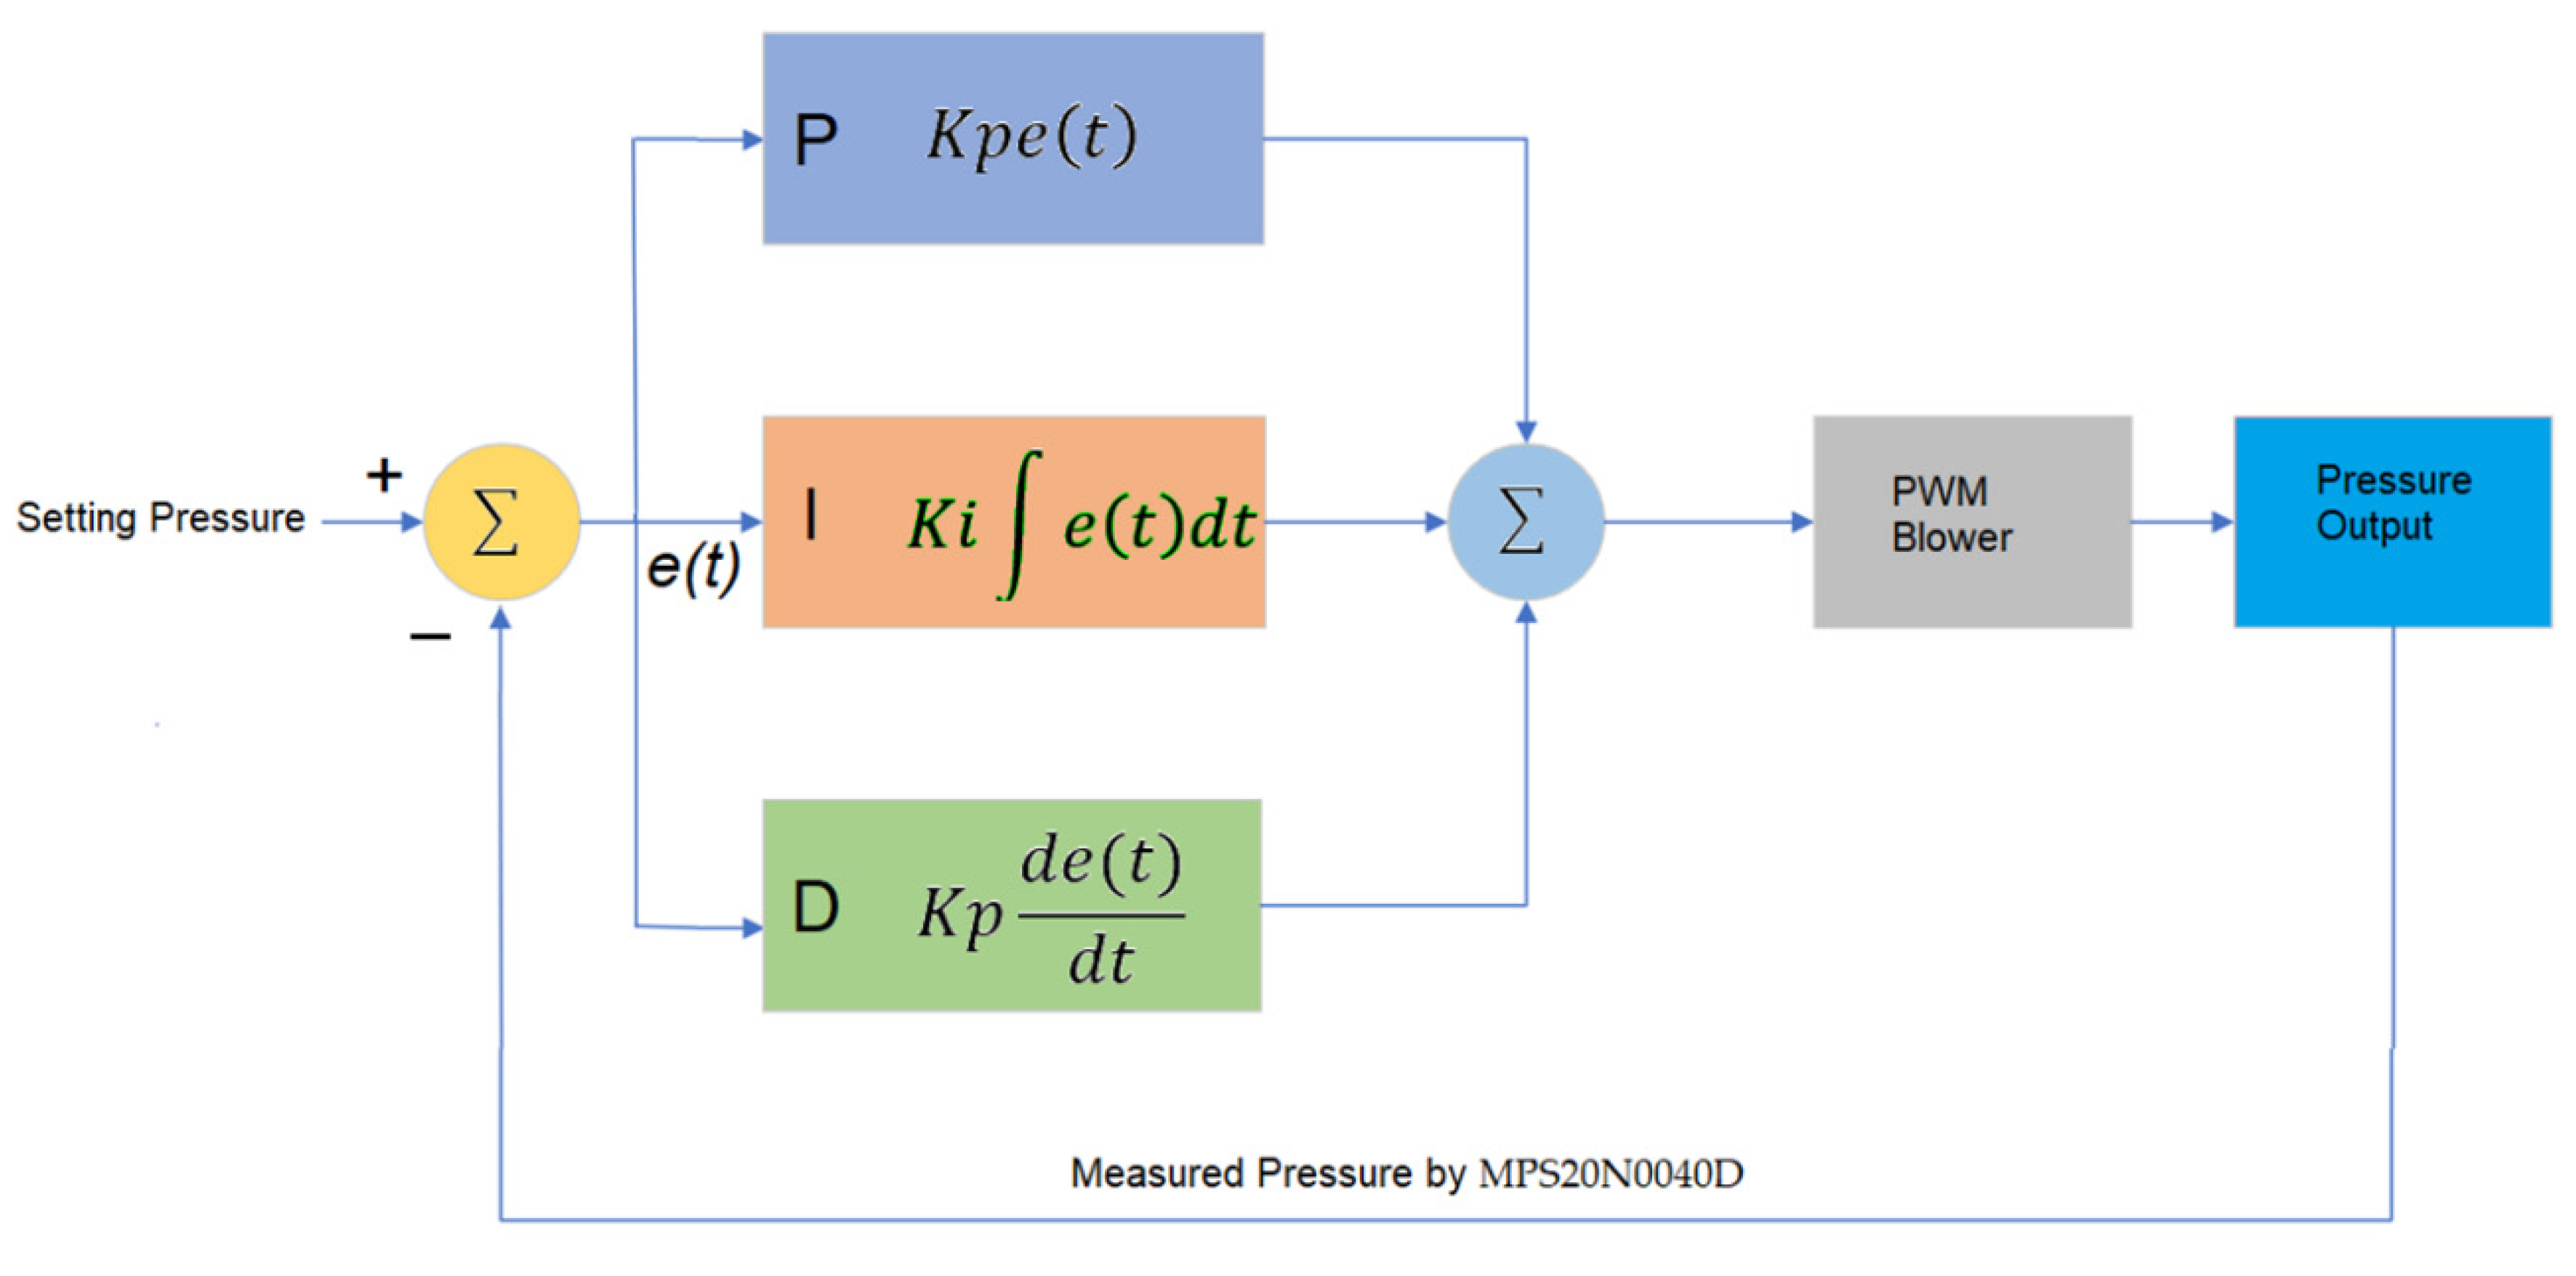
3.8. Pressure Control Algorithm
4. Experiments and Results
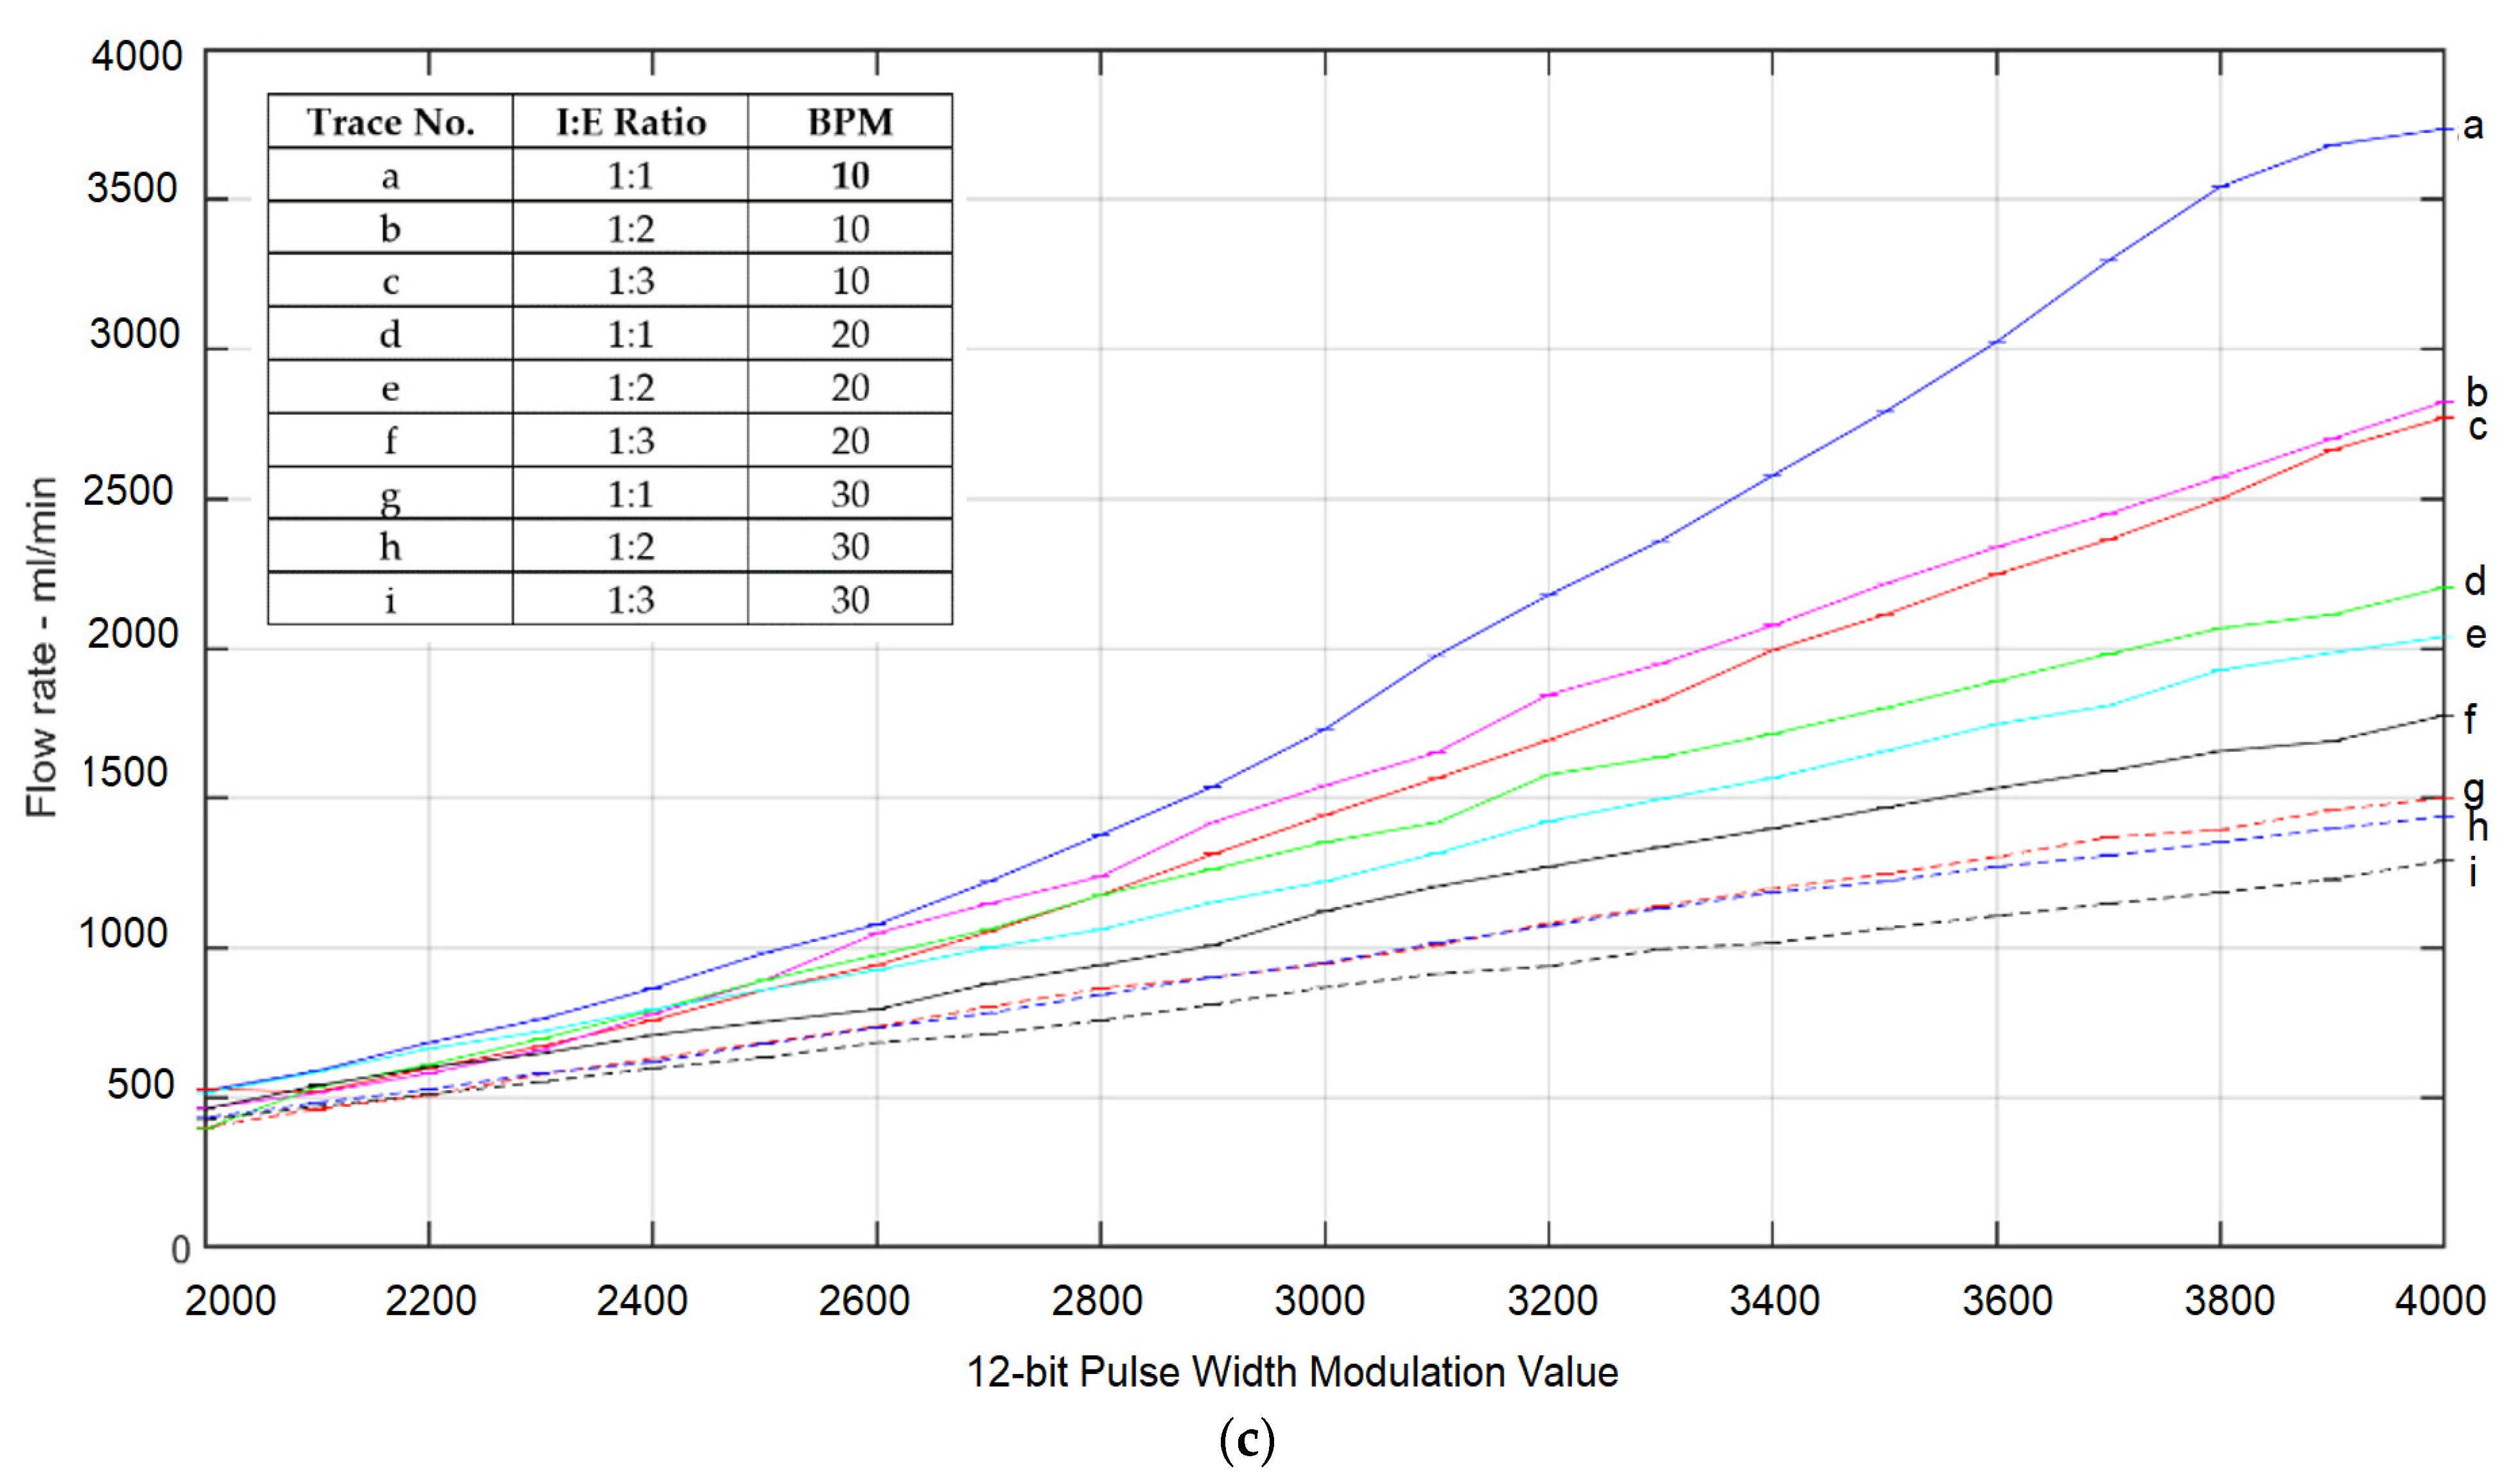
4.1. PWM-Tidal Volume, PWM-Minute Volume, and PWM-Flowrate Calibration
4.2. Ventilator Timing Test
- (i)
- Check if command setting parameters are send from sensor microcontroller. If there is sending parameters, adjust blower-controlled parameter accordingly. Important blower-controlled parameters include blower speed (PWM), inspired time and expired time, and ON/OFF command.
- (ii)
- Turn on blower of which speed is set by PWM if ON/OFF command is ON. If ON/OFF command is OFF, turn off blower.
- (iii)
- Turn on inspired solenoid valve and turn off expired solenoid valve with duration setting by inspired time.
- (iv)
- Turn off inspired solenoid valve and turn off expired solenoid valve with duration setting by expired time.
- (v)
- Go back to Step (i).
4.3. Pressure and Flowrate Sensing Accuracy Testing
- (i)
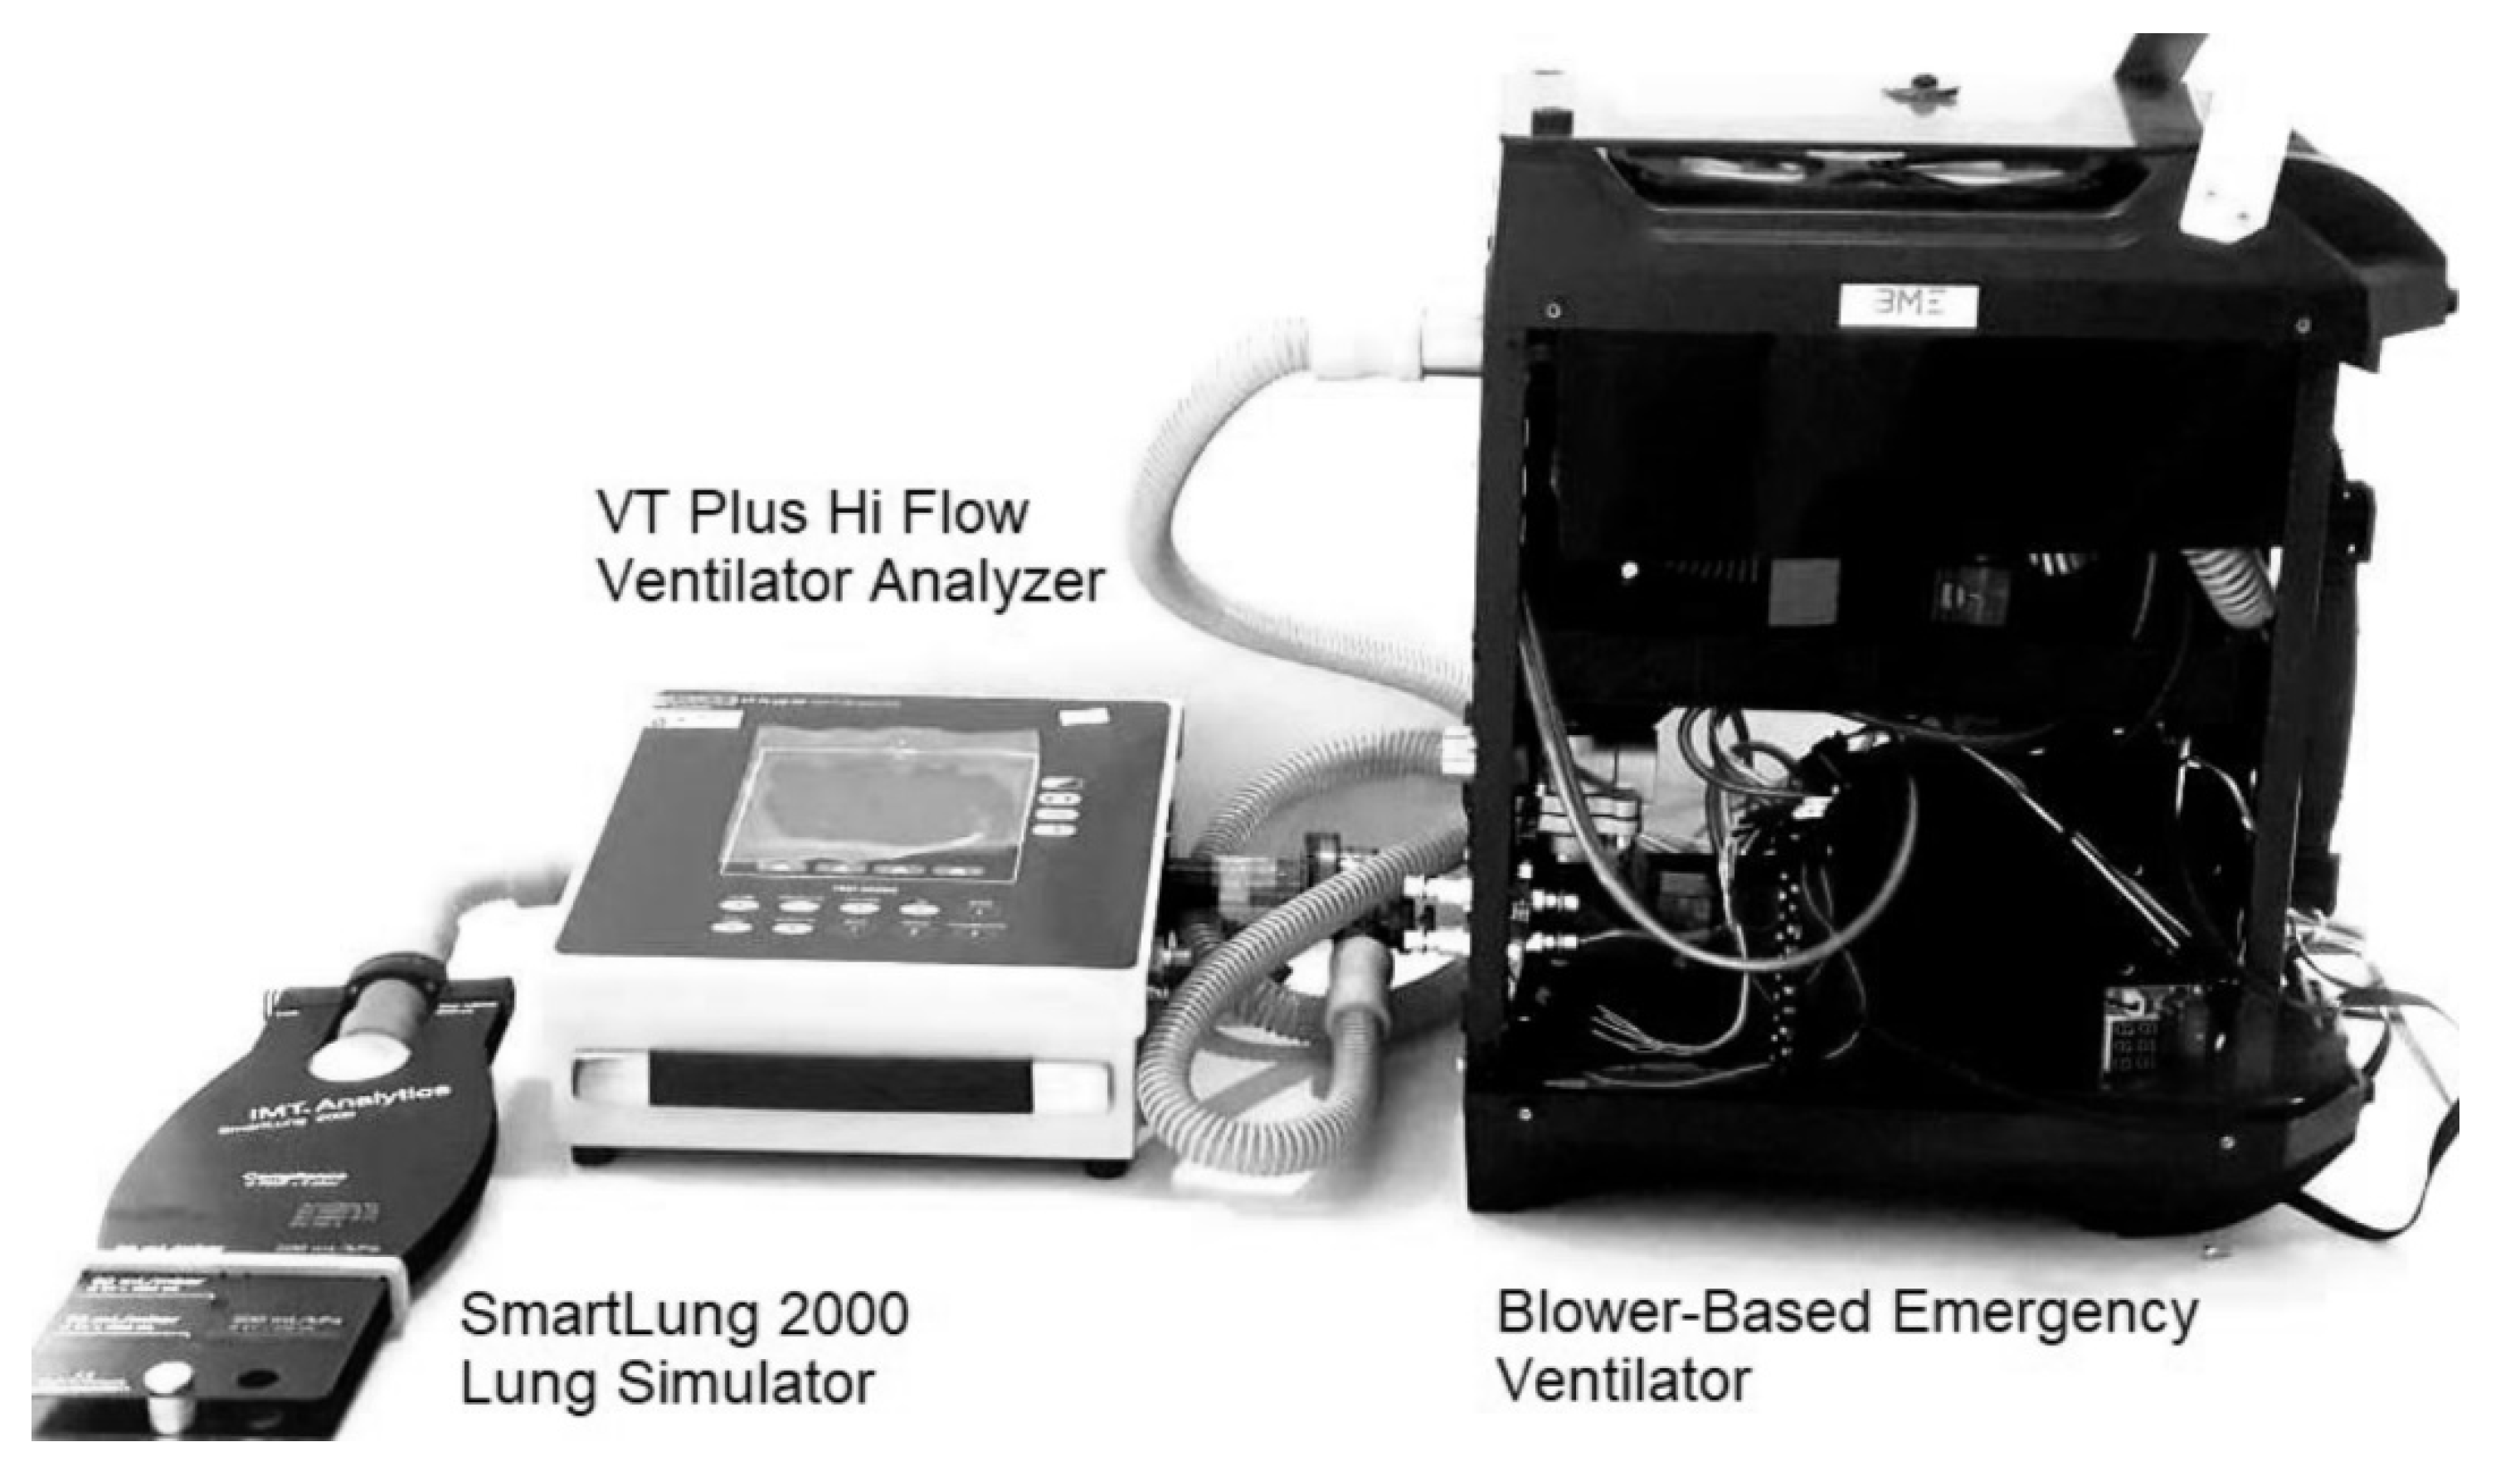
- Connect VT Plus HF gas flow ventilator analyzer inlet to the inspiration solenoid valve labeled as F in Figure 1.
- (ii)
- Setting the flowrate to the desired value. This will send various pulse width modulation value to blower.
- (iii)
- Turn on the ventilator with inspiration solenoid valve turning on.
- (iv)
- Record the reading on the ventilator analyzer and compare with the reading on sensor microcontroller.
- (i)
- Connect VT Plus HF gas flow ventilator analyzer inlet to the inspiration solenoid valve labeled as F in Figure 1.
- (ii)
- Connect the outlet to the expiration solenoid valve labeled as L in Figure 1.
- (iii)
- Set the pressure to the desired value. This will send various pulse width modulation values to the blower.
- (iv)
- Turn on the ventilator with inspiration solenoid valve turning on and inspiration solenoid valve turning off.
- (v)
- Record the pressure reading on the ventilator analyzer and compare with the reading on sensor microcontroller.
| I:E Ratio | Total Breath Cycle Time | Inspired Time | Expired Time | Average Inspired Time % Error | Average Expired Time % Error |
|---|---|---|---|---|---|
| 1:1 | 6 | 3 | 3 | 0 | 0 |
| 1:2 | 6 | 2 | 4 | 0.1 | 0.05 |
| 1:3 | 6 | 1.5 | 4.5 | 0.08 | 0.0265 |
| I:E Ratio | Total Breath Cycle Time | Inspired Time | Expired Time | Average Inspired Time % Error | Average Expired Time % Error |
|---|---|---|---|---|---|
| 1:1 | 3 | 1.5 | 1.5 | 0 | 0 |
| 1:2 | 3 | 1 | 2 | 0.1 | 0.05 |
| 1:3 | 3 | 0.75 | 2.250 | 0.52 | 0.0176 |
| Setting Pressure (cmH2O) | Average Pressure Measured by Ventilator Analyzer | % Error |
|---|---|---|
| 5 | 4.97 | 0.6 |
| 10 | 10.1 | 1 |
| 15 | 14.8 | 1.3 |
| 20 | 19.2 | 4 |
| Setting Flowrate (L/min) | Average Flowrate Measured by Ventilator Analyzer | % Error |
|---|---|---|
| 50 | 49.52 | 0.96 |
| 100 | 98.70 | 1.3 |
| 150 | 147.80 | 1.46 |
| 175 | 170.54 | 2.54 |
4.4. Noise-Level Measurement Generated by the Blower-Based Ventilator
4.5. Performance Test on Lung Simulator
5. Discussion
- (i)
- The material cost of the proposed blower-based emergency ventilator is approximately 400 USD, which is much cheaper than the full-scale ventilator used in the hospital. The average price of the full-scale commercial ventilator is 5000 USD.
- (ii)
- Compared with the MIT Ambu-bag emergency ventilator in Reference [2], where the tidal volume of 500 mL, which is limited by the volume of the Ambu-bag, can be delivered, the proposed blower-based emergency ventilator can provide a maximum tidal volume up to 600 mL and maximum minute volume of 7500 mL/min. Because there is no moving mechanical part, the proposed blower-based emergency ventilator operates in a less noisy environment than the Ambu-bag-based ventilator. The mode of ventilation in the proposed blower-based emergency ventilator that is provided is mandatory, and assisted modes are compatible with the full-function commercial ventilator. In safety measures, the proposed blower-based emergency ventilator uses the standard patient mask of Ambu-bag, which is equipped with a pressure-releasing valve, which will release the air when over-pressure is detected. The operating temperature is also monitored, which will stop the operation if the operating temperature exceeds the nominal limit.
- (iii)
- To lower the cost of construction, carbon dioxide is not equipped in the proposed blower-based emergency ventilator. Only the oxygen sensor is installed. The displayed percent oxygen of the air in the mixing chamber, which is related to air proportional valve and oxygen proportional valve, is calibrated within the VT Plus HF gas-flow ventilator analyzer.
- (iv)
- The motorized peep valve can be used only in the bi-directional ventilating circuit by installing the valve at the expiration solenoid valve. In a uni-directional ventilating circuit, the exhalation valve is at the patient mask, making it difficult to install the motorized peep valve due to its weight. In the one-directional circuit, a manually controlled peep valve is used instead.
- (v)
- The proposed blower-based emergency ventilator, which is equipped with a pulse oximeter, is very suitable when the hospital-bed occupation is full. In such cases, patients with mild-to-severe symptoms are forced to be treated at home. The blood oxygen level of the patients can be monitored to evaluate the treatment condition.
- (vi)
- Our web application and mobile-phone android application offer security login using Firebase authentication. As a result, only authorized users will allow access to the webserver and/or the application. Moreover, the data sent via Web Socket and/or Bluetooth are encoded in confidential protocols that are not open to the public. This provides another security measure.
- (vii)
- Most of the components used in the construction of blower-based ventilators are available locally in the electronic and pneumatic market, including an MPX5010 differential pressure sensor, ESP 32 microcontroller, solenoid valve, acrylic mixing chamber, connecting air tube, pressure relief valve, and HEPA filter. However, some components need to be imported from a foreign country: KE-25 oxygen sensor, YS200A pulse oximeter, and blower. During the first wave of COVID-19 pandemics, the overwhelming global interest in designing emergency ventilators increased the demand for ventilator equipment significantly. Presently, due to the improved condition of COVID 19 pandemics worldwide, the demand is now back to normal. The shipping time of imported components from a foreign country takes about one week.
- (viii)
- One of the crucial safety mechanisms of the designed and constructed blower-based ventilator is the alarm system. The alarm system provided both vision and audio alarm. The setting alarms include an over-inspired pressure alarm, over-inspired flowrate alarm, low heart-rate alarm, and low SpO2 alarm. To test the over-pressure alarm, the blower speed is varied and applied to the test lung. Observe until the measured pressure and flowrate reach the setting overpressure and over-flowrate alarm before the alarm goes off.
- (ix)
- The one-liter acrylic mixing chamber is considered too small to ensure mixing efficiency. The recommended volume should be two liters and should make from a stainless tube. A safety relief valve should also install in the mixing chamber to provide the safety mechanism.
- (x)
- The noise level of 80 dBA of blower is the maximum noise generated by the blower when operated at full capacity. In our blower-based ventilator, the blower runs at 50% capacity, and hence noise level is significantly decreased. The maximum sound level generated by our blower-based ventilator is 75.4 dBA, which is comparable to that of the commercial ventilator.
- (xi)
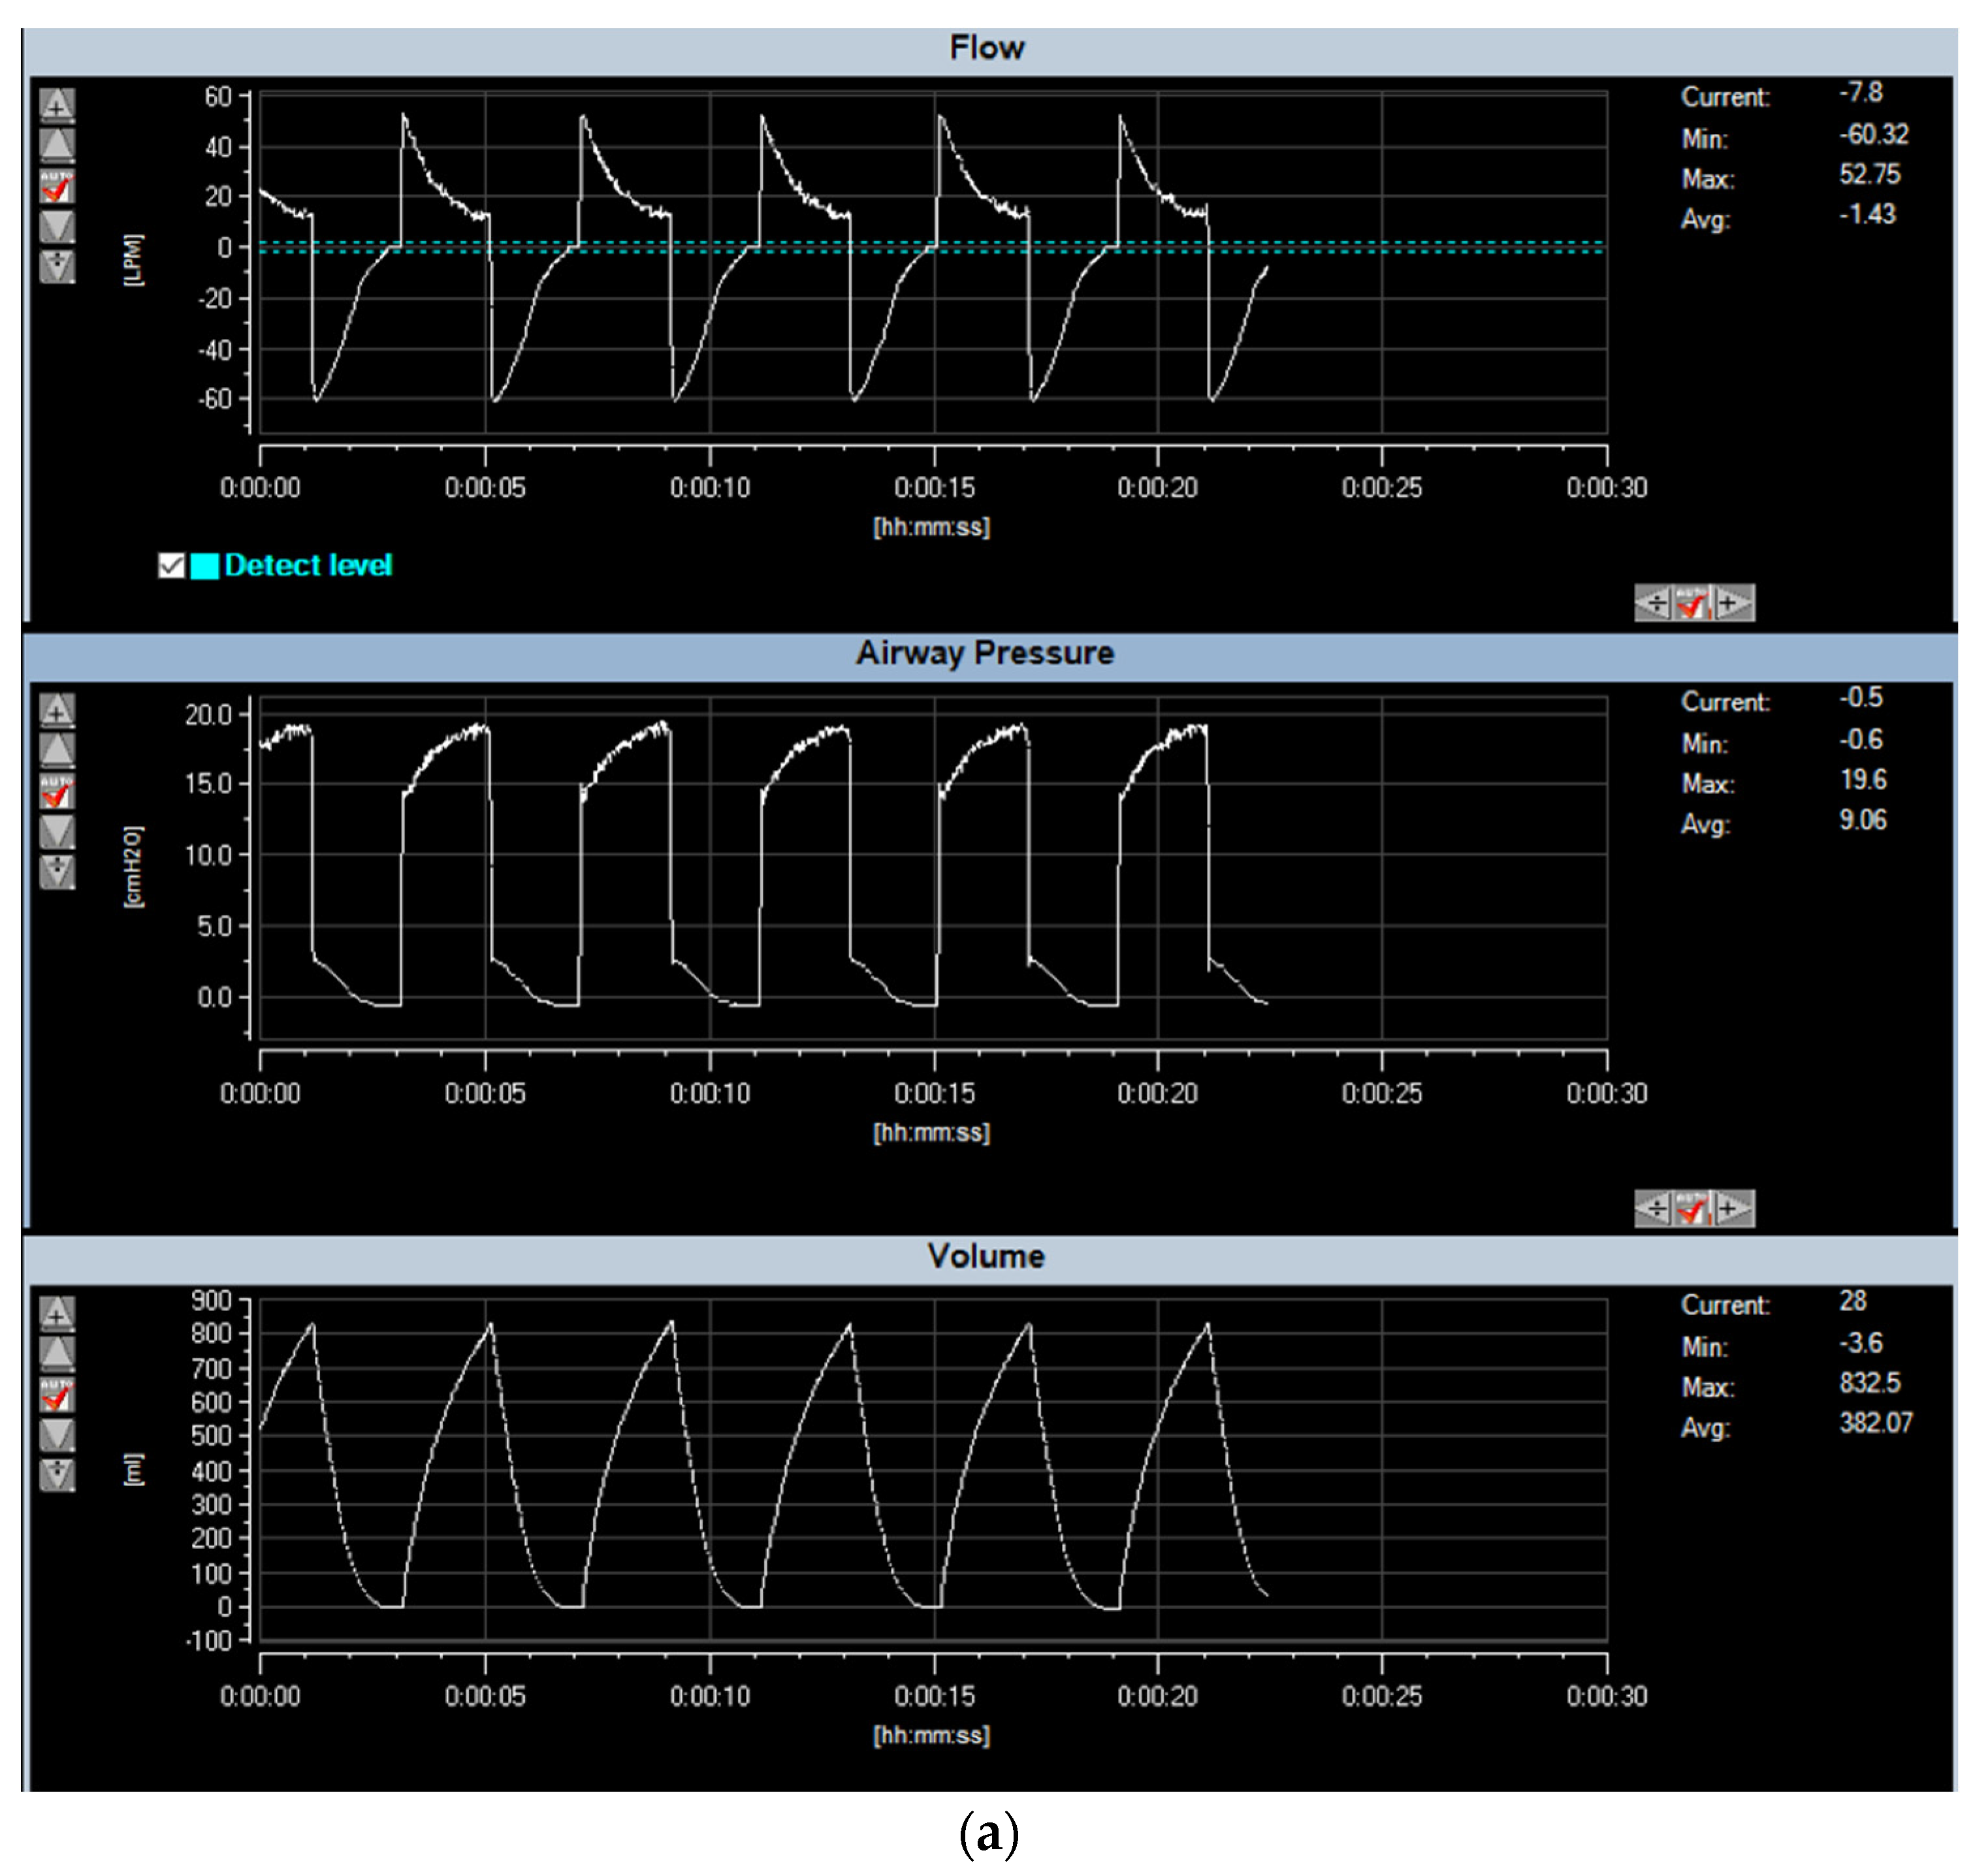
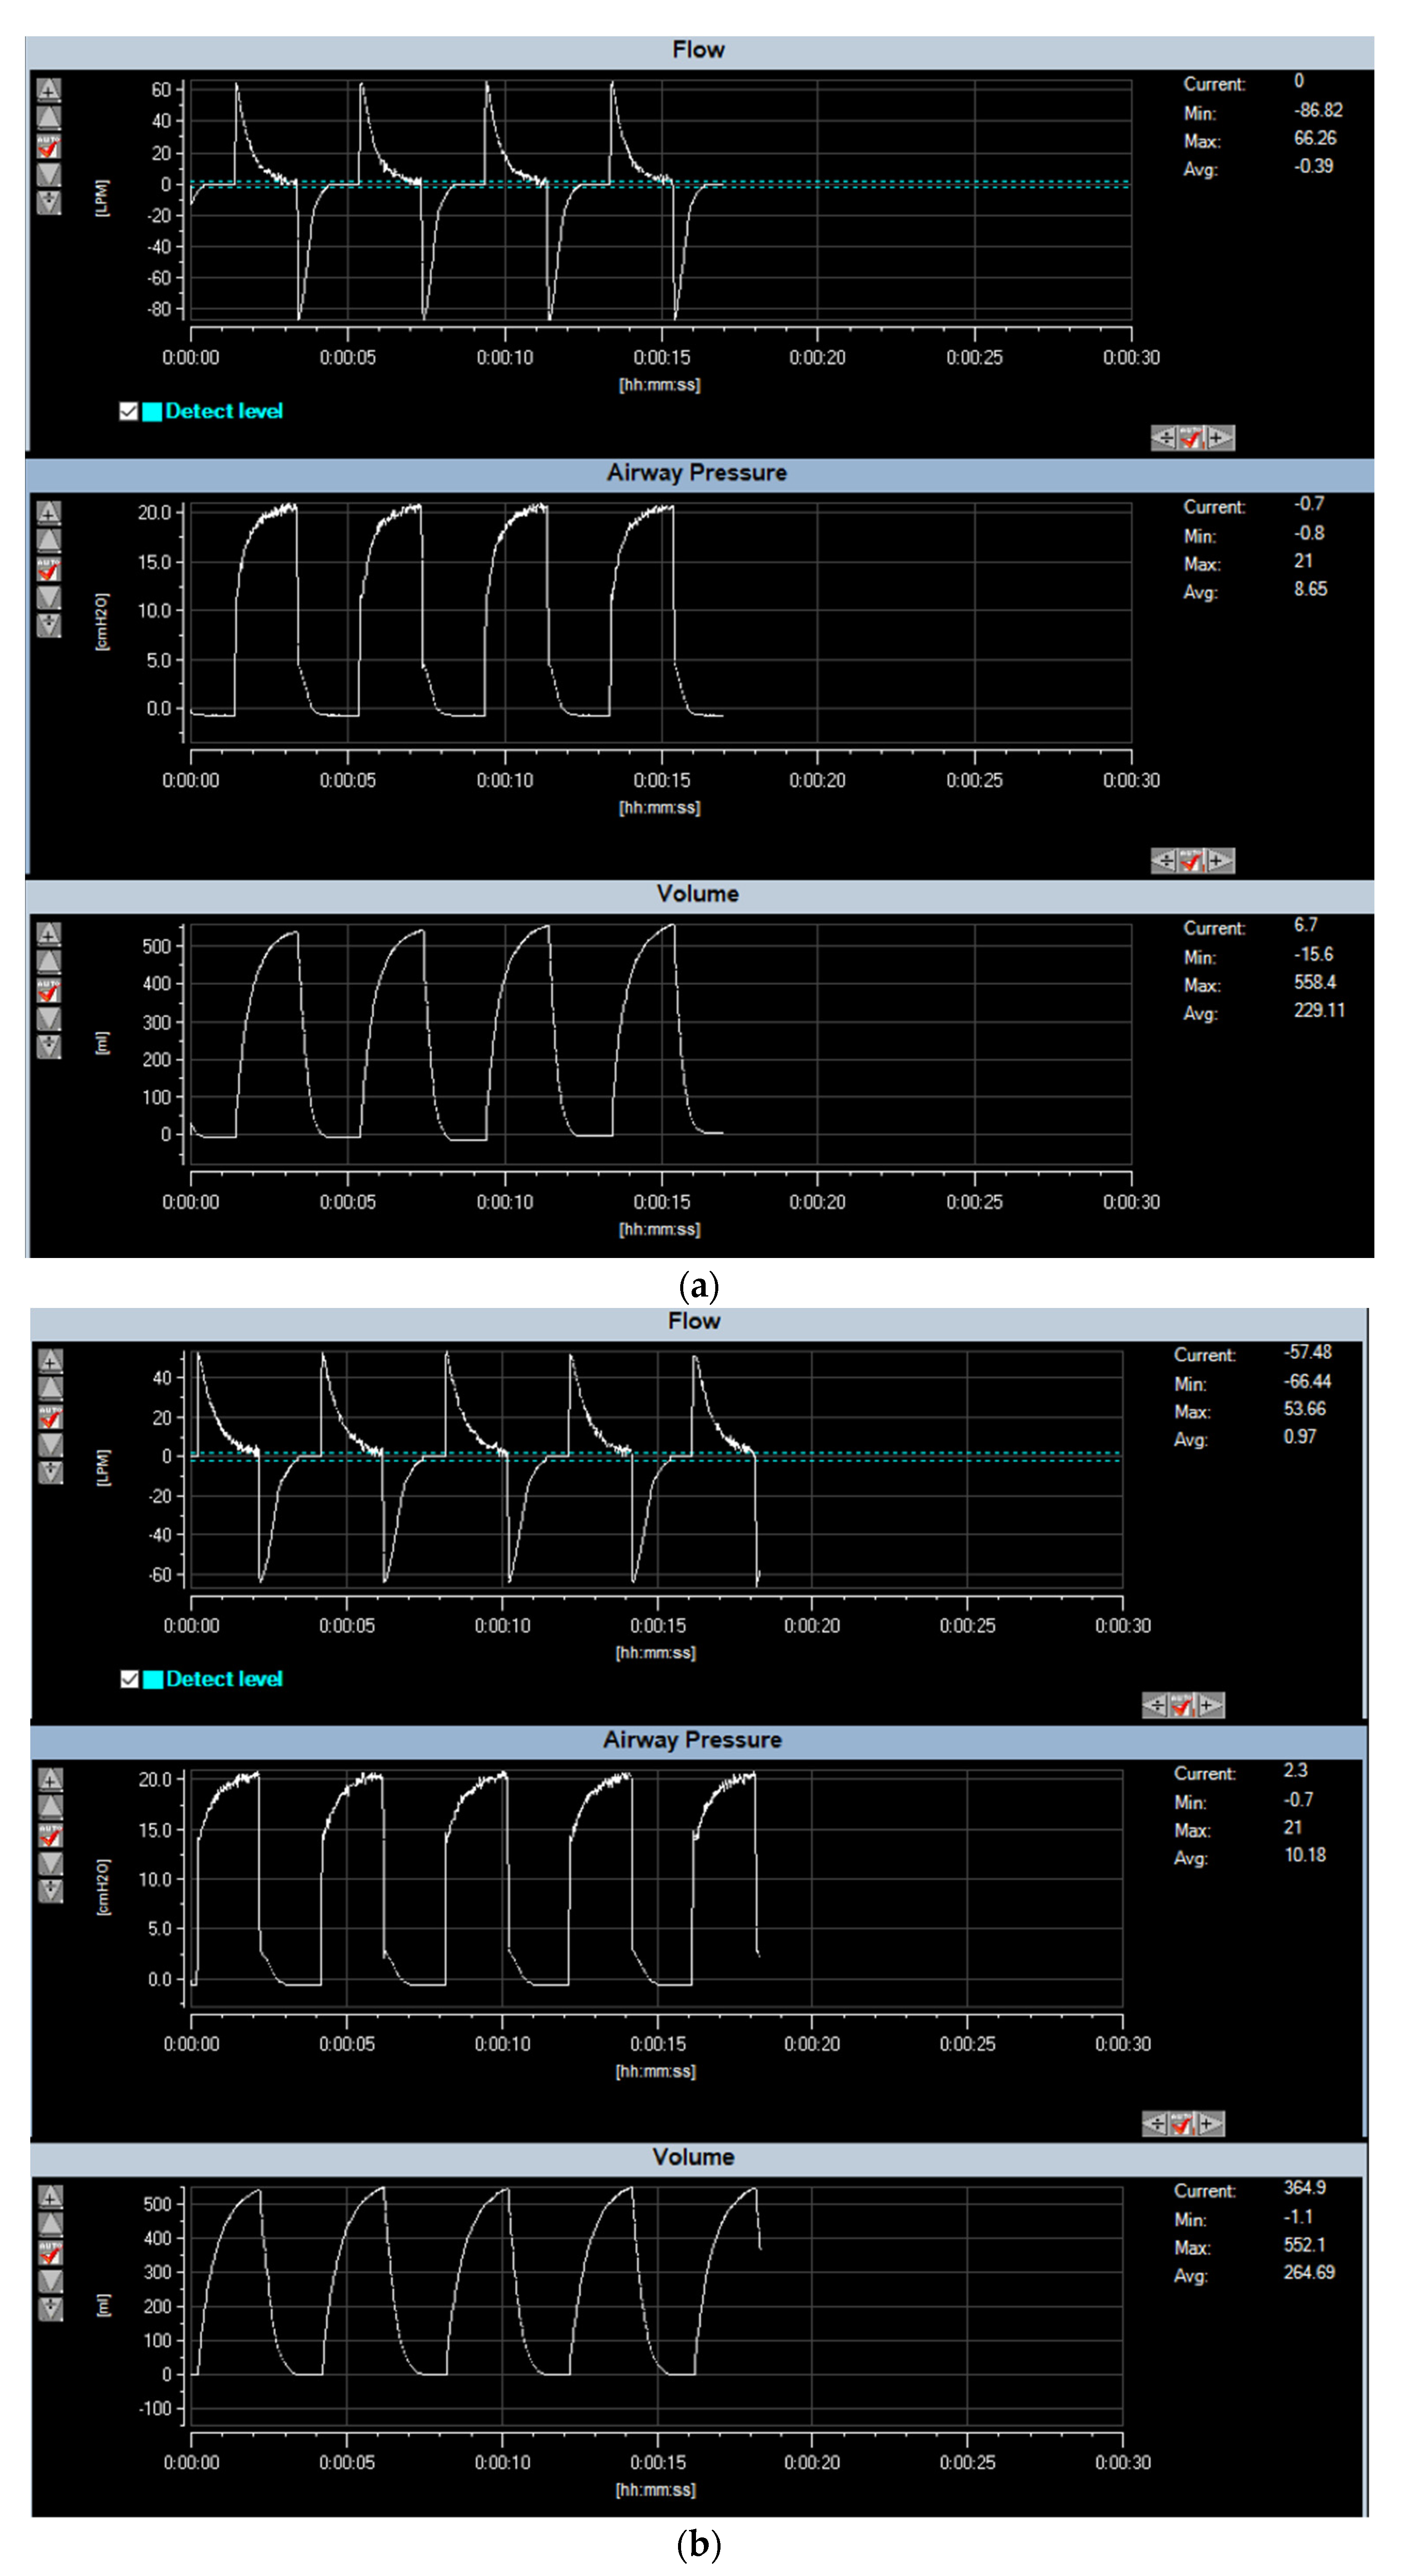
- The designed and constructed blower-based ventilator was successfully tested on the lung simulator and ventilator analyzer. The resulting waveform of the ventilator shown in Figure 17 and Figure 18 is similar to the mathematic model in Figure 14b,d,e. The simulated tidal volume of Conditions 1 and 2 is about 500 mL, where the simulated tidal volume of Conditions 3 and 4 are approximately 1000 and 1200 mL. The measured tidal volume of Conditions 1 and 2 is about 500 mL, where the measured tidal volume of Condition 3 and 4 are approximately 800 and 1000 mL. The maximum flow of all conditions is approximately ±60 lpm. The error between the model and the real measurement may be caused by the underestimated resistance related to the ventilator.
- (xii)
- Our proposed blower-based ventilator is based on pressure control. In pressure control, the device will constantly set at the specific pressure. The volume of air flowing to the patient’s lung, i.e., tidal volume, will adapt automatically depending upon lung compliance. In COVID-19 patients whose lungs are complicated by acute respiratory distress syndrome (ARDS), lung compliance decreases, and the pressure-control ventilator will automatically adjust the tidal volume such that less amount of volume is delivered to the patient. By contrast, in the volume-controlled ventilator, the fixed tidal volume is delivered to the patient. This may cause a hazardous event, especially in the case where lung condition is not known. Although pressure-controlled ventilator improved comfort for the patient who breathes spontaneously, there are some disadvantages for pressure-controlled ventilator. The uncontrolled tidal volume, especially the sudden change in lung compliance, may lead to hyperventilation and volutrauma, resulting in permanent lung and brain damage. Insufficient tidal volume is also detrimental and may develop when lung compliance or spontaneous respiratory effort decreases. The only concern of pressure control is to ensure that the setting pressure does not exceed the actual pressure. Moreover, all ventilators, including those installed in our blower-based ventilator, are equipped with pressure relief valves. In the case when the pressure accidentally increases, the excessive pressure will be released into the room atmosphere, and, hence, it will prevent the hazardous event. Another protection is by using an alarm system. The high-pressure limit can be set to send the notification to the caretaker when overpressure is detected. Experiments on the alarm system were performed intensively to ensure that the alarm system works normally. Hardware protection is also used to provide another preventive measure. By limiting the maximum supply, the pulse width modulation control, of the blower, the blower is not run at its full capacity. Even though the blower can provide pressure of up to 100 cmH2O, by limiting the power supply of the blower, the maximum pressure is limited only 30 cmH2O. The temperature of the blower is also always monitored by the attached temperature sensor. In case the temperature of the blower is over 40 degrees Celsius, the blower will be stopped. In normal operation, the blower temperature is around 30–37 degrees Celsius when operated overnight.
- (xiii)
- The designed ventilator is a pressure-controlled type. The applied pressure will hold fixed, and the tidal volume will automatically adjust depending on lung compliance. To avoid excessively high tidal volumes, however, the setting pressure should be started at a relatively low level (usually <20 cmH2O), and inspiratory time should be relatively short (usually <1.25 s in adults). Careful adjustment of setting pressure can be performed while observing the changes in tidal volume and respiration graph. The optimal pressure setting will be the point where further increasing pressure results in an insignificant change in tidal volume.
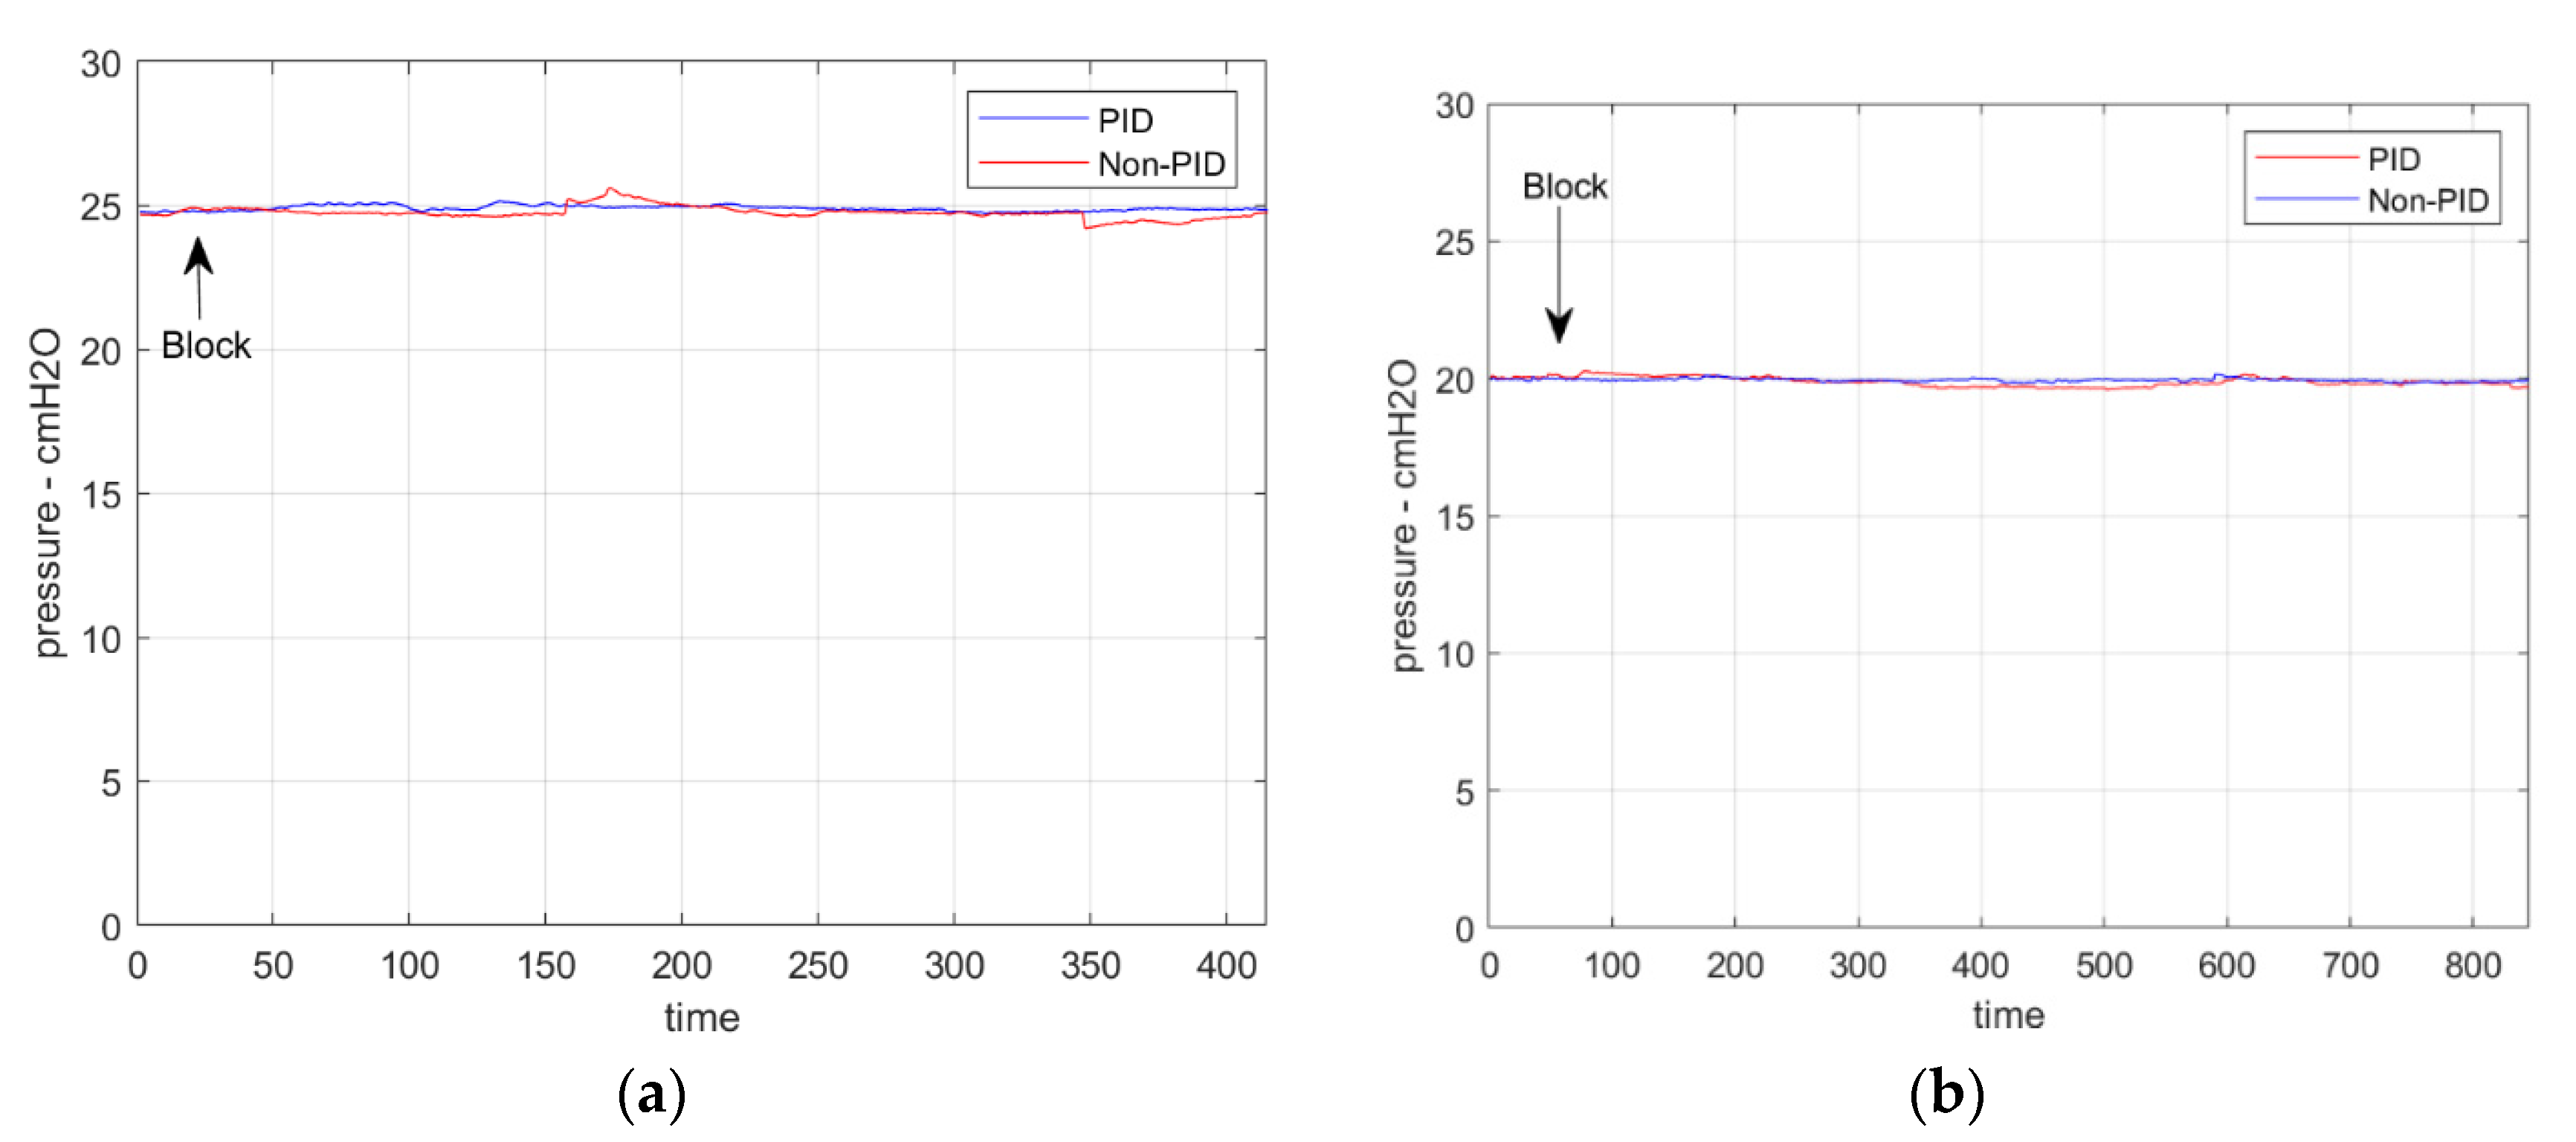
- (xiv)
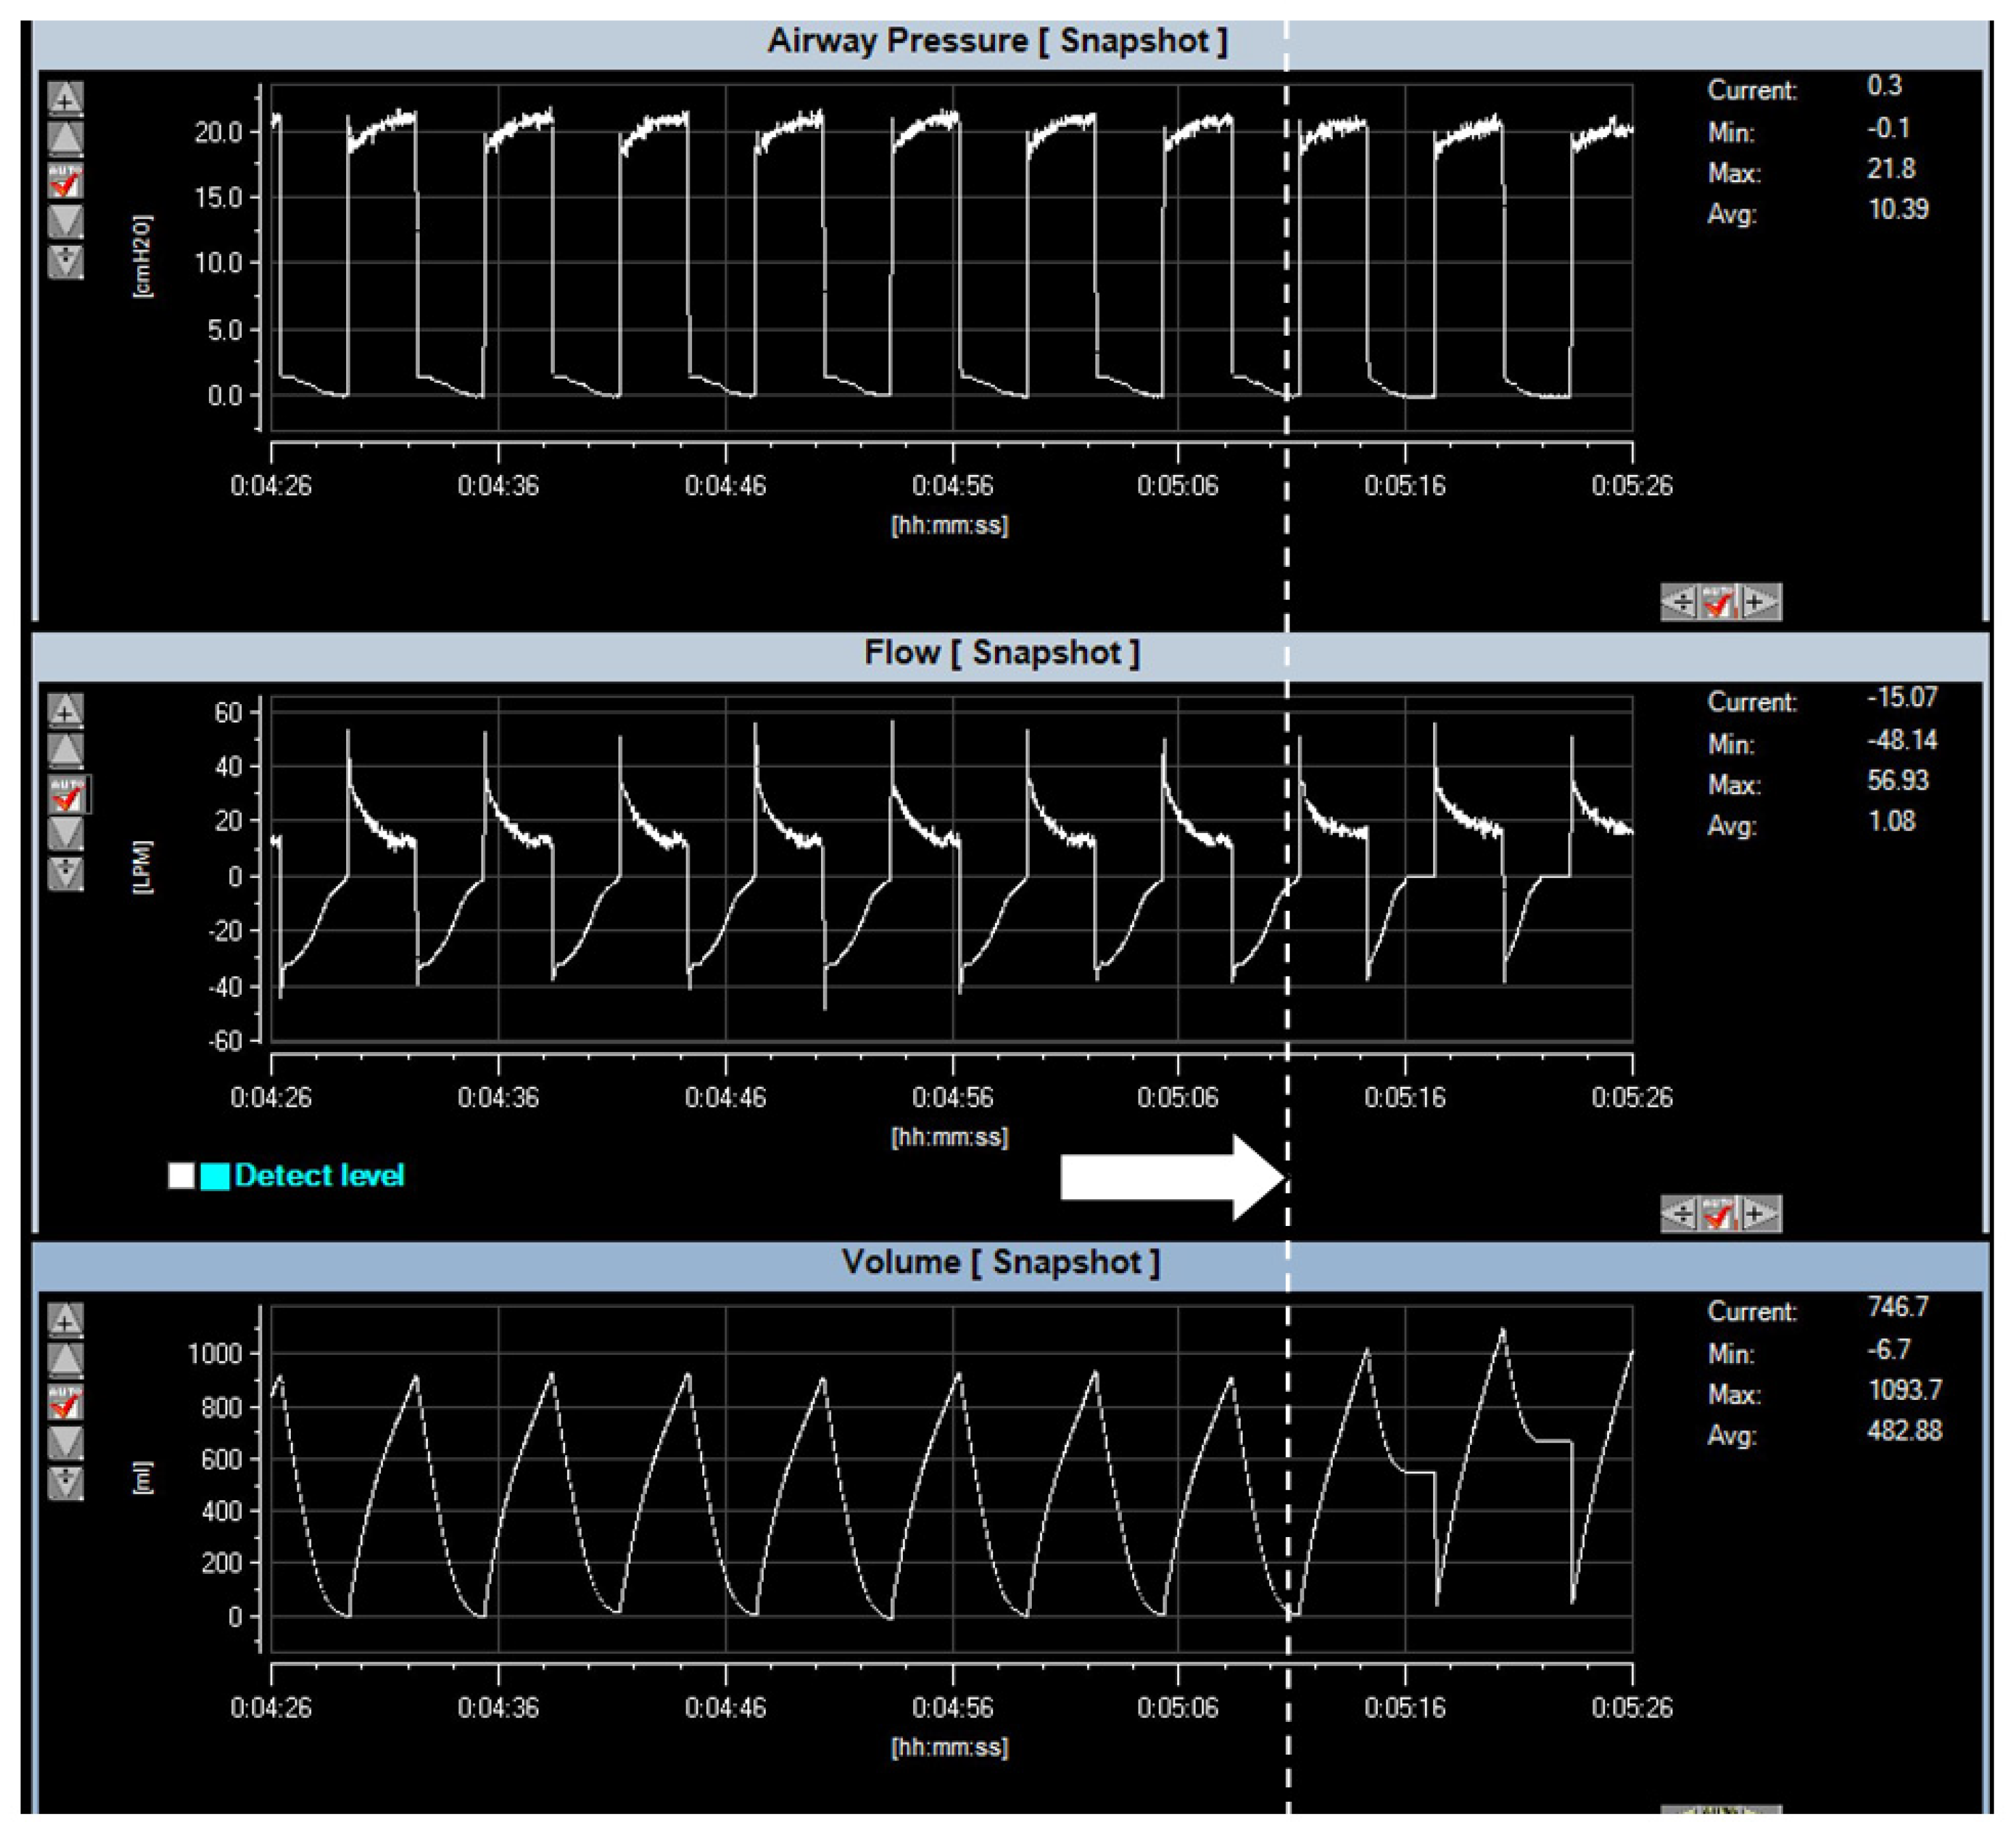
- Our emergency blower-based ventilator is based on the pressure-mode ventilator in which the pressure will be regulated at a desired constant pressure during the setting time, and the amount of delivered air will be automatically adjusted according to lung compliance. This is crucial for COVID19 patients, whose lung compliance decreases, which may be due to acute respiratory distress syndrome (ARDS). Pressure-controlled ventilator will control the appropriate setting of tidal volume automatically. The performance of the pressure-mode blower-based ventilator to sustain a desired constant pressure using SmartLung simulators that is capable of mimicking flow leaking, as shown in Figure 21, demonstrates promising results.
6. Conclusions
Author Contributions
Funding
Conflicts of Interest
References
- Vasan, A.; Weekes, R.; Connacher, W.; Sieker, J.; Stambaugh, M.; Suresh, P.; Lee, D.E.; Mazzei, W.; Schlapfer, E.; Vallejos, T.; et al. MADVent: A low-cost ventilator for patients with COVID-19, 2020. Med. Devices Sens. 2020, 3, e10106. [Google Scholar] [CrossRef]
- MIT. MIT Emergency Ventilator (E-Vent) Project. 2020. Available online: https://e-vent.mit.edu/ (accessed on 31 January 2021).
- University of Minnesota. COVID-19 Ventilator. 2020. Available online: https://med.umn.Edu/covid19Ventilator (accessed on 31 January 2021).
- OEDK—Rice University—ApolloBVM. Available online: http://oedk.rice.edu/apollobvm/ (accessed on 31 January 2021).
- OxVent—COVID 19 Ventilation. Available online: https://oxvent.org/ (accessed on 31 January 2021).
- Open-Source Ventilator. Available online: https://openlung.org/ (accessed on 31 January 2021).
- COVID-19 Ventilator Projects and Resources with FAQs. Available online: https://github.com/PubInv/covid19-vent-list (accessed on 20 February 2021).
- Knorr, J.M.; Sheehan, M.M.; Santana, D.C.; Samorezov, S.; Sammour, I.; Deblock, M.; Kuban, B.; Chaisson, N.; Chatburn, R.L. Design and performance testing of a novel emergency ventilator for in-hospital use. Can. J. Respir. Ther. 2020, 56, 42–51. [Google Scholar] [CrossRef]
- Raymond, S.J.; Wesolowski, T.; Baker, S.; Liu, Y.; Edmunds, J.L.; Bustamante, M.J.; Free, D.; Maharbiz, M.; Van Wert, R.; Cornfield, D.N.; et al. A Low-Cost, Rapidly Scalable, Emergency Use Ventilator for the COVID-19 Crisis. Available online: https://www.medrxiv.org/content/10.1101/2020.09.23.20199877v1 (accessed on 20 February 2021).
- Corey, R.M.; Widloski, E.M.; Null, D.; Ricconi, B.; Johnson, M.A.; White, K.C.; Amos, J.R.; Pagano, A.; Oelze, M.L.; Switzky, R.D.; et al. Low-Complexity System and Algorithm for an Emergency Ventilator Sensor and Alarm. IEEE Trans. Biomed. Circuits Syst. 2020, 14, 1088–1096. [Google Scholar] [CrossRef]
- HEPA Filter for CPR. Available online: https://www.boundtree.com/oxygen-equipment/ventilators/exhalation-expiratory-filter-30mm-size-manufacturer-backorder-/p/532900 (accessed on 30 August 2021).
- Flow Sensor. Available online: https://www.hamilton-medical.com/en/Products/Accessories-and-Consumables/Sensors-and-monitoring/Flow-sensors.html (accessed on 20 February 2021).
- Flow-Sense-Tech. Available online: https://www.hamilton-medical.com/dam/jcr:b8ef47c8-c2fa-47d5-8378-7fb9198ff7fc/Flow-sensor-tech-specs-EN-689568.00.pdf (accessed on 20 August 2021).
- MPX5010. Available online: https://docs.rs-online.com/9979/0900766b8138443c.pdf (accessed on 20 February 2021).
- Haoson. Available online: https://th.aliexpress.com/store/4688039?spm=a2g0o.detail.100005.1.ff883147Amk3OH (accessed on 20 June 2021).
- KE-25 Sensor. Available online: https://datasheetspdf.com/pdf/846240/ETC/KE-25/1 (accessed on 20 June 2021).
- Shanghai Berry Electronic Tech. Available online: https://berrymed.en.alibaba.com/?spm=a2700.details.cordpanyb.2.3afe41d5NKaUg7 (accessed on 20 June 2021).
- Siegel, M.D.; Hyzy, R.C. Ventilator Management Strategies for Adults with Acute Respiratory Distress Syndrome. UpToDate. 2021. Available online: https://www.uptodate.com/contents/ventilator-management-strategies-for-adults-with-acute-respiratory-distress-syndrome (accessed on 20 June 2021).
- MIT App Invertor. Available online: https://appinventor.mit.edu/ (accessed on 20 June 2021).
- Firebase. Available online: https://firebase.google.com/firebase-and-gcp (accessed on 20 July 2021).
- Plummer, A.R.; du Bois, J.L.; Flynn, J.M.; Roesner, J.; Lee, S.M.; Magee, P.; Thornton, M.; Padkin, A.; Gill, H.S. A simple method to estimate flow restriction for dual ventilation of dissimilar patients: The BathRC model. PLoS ONE 2020, 15, e0242123. [Google Scholar] [CrossRef] [PubMed]
- Tuning for PID Control. Available online: http://faculty.mercer.edu/jenkins_he/documents/TuningforPIDControllers.pdf (accessed on 20 July 2021).
- VT Plus HF Gas Flow Ventilator Analyzer. Available online: https://www.flukebiomedical.com/products/biomedical-test-equipment/gas-flow-analyzers-ventilator-testers/vt-plus-hf-gas-flow-analyzer (accessed on 20 June 2021).
- SmartLung2000. Available online: https://webstore.imtanalytics.com/smartlung-2000.html (accessed on 20 August 2021).
- Maidl-Putz, C.; McAndrew, N.S.; Leske, J.S. Noise in the ICU. Nurs. Critical Care 2014, 9, 29–35. [Google Scholar] [CrossRef]


| Blower Rating | 24 V 8 A |
| Maximum Speed | 25,000 rpm |
| Maximum Flow | 1500 L/min |
| Maximum Pressure | 62 kPa |
| Type | 3-phase brushless DC motor |
| Setting Pressure (cmH2O) | Maximum Noise Level (dBA) |
|---|---|
| 5 | 58.3 |
| 10 | 60.5 |
| 15 | 66.5 |
| 20 | 75.4 |
| Lung Resistance (mbar/L/s) | Lung Compliance (L/mbar) |
|---|---|
| 5 | 0.025 |
| 20 | 0.025 |
| 20 | 0.060 |
| 20 | 0.075 |
Publisher’s Note: MDPI stays neutral with regard to jurisdictional claims in published maps and institutional affiliations. |
© 2022 by the authors. Licensee MDPI, Basel, Switzerland. This article is an open access article distributed under the terms and conditions of the Creative Commons Attribution (CC BY) license (https://creativecommons.org/licenses/by/4.0/).
Share and Cite
Pintavirooj, C.; Maneerat, A.; Visitsattapongse, S. Emergency Blower-Based Ventilator with Novel-Designed Ventilation Sensor and Actuator. Electronics 2022, 11, 753. https://doi.org/10.3390/electronics11050753
Pintavirooj C, Maneerat A, Visitsattapongse S. Emergency Blower-Based Ventilator with Novel-Designed Ventilation Sensor and Actuator. Electronics. 2022; 11(5):753. https://doi.org/10.3390/electronics11050753
Chicago/Turabian StylePintavirooj, Chuchart, Areerat Maneerat, and Sarinporn Visitsattapongse. 2022. "Emergency Blower-Based Ventilator with Novel-Designed Ventilation Sensor and Actuator" Electronics 11, no. 5: 753. https://doi.org/10.3390/electronics11050753
APA StylePintavirooj, C., Maneerat, A., & Visitsattapongse, S. (2022). Emergency Blower-Based Ventilator with Novel-Designed Ventilation Sensor and Actuator. Electronics, 11(5), 753. https://doi.org/10.3390/electronics11050753