Article

Parameter Sensitivity Analysis of a Brake Pressure Control System in Aviation Using an Electro-Hydraulic Servo Valve

1
School of Mechanical Engineering, Yanshan University, Qinhuangdao 066004, China
2
Hebei Provincial Key Laboratory of Heavy Machinery Fluid Power Transmission and Control, Qinhuangdao 066000, China
3
Beijing Institute of Automation Control Equipment, Beijing 100000, China
4
Shanghai Hunter Hydraulic Control Technology Co., Ltd., Shanghai 201600, China
5
AVIC No.1 Aircraft Design and Research Institute, Xi’an 710000, China
*
Author to whom correspondence should be addressed.
Electronics 2022, 11(5), 746; https://doi.org/10.3390/electronics11050746
Submission received: 5 October 2021 / Revised: 16 January 2022 / Accepted: 26 January 2022 / Published: 28 February 2022
(This article belongs to the Special Issue Advanced Research in Electromagnetic Devices for Electric Vehicles)

Abstract

:
The landing gear system has the task of bearing the weight of the aircraft, bearing the impact load, and providing the braking function in the process of the aircraft taxiing, take-off, and landing. There are many parameters in the aviation brake pressure servo valve-controlled cylinder system (ABPSVCS) which will have a significant influence on the dynamic behavior of the system. Sensitivity analysis is an effective method to analyze the influence of system parameters on system characteristics, especially for nonlinear systems. The trajectory sensitivity method based on the description of system state space is used for the parameter sensitivity analysis of the ABPSVCS. By grouping various parameters for sensitivity analysis, the law of parameter sensitivity of each group is obtained, and the results are verified by experiments. The results can lay a theoretical and experimental foundation for the related research work of the aviation brake pressure servo valve.

1. Introduction

Landing gear is an important part of the aircraft. It is mainly used to realize the functions of take-off, landing, ground taxiing, and parking, and to absorb and dissipate all kinds of energy generated by the aircraft in the process of landing and ground motion, such as vertical kinetic energy generated by the aircraft ground subsidence velocity, structural pendulum vibration during taxiing and energy generated by the uneven ground, and the horizontal kinetic energy of the aircraft to absorb and dissipate when the aircraft brakes.
The landing gear is mainly composed of a shock absorber, retraction system, wheel brake system, and turning system. At the same time, the landing gear needs to have good damping performance, good maneuverability, stability, and good braking performance when moving on the ground [1]. It must connect with the body reasonably and reliably, have good retractable reliability, and meet the protection requirements. The brake system is a large aircraft landing gear system subsystem. The aviation brake pressure servo valve-controlled cylinder system (ABPSVCS) is the landing gear system of multi-valve parallel hydraulic systems.
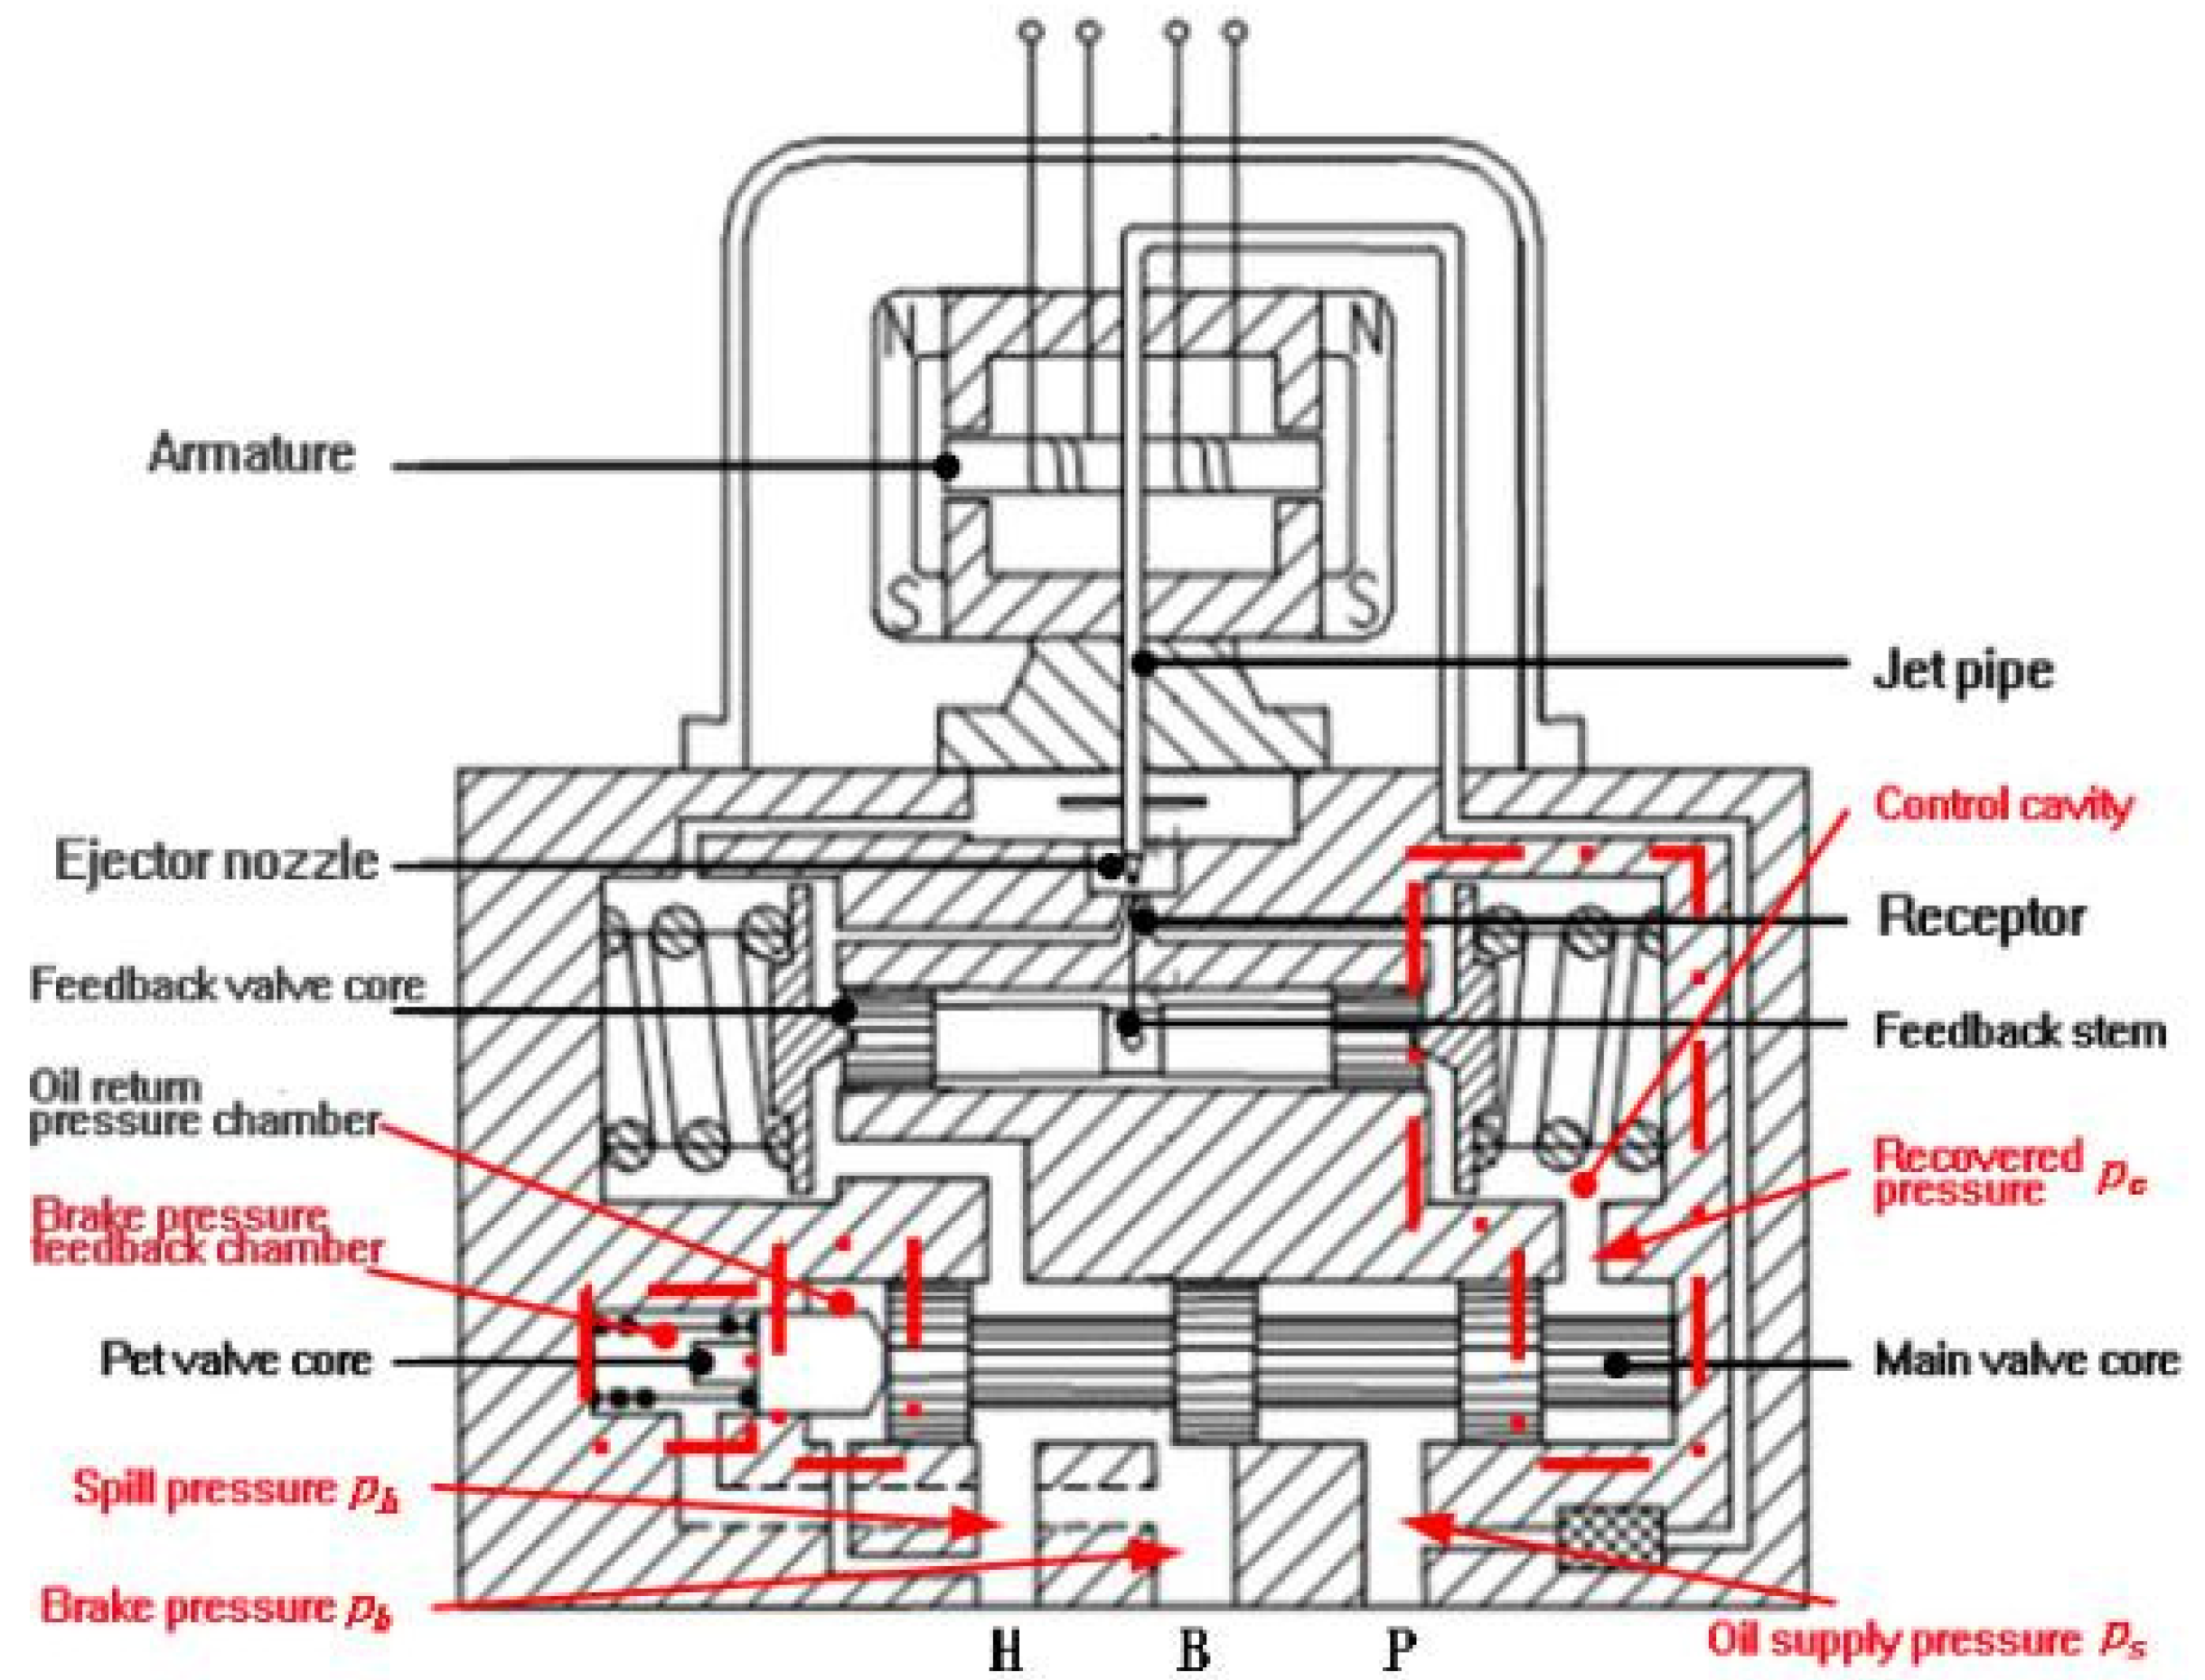
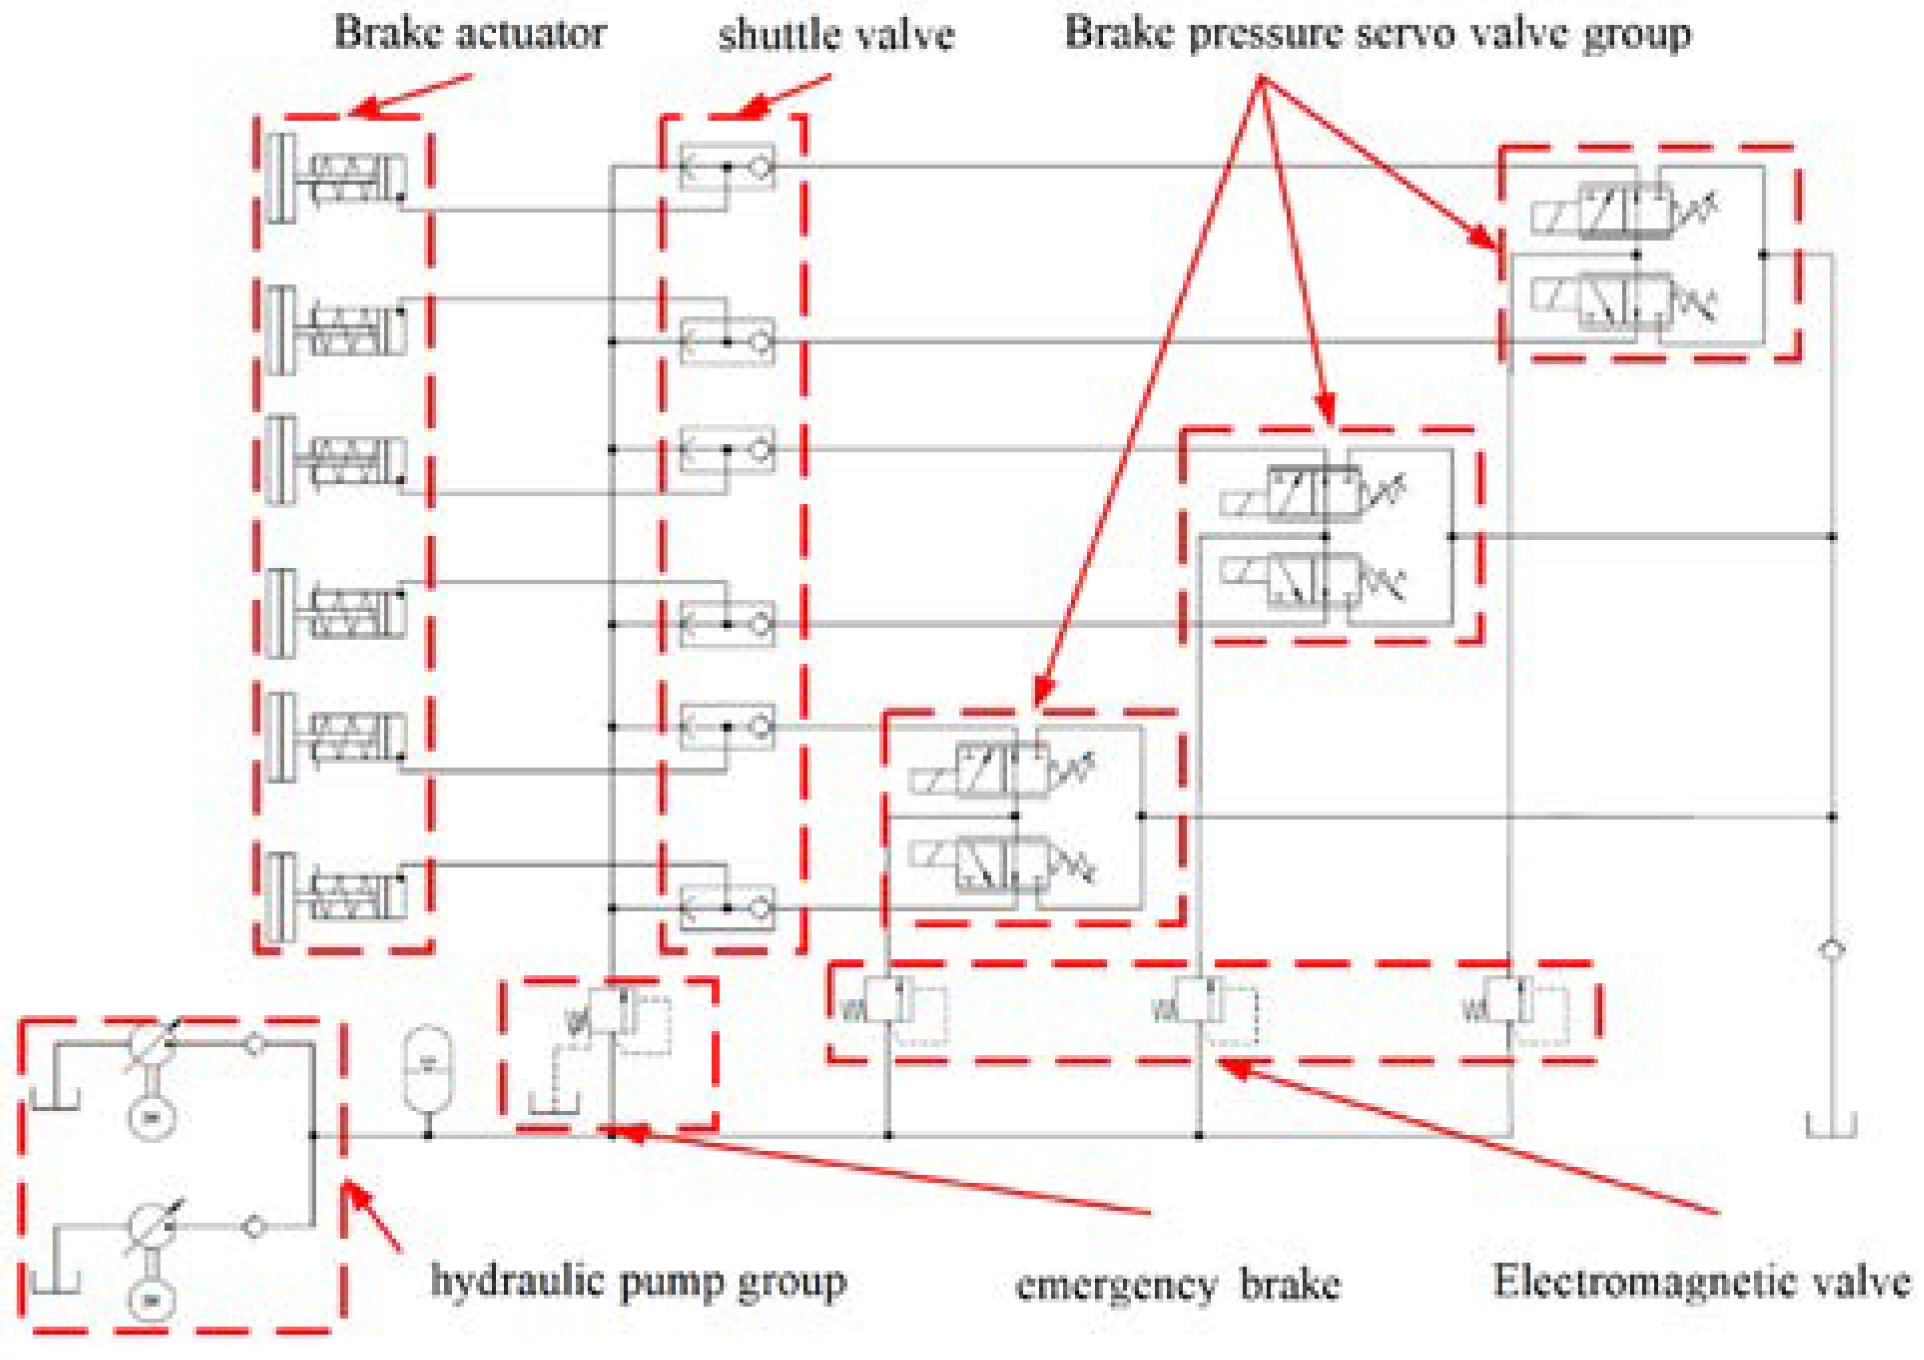
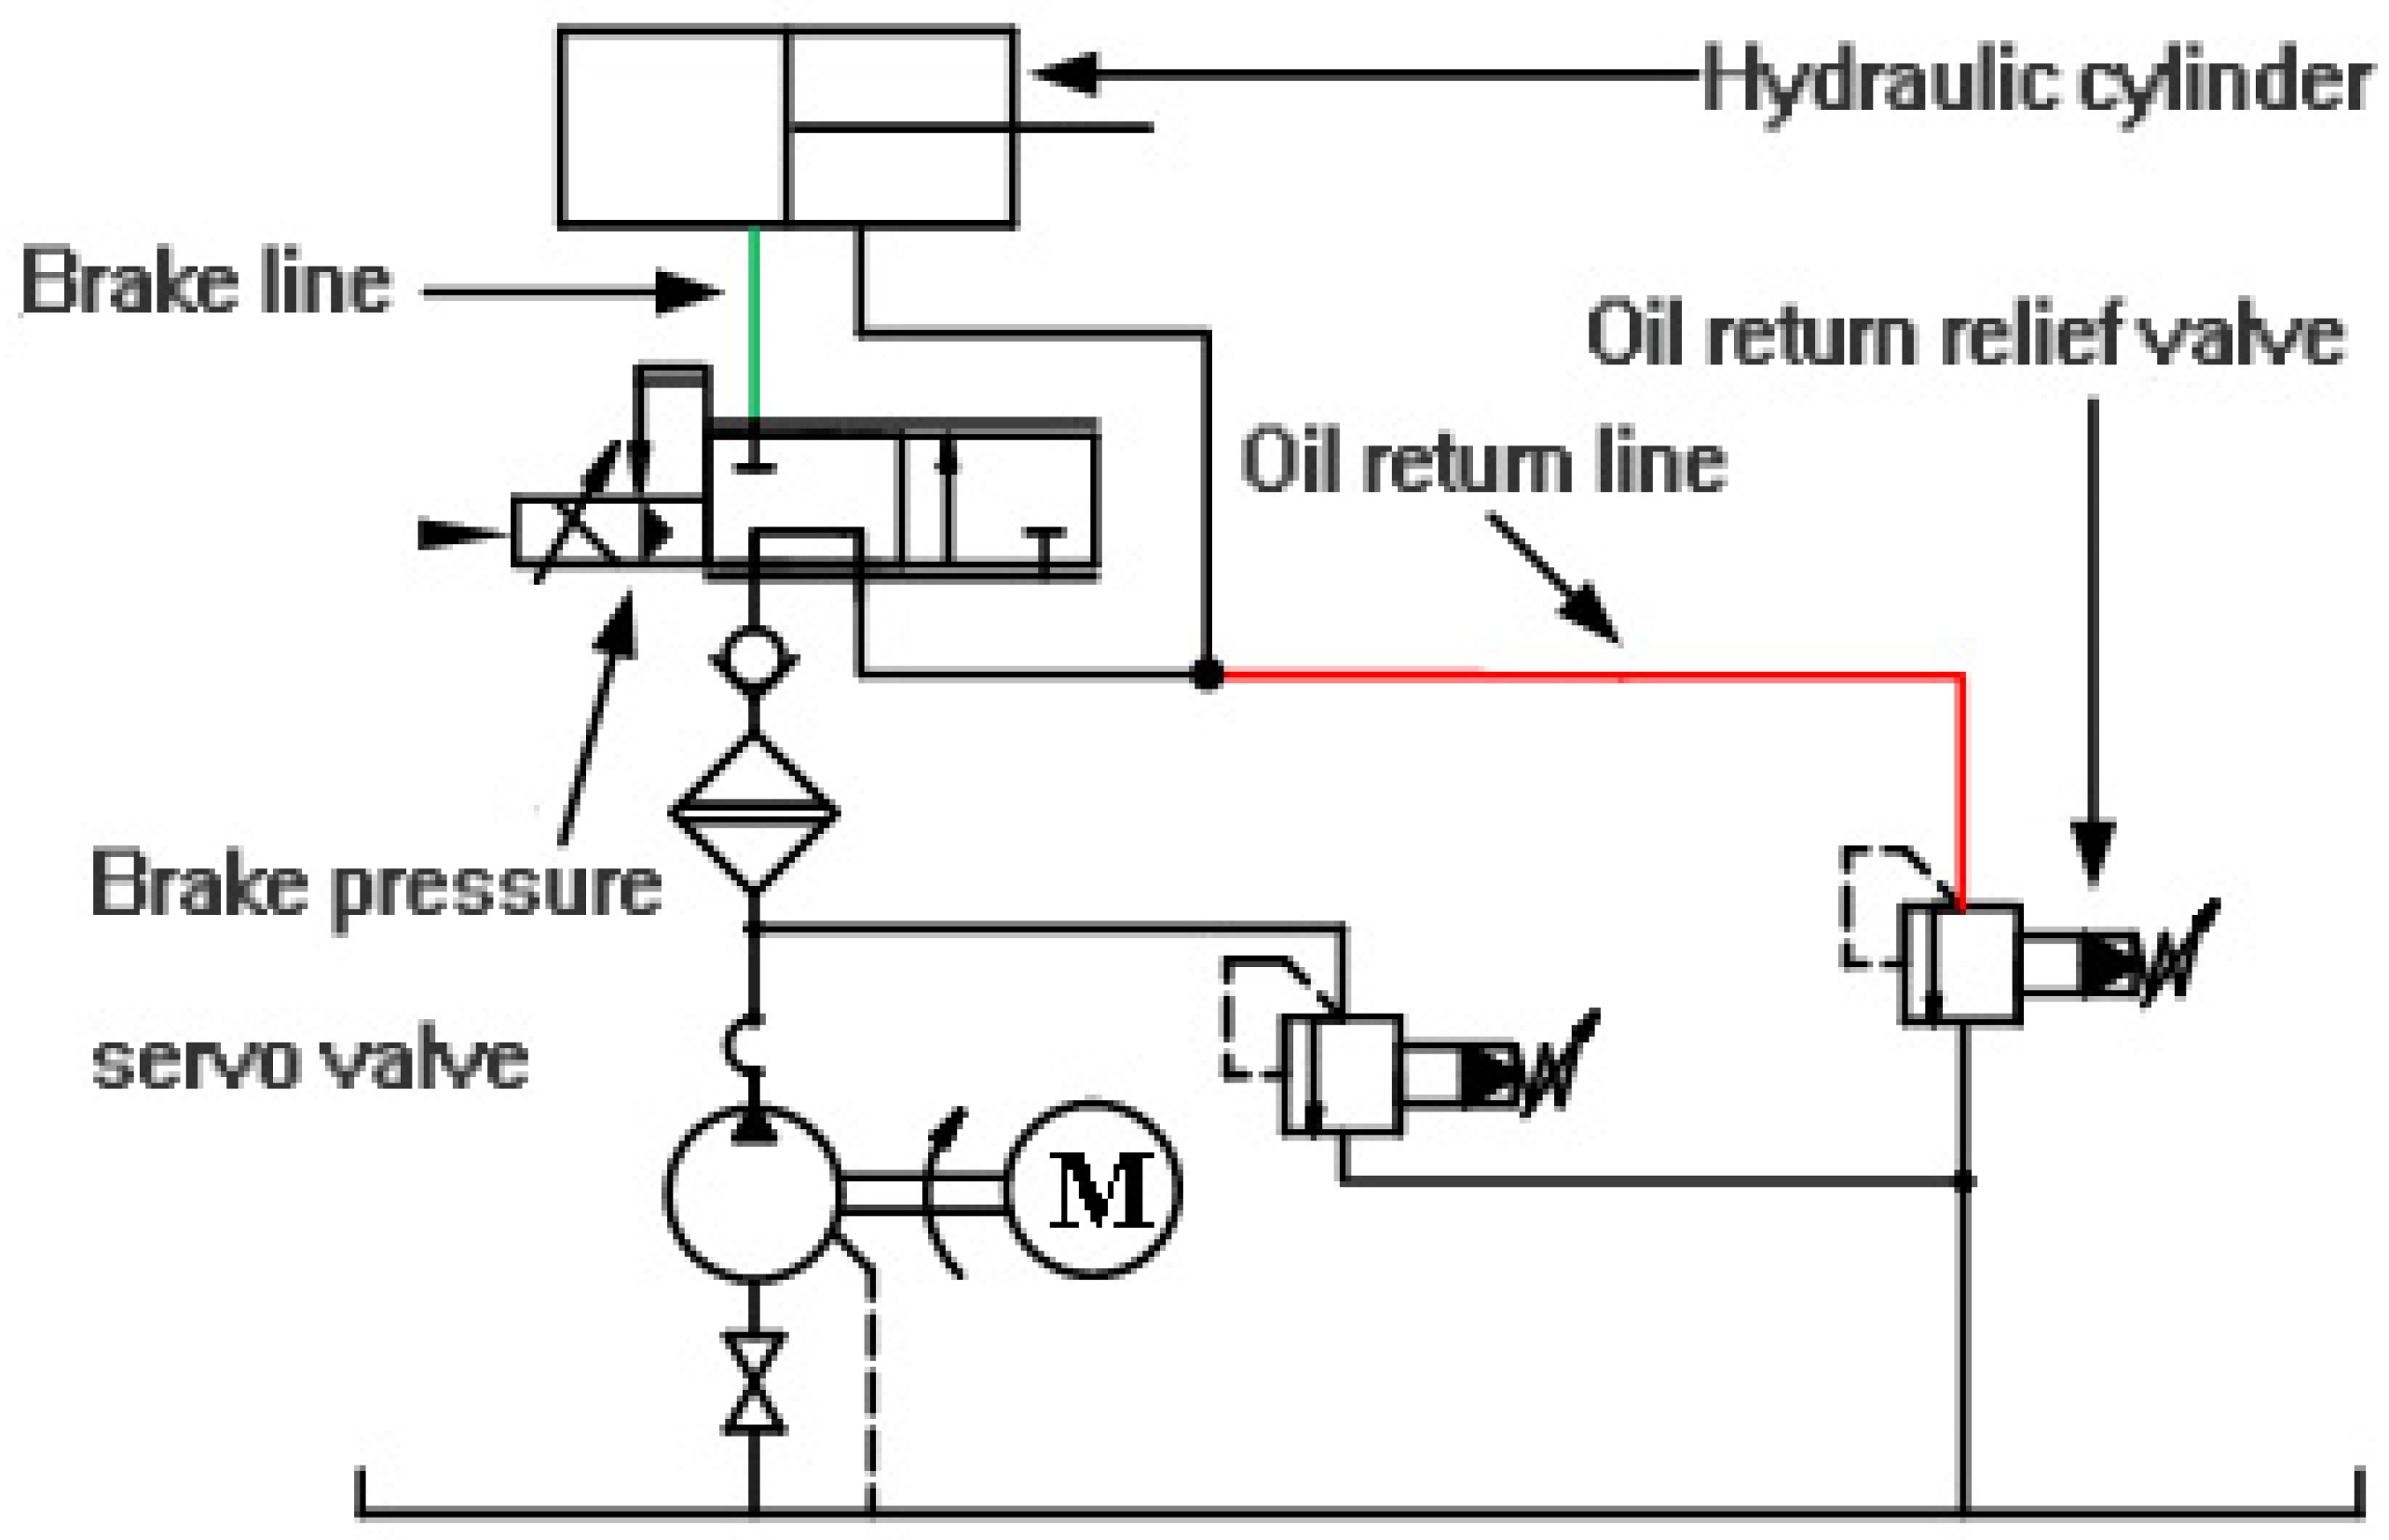
Figure 1 is the schematic diagram of the brake servo valve-hydraulic pipeline system of a large aircraft. The red frame part in the diagram is one of the circuits. In order to facilitate analysis, the system is simplified as shown in Figure 2. Figure 2 is the schematic diagram of a single valve single circuit system. Figure 3 shows the schematic diagram of the brake pressure servo valve in an ABPSVCS. We will also discuss this content in the text to facilitate the reader’s understanding.
Large aircraft are a triumph in the field of modern industry. At the same time, they reflect a country’s comprehensive national strength and are an important guarantee for national security. Moreover, they are also important for the development of national economy. [2,3]. In the landing gear system, the wheel brake control system is one of the subsystems with independent functions. The landing gear system plays the role of bearing the weight of the aircraft, bearing the impact load, and providing the braking function in the process of the aircraft taxiing, take-off, and landing. In order to meet the demands of take-off and landing of large tonnage aircraft, multi-wheel parallel main landing gear is used in the braking system of large aircraft [4]. Correspondingly, the electro-hydraulic brake servo valve-controlled system is a parallel structure of several brake pressure servo valves and brake actuators. In 2021, among the major scientific problems and engineering technical problems detailed by the China Association for Science and Technology, the China Aeronautical Society listed “how to break through the technical problems of high reliability of aviation brake pressure servo valve in extreme environment”; thus, the relevant research on aviation pressure servo valves has become a hot topic today.
An aviation brake pressure servo valve-controlled cylinder system (ABPSVCS) includes a torque motor, feedback stage spool, power stage spool, brake actuator, and a large number of parameters of the return oil channel. A large amount of previous simulation analysis and experimental research experience has shown that the change of system parameters will have a significant impact on the dynamic behavior of the system. For example, the increase of torque motor feedback rod stiffness will reduce the deflection angle of the jet nozzle, and then reduce the recovery pressure and braking pressure output by the system. The increase of the braking pressure feedback area of the power level spool will result in the decrease of the braking pressure output by the system. The reduction of the brake cavity will increase the fluctuation of brake pressure. Therefore, understanding the influence of the parameters of an ABPSVCS on the system performance is very important [5,6].
Sensitivity analysis is an effective method to grasp the accurate influence of parameters on the dynamic performance of a hydraulic system. Meanwhile, it has the same applicability for nonlinear systems. Therefore, the sensitivity analysis method can provide reasonable and effective guidance for the optimization design of system structural parameters [7], work parameter compensation [8], and control parameter tuning [9]. The sensitivity analysis method is widely used in servo motor control [10], geological structure analysis [11], mechanical system design and analysis [12], environmental management [13], wind field analysis [14], medicine [15], and other fields. However, its application in the hydraulic field is relatively less common. In recent years, scholars at home and abroad have applied the sensitivity analysis method to the analysis of valve-controlled cylinder systems, and obtained the influence degree of the main parameters of a valve-controlled cylinder system on the dynamic and static characteristics of the system. They also put forward different sensitivity analysis methods, comparing the similarities and differences to choose the most suitable method for hydraulic valve-controlled cylinder systems [16], the sensitivity analysis method for hydraulic system modeling analysis, and the nonlinear control of a number of parameter sensitivity analyses, to explore the effects of various parameters on the on the hydraulic system and provide a theoretical basis for the design of hydraulic components [17].
The above research (not limited to those cited in the paper) used the first-order or second-order trajectory sensitivity analysis to study the influence degree of each parameter on the control characteristics for the hydraulic valve-controlled cylinder position control system. Among them, the second-order sensitivity analysis is more complex, but it has a higher accuracy, and it is suitable for cases were the parameters change by more than 20%. The first-order sensitivity analysis is simple, but the accuracy is low, and it is suitable for the cases where the parameter transformation is less than 20%. An ABPSVCS contains a torque motor, feedback level valve core, power level, brake actuator, and return oil valve core passage with a large number of parameters, and the vast majority of parameter variation is estimated at less than 20%; given the impact of the parameters on the system of law, the amount of calculation, the huge amount of data processing, and the fact that part of the parameters will not change significantly in the process of system operation, it is not of practical significance to analyze them. At the same time, due to the non-linear factors in the dynamic model of an ABPSVCS, the output sensitivity method based on the system differential equation and the eigenvalue sensitivity method based on the system transfer function are not applicable in this system [8]. Therefore, the first-order trajectory sensitivity method based on system state space description is adopted in this paper to conduct parameter sensitivity analysis, and the influence of various parameters in an ABPSVCS on the system sensitivity is explored.
In this paper, a large number of parameters contained in the ABPSVCS are classified according to the structure and analyzed. The parameters are grouped according to different characteristics. The sensitivity sequence of each parameter is obtained by using sensitivity analysis to reveal the sensitivity variation rule of each parameter of the system. The sensitivity analysis method is also applicable to the research of other hydraulic directions, such as the calibration method of the three-dimensional force sensor and the kinematics correction algorithm of the semi-cylindrical foot robot LHDS in the robot direction [18,19]. This method is widely used to analyze the influence of parameters. This is the main contribution of this paper.

2. Mathematical Model of the ABPSVCS

In this paper, the dynamic model of the ABPSVCS is firstly established and modified. However, in the process of establishing the dynamic model of the ABPSVCS, in order to obtain the accurate receiving area of the jet amplifier receiving hole, a triangular function is used, which brings about non-linear factors and is unconducive to the simplification of the model. Through experimental verification, it is proved that the linearization of the fluidic amplifier is more conducive to the establishment of the transfer function relationship of the system, and at the same time, it can ensure the high precision of the system model. Due to space limitations, this paper omits the process of establishing and revising the dynamic model of the ABPSVCS, and directly displays the simplified model. This paper will use the simplified model of the ABPSVCS to conduct a sensitivity analysis of system parameters.
The transmission block diagram of the system from the input current to the brake pressure output is shown in Figure 4a and the flow block diagram is shown in Figure 4b. It can be seen that the transfer relation of the system can be obtained intuitively after simplification. The parameters in Figure 4a are described in the Table 1.
In addition, in order to conduct the sensitivity analysis of the ABPSVCS, the system dynamic model in this paper must be written in the general form of state space as shown in Equation (1).
x ˙ = f ( x , u , α , t )
Figure 4 shows that the highest order of ABPSVCS is the 14th order. Therefore, 14 state variables, 1 input, and 41 parameters are selected, and the vectors in the system state Equation (1) are as follows:
x = [ x 1 , x 2 , x 3 , x 4 , x 5 , x 6 , x 7 , x 8 , x 9 , x 10 , x 11 , x 12 , x 13 , x 14 ] Τ
u = [ u 1 ] Τ
α = [ α 1 , α 2 , α 3 , α 4 , α 5 , α 6 , α 7 , α 8 , α 9 , α 10 , α 11 , α 12 , α 13 , α 14 , α 15 α 16 , α 17 , α 18 , α 19 , α 20 , α 21 , α 22 , α 23 , α 24 , α 25 , α 26 , α 27 , α 28 , α 29 , α 30 , α 31 , α 32 , α 33 , α 34 , α 35 , α 36 , α 37 , α 38 , α 39 , α 40 , α 41 ] Τ
Among them, each state variable is as follows:
x 1 = ψ , x 2 = ψ ˙ , x 3 = x c , x 4 = x ˙ c , x 5 = p c , x 6 = x v , x 7 = x ˙ v , x 8 = p b , x 9 = p h , x 10 = y , x 11 = y ˙ , x 12 = x j , x 13 = x ˙ j , x 14 = p c j
The input vector u is u 1 = i .
The parameters in the parameter vector α are shown in Table 2.
Therefore, the state space equation of the ABPSVCS can be expanded as follows:
x ˙ 1 = x 2
x ˙ 2 = K t i + K m x 1 K f g ( r x 1 + x 3 ) r K a x 1 B a x 2 J a
x ˙ 3 = x 4
x ˙ 4 = A c ( x 5 x 9 ) K f g ( r x 1 + x 3 ) 2 K c x 3 B c x 4 M c
x ˙ 5 = E ( k q r x 1 + k q r b x 1 k c x 5 + k c x 9 A c x 4 A v x 7 ) V c v
x ˙ 6 = x 7
x ˙ 7 = A v x 5 A b x 8 A h x 9 B v x 7 K x 6 K f x 6 [ 1 + s i g n ( x 6 ) 2 P s + 1 + s i g n ( x 6 ) 2 x 9 s i g n ( x 6 ) x 8 ] K x v 0 M v
x ˙ 8 = E V g b [ K d x 6 1 + s i g n ( x 6 ) 2 P s + 1 + s i g n ( x 6 ) 2 x 9 s i g n ( x 6 ) x 8 C b x 8 A g x 11 ]
x ˙ 9 = E V h [ Q s + 1 s i g n ( x 6 ) 2 K d x 6 x 8 x 9 R c ( x 9 x 14 ) K d 2 x 12 x 9 ]
x ˙ 10 = x 11
x ˙ 11 = A g x 8 B g x 11 K g x 10 M g
x ˙ 12 = x 13
x ˙ 13 = A j x 14 B j x 13 K j ( x 12 + x j 0 ) k s x 12 x 9 M j
x ˙ 14 = E [ R c ( x 9 x 14 ) A j x 13 ] V c j
The 41 parameters in the parameter vector α contain the structural parameters and working parameters of the ABPSVCS, most of which may undergo dynamic changes. After each parameter changes, the influence on the system characteristics must be different. In order to judge the influence degree of each parameter on the system characteristics quickly and accurately, the first-order trajectory sensitivity equations of the parameters will be established according to the state space equations of the system in the next section.

3. First-Order Trajectory Sensitivity Theory of the ABPSVCS

After establishing the state-space model of the ABPSVCS, the first-order trajectory sensitivity of each parameter in the system is theoretically deduced based on the model in this section.
The general solution of the state-space Equation (1) of the ABPSVCS is shown in Equation (19).
ϕ n ( t ) = x ( t , α ) n
In Equation (19), n = 1,2,3,…,14 represents the nth state variable. The first-order trajectory sensitivity of each parameter αn with respect to each state variable X n can be defined by the partial derivatives of each state variable with respect to each parameter:
λ n f i = ( x α i ) n
In Equation (20), i = 1,2,3,…,14 represents the i th parameter vector. According to the definition of Equation (20), it can be seen that the first-order trajectory sensitivity of each parameter represents the influence of parameter changes on state variables.
Meanwhile, according to its definition, λ n f i can be a two-dimensional matrix of order n × i , and its initial conditions are shown in Equation (21).
λ n f 0 i = ( x 0 α i ) n
The partial derivative of the parameter vector α on both sides of the system state space Equation (1) can be obtained as follows:
( x ˙ α i ) n = f α i = ( f x ) n ( x α i ) n + ( f u ) n ( u α i ) n + ( f α i ) n
In general, the external input condition vector u is not affected by the parameter vector, that is, the two are independent of each other, so there is the following equation:
( u α i ) n = 0 n × i
Therefore, Equation (22) can be simplified as
( x ˙ α i ) n = ( f x ) n ( x α i ) n + ( f α i ) n
Substitute Equation (20) into Equation (24) to obtain
λ ˙ n f i = ( f x ) n λ n f i + ( f α i ) n ) n + ( f α i ) n
Equation (25) is the first-order trajectory sensitivity equations of the ABPSVCS. It can be seen that the equations are first-order inhomogeneous differential equations. At the same time, it should be noted that the coefficient term ( f / x ) n and the free term ( f / α i ) n in the equations are both time-varying matrices.
When the parameter vector changes Δα, it is assumed that the system state variable also changes x correspondingly, HOT is the higher order term, and then Equation (19) is expanded into a Taylor series:
x ( t , α + α ) n = x ( t , α ) n + ( x ( t , α ) α ) n · α + H O T
For any parameter α i , there is
x ( t , α + α i ) n = x ( t , α ) n + ( x ( t , α ) α i ) n · α i + H O T
Note that in Equation (27), ( x ( t , α ) / α i ) n is the of first-order trajectory sensitivity λ n f i of the i th parameter. Therefore, by combining Equations (25) and (27), we can obtain
x = λ n f i · α i + H O T
In Equation (28), after ignoring the higher order term, the change of the ground state variable Δ x caused by parameter change Δ α i can be approximately obtained.
Since the dynamic model of the ABPSVCS is derived in the form of an incremental equation, it can be considered that all state variables at the initial moment are in zero state:
x 0 = [ 0 , 0 , 0 , 0 , 0 , 0 , 0 , 0 , 0 , 0 , 0 , 0 , 0 , 0 ] T
According to Equation (21), the initial value of the first-order trajectory sensitivity function λ n f i is
λ n f 0 i = 0 n × i

4. First-Order Trajectory Sensitivity Analysis of the ABPSVCS

4.1. Parameter Grouping in the System

On the basis of Section 3, this section will analyze in detail the first-order trajectory sensitivity of all parameters in the ABPSVCS to the important state variable of braking pressure, and explore the key parameter sets that have an obvious influence on the system pressure output.
As the parameter vector in the ABPSVCS studied in this paper contains 41 parameters, the vector scale is large. In quantitative analysis, if the analysis results of all parameters are drawn in the same graph, the graph will be disorderly, which is not conducive to the analysis of the specific influence of each parameter. Therefore, in order to analyze the first-order trajectory sensitivity of the ABPSVCS in a complete and detailed way, 41 parameters in the parameter vector need to be classified and analyzed according to the structure of the ABPSVCS in this part of the study. Note that in the process of classifying parameters, the oil bulk modulus α12, one of the key parameters of the vessel equation, at the same time participates in the recovery pressure and the process of establishing the brake pressure and the return oil pressure, and the ABPSVCS of multiple structures has appeared, but its influence on the brake pressure x8 is unified; therefore, to avoid repetition, it is only analyzed in the parameter group of the jet amplifier.
Specific parameter grouping is shown in Table 3.

4.2. Dynamic Analysis of the First-Order Trajectory Sensitivity of the ABPSVCS

From the previous analysis, it can be seen that in the first-order trajectory sensitivity equations of the ABPSVCS, the time-varying free term matrix is a 14 × 14-order square matrix, and the time-varying free term matrix is a 14 × 41-order matrix. Therefore, the first-order trajectory sensitivity equation set has a total of 14 × (41 + 1) equations to be solved, that is, 14 state equations and 14 × 41 first-order trajectory sensitivity equations. If all are solved, the amount of calculation is huge. For the ABPSVCS studied in this paper, the main concern is the control performance of the system on the output pressure and the influence of the parameters on the brake pressure. Therefore, only the sensitivity of each parameter in the system to the brake pressure Pb, namely λ 8 f i , is analyzed in this paper.

4.2.1. First-Order Trajectory Sensitivity Is Used to Solve the Working Condition

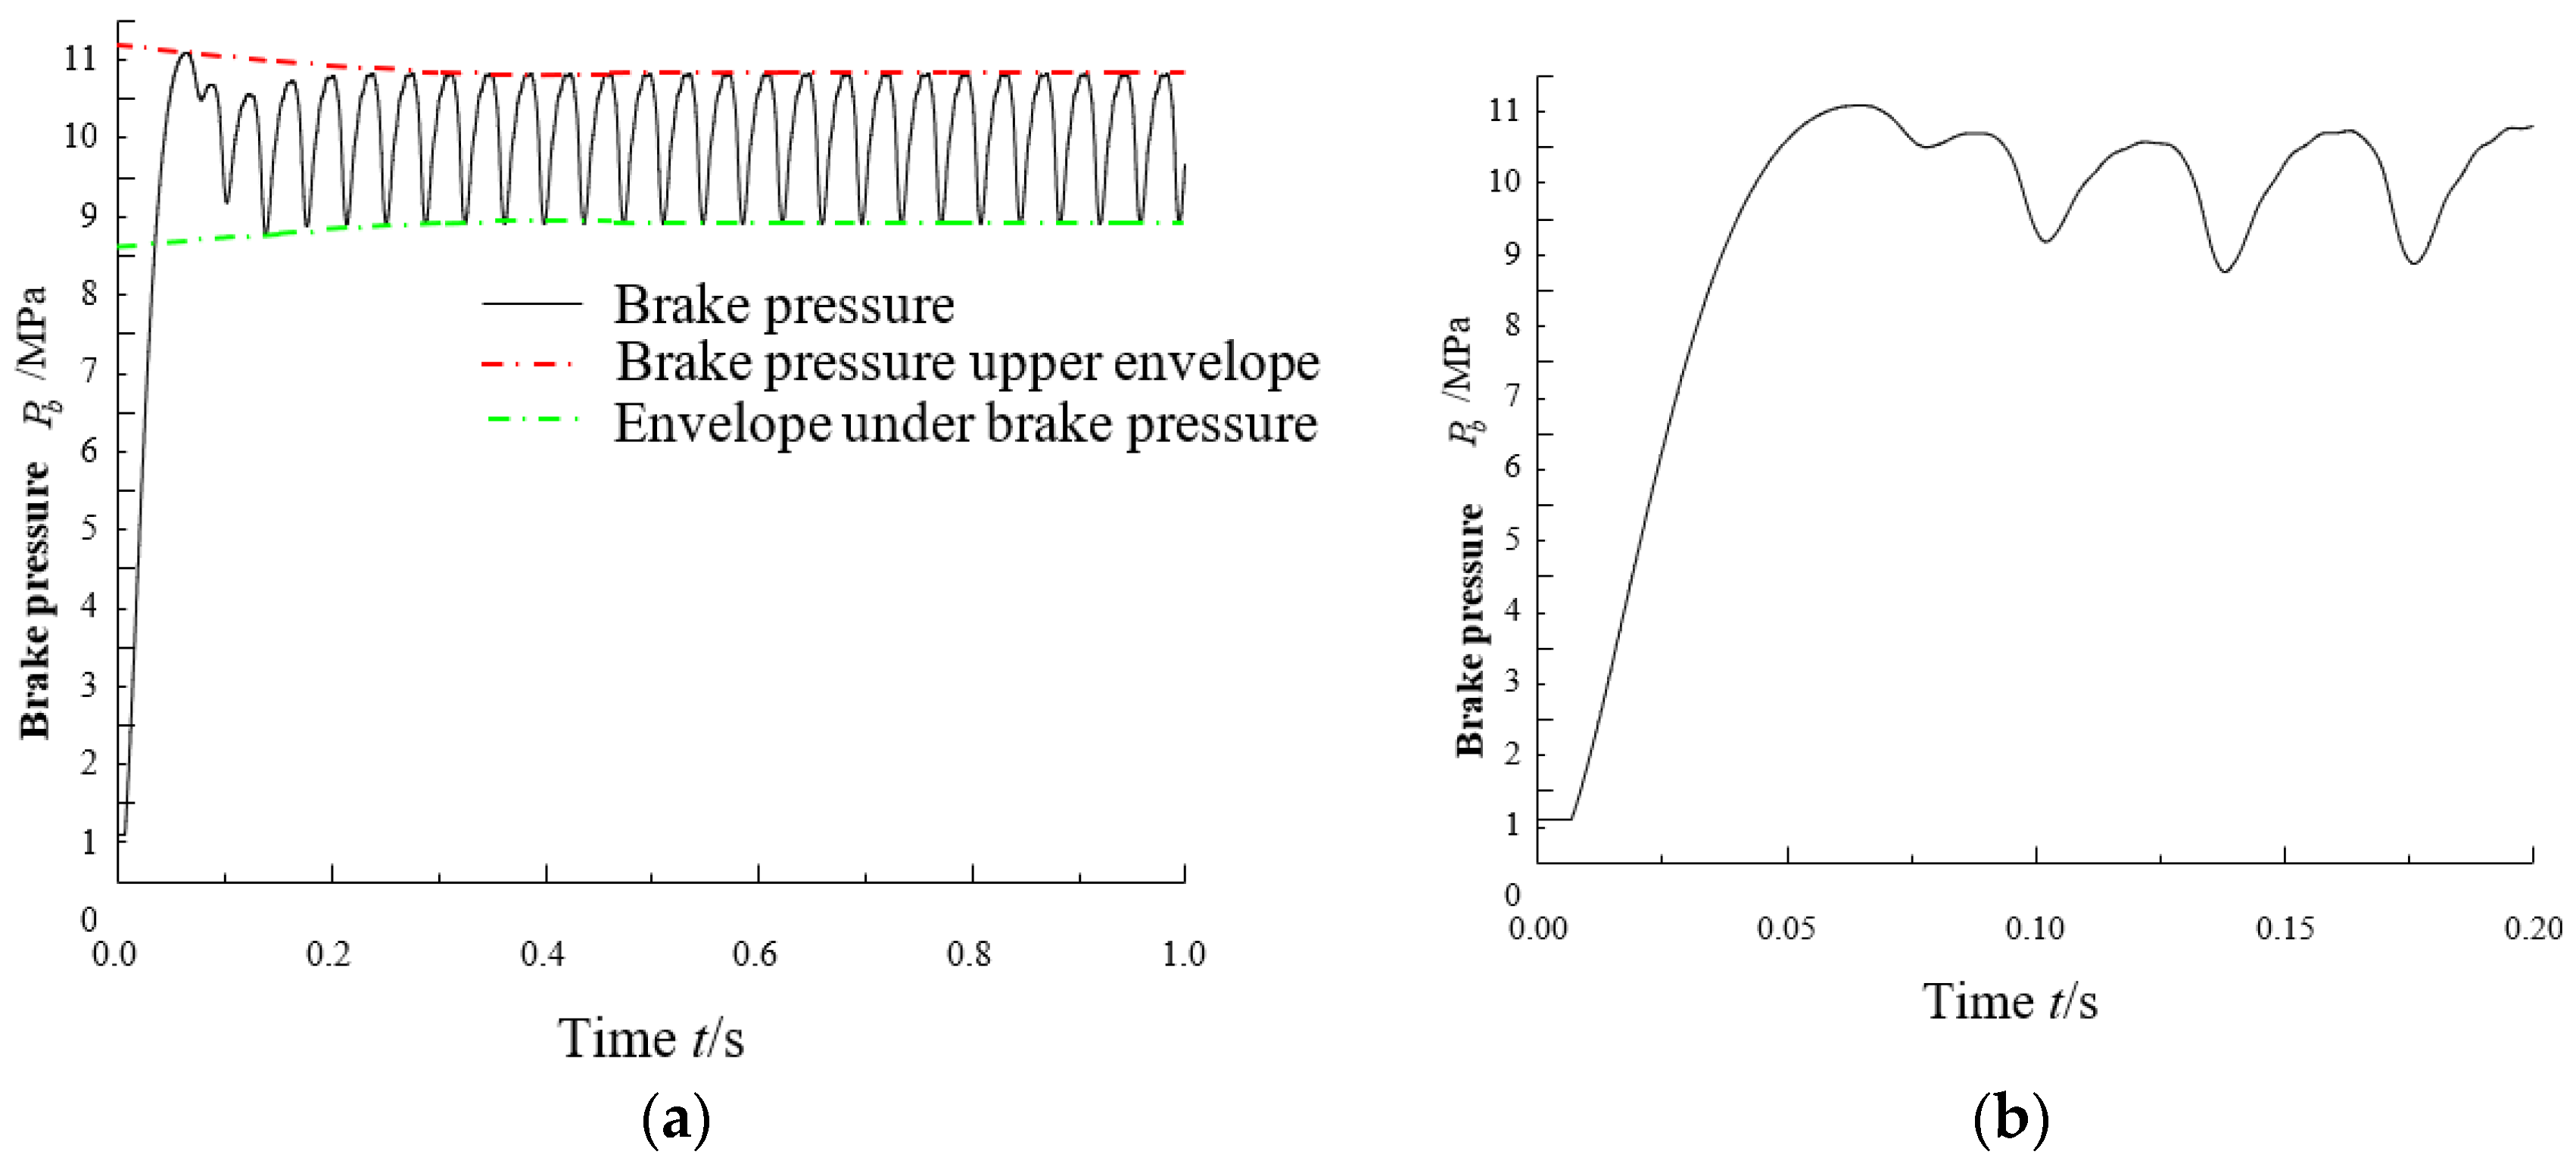
In the analysis of this section, the step response commonly used in an ABPSVCS is used to analyze the sensitivity of each parameter in the system to clarify the influence law of parameter changes in the system on the output of the brake pressure. The step current signal of 40 mA is given at the moment of 0 s, and the corresponding brake pressure simulation analysis curve is shown in Figure 2. It can be seen that the brake pressure formed a stable constant amplitude oscillation at 0.2 s. Therefore, the sensitivity of all parameters to the brake pressure can be obtained only by taking the data from 0 to 0.2 s for simulation analysis.

4.2.2. The First-Order Trajectory Sensitivity Function of the ABPSVCS

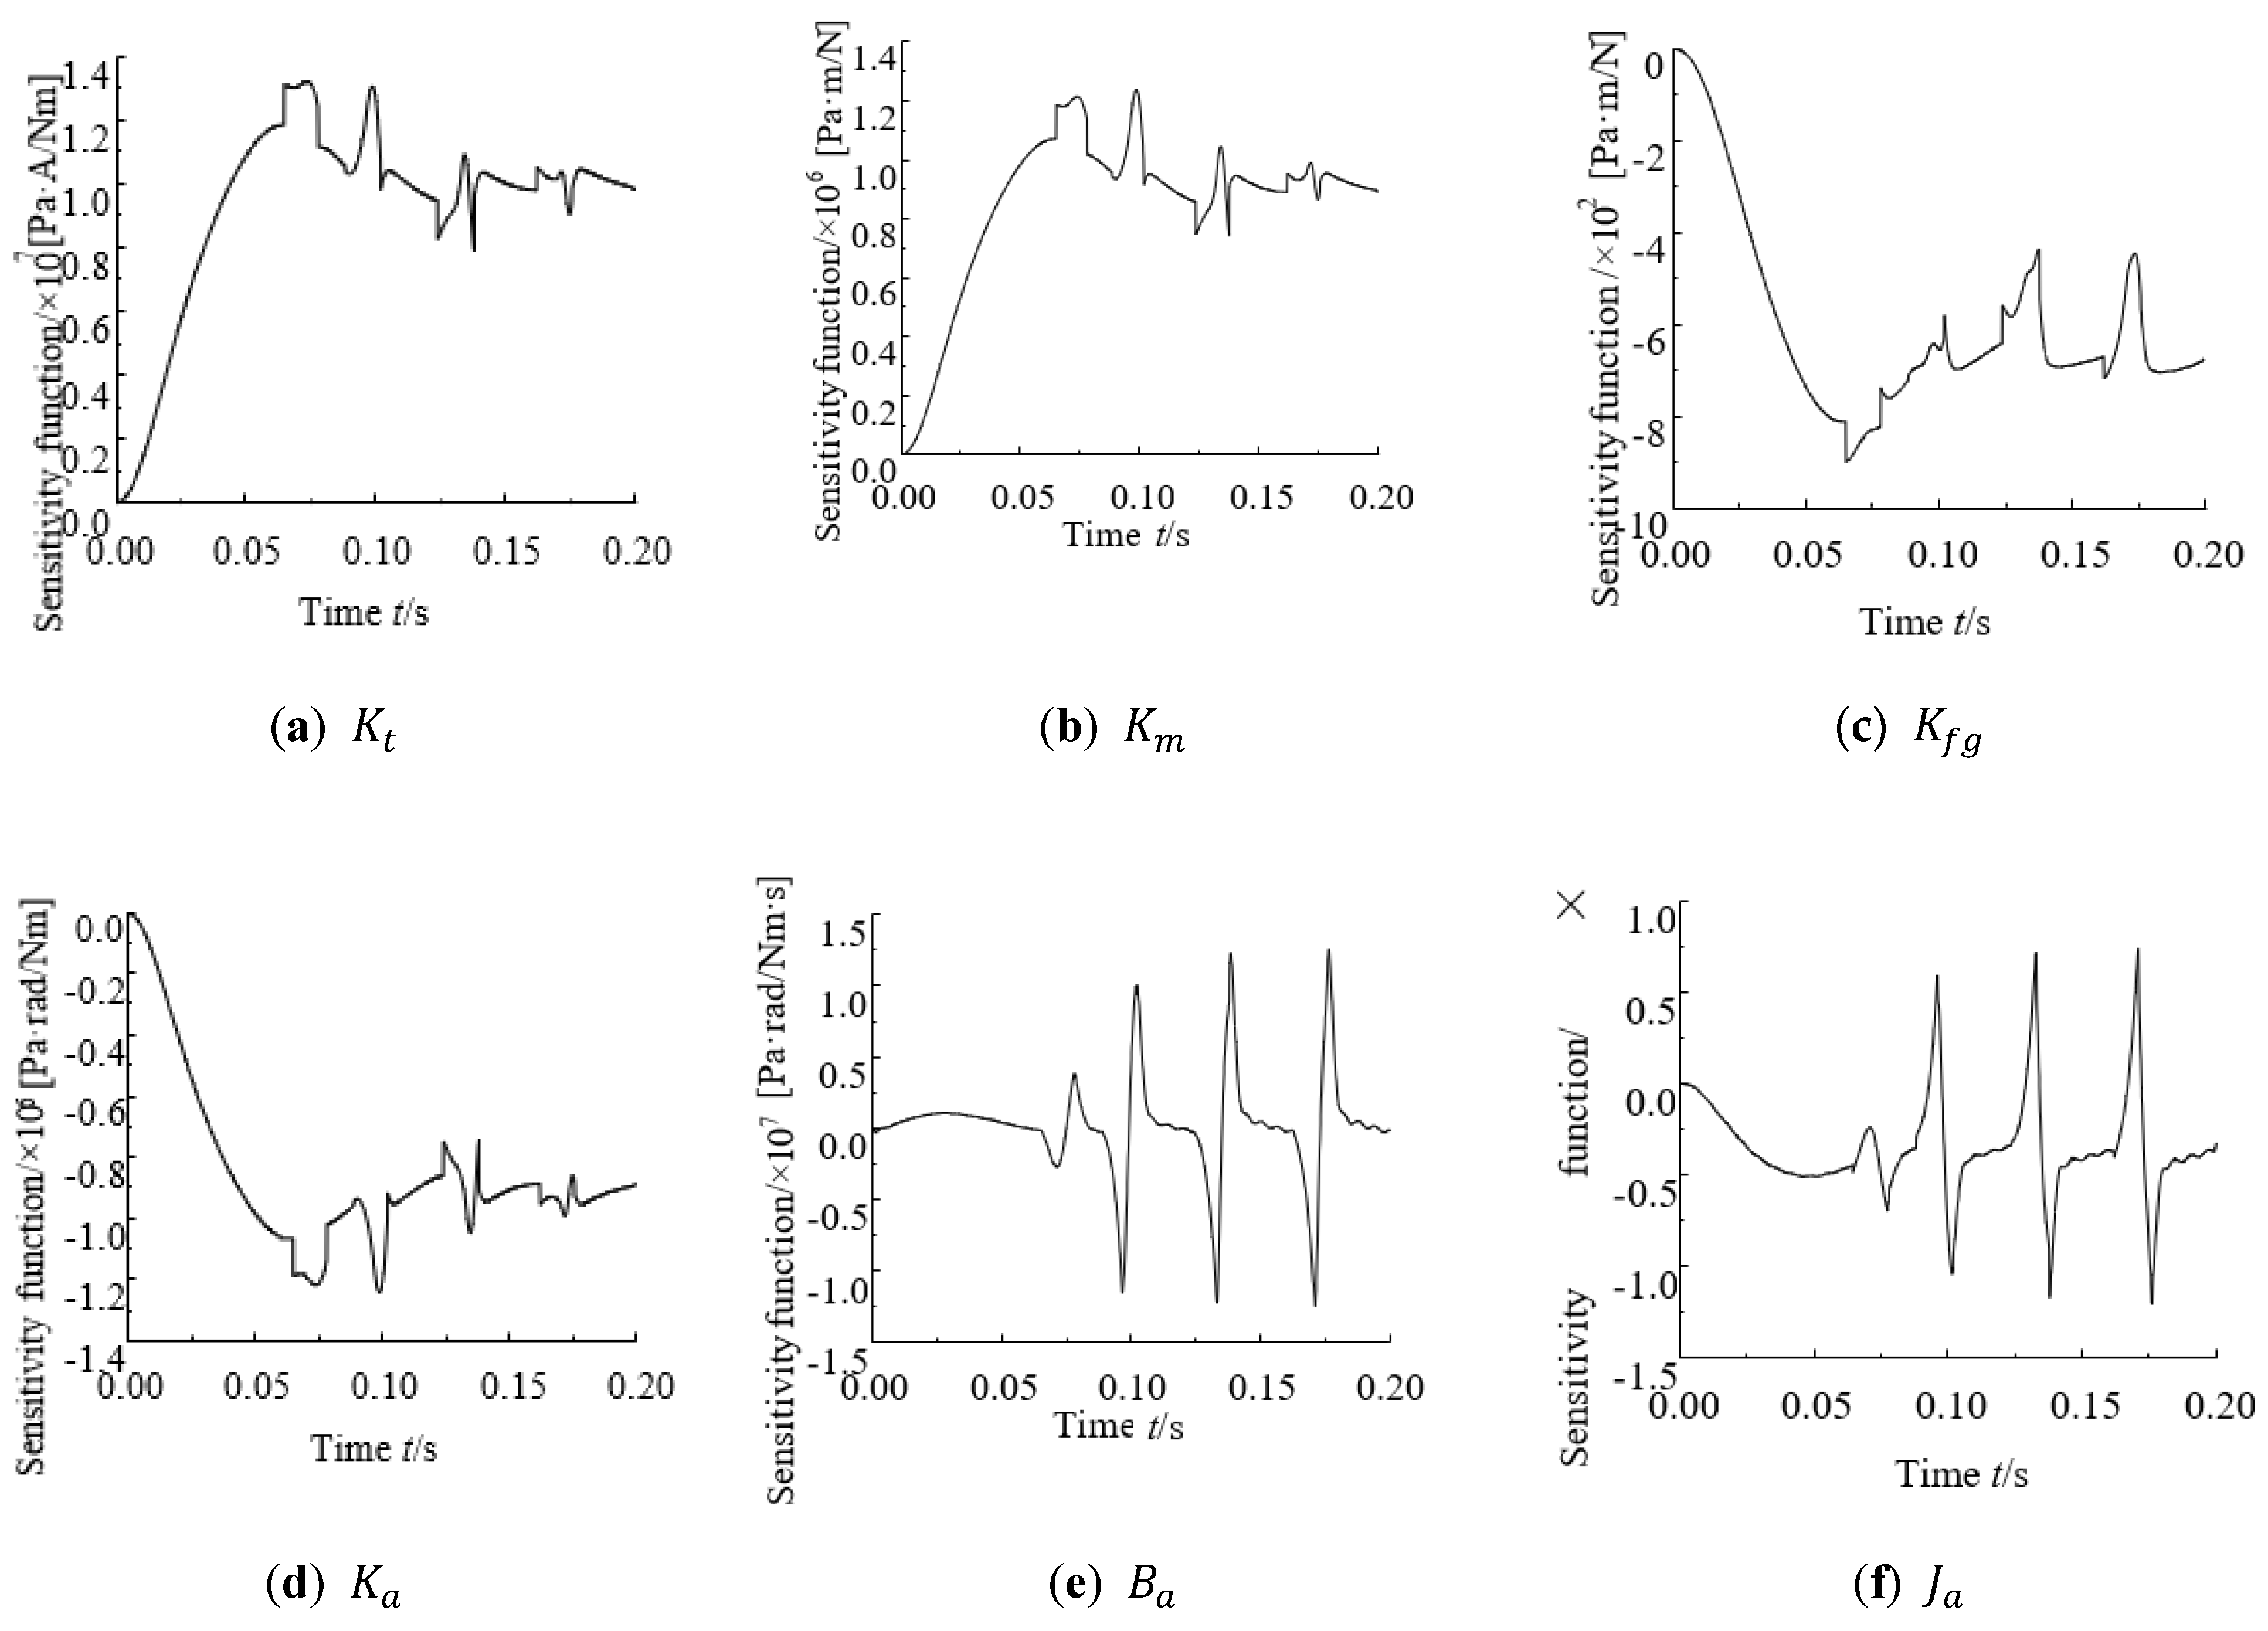
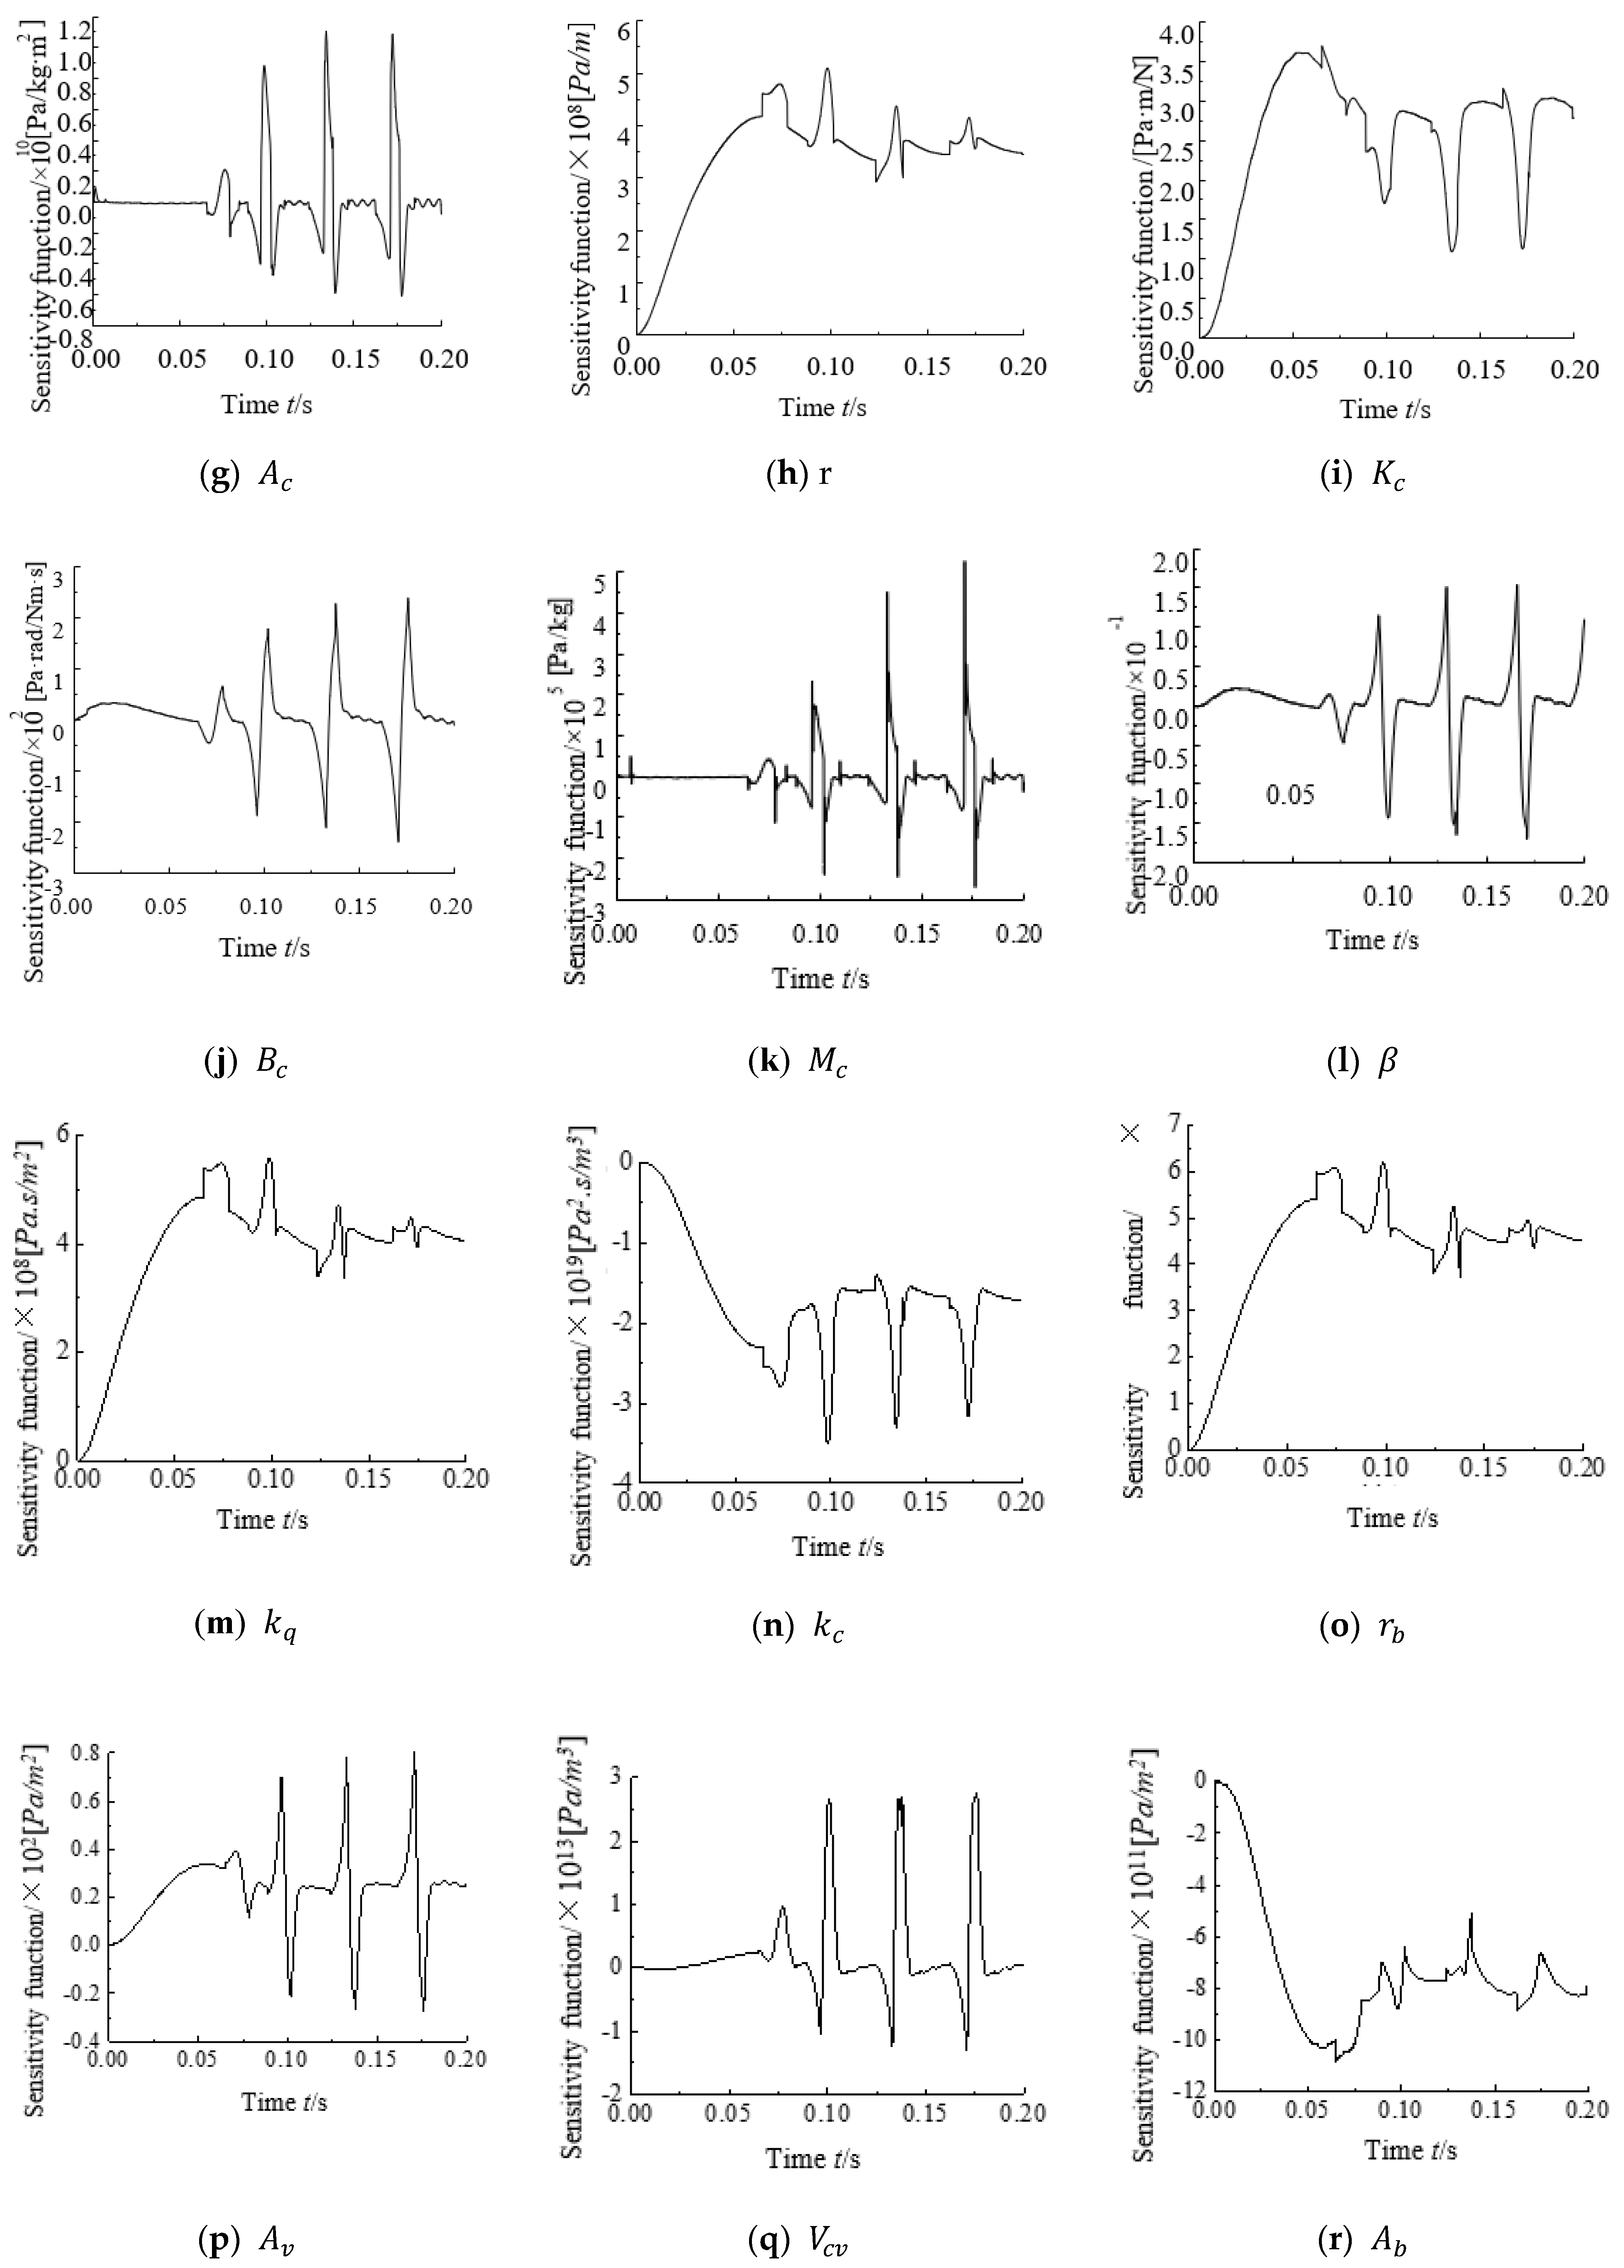
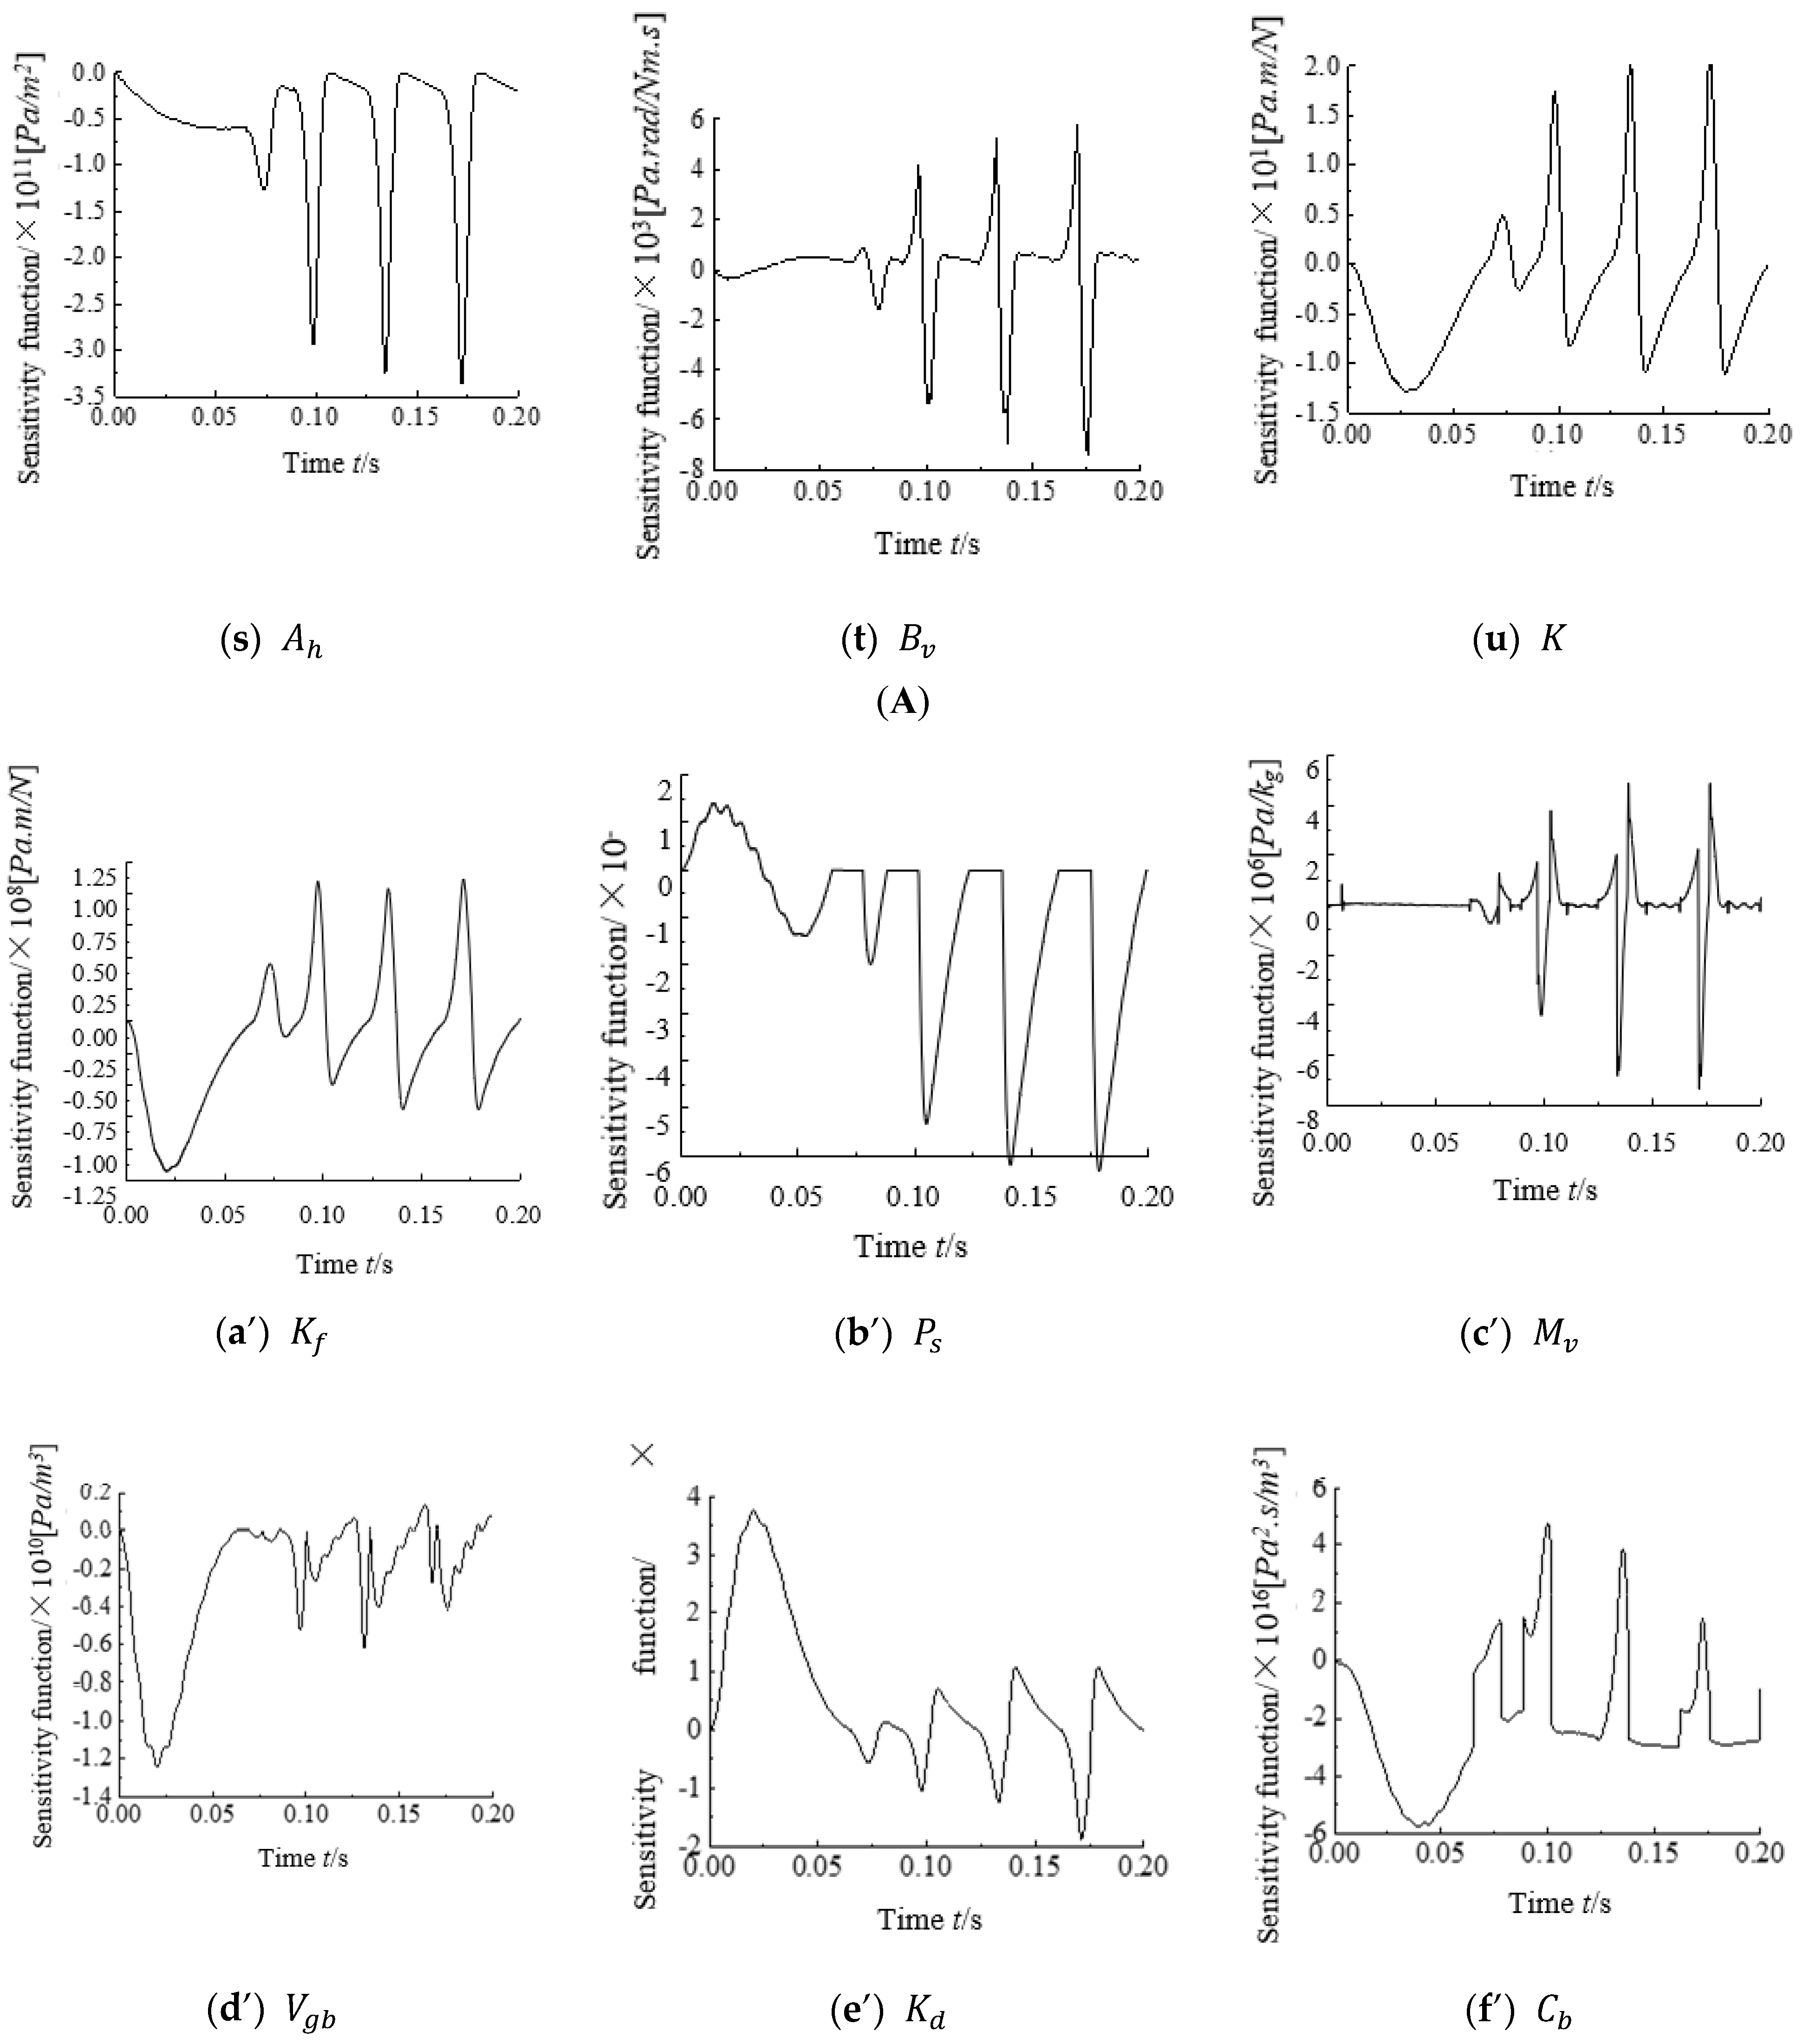
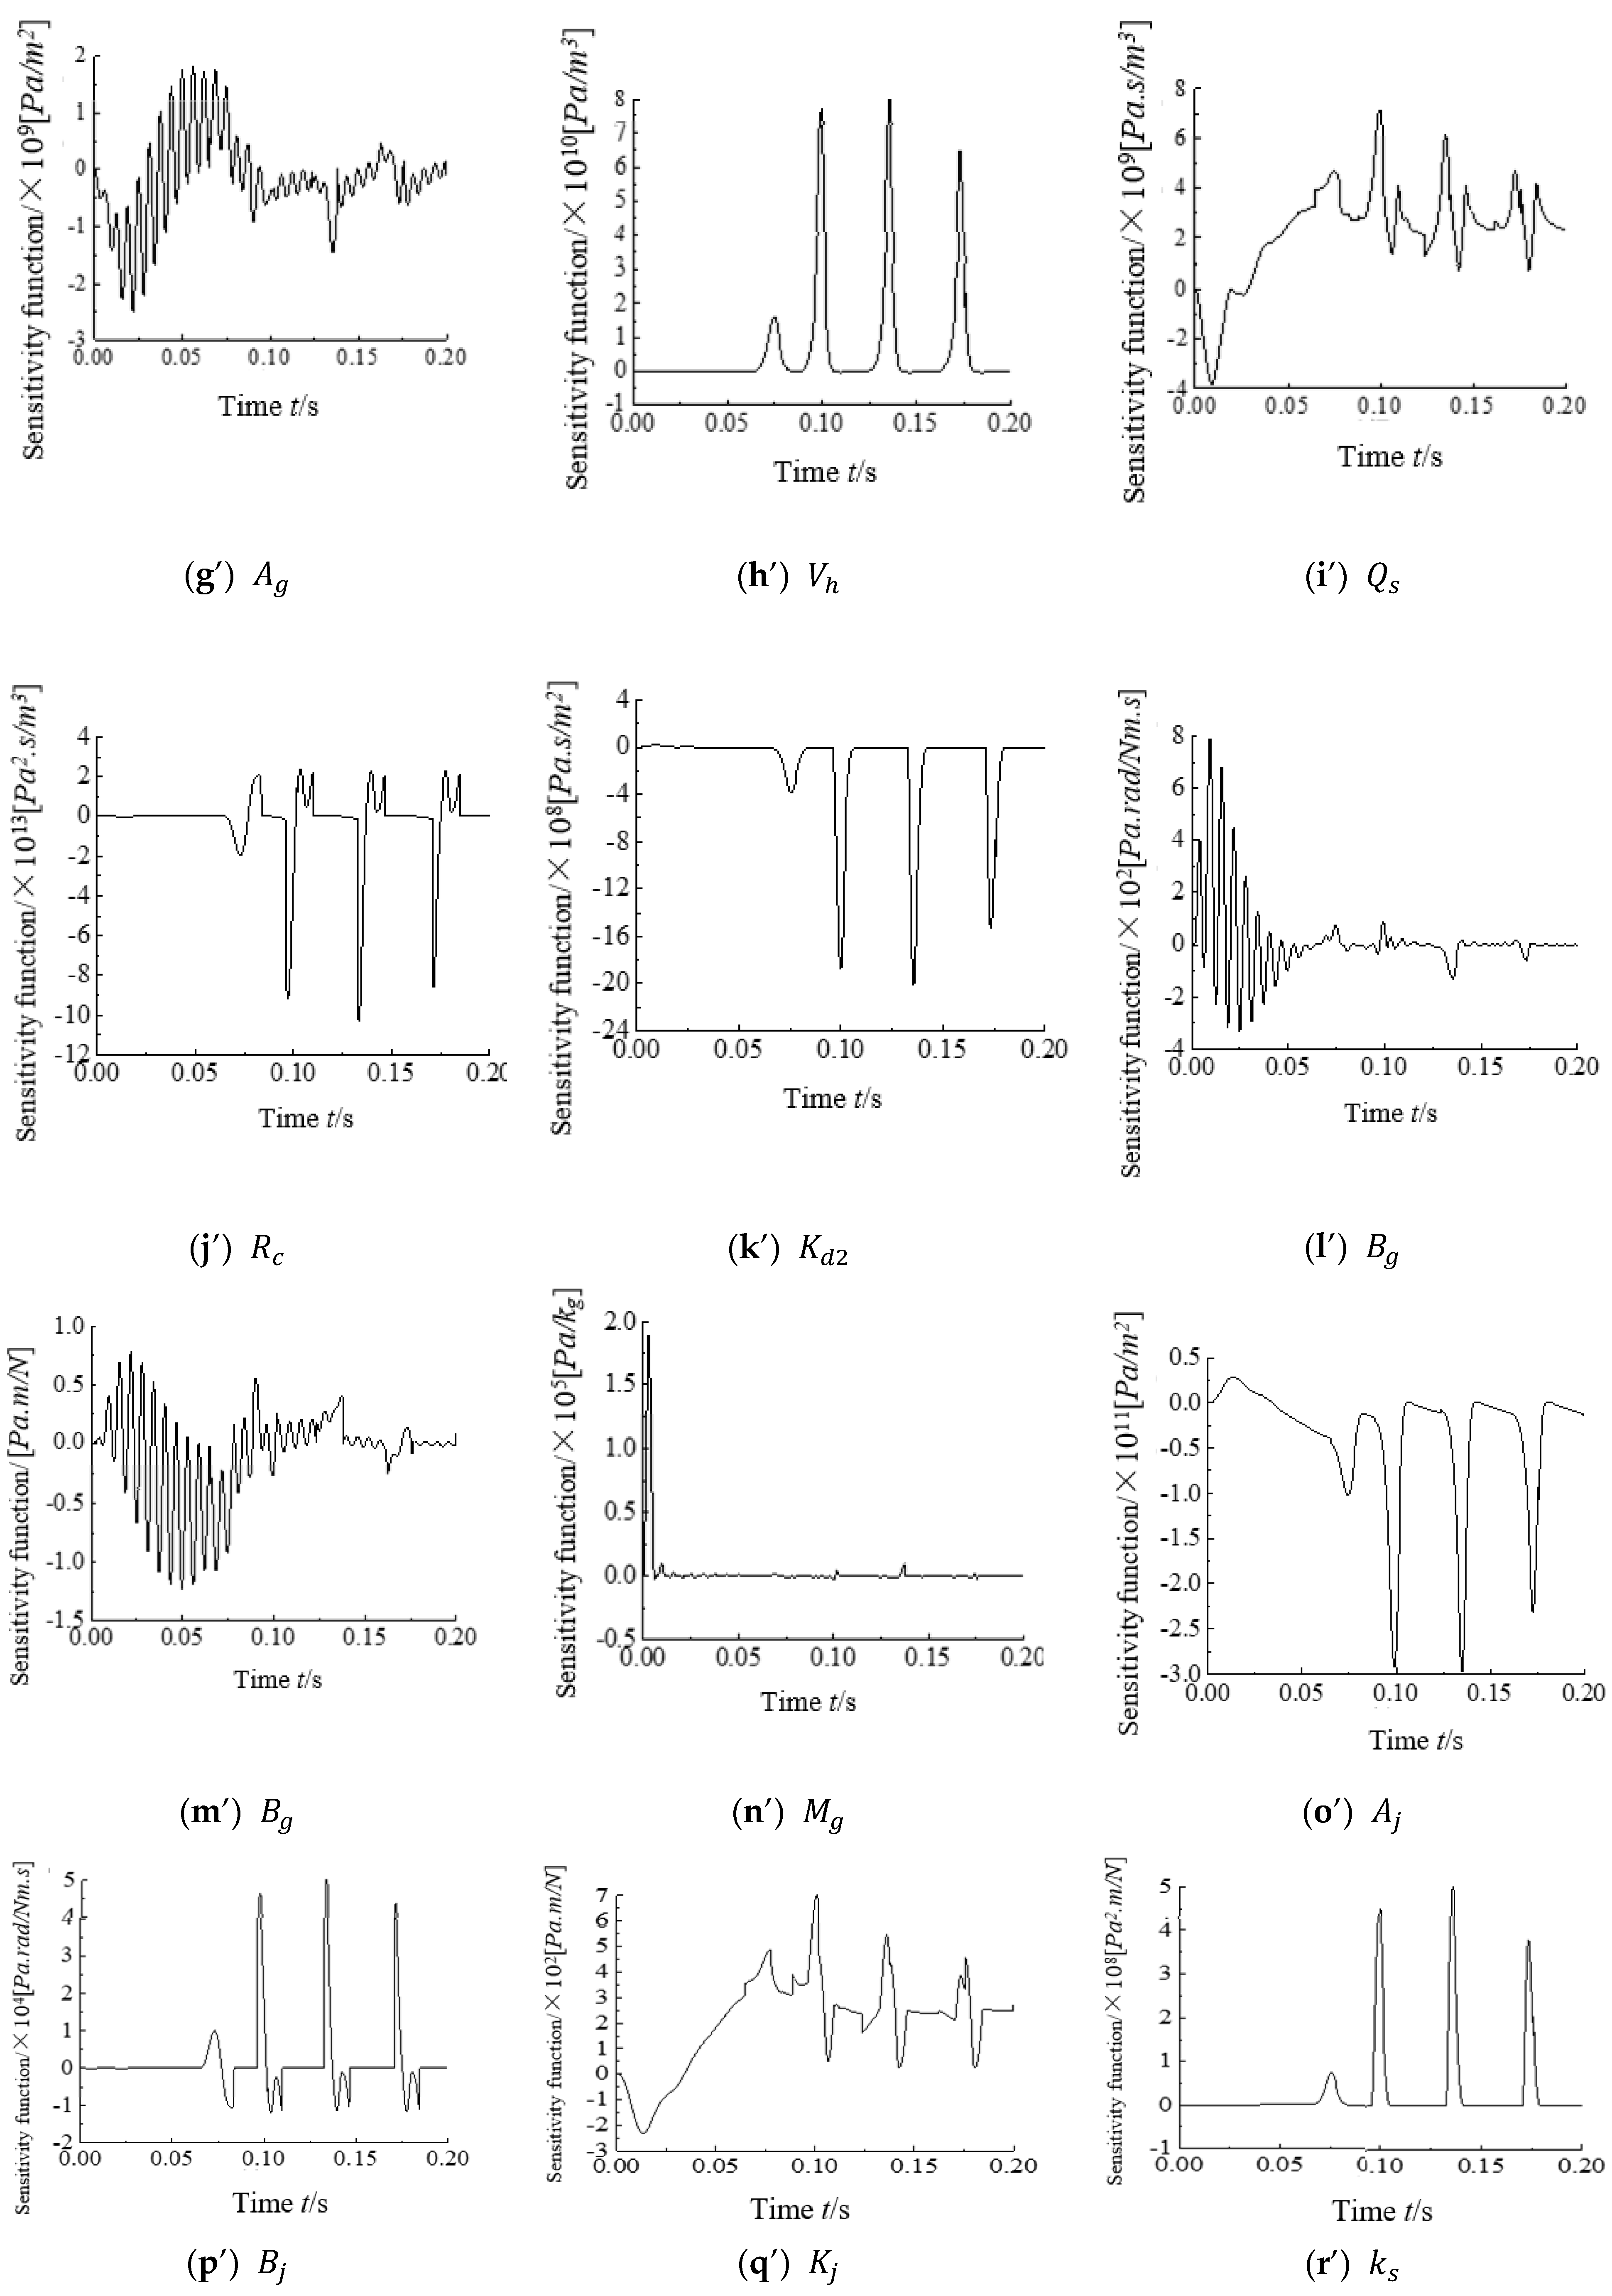
According to Section 3 of the simplified ABPSVCS dynamic model, the third quarter of the first-order system trajectory sensitivity equations are derived; from the joint solution in the MATLAB software platform, we can get the 40 mA step current signal under various parameters on the brake pressure P b first-order trajectory sensitivity curves as shown in Figure 5 and Figure 6.
According to Figure 5 and Figure 6, it can be seen that in addition to the four parameters of the actuator piston rod area Ag, the mass of the movable part of the actuator Mg, the spring stiffness of the actuator Kg, and the damping coefficient Bg of the actuator, the rest of the parameters all had a more significant impact in the brake pressure equal amplitude oscillation stage, and the first-order trajectory sensitivity time-history curve of each parameter also had a periodic oscillation characteristic similar to the brake pressure. This shows that most of the parameters in the system will have an impact on the equal amplitude oscillation phase of the brake pressure. For the brake actuator, with the large rigidity and large inertia load, its existence is a necessary condition for the output pressure of the brake pressure servo valve. The changes of the above four parameters will cause the pressure change in the brake actuator rodless cavity. The sensitivity time-history curve only changed significantly during the brake pressure build-up phase (0~0.1 s). Therefore, it can be judged that they mainly affect the brake pressure build-up process, but are not sensitive to the constant amplitude oscillation of the brake pressure.

4.2.3. Simulation Results of Jet Amplifier Parameters Sensitivity

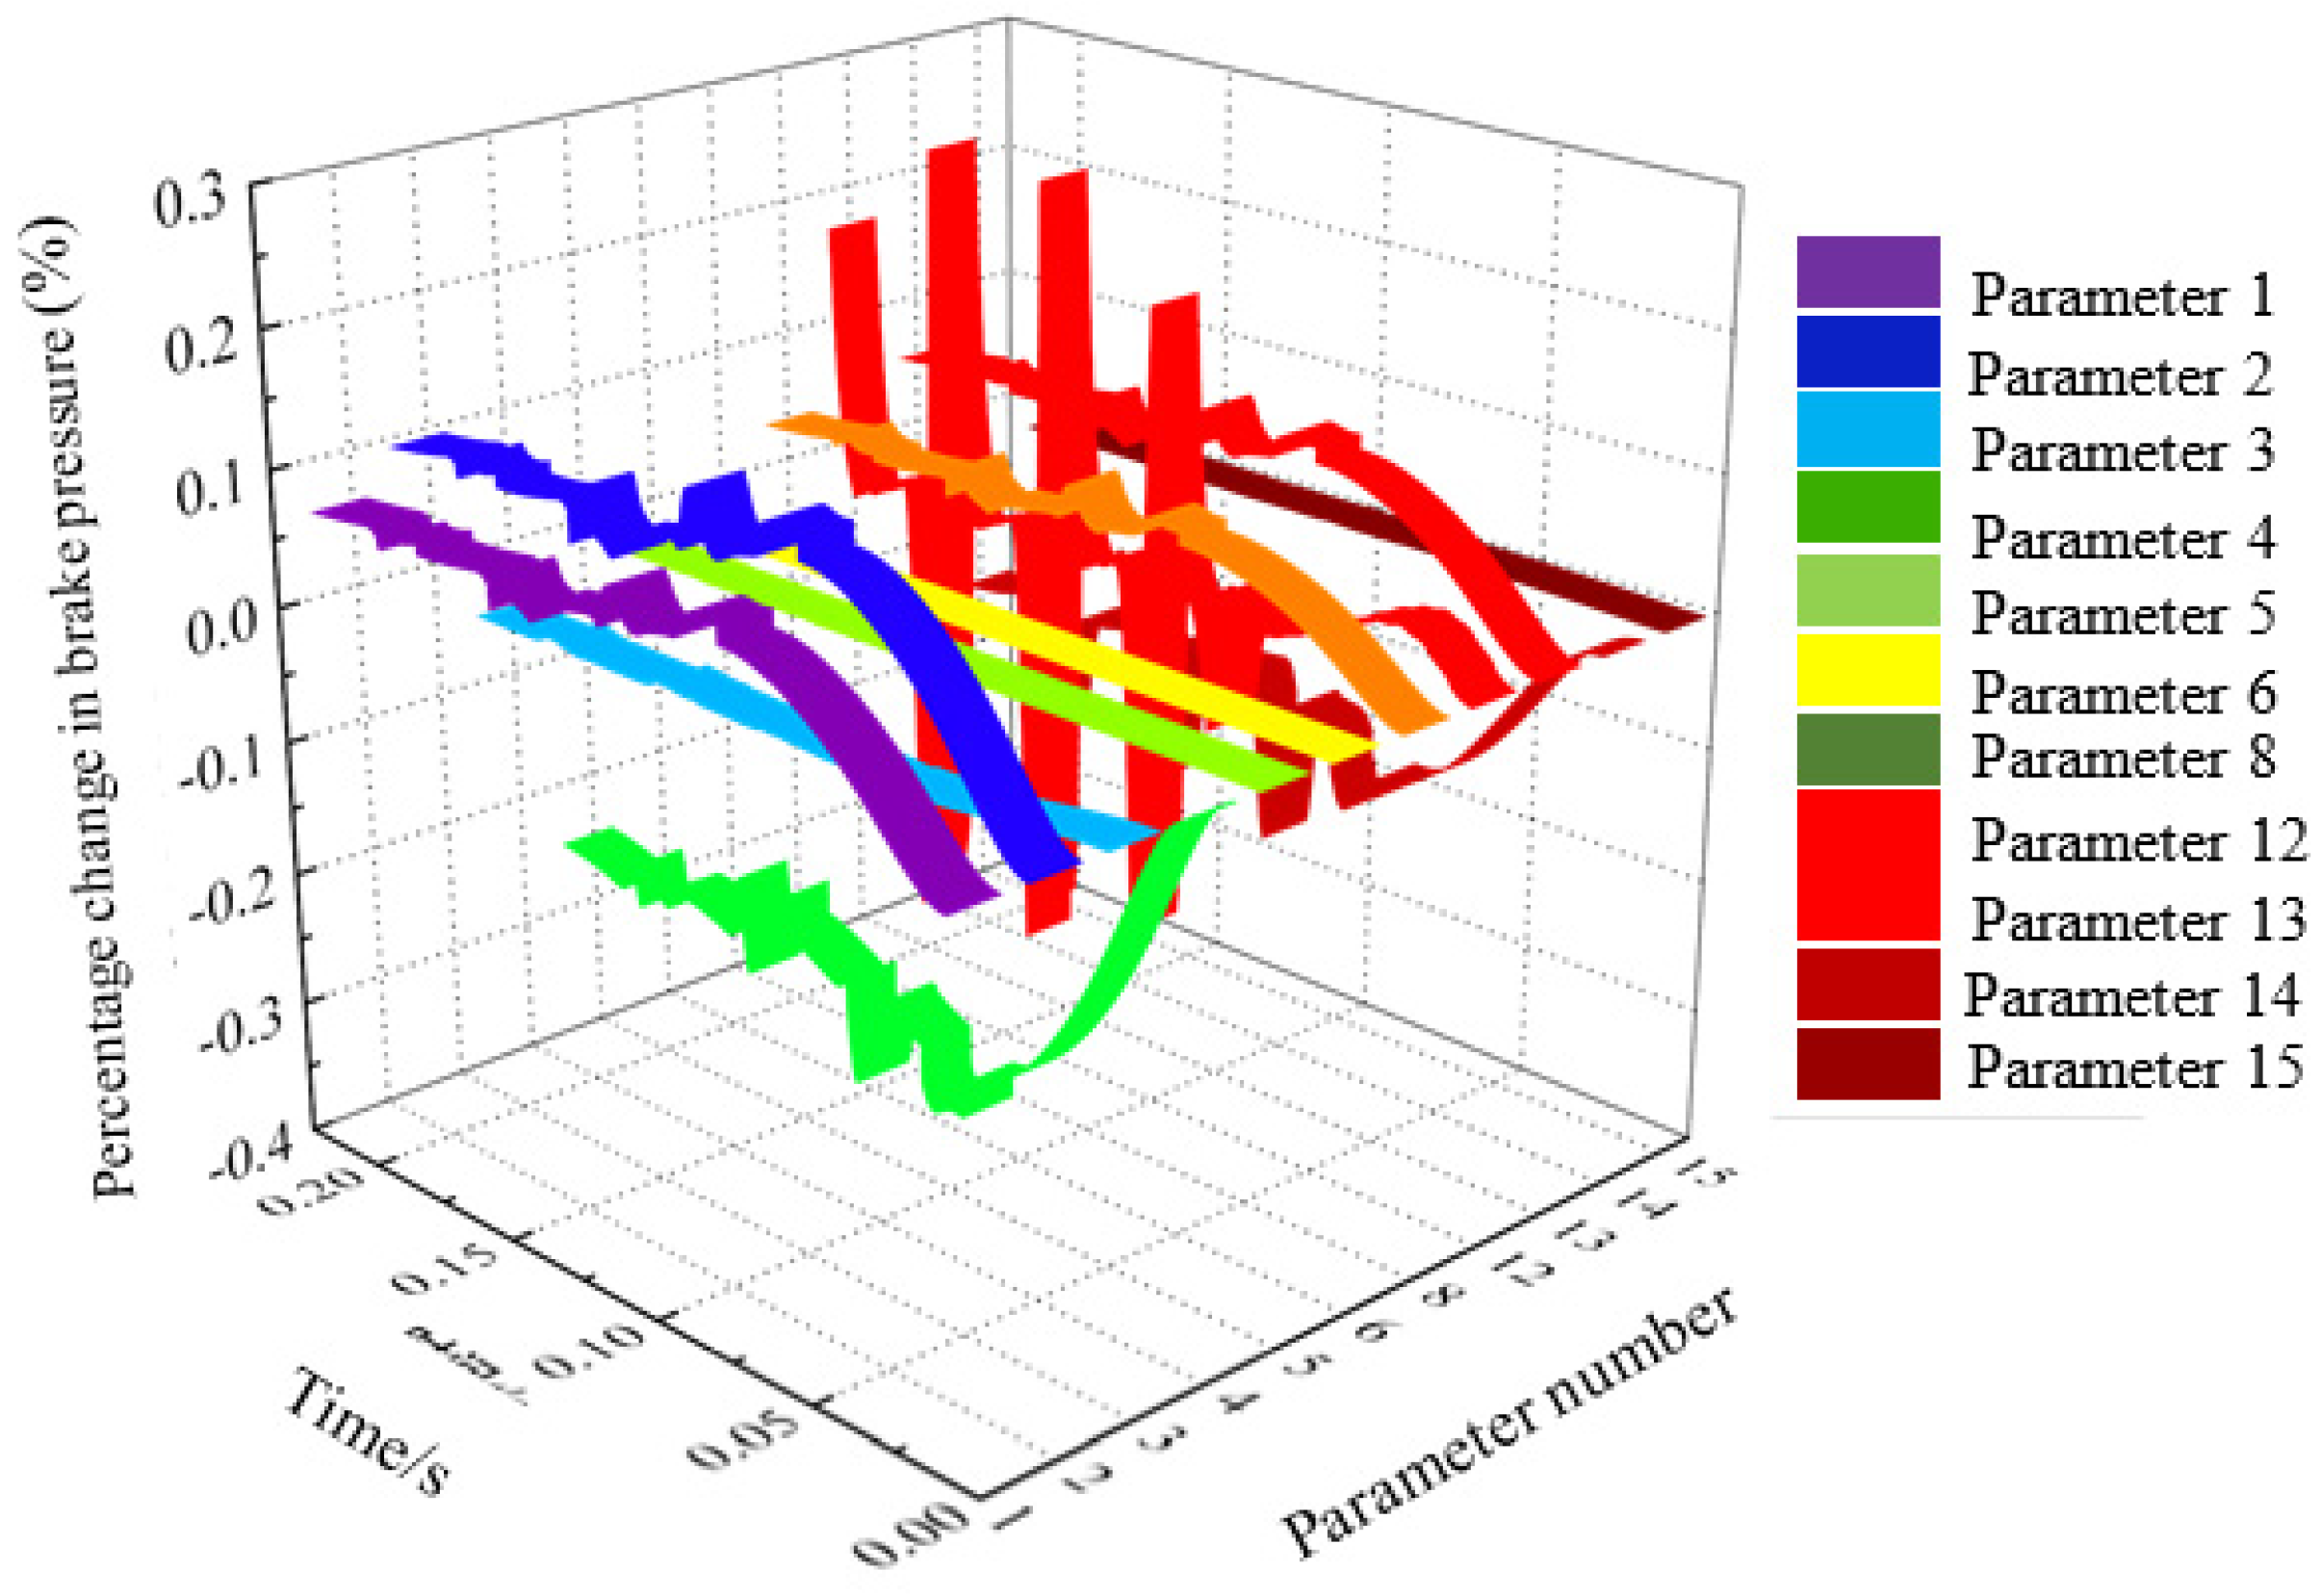
In Figure 5, the percentage change of brake pressure x8 after a 10% change of the parameters of the jet amplifier programmed in the MATLAB software platform (α1 = Kt, α2 = Km, α3 = Kfg, α4 = Ka, α5 = Ba, α6 = Ja, α8 = r, α12 = βt, α13 = kq, α14 = kc, α15 = rb) is shown. Among them, the input signal is still a 40 mA step current signal.
According to Figure 7, it can be seen that in the jet amplifier, except for the four parameters α3 = Kfg, α5 = Ba, α6 = Ja, and α15 = rb, the parameters had a significant effect on the brake pressure x8. At the same time, it is observed that α1 = Kt, α2 = Km, α4 = Ka, and α13 = kq had significant effects during the brake pressure formation stage and the stable oscillation stage. The two parameters α12 = βt and α14 = kc had a greater impact on the brake pressure equal-amplitude oscillation stage, and the trend of the time-history curve was consistent with the trend of the brake pressure fluctuation.

4.2.4. Sensitivity Simulation Results of Feedback Stage Parameters

In Figure 8, the percentage of change in brake pressure x8 caused by the 10% change in the parameters of the feedback stage programmed in MATLAB (α7 = Ac, α9 = Kc, α10 = Bc, α11 = Mc, α17 = Vc) is shown. Among them, the input signal is still a 40 mA step current signal.
According to Figure 8, it can be seen that in the feedback level parameters, the amplitude of the α17 = Vc time-history curve was significantly higher than the other four parameters. At the same time, the amplitude of the brake pressure in the constant amplitude oscillation period fluctuated significantly and was related to the brake pressure fluctuations. This trend was consistent. The two parameters α7 = Ac and α9 = Kc had obvious fluctuations. Compared with them, α10 = Bc and α11 = Mc had almost no changes in the entire time period.

4.2.5. Sensitivity Simulation Results of Power Stage Parameters

In Figure 7, the percentage of change in brake pressure x8 caused by a 10% change of the parameters of the power level programmed in MATLAB (α16 = Av, α18 = Ab, α19 = Ah, α20 = Bv, α21 = K, α22 = Kf, α24 = Mv, α26 = Kd) is shown. Among them, the input signal is still a 40 mA step current signal.
According to Figure 9, it can be seen that in the power level parameters, the amplitude of the time-history curve with α16 = Av, α18 = Ab, and α26 = Kd was significantly higher than the other parameters. At the same time, the amplitude fluctuation of α16 = Av in the brake pressure equal amplitude oscillation period was more obvious and consistent with the brake pressure fluctuation trend.
The parameter α22 = Kf had little change in the amplitude of the time-history curve during the whole time period, but it also fluctuated in the constant amplitude oscillation section of the brake pressure. The time-history curve of the three parameters of α20 = Bv, α21 = K, and α24 = Mv was very small compared with the other power level parameters, and there was basically no fluctuation in the time-history curve.

4.2.6. Simulation Results of Parameters Sensitivity of the Brake Actuator

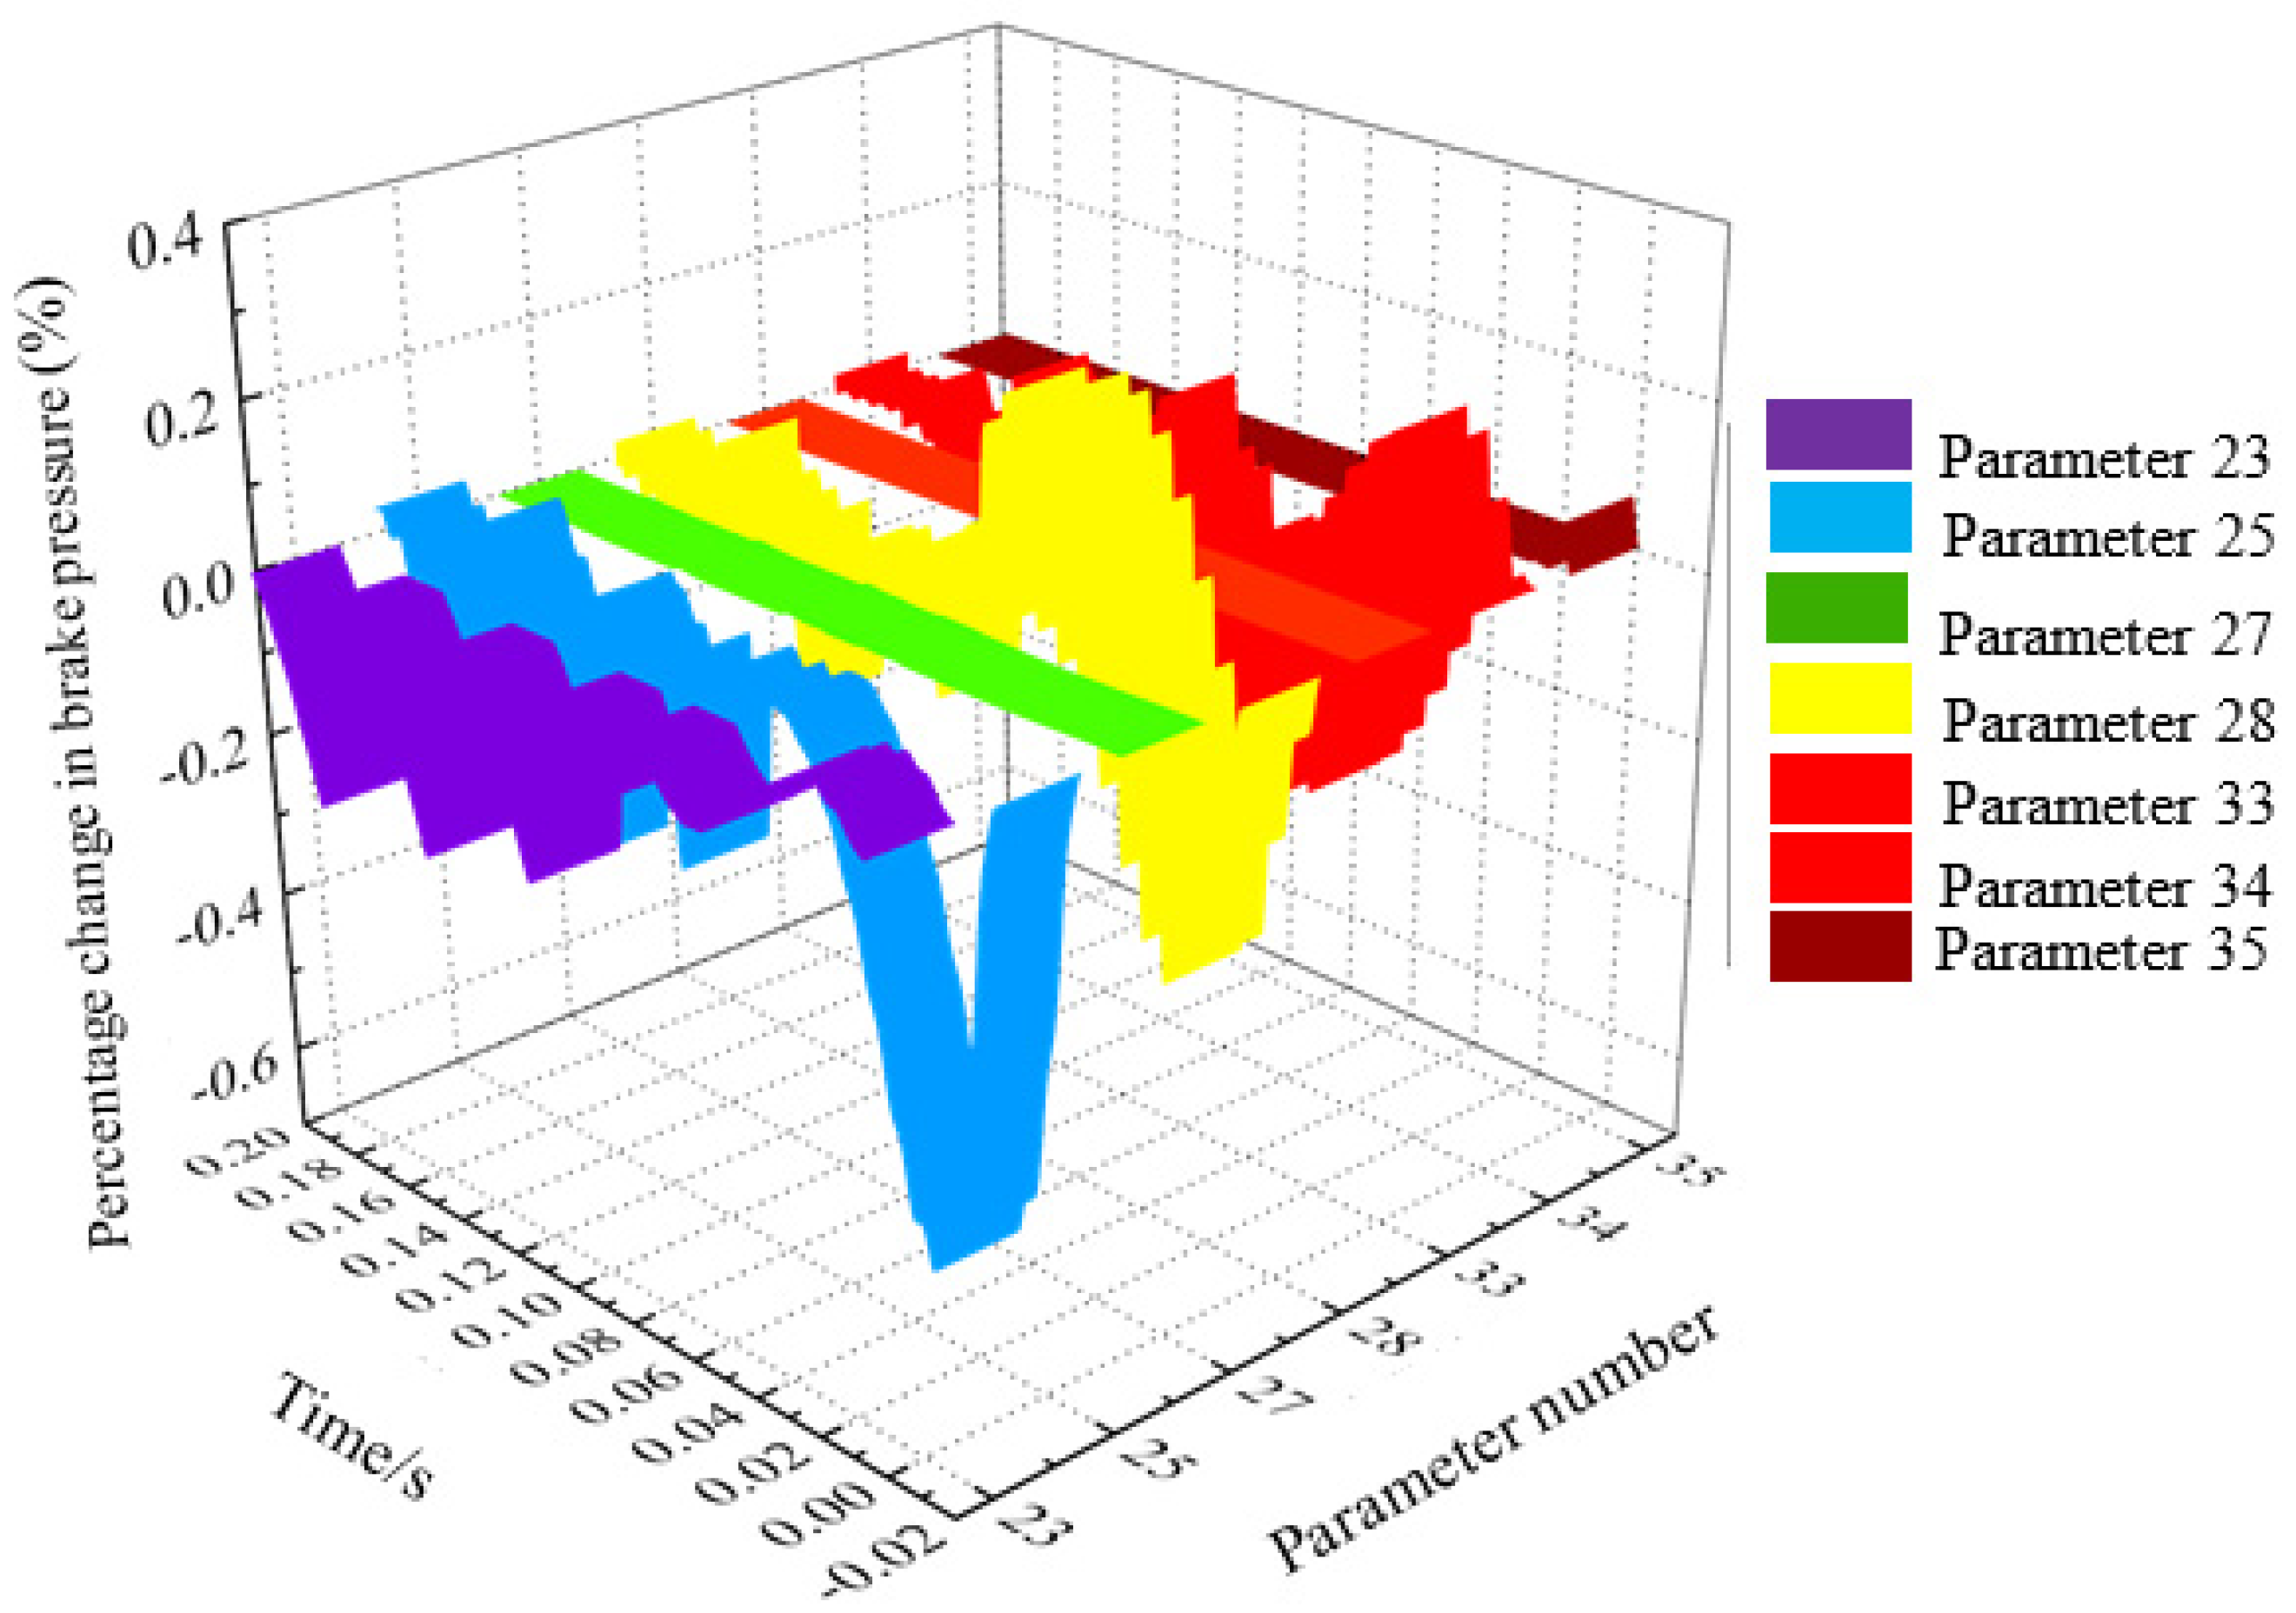
In Figure 8, the percentage change of brake pressure x8 caused by a 10% change in the power level parameters programmed in MATLAB (α23 = ps, α25 = Vgb, α27 = Cb, α28 = Ag, α33 = Bg, α34 = Kg, α35 = Mg) is shown.
According to Figure 10, it can be seen that in the brake actuator parameters, the amplitude of the time-history curve with α27 = Cb, α33 = Bg, and α35 = Mg was almost negligible compared with the other parameters. Both α23 = ps and α25 = Vgb had obvious fluctuations in the equal amplitude oscillation stage of the brake pressure and were of the same magnitude, but the significant difference between the two is that α25 = Vgb also had a significant impact on the brake pressure rise stage. The trends and amplitudes of the time-history curves of the two parameters α28 = Ag and α34 = Kg were very similar, and both of them had a large impact on the increase in brake pressure.

4.2.7. Simulation Results of Parameters Sensitivity of the Return Oil Channel

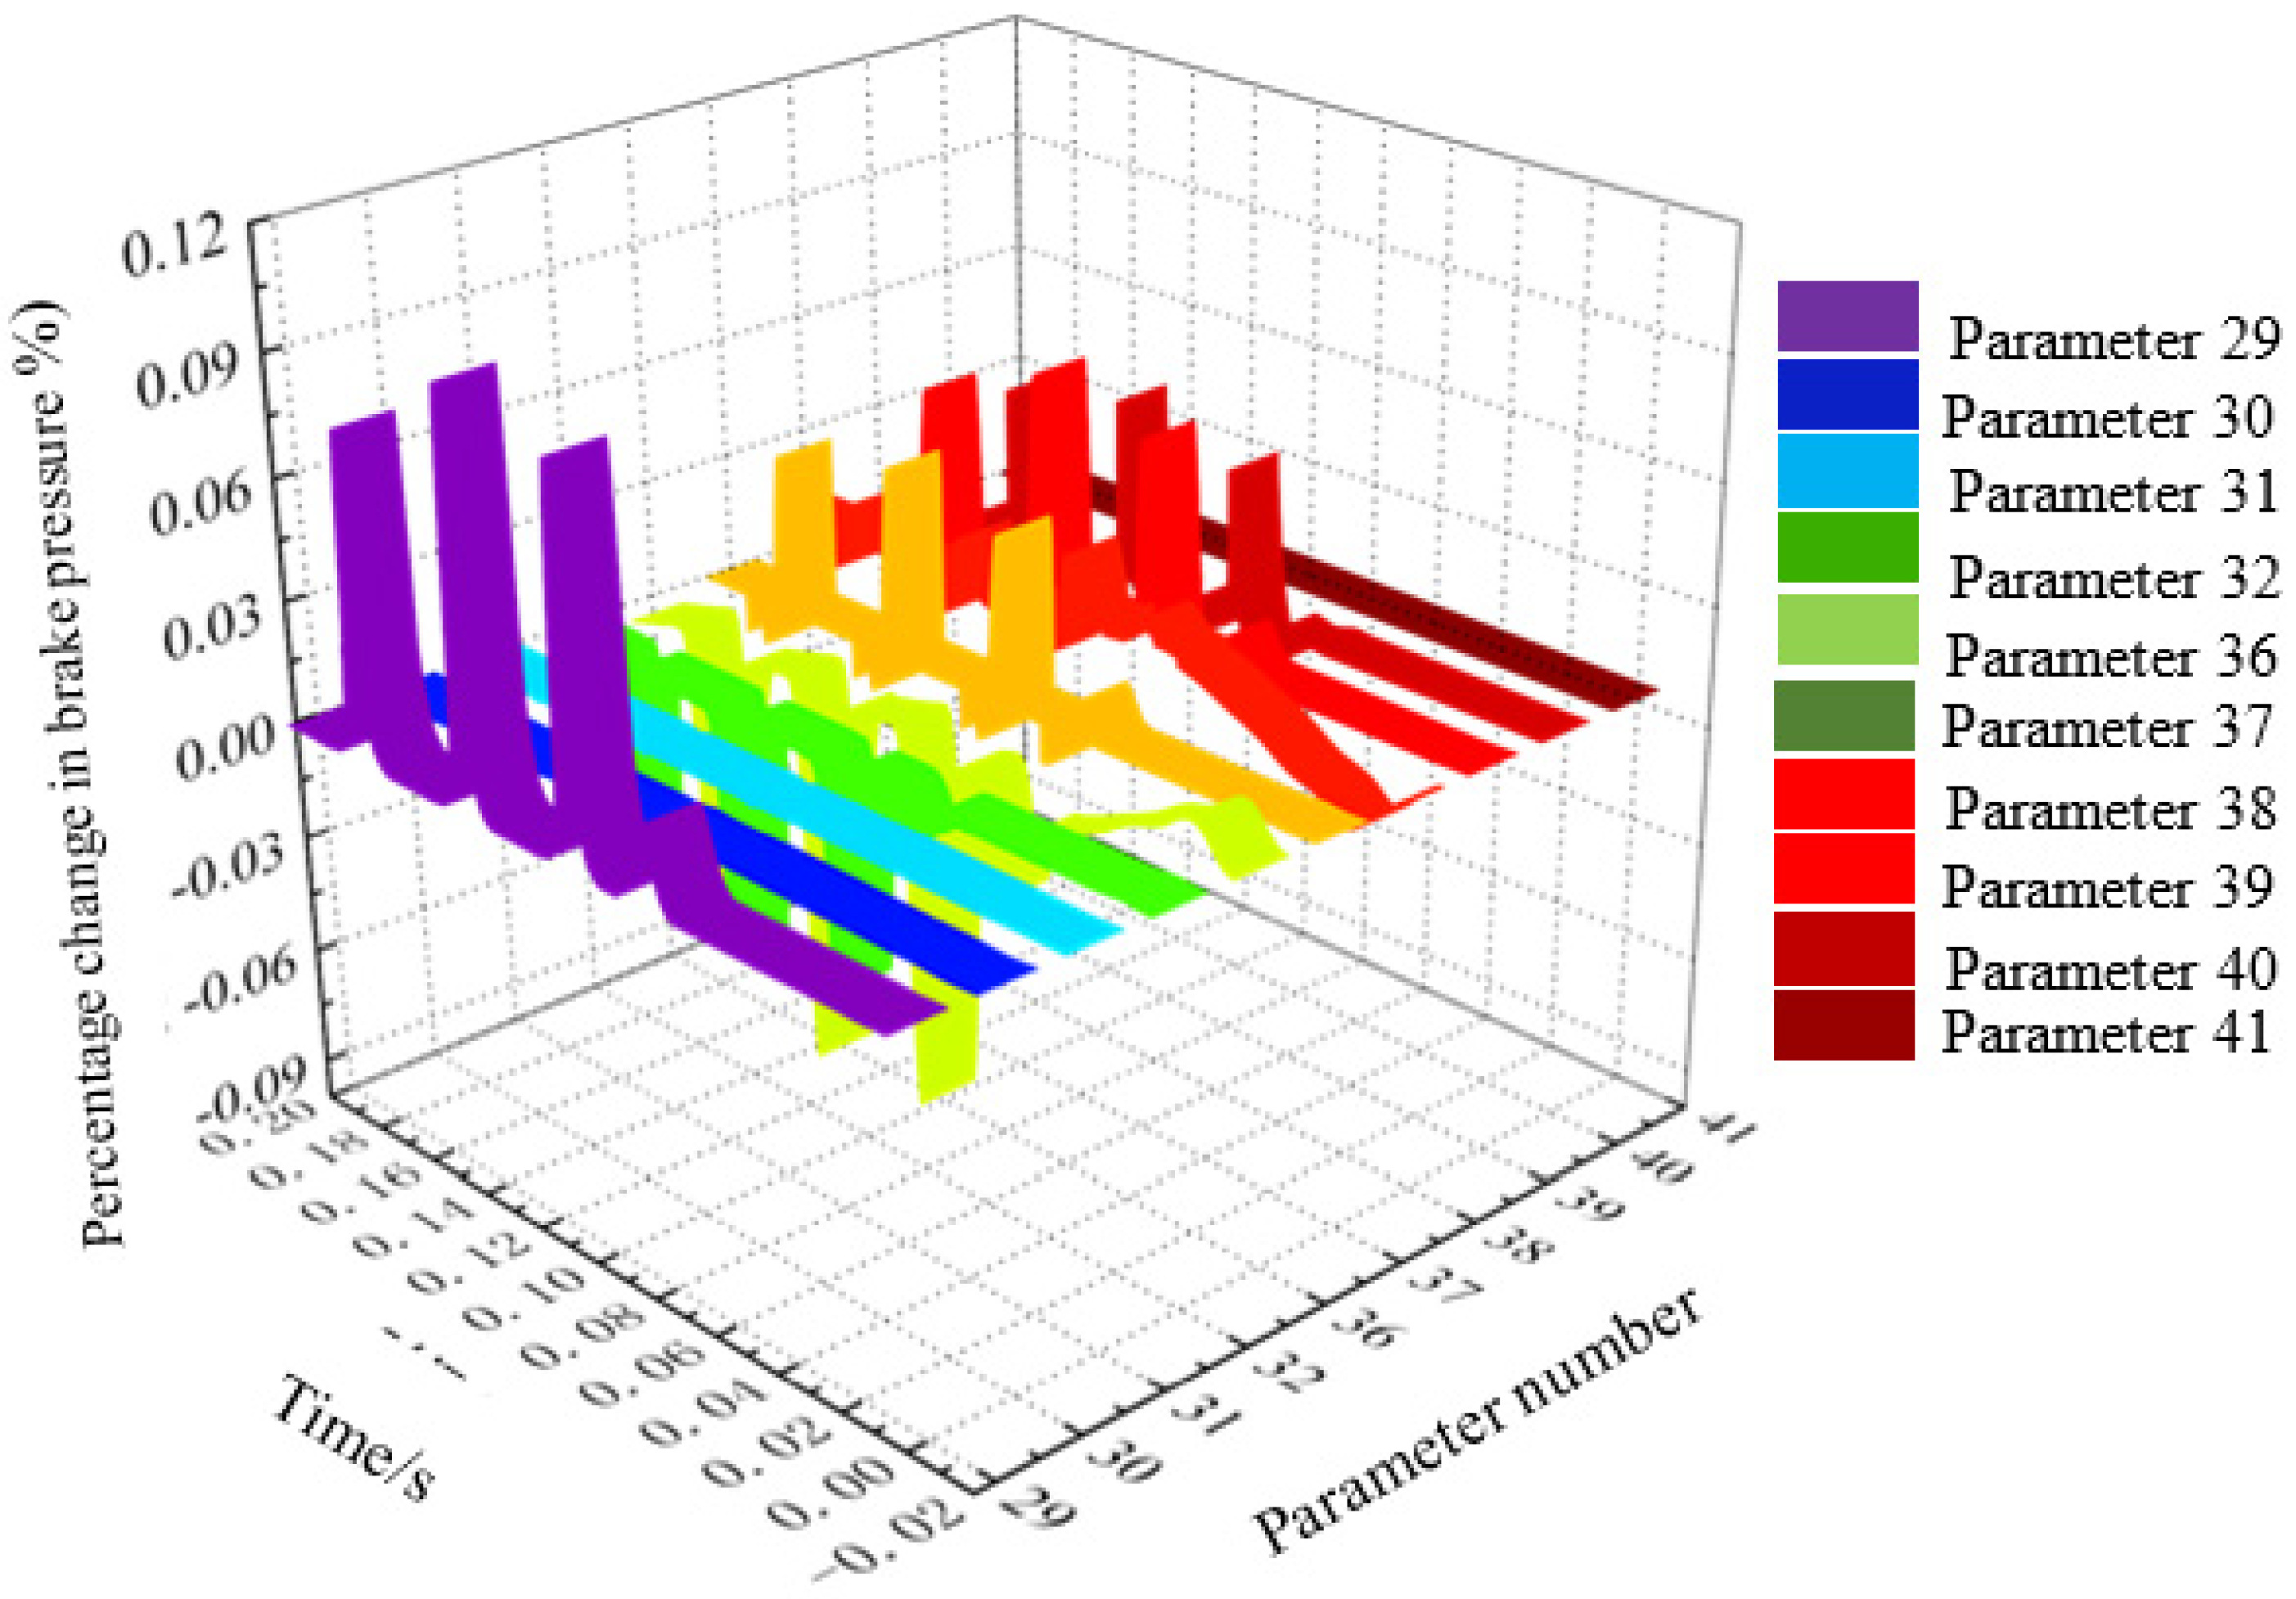
The percentage change of brake pressure x8 caused by a 10% change in the programmed parameters of the power level in MATLAB (α29 = Vh, α30 = Qs, α31 = Rc, α32 = Kd2, α36 = Aj, α37 = Bj, α38 = Kj, α39 = ks, α40 = Mj, α41 = Vcj) is shown in Figure 11.
According to Figure 11, it can be seen that in the return oil channel, except for α30 = Qs, α31 = Rc, and α41 = Vcj, the parameters had an obvious influence on the brake pressure, and the influence trend of each parameter was roughly the same, that is, both had a more significant impact in the equal amplitude oscillation section of the brake pressure, and had an oscillation trend.

4.3. Quantitative Analysis of First-Order Trajectory Sensitivity

4.3.1. First-Order Trajectory Sensitivity Evaluation Index

According to the content of Section 3 of this paper, the mean value of the constant amplitude oscillation part of the brake pressure can be basically kept constant. Therefore, the influence of the change of various parameters in the system on the brake pressure x8 is evaluated by the x80 percentage of the change of the brake pressure Δx8 relative to the mean value of the oscillation of the brake pressure.
Δ x 8 x 80 × 100 % = λ 8 f i Δ α i x 80 × 100 % = S α 8 Δ α i x 80 × 100 %
The mean value of the above percentages is taken as the system sensitivity evaluation index s1 (hereinafter referred to as index 1):
s 1 = | Δ x 1 | x 80 | mean × 100 % = | λ 8 f i | Δ α i x 80 | mean × 100 % = | S α 8 | Δ α i x 80 | mean × 100 %
In Equation (32), S α 8 represents the eighth row of the system’s first-order sensitivity matrix related to the brake pressure x8.
The mean value of the brake pressure fluctuation x80 can be solved according to the following method, scilicet.
Take the brake pressure response of the system under a 40 mA step current signal, and draw the envelope of the brake pressure curve, as shown in Figure 12b. After the brake pressure forms a stable oscillation, take the upper and lower envelopes after averaging, and solve for x80 according to the following equation:
x 80 = x 8 U + x 8 L 2 = 9.37 × 10 6   MPa
where U means upper average, L means lower average.
The above-mentioned sensitivity evaluation index s1 can quantitatively analyze the influence of each parameter change on the brake pressure change. However, for the ABPSVCS studied in this paper, the pressure has obvious constant amplitude oscillation, that is, the brake pressure will also change when the parameters do not change. Therefore, only sensitivity evaluation index s1 cannot fully reflect the influence rule of each parameter on the system output. Therefore, sensitivity evaluation index s2 (hereinafter referred to as index 2) is required to measure the overall impact of parameter changes on Δx8 in the whole sampling time by means of integral summation, that is,
s 2 = 0 t 1 λ 8 f i Δ α i d t = 0 t 1 S α 8 Δ α i d t
After two sensitivity evaluation indexes are introduced, the influence of various parameters in the system on brake pressure x8 can be quantitatively analyzed.

4.3.2. Quantitative Analysis Results of Fluidic Amplifier Parameters Sensitivity

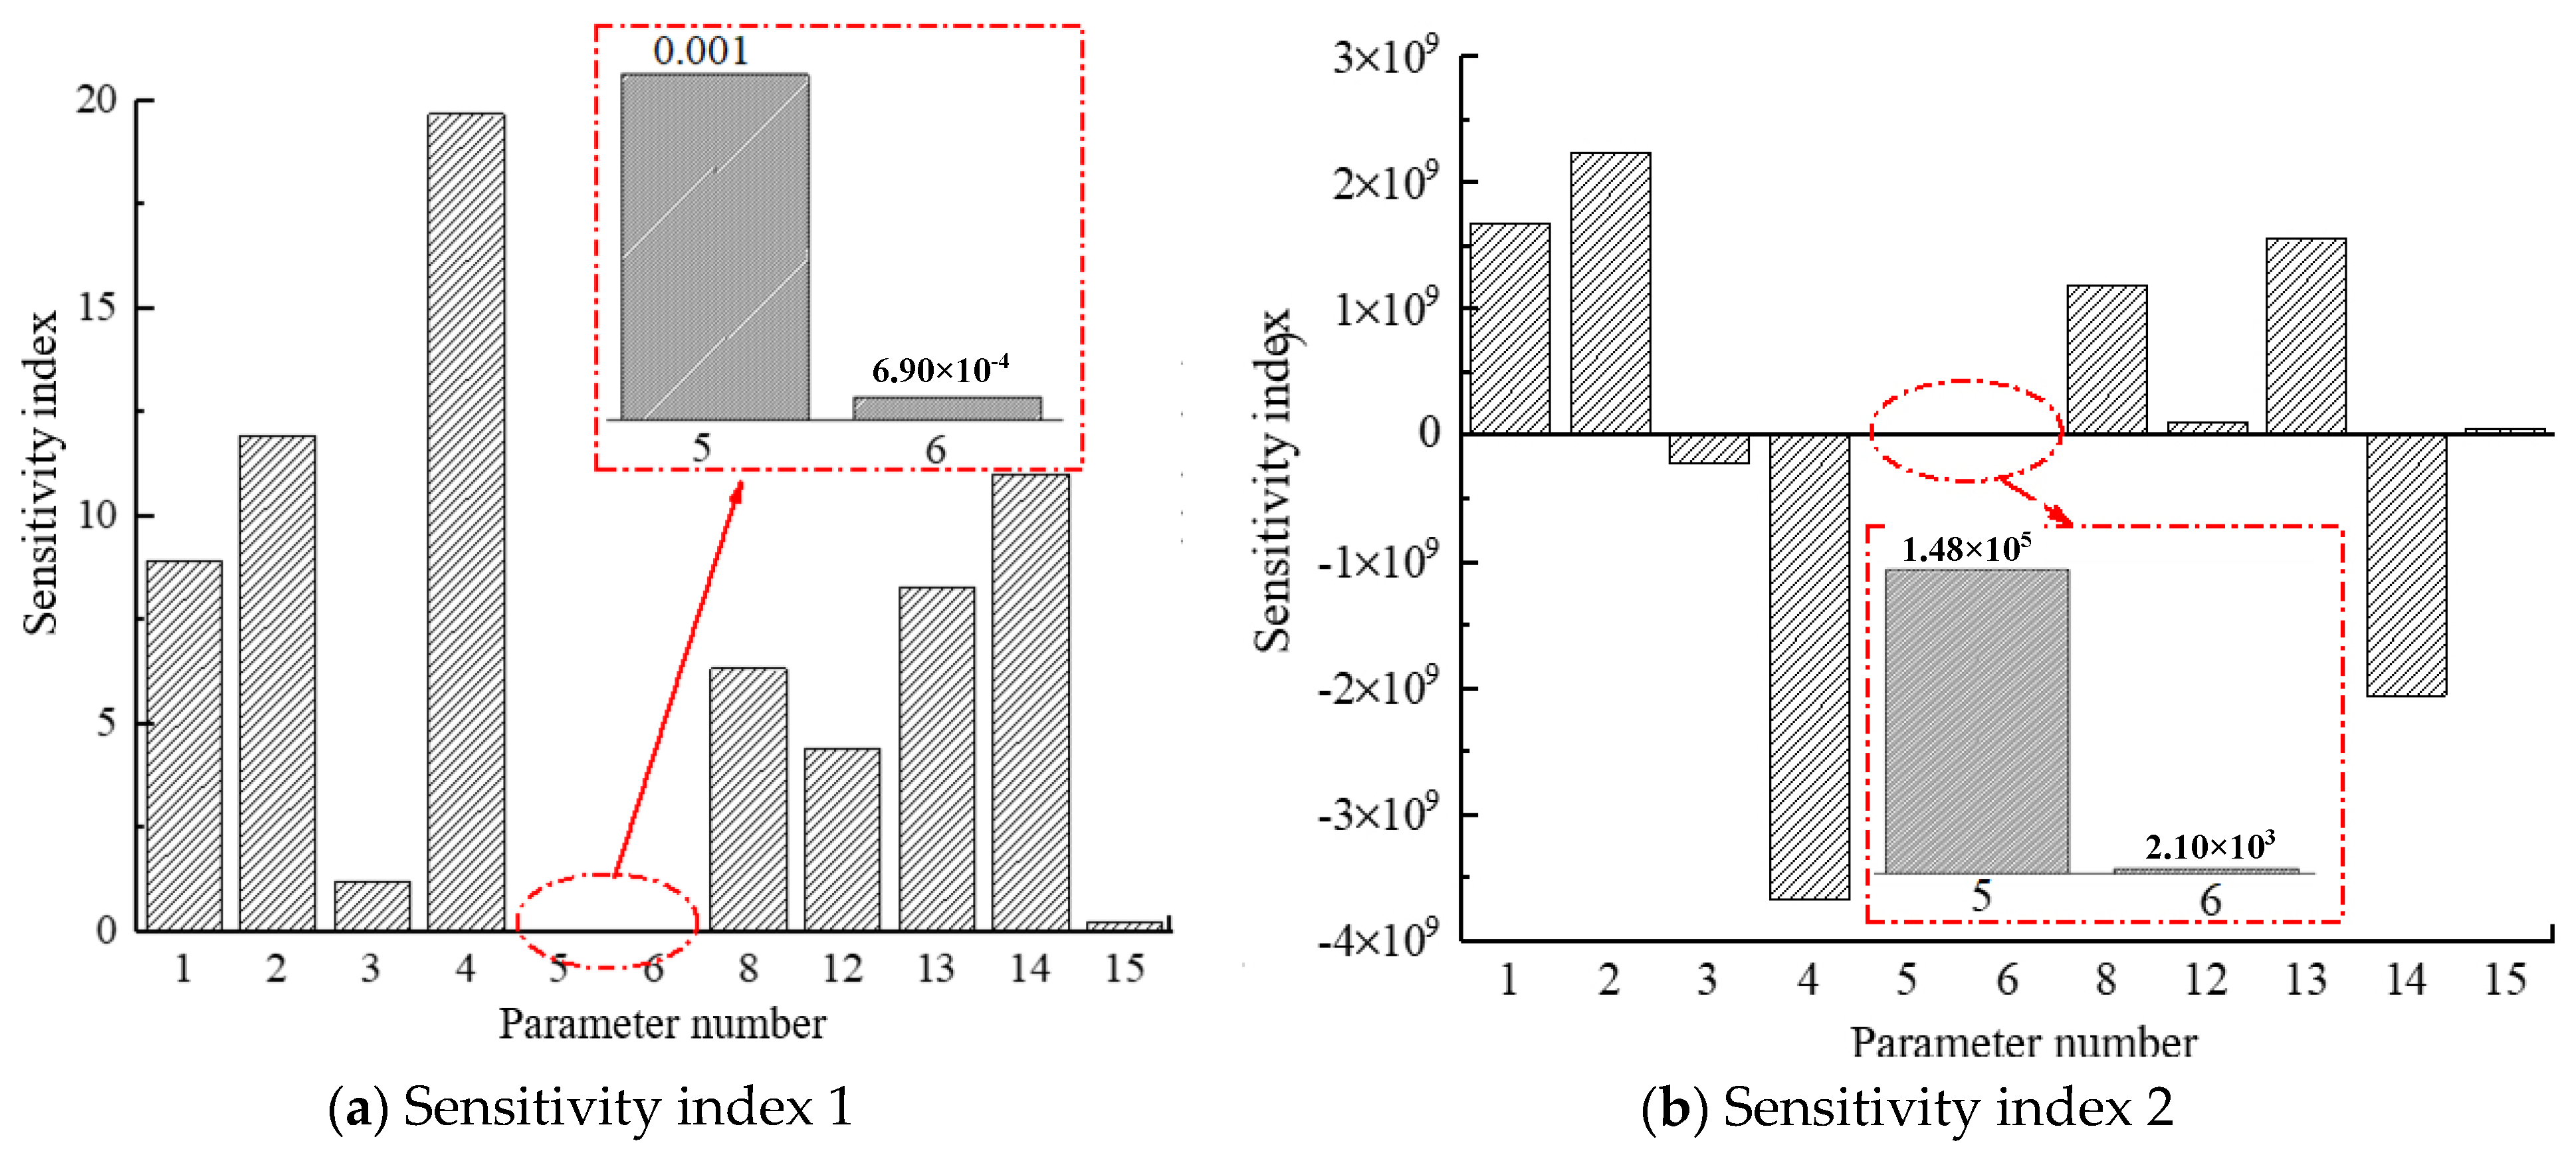
The percentage change of brake pressure x 8 caused by a 10% change of the parameters of the jet amplifier (α1 = Kt, α2 = Km, α3 = Kfg, α4 = Ka, α5 = Ba, α6 = Ja, α8 = r, α12 = βt, α13 = kq, α14 = kc, α15 = rb) was calculated by programming in MATLAB. Among them, the input signal is still a 40 mA step current signal.
According to Equations (33) and (34), the histogram of the sensitivity evaluation index was obtained when each parameter changed by 10%, as shown in Figure 12.
Due to the difference between the positive and negative changes in brake pressure caused by changes in various parameters, sensitivity index 2 had negative values, as shown in Figure 12b. By comparing and analyzing the sensitivity indexes of each parameter in Figure 10, it can be seen that the influence of the change of each parameter on the brake pressure x8 was as follows: α3 = Kfg, α5 = Ba, α6 = Ja, and α15 = rb had a small proportion in index 1 (all below 2%) and index 2, Therefore, it can be judged that the above parameters had little effect on the braking pressure of x8. Meanwhile, the time-history curve of α3 = Kfg and sensitivity index 2 were both negative, indicating that the change of this parameter was inversely proportional to the change of brake pressure x8. The proportions of the two sensitivity evaluation indexes of these six parameters (α1 = Kt, α2 = Km, α4 = Ka, α8 = r, α13 = kq, and α14 = kc) were basically the same, and the time-history curve trends with time were also quite similar. Therefore, according to the two sensitivity indexes, it can be judged that the above parameters had a great influence on the brake pressure x8. It should be noted that the time-history curve of α4 = Ka and sensitivity index 2 were both negative, indicating that the change of this parameter was inversely proportional to the change of brake pressure x8, which was consistent with α3 = Kfg. The parameter α12 = β was special, and its proportion in sensitivity index 1 was obviously different from that in sensitivity index 2. Meanwhile, as can be seen from the time-history curve in Figure 5 and Figure 6, the amplitude of this parameter was significantly higher than that of other parameters in the stage of constant amplitude oscillation of the brake pressure, and its fluctuation trend was consistent with that of brake pressure x8. However, the amplitude of the α12 = β time-history curve was not prominent at the stage of brake pressure rise. Therefore, it can be judged that the influence of this parameter on brake pressure x8 was mainly concentrated in the stage of stable oscillation. Since the peak–peak value of brake pressure oscillation was far less than the increase in the process of setting up brake pressure x8, the cumulative effect of α12 = β on brake pressure x8 during the whole time period was small, that is, there was a significant difference between sensitivity index 1 and sensitivity index 2.
Based on the above analysis, the order of sensitivity of the jet amplifier parameters is as follows: α4 = Ka > α2 = Km > α14 = kc > α1 = Kt > α13 = kq > α8 = r > α12 = β > α3 = Kfg > α15 = rb > α5 = Ba > α6 = Ja.

4.3.3. Quantitative Analysis Results of Sensitivity of Feedback Stage Parameters

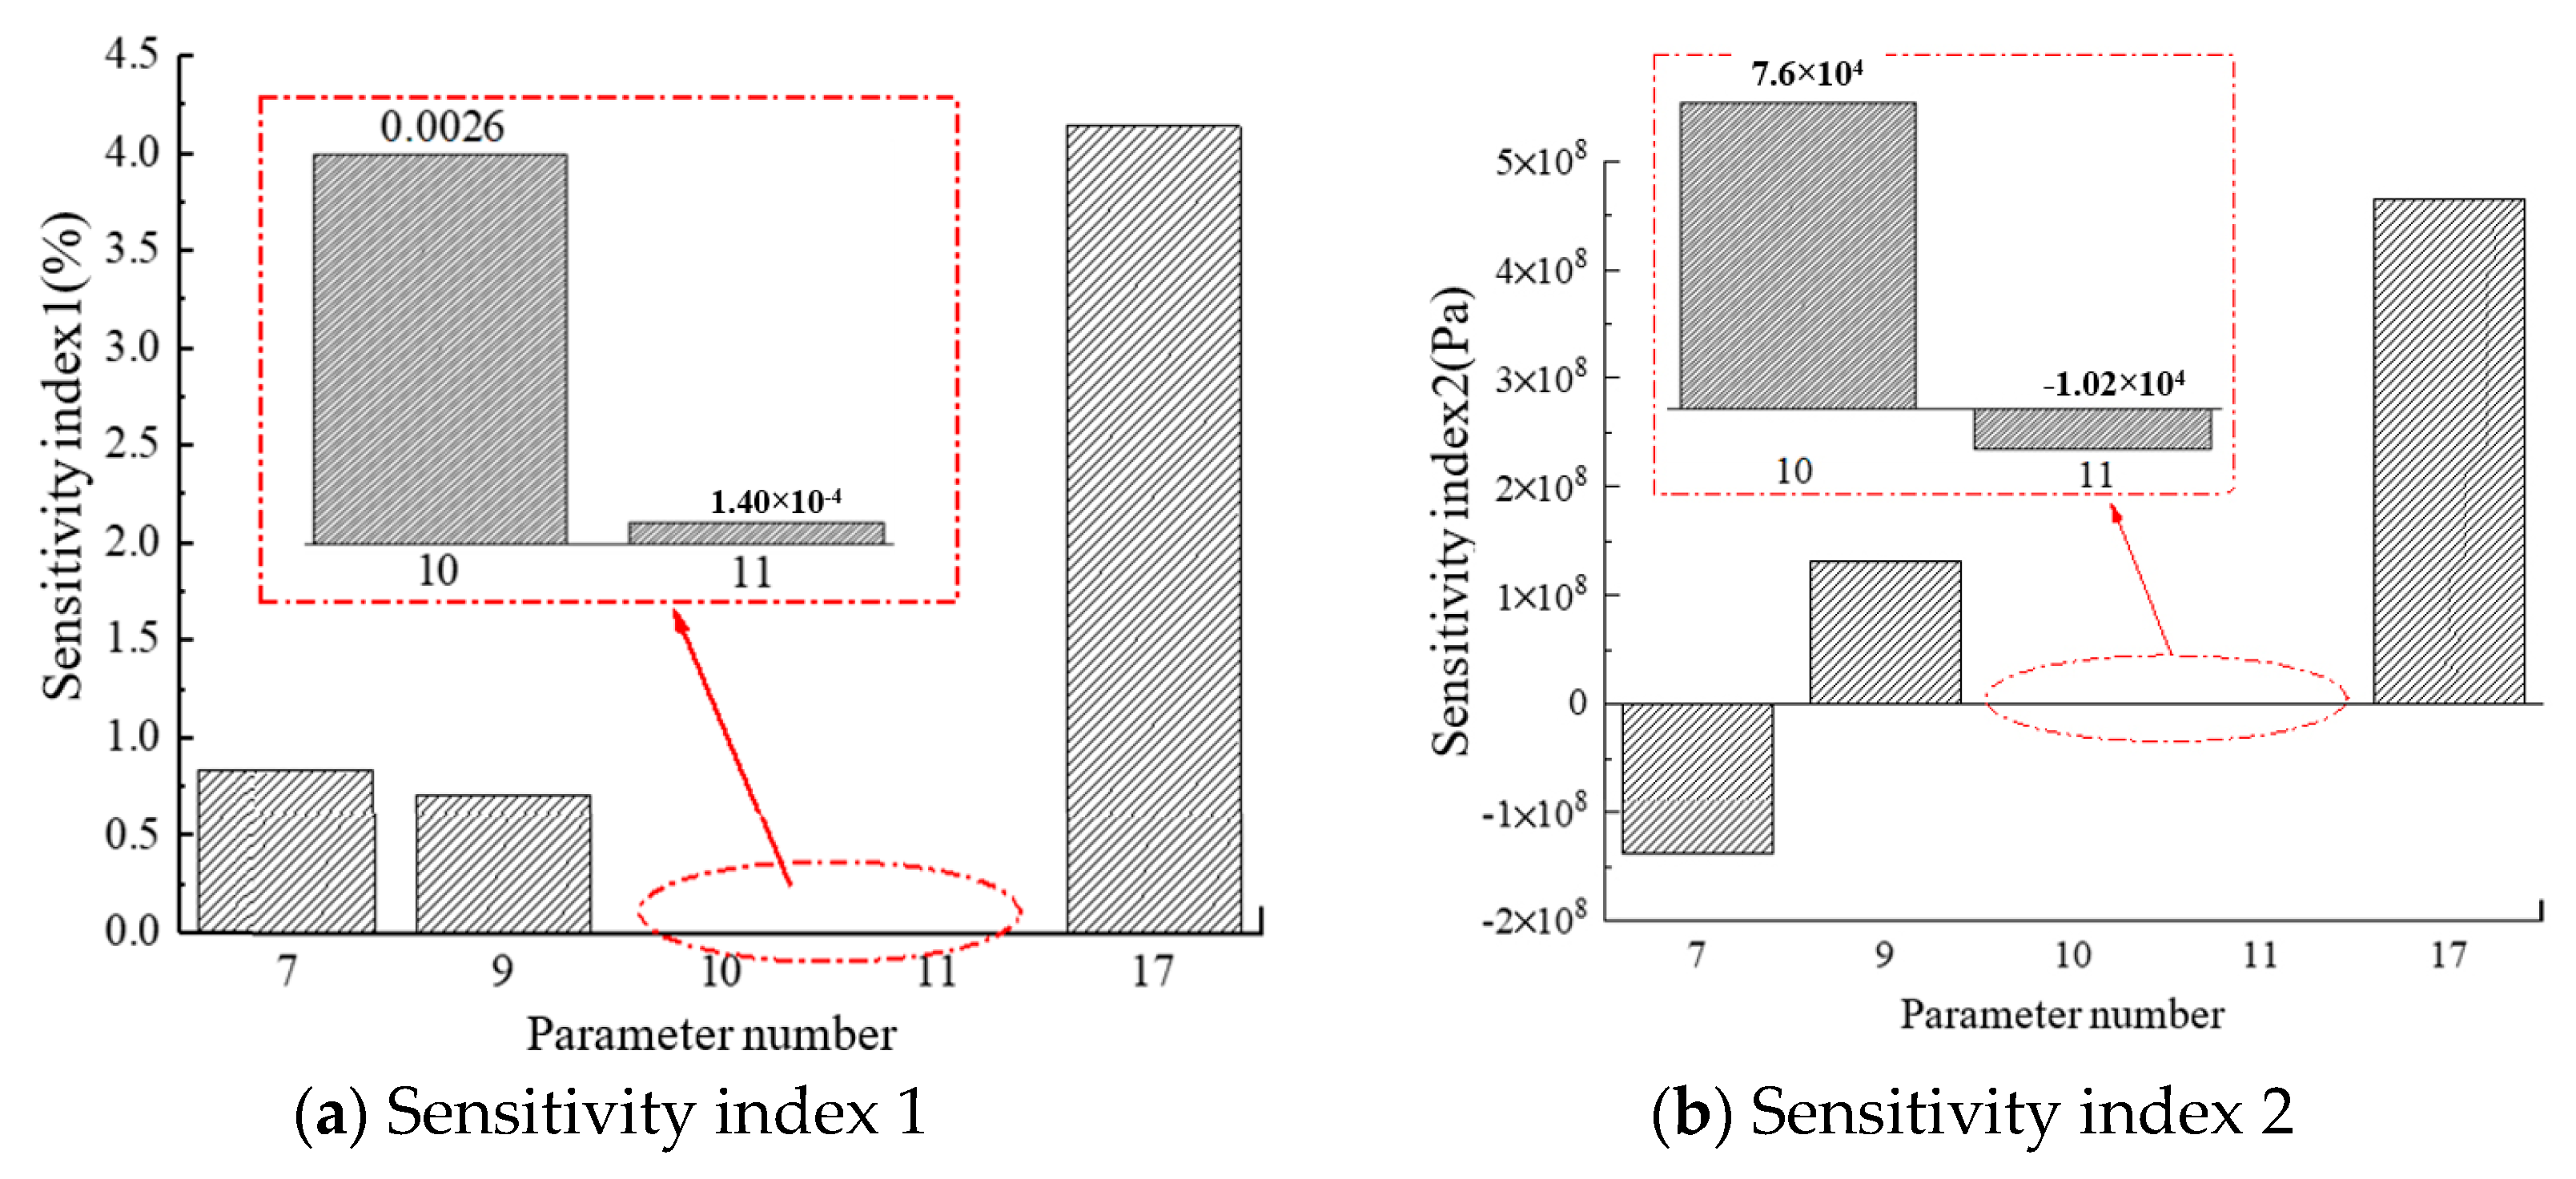
The percentage change of brake pressure x8 caused by a 10% change of each parameter of feedback stage (α7 = Ac, α9 = Kc, α10 = Bc, α11 = Mc, α17 = Vc) was calculated by programming in MATLAB, where the input signal is still a 40 mA step current signal.
When each parameter changed by 10%, the histogram of sensitivity evaluation index was obtained, as shown in Figure 13.
By comparing and analyzing the sensitivity indexes of each parameter in Figure 13, it can be found that the influence of the change of each parameter on the brake pressure x8 was as follows: α7 = Ac and α9 = Kc accounted for very little in index 1 (the values were all below 1%) and index 2, so it can be judged that the influence of the above parameters on the brake pressure x8 was very small. Meanwhile, both the time-history curve of α7 = Ac and the sensitivity index 2 were negative, indicating that the change of this parameter was inversely proportional to the change of brake pressure x8. The time-history curves of α10 = Bc and α11 = Mc and the values of sensitivity index 1 and sensitivity index 2 were all quite small. Therefore, it can be concluded that these two parameters had almost no effect on the brake pressure x8. In the feedback stage parameters, the proportion of α17 = Vc in index 1 and index 2 was significantly higher than that of other parameters, and the time-history curve also oscillated periodically. Therefore, it can be judged that this parameter had a great influence on the brake pressure x8, and mainly affected the constant amplitude oscillation stage of the brake pressure.
Based on the above analysis, the sensitivity of feedback level parameters is sorted as follows: α17 = Vc > α7 = Ac > α9 = Kc > α10 = Bc > α11 = Mc.

4.3.4. Quantitative Analysis Results of Sensitivity of Power Level Parameters

The percentage change of brake pressure x8 caused by a 10% change of power level parameters (α16 = Av, α18 = Ab, α19 = Ah, α20 = Bv, α21 = K, α22 = Kf, α24 = Mv, α26 = Kd) was calculated by programming in MATLAB. Among them, the input signal is still a 40 mA step current signal.
When each parameter changed by 10%, the histogram of sensitivity evaluation index was obtained, as shown in Figure 14.
By comparing and analyzing the sensitivity index of each parameter in Figure 14, it can be seen that the influence of the change of each parameter on the brake pressure x8 was as follows: α20 = Bv, α21 = K, α22 = Kf, α24 = Mv, and α26 = Kd, accounted for a small proportion in index 1 (all below 1%) and index 2, so it could be judged that the above parameters had little influence on brake pressure x8. Meanwhile, the time-history curve of α22 = Kf and sensitivity index 2 were both negative, indicating that the change of this parameter was inversely proportional to the change of brake pressure x8. Moreover, α16 = Av, α18 = Ab and α19 = Ah were basically the same in the proportions of the two sensitivity evaluation indexes of the three parameters, but there were differences in the trend of the time-history curve with time. Both α16 = Av and α19 = Ah had obvious oscillation trends in the brake pressure equal-amplitude oscillation period. Therefore, these two parameters had a greater impact on the brake pressure oscillation. At the same time, through comparison, it is found that the time-history curve of α16 = Av was basically symmetrical about the 0 axis, while the time-history curve of α19 = Ah was basically negative. This can also be seen from the two sensitivity indicators of the two. Therefore, although these two parameters both had a significant impact on the brake pressure oscillation, α19 = Ah was negatively correlated with the brake pressure. The proportion of the sensitivity index of α18 = Ab was basically the same as that of α16 = Av. The difference between two proportions is that α18 = Ab did not show a significant oscillation trend in the constant amplitude oscillation period of the brake pressure, but it was more significant in the brake pressure rise period. The influence of α18 = Ab was completely negatively correlated with the brake pressure, which was the same as α19 = Ah. Based on the above analysis, the power level parameter sensitivity ranking is α16 = Av > α18 = Ab > α19 = Ah > α26 = Kd > α22 = Kf > α20 = Bv > α21 = K > α24 = Mv.

4.3.5. Quantitative Analysis Results of Brake Actuator Parameter Sensitivity

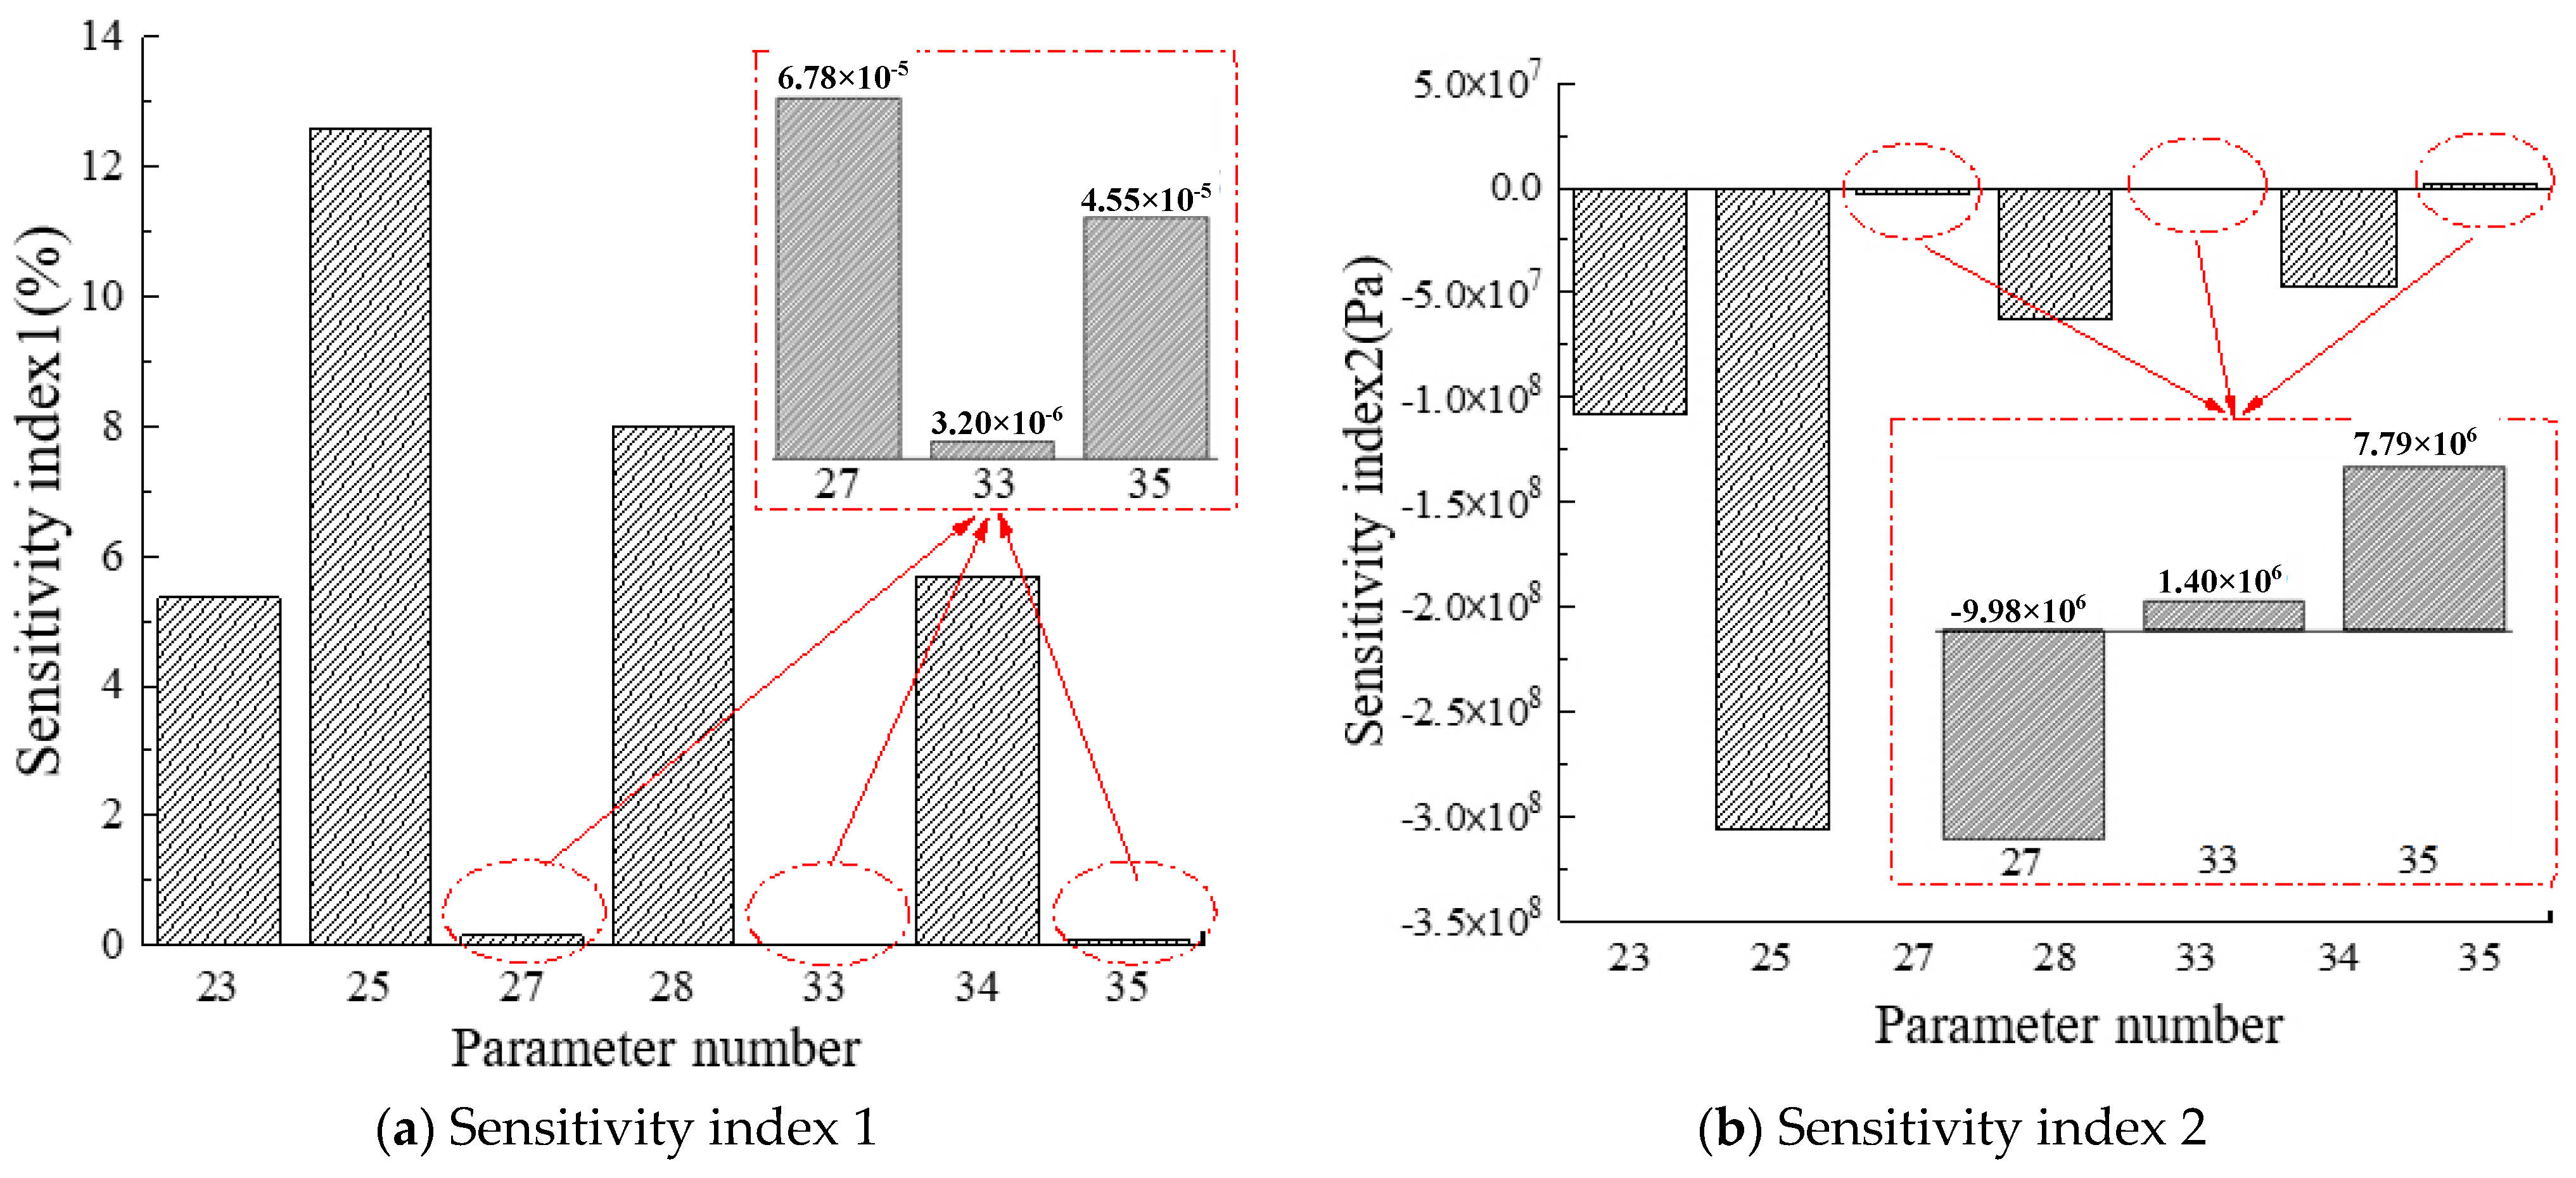
The percentage change of brake pressure x8 caused by 10% change of each parameter of power level (α23 = ps, α25 = Vgb, α27 = Cb, α28 = Ag, α33 = Bg, α34 = Kg, α35 = Mg) was calculated by programming in MATLAB.
When each parameter changed by 10%, the histogram of sensitivity evaluation index was obtained, as shown in Figure 15.
By comparing and analyzing the sensitivity indexes of each parameter in Figure 15, we can find that the influence of the change of each parameter on the brake pressure x8 was as follows: α23 = ps and α25 = Vgb accounted for a large proportion in both index 1 and index 2, so it can be judged that the above parameters had a significant influence on the brake pressure x8. At the same time, the two indexes of α25 = Vgb were significantly higher than those of α23 = ps, so α25 = Vgb was the most critical parameter in the parameter set of the actuator. The proportion of the two sensitivity evaluation indexes of the two parameters α28 = Ag and α34 = Kg was basically the same, and the proportion of index 2 was significantly lower than that of index 1. Combined with the time-history curves of the two, it can be seen that the above phenomenon is due to the greater influence of these two parameters on the brake pressure rise section, while their influence was not prominent in the oscillating segment of the constant amplitude of the brake pressure. Consequently, their cumulative influence, namely sensitivity index 2, was low. The sensitivity indexes of α27 = Cb, α33 = Bg, and α35 = Mg were all close to 0, so their effects on the brake pressure can be ignored.
Based on the above analysis, the parameter sensitivity of the brake actuator is sorted as follows: α25 = Vgb > α28 = Ag > α34 = Kg > α23 = ps > α27 = Cb > α35 = Mg > α33 = Bg.

4.3.6. Quantitative Analysis Results of Return Oil Channel Parameter Sensitivity

The percentage change of brake pressure x8 caused by a 10% change of each parameter of power level (α29 = Vh, α30 = Qs, α31 = Rc, α32 = Kd2, α36 = Aj, α37 = Bj, α38 = Kj, α39 = ks, α40 = Mj, α41 = Vcj) was calculated by programming in the MATLAB software platform.
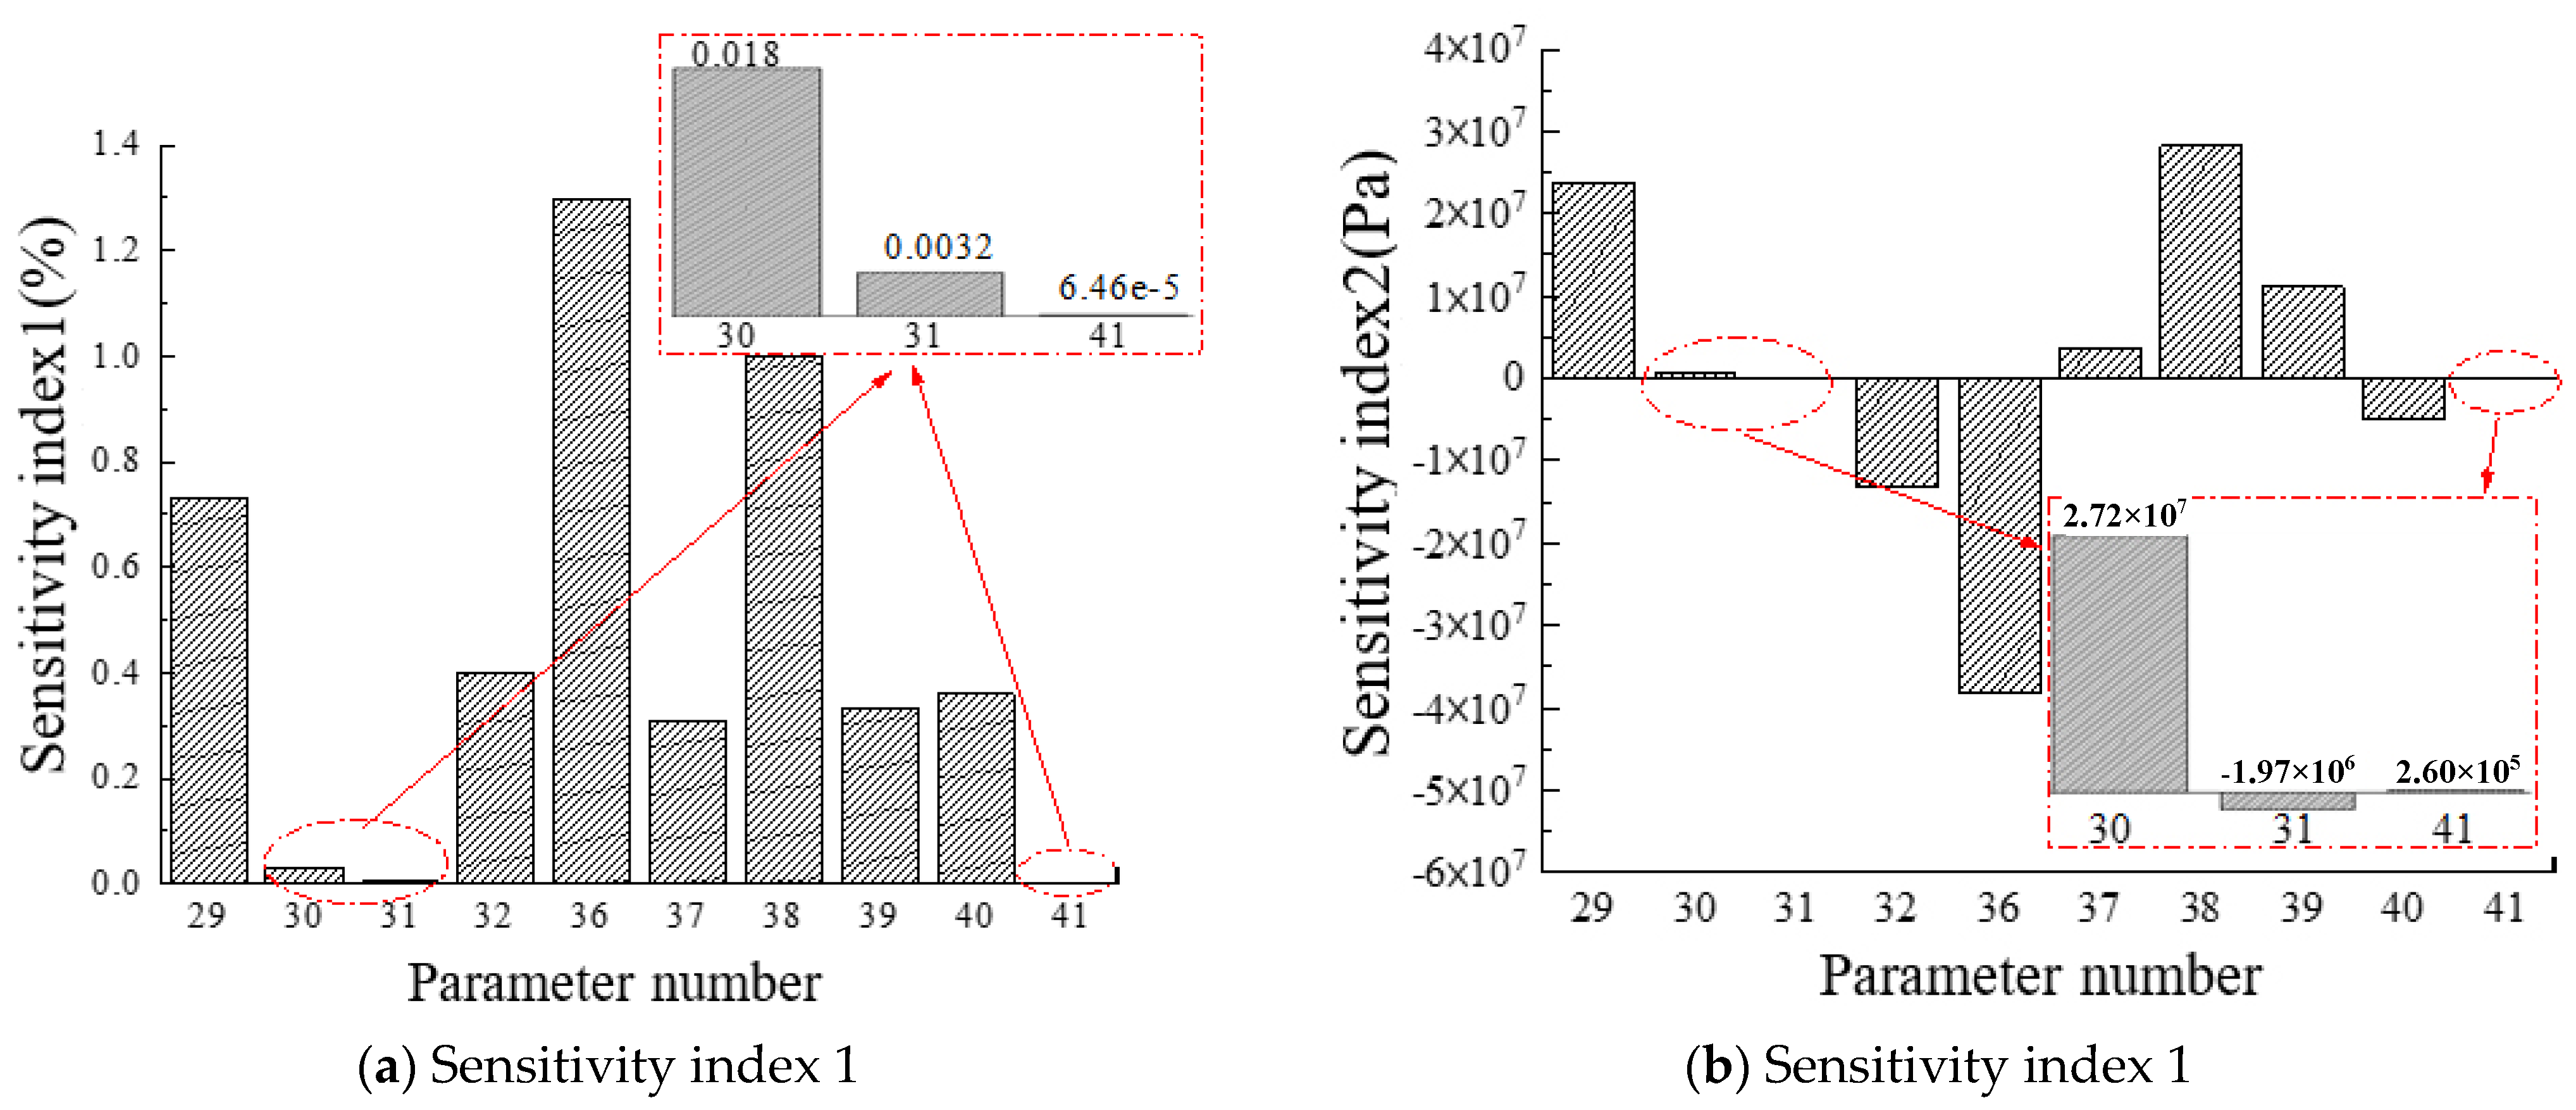
When each parameter changed by 10%, the histogram of the sensitivity evaluation index was obtained, as shown in Figure 16.
By comparing and analyzing the sensitivity index of each parameter in Figure 16, it can be seen that the influence of the change of each parameter on the brake pressure x8 was as follows: for α29 = Vh, α32 = Kd2, α36 = Aj, α38 = Kj, α39 = ks, and α40 = Mj, the proportion of the two sensitivity evaluation indexes was basically the same, and the trend of the time-history curve with time was also far less. Therefore, it can be judged from the two sensitivity indexes that the above parameters had a great influence on the brake pressure x8. The ratio of sensitivity index 1 of α37 = Bj was significantly higher than that of sensitivity index 2. Combined with the time-history curve, it can be seen that the above phenomenon is due to the fact that this parameter has almost no influence at the stage of brake pressure rise, resulting in a small cumulative influence, that is, sensitivity index 2 will be low. Moreover, α30 = Qs, α31 = Rc, α41 = Vcj, and α41 = Vcj had two sensitivity indexes close to 0, so their effect on brake pressure can be ignored.
Based on the above analysis, the order of the return oil channel parameter sensitivity is as follows: α36 = Aj > α38 = Kj > α29 = Vh > α32 = Kd2 > α40 = Mj > α39 = ks > α37 = Bj > α30 = Qs > α31 = Rc > α41 = Vcj.
This section uses the first-order trajectory sensitivity theory to analyze the first-order trajectory sensitivity of 41 parameters in the ABPSVCS dynamic model, and clarifies the main influencing parameters that affect the brake pressure output of the system, namely, the brake volume Vgb, return oil chamber volume Vh, and supply oil pressure ps. Based on this, the mean value of the brake pressure changes caused by the changes of each parameter within the system sampling time and the sum of the brake pressure changes caused by the changes of each parameter are used as the two parameter sensitivity evaluation indicators, and the parameters after a 10% change of each parameter are given. According to the histogram of sensitivity evaluation index, the similarities and differences of the influence of various parameters on braking pressure are analyzed in detail.

5. Experimental Study on the First-Order Trajectory Sensitivity of the ABPSVCS

5.1. Introduction to the Experimental Platform

In order to verify the accuracy of the dynamic model of ABPSVCS, an experimental platform for the load simulation performance testing of ABPSVCS (referred to as the experimental platform) was built in this paper, and the established dynamic model was verified experimentally. At the same time, the experimental platform will also be used for the experimental research in the following sections of this paper.
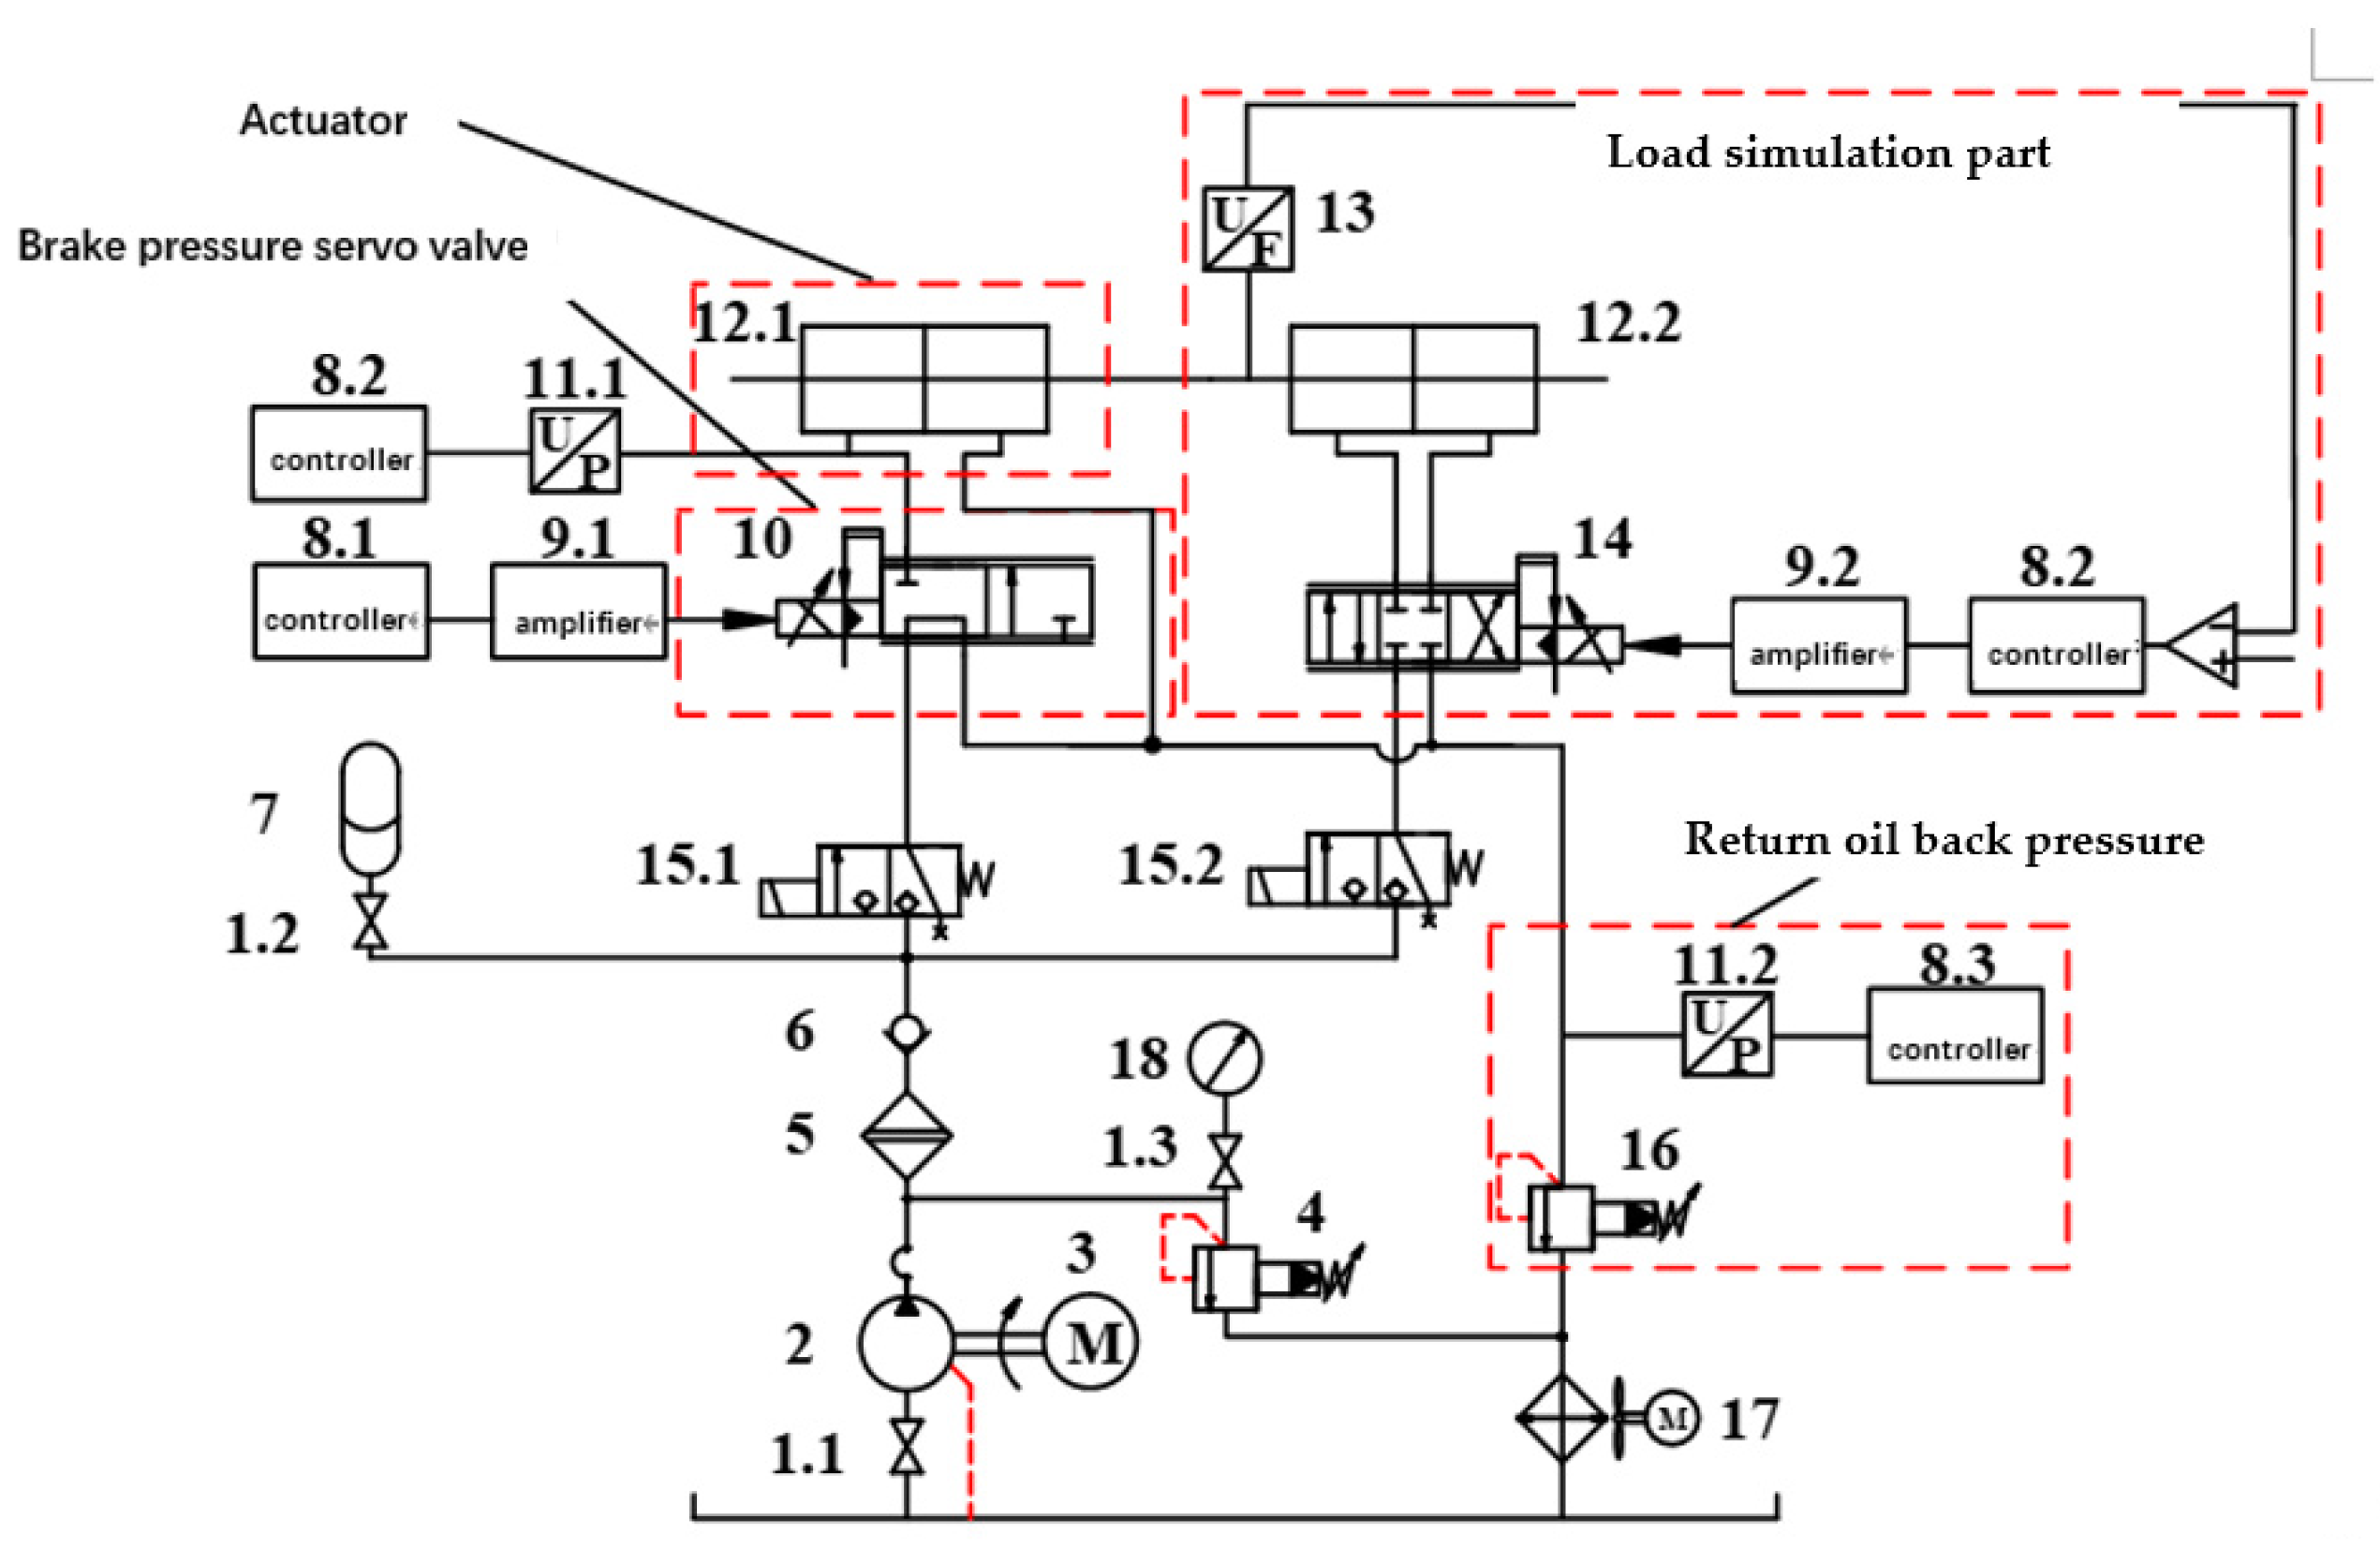
The hydraulic principle of the experimental platform is shown in Figure 15. The hydraulic cylinder 12.1 on the left, as the actuator in the system, is connected with the brake pressure servo valve 10 through the hydraulic hose. The pressure sensor 11.1 is used to collect the brake pressure output by the brake pressure servo valve and transfer it to the controller. The hydraulic cylinder 12.2 on the right, force sensor 13, servo valve 14, controller 8.2, and amplifier 9.2 jointly constitute the electro-hydraulic load simulator. Due to the presence of the force sensor, the precise control of the load force can be realized and used to simulate the force load characteristics of the brake disc in the wheel brake device. The two-position three-way directional control valves 15.1 and 15.2 are used to control the on–off of the brake pressure servo valve and the oil circuit of the load simulation unit, respectively. The accumulator 7 and the normally open cut-off valve 1.2 form a pressure regulating module to stabilize the pressure pulsation from the hydraulic oil source. Return oil relief valve 16 is used to stabilize the supply oil pressure before the servo valve. Pressure sensor 11.2 and controller 8.3 form the return oil back pressure unit, which is used to set the back pressure of the system and send the real-time data of return oil back pressure to the controller. Relief valve 4, normally open stop valve 1.3, and pressure gauge 18 are used to set the outlet pressure of the hydraulic pump. High pressure fine filter 5 is installed at the pump port to clean the oil. Variable frequency motor 3 drives axial piston quantitative pump 2 to provide an oil source for the experimental platform. Air cooler 17 is used to cool oil.
It should be noted that the supply oil pressure of the experimental platform in this paper is 15 MPa, which is different from the supply oil pressure of a certain type of brake pressure servo valve on the iron bird frame of 21 MPa. This is because the 25PCY14-1B quantitative axial piston pump is used in the experimental platform in this paper, and the supply oil pressure is set through the manual pressure regulating relief valve 4 in Figure 16. If the supply oil pressure is set too high, it will cause a sharp increase in the heat value of the system. Therefore, from the perspective of experimental safety, this paper set the supply oil pressure of the experimental platform as 15 MPa. The hydraulic principle of ABPSVCS experiment platform is shown in Figure 17.
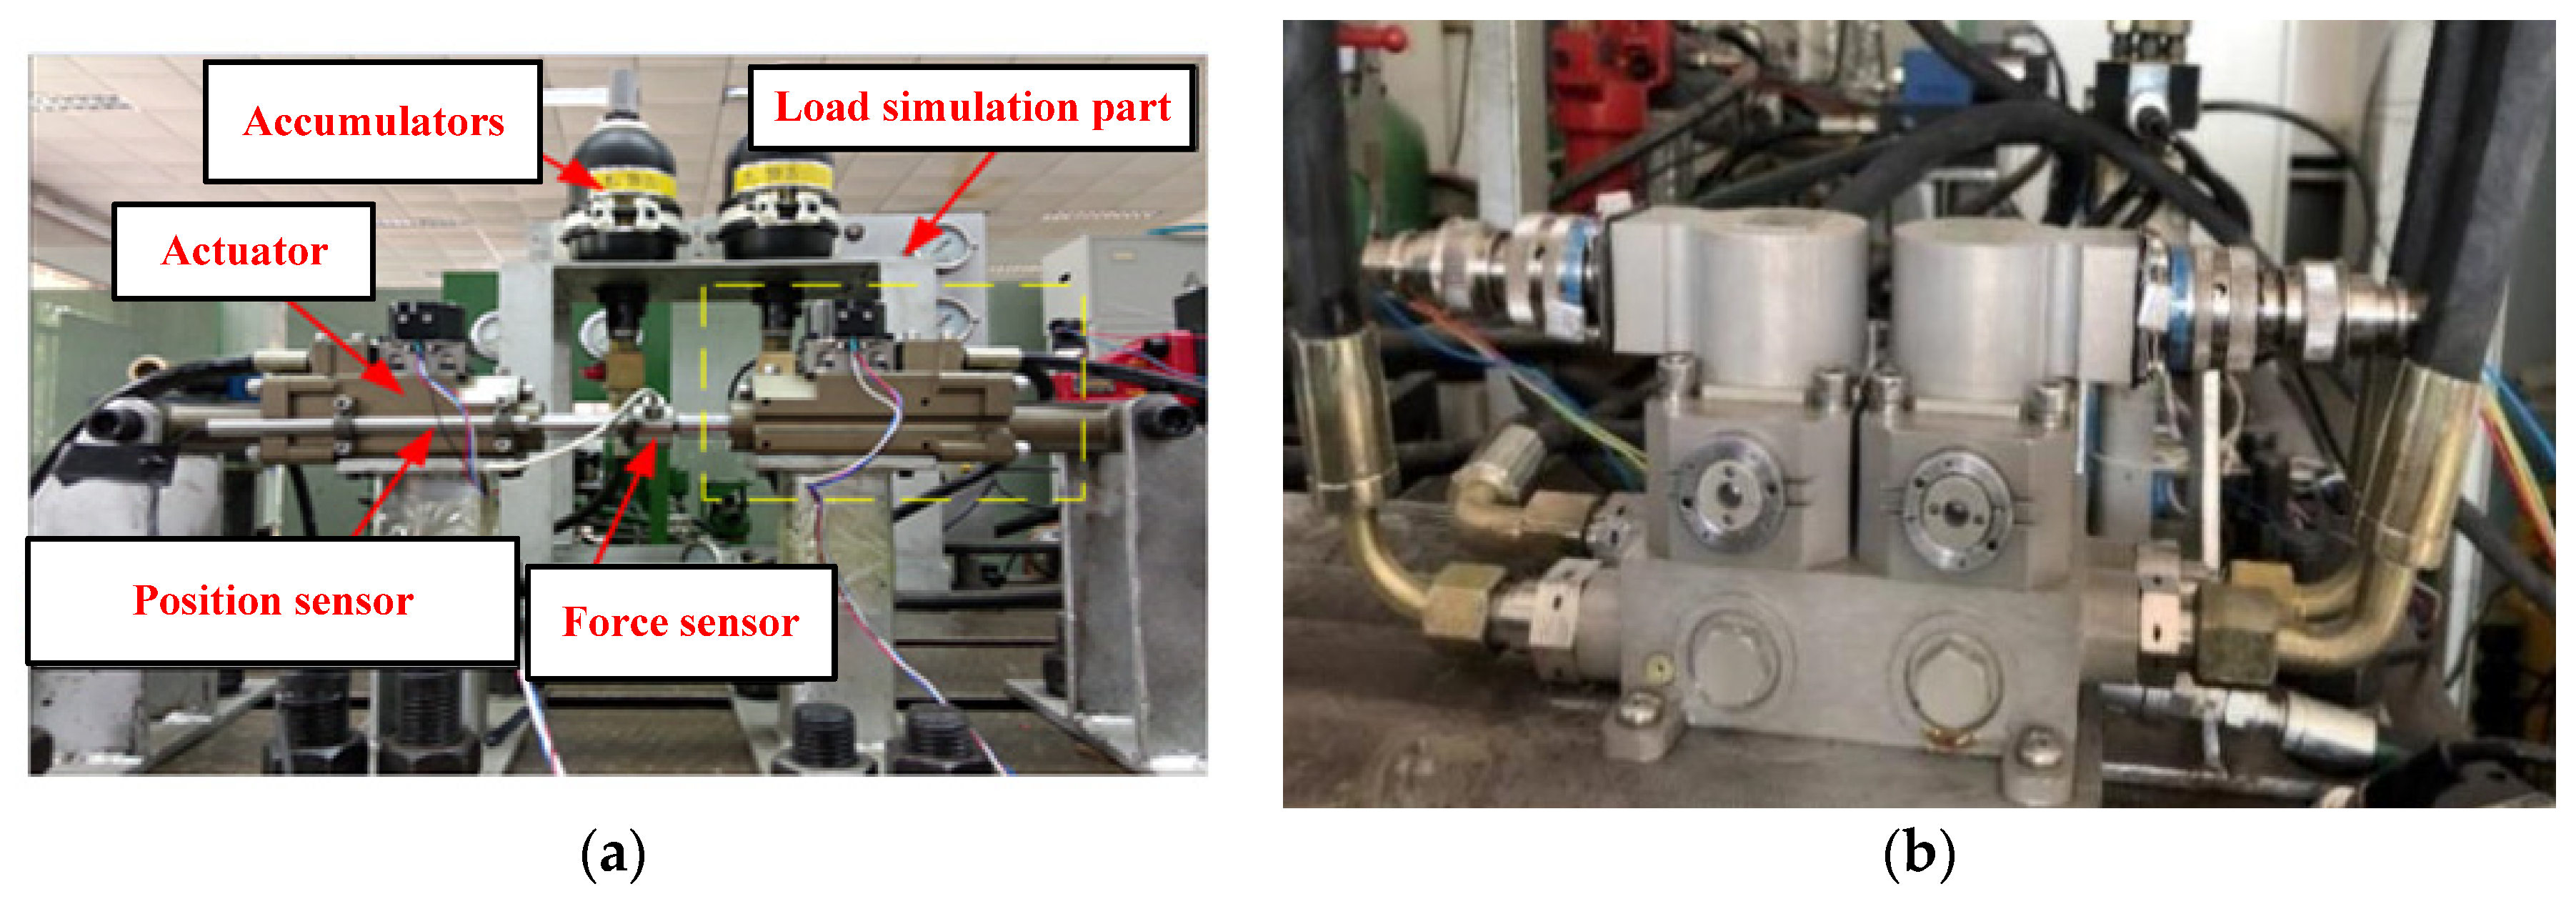
The basic parameters and objects of the experimental platform, such as the hydraulic pipeline and load, are shown in Table 4 and Figure 18, respectively.

5.2. The Experimental Scheme

In the fourth section of this paper, the first-order trajectory sensitivity theory was used to analyze the first-order trajectory sensitivity of 41 parameters in the dynamic model of the aviation brake pressure servo-valve-controlled cylinder system, and the main influencing parameters of the system braking pressure output were identified, namely, the volume of the brake chamber Vgb, the volume of the return oil chamber Vh, and the supply oil pressure ps. The supply oil pressure ps and return oil chamber volume Vh can be changed by adjusting the spring pre-compression of relief valve 4 and the length of the return oil hydraulic hose on the experimental platform, while the brake chamber volume Vgb is an inherent property of the system and cannot be changed.
Therefore, in order to further verify the influence of these parameters on the sensitivity and verify the correctness of the sensitivity analysis results, the following experiments were formulated for verification in this paper:
  • ps sensitivity experiment of supply oil pressure
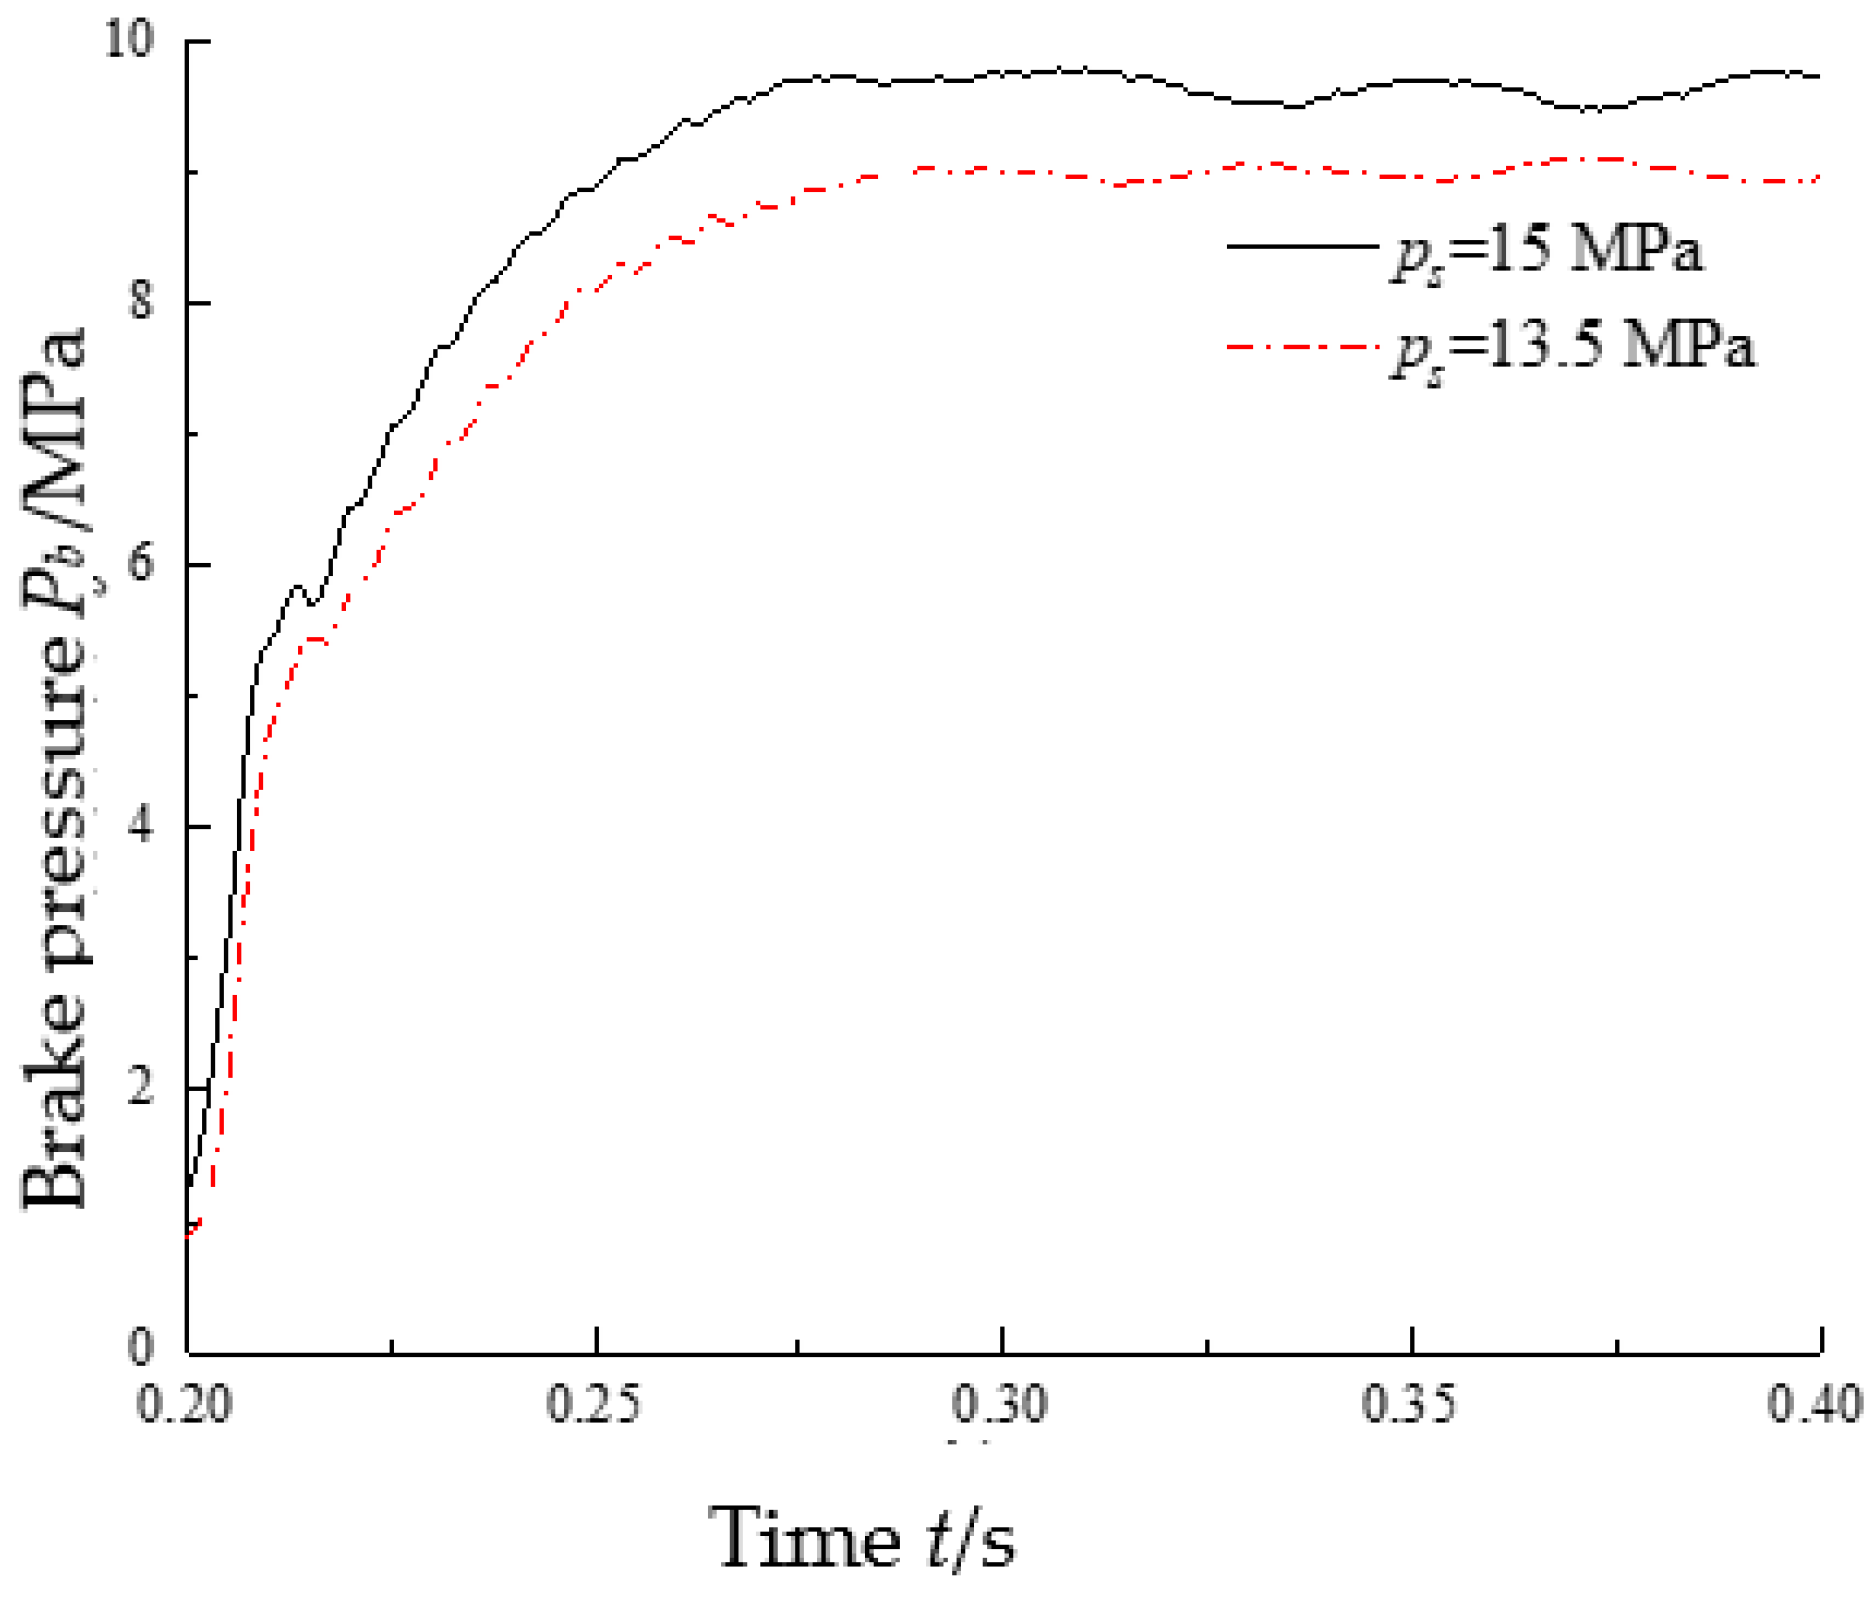
By adjusting the spring precompression of relief valve 4 in Figure 15, the supply oil pressure input to the brake pressure servo valve is adjusted to 90% of the original supply oil pressure ps = 15 MPa (ps = 13.5 MPa). Before and after the adjustment of the supply oil pressure, the experimental data of the brake pressure within 0.2 s after the step (corresponding time is 0.2 s~0.4 s) were taken.
2.
Vh sensitivity experiment of the return oil chamber volume
By adjusting the length of the return oil hydraulic hose on the experimental platform, the volume Vh of the return oil holding chamber can be approximately adjusted to 1.1 times of the original volume, that is, the parameter changes by 10%. The return oil hydraulic hose used is shown in Figure 19.
Considering that a 1% change of parameters is difficult to be accurately realized in practice, only a 10% change of the above two parameters was used in the experiment to measure the brake pressure pb output by the brake pressure servo valve, which is different from the brake pressure pb before the parameter change, and two sensitivity indexes of each parameter were calculated by the sum of the maximum value and absolute value of the difference Δpb. In order to ensure the accuracy of the experimental results, the method of calculating the mean value of multiple samples was adopted.

5.3. Experimental Results and Analysis

5.3.1. Sensitivity Experiment of Supply Oil Pressure ps

Before and after the adjustment of supply oil pressure, the experimental data of the brake pressure within 0.2 s after the step (corresponding time is 0.2 s~0.4 s) were taken, as shown in Figure 20.
It can be seen that the change of fuel supply pressure can indeed cause the obvious change of brake pressure output, which is also the reason why the starting point of the experimental curve is inconsistent after the change of fuel supply pressure. Let the difference between the braking pressure when ps = 15 MPa and ps = 13.5 MPa be Δpb1. Take the mean value of the above difference, that is, Δpb1 = 0.71 MPa. When ps = 15 MPa, the mean value of the constant amplitude oscillation section of brake pressure is 9.66 MPa, and thus the experimental value of sensitivity index 1 of the supply oil pressure can be obtained.
s 1 e x p = Δ p b 9.66 × 100 % 7.34 %
The experimental value of supply oil pressure sensitivity index 2 can be obtained by integrating the above difference values within 0.2 s~0.4 s of sampling time.
s 2 e x p = 142.69   MPa

5.3.2. Sensitivity Experiment of Return Oil Chamber Volumetric Vh

Before and after the return oil chamber volume adjustment, the experimental curve of brake pressure is shown in Figure 21.
It can be seen that the change of the volume of the return oil chamber can cause a small change in the brake pressure output. Let the difference between the braking pressure before and after the replacement of the hydraulic hose be Δpb2, and take the average of the above difference, that is, Δpb2 = 0.096 MPa; before the return oil hydraulic hose is replaced, the mean value of the constant amplitude oscillation section of the brake pressure is 9.66 MPa, and thus the experimental value of sensitivity index 1 of the supply oil pressure can be obtained.
s 1   e x p e r i m e n t = Δ p b 2 9.66 × 100 % 0.99 %
The experimental value of supply oil pressure sensitivity index 2 can be obtained by integrating the above difference values within 0.2 s~0.4 s of sampling time.
s 2   e x p e r i m e n t = 28.77   MPa
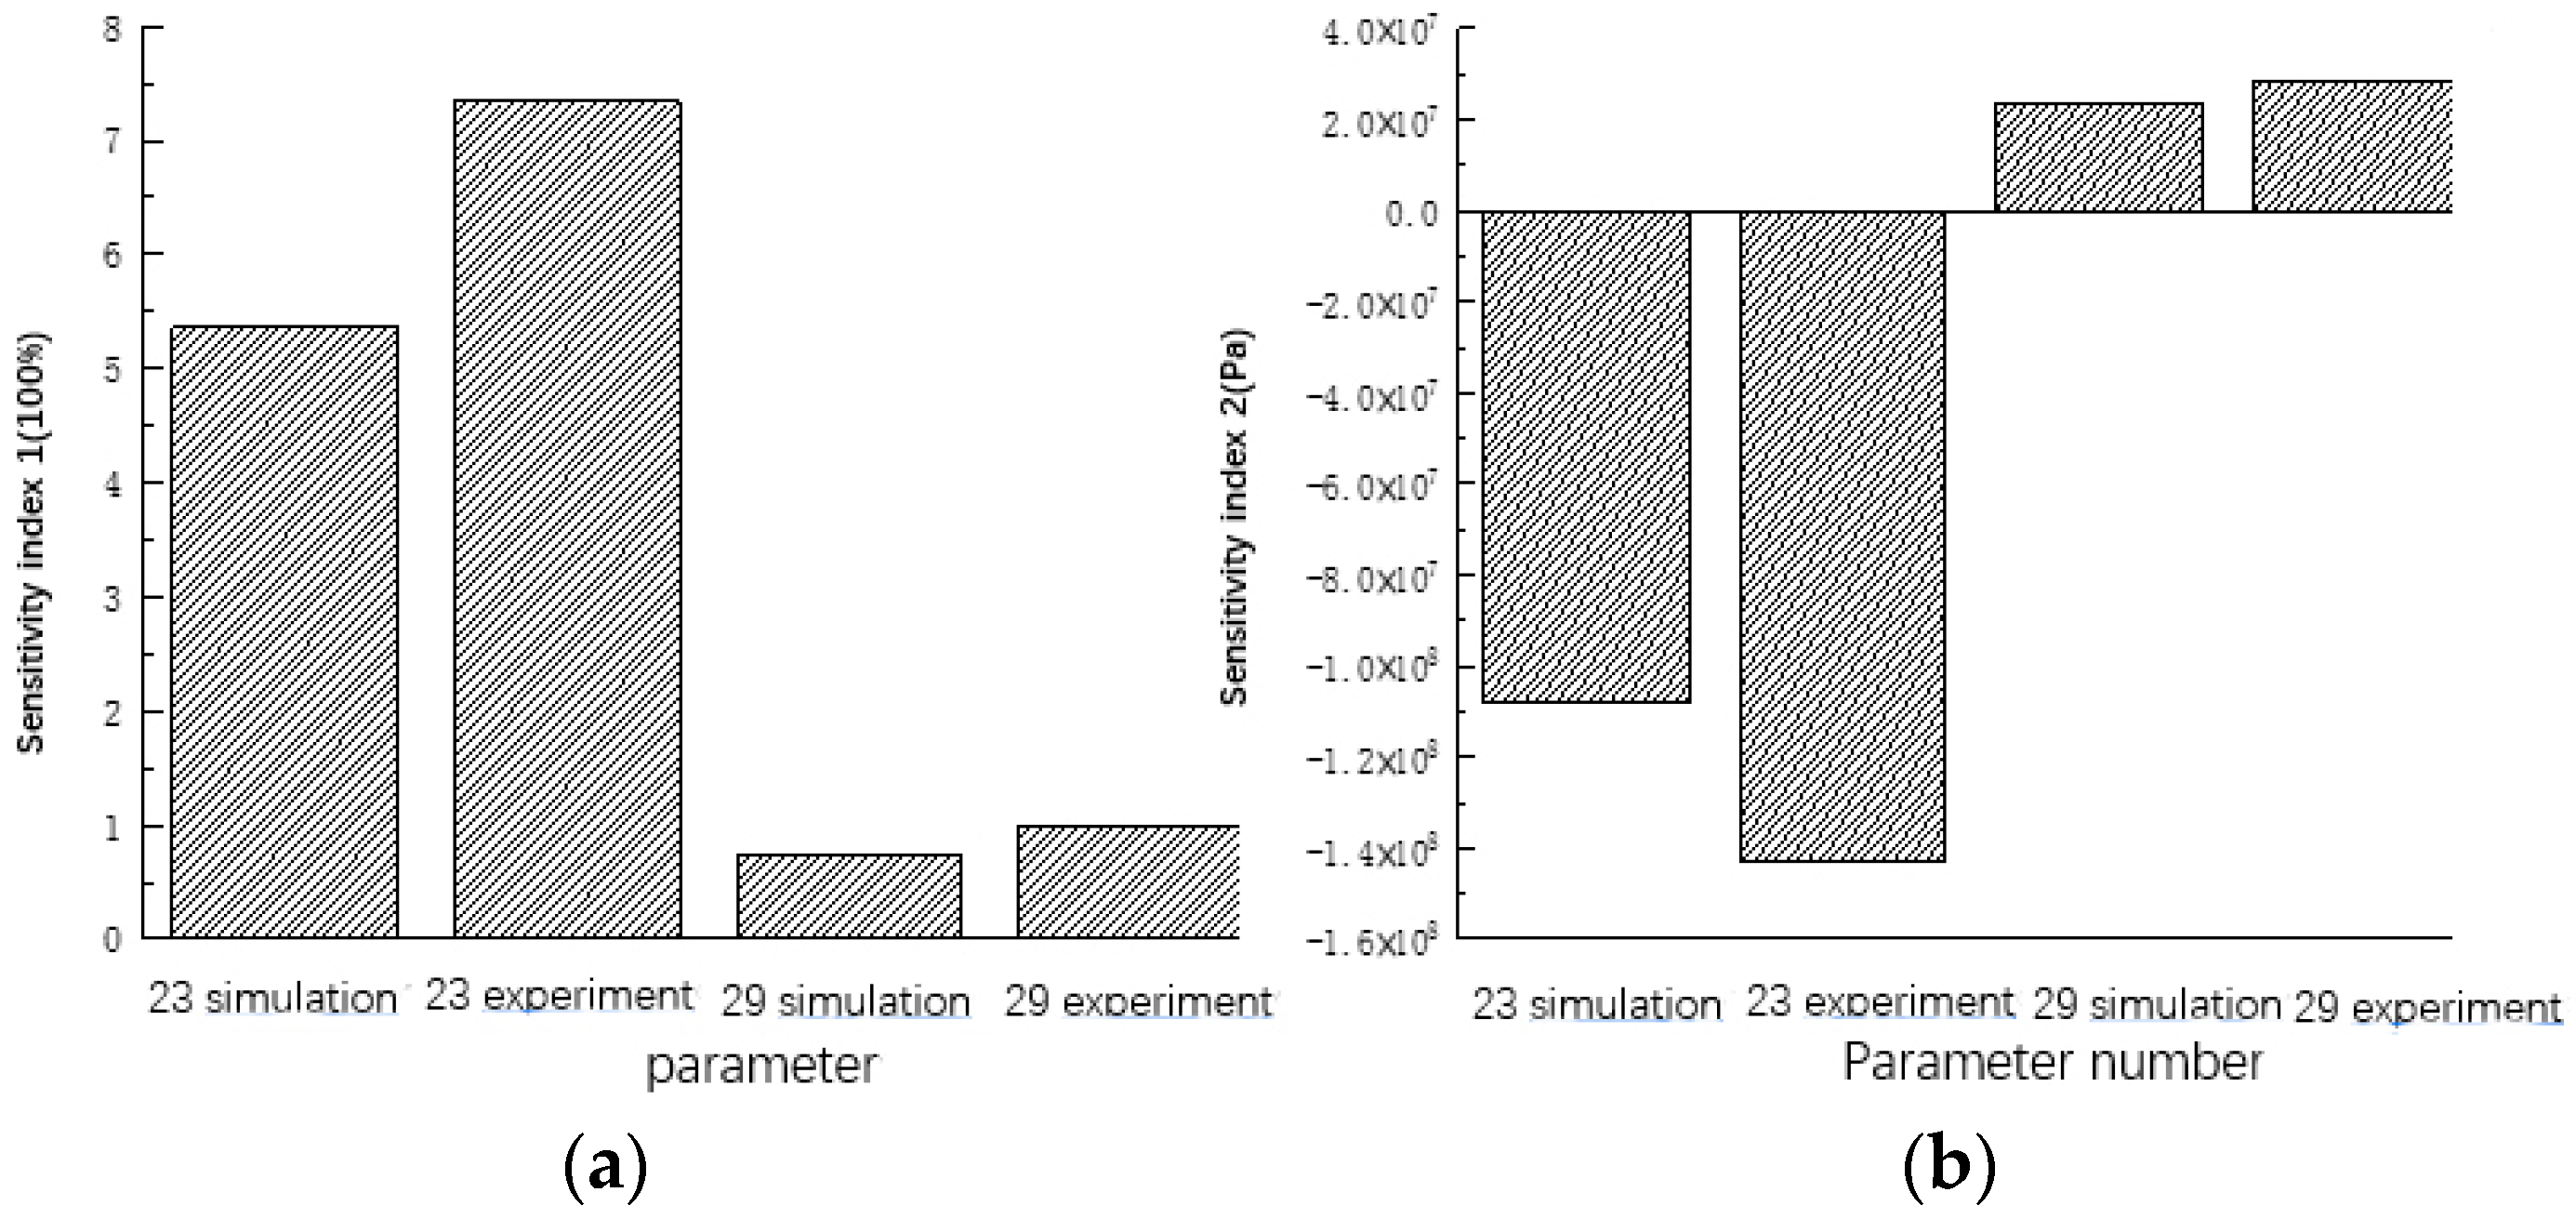
The above experimental results and simulation analysis results are compared in Figure 21 and Table 5. The sensitivity index comparison between simulation results and experimental results is shown in Figure 22.
It can be seen that there is a difference between the experimental results and the simulation analysis results, which is more obvious in the sensitivity analysis results of supply oil pressure ps. This is because the state space model of the ABPSVCS is established according to the simplified model in Section 2. This simplified model cannot fully describe all the characteristics of the actual system, and its model accuracy will have an impact on the sensitivity analysis conclusions of various parameters. In particular, due to the linearization of the flow rate of the jet spray nozzle, the supply oil pressure parameter is no longer involved in the process of establishing the recovery pressure, resulting in the actual influence of the parameter on the system not being fully reflected.
However, the regular results obtained from the simulation analysis are consistent with the experimental results:
(1)
Let the ratio of sensitivity index 1 between ps and Vh be c1, then according to Table 4, c1 simulation = 7.34 and c1 experiment = 7.41.
(2)
If the ratio of sensitivity index 2 between ps and Vh is c2, then according to Table 4, c2 simulation = −4.52 and c2 experiment = −4.96.
It can be seen that although the sensitivity index obtained from the simulation analysis is different from that of the experiment, the trend conclusion obtained from the simulation analysis still has good reference value.

6. Conclusions

Based on the nonlinear mathematical model, a parameter sensitivity analysis method using system state space to describe ballistic sensitivity was proposed; this paper studied 41 parameters’ first-order trajectory sensitivity in the dynamic model of the ABPSVCS, identifying the main and secondary influencing parameters that affect the output characteristics of the ABPSVCS. The influence degree of the two main control parameters on the control performance was analyzed quantitatively by using two sensitivity indexes, and the experiment was carried out.
The conclusions are as follows: (1) most of the parameters have a more significant influence during the constant amplitude oscillation stage of brake pressure, and the time-history curve of the first-order trajectory sensitivity analysis of each parameter also has periodic oscillation characteristics similar to that of brake pressure, indicating that most of the parameters in the system will have an influence on the constant amplitude oscillation stage of brake pressure. (2) The mean value of the changes in the system output brake pressure caused by the changes in parameters within the sampling time of the system and the sum of the changes in the system output brake pressure caused by the changes in parameters were taken as the sensitivity indexes of the two parameters. The 41 parameters in the dynamic model of the ABPSVCS of brake pressure were selected. The main parameters affecting the output of the system brake pressure are the volume of the brake chamber Vgb, the volume of the return oil chamber Vh, and the supply oil pressure ps. (3) The first sensitivity index value of the two control parameters (return oil cavity volume Vh and supply oil pressure ps) is positive in all working conditions, indicating that the increase of the two parameters will lead to the increase of brake pressure output. The positive and negative signs of the second sensitivity index of the two control parameters are different in each working condition, indicating that the increase of the two parameters will have different effects on the brake pressure output. These conclusions can be used to select the key parameters to be analyzed when analyzing the nonlinear dynamic behavior of the system in future research.
Author Contributions

Conceptualization, X.H. (Xiaolong He), Y.S., B.Y., Q.Z. and Z.X.; software, Y.W. and Y.S.; formal analysis, Q.Z.; data curation, X.H. (Xiaolong He), Y.W., Q.Z. and Y.X.; writing—original draft preparation, C.D. and Q.Z.; writing—review and editing, C.D. and X.H. (Xuekun Hou); visualization, Q.Z.; project administration, X.H. (Xiaolong He) and B.Y. All authors have read and agreed to the published version of the manuscript.

Funding

This research is funded by National Excellent Young Scientists Fund (Grant No. 52122503), National Natural Science Foundation of China (Grant No. 51975506) and “Youth Top Talent Program Project” of Hebei Province University Science and Technology Research Project (Grant No. BJ2020016).

Institutional Review Board Statement

Not applicable.

Informed Consent Statement

Not applicable.

Data Availability Statement

Not applicable.

Conflicts of Interest

The authors declare no conflict of interest.

References

  1. Udayakumar, R.; Ibrahim, M. Design analysis of Landing gear system of an aircraft. In Proceedings of the 3rd International Conference on Electronics, Communication and Aerospace Technology (ICECA), Coimbatore, India, 12–14 June 2019. [Google Scholar]
  2. Wang, X.Z.; Wan, W.Z.; Liu, Z.; Yang, C. Integrated optimization on aerodynamics-structure coupling and flight stability of a large airplane in preliminary design. J. Chin. J. Aeronaut. 2018, 31, 1258–1272. [Google Scholar] [CrossRef]
  3. Dickinson, H.B. Mauverability and Control Surface Strength Criteria for Large Airplanes. J. Aeronaut. Sci. 2012, 5, 469–477. [Google Scholar] [CrossRef]
  4. Viscardi, M.; Arena, M.; Cerreta, P.; Iaccarino, P. Design and prototyping of a novel composite architecture for a widebody landing gear bay. Mater. Today 2020, 3, 288–292. [Google Scholar] [CrossRef]
  5. Huang, Z.P.; Yu, B.; Wang, Y.H.; Zhang, Q.W.; Xie, Y.; Xie, Z.J.; Kong, X.D. Structural Analysis and Improvement Design of Brake Pressure Valve Feedback Stage in Multivalve Parallel Brake System. Shock Vib. 2021, 2021, 4551799. [Google Scholar] [CrossRef]
  6. Zhang, L.L.; Huang, Z.P.; Fu, C.W.; Xu, Y.P.; Wang, Y.H.; Kong, X.D. Design and Verification of Two-Stage Brake Pressure Servo Valve for Aircraft Brake System. Processes 2021, 9, 979. [Google Scholar] [CrossRef]
  7. Yao, B.; Bu, F.P.; Chiu, G.T.C. Non-linear Adaptive Robust Control of Electro-hydraulic Systems Driven by Double-rod Actuators. Int. J. Control. 2001, 74, 761–775. [Google Scholar] [CrossRef]
  8. Kaddissi, C.; Kenne, J.P.; Saad, M. Indirect Adaptive Control of an electro-hydraulic Servo System Based on Nonlinear Back stepping. lFAC-PapersOnLine 2018, 8, 287–294. [Google Scholar] [CrossRef]
  9. Ito, K.; Ikeo, S. PID Control Performance of a Water Hydraulic Servomotor System. SICE2002. In Proceedings of the 41st SICE Annual Conference, Osaka, Japan, 5–7 August 2002; IEEE: Piscataway, NJ, USA; Volume 3, pp. 1732–1735. [Google Scholar] [CrossRef]
  10. Chuanqiang, L.; Fei, X.; Jilong, L.; Gao, S. Analysis and compensation of the rotor position offset error and time delay in field-oriented-controlled PMSM drives. IET Power Electron. 2020, 13, 1911–1918. [Google Scholar] [CrossRef]
  11. Huicong, A.; Chaojun, O.Y.; Chuan, Z.; Zhao, W. Landslide dynamic process and parameter sensitivity analysis by discrete element method: The case of Turnoff Creek rock avalanche. J. Mt. Sci. 2020, 17, 1581–1595. [Google Scholar] [CrossRef]
  12. Mathematics, C. Study Findings from Lanzhou Jiaotong University Broaden Understanding of Chaos Research (A Calculation Method on Bifurcation and State Parameter Sensitivity Analysis of Piecewise Mechanical Systems). Int. J. Bifurc. Chaos 2020, 9, 701. [Google Scholar] [CrossRef]
  13. Xiang, R.; Liu, J.C.; Xu, Y.; Liu, Y.Q.; Nai, C.X.; Dong, L.; Huang, Q.F. Framework, method and case study for the calculation of end of life for HWL and parameter sensitivity analysis. Sci. Rep. 2020, 10, 19509. [Google Scholar] [CrossRef] [PubMed]
  14. Kayser, B.; Cotté, B.; Ecotière, D.; Gauvreau, B. Environmental parameters sensitivity analysis for the modeling of wind turbine noise in downwind conditions. J. Acoust. Soc. Am. 2020, 148, 3623. [Google Scholar] [CrossRef] [PubMed]
  15. Piemjaiswang, R.; Ding, Y.; Feng, Y.; Piumsomboon, P.; Chalermsinsuwan, B. Effect of transport parameters on atherosclerotic lesion growth: A parameter sensitivity analysis. Comput. Methods Programs Biomed. 2021, 199, 105904. [Google Scholar] [CrossRef] [PubMed]
  16. Verhoeven, R. Analysis of the Workspace of Tendon-Based Stewart Platform. Ph.D. Thesis, Gerhard Mercator University, Duisburg, Germany, 2004; pp. 17–28. [Google Scholar]
  17. Anton, I.; Loan, S. Numerical modeling of cavitation characteristics and sensitivity curves for reversible hydraulic machinery. J. Eng. Anal. Bound. Elem. 2014, 41, 18–27. [Google Scholar] [CrossRef]
  18. Ba, K.X.; Song, Y.H.; Yu, B.; Wang, C.Y.; Li, H.S.; Zhang, J.X.; Ma, G.L. Kinematics correction algorithm for the LHDS of a legged robot with semi-cylindrical foot end based on V-DOF. Mech. Syst. Signal Process. 2022, 167, 108566. [Google Scholar] [CrossRef]
  19. Ba, K.X.; Song, Y.H.; Shi, Y.P.; Wang, C.Y.; Ma, G.L.; Wang, Y.; Yu, B.; Yuan, L.P. A Novel One-Dimensional Force Sensor Calibration Method to Improve the Contact Force Solution Accuracy for Legged Robot. Mech. Mach. Theory 2022, 169, 104685. [Google Scholar] [CrossRef]
Figure 1. Schematic diagram of the brake servo valve in the hydraulic pipeline system of a large aircraft.
Electronics 11 00746 g001
Figure 2. Schematic diagram of single valve single circuit system.
Electronics 11 00746 g002
Figure 3. Schematic diagram of the brake pressure servo valve in ABPSVCS.
Electronics 11 00746 g003
Figure 4. (a) Block diagram of ABPSVCS. (b) Flow block diagram of ABPSVCS. (c) Logical block diagram of hydraulic system.
Electronics 11 00746 g004
Figure 5. The solving conditions of first-order trajectory sensitivity. (a) Brake pressure response under 40 mA step, (b) 0~0.2 step response waveform of brake pressure.
Electronics 11 00746 g005
Figure 6. (A) The first-order trajectory sensitivity under 40 mA step signal (1). (B) The first-order trajectory sensitivity under 40 mA step signal (2).
Electronics 11 00746 g006aElectronics 11 00746 g006bElectronics 11 00746 g006cElectronics 11 00746 g006dElectronics 11 00746 g006e
Figure 7. The change of x8 with amplifier parameter varieties by 10%.
Electronics 11 00746 g007
Figure 8. The change of x8 with feedback part parameter varieties by 10%.
Electronics 11 00746 g008
Figure 9. The change of x8 with power spool part parameter varieties by 10%.
Electronics 11 00746 g009
Figure 10. The change of x8 with actuator parameter varieties by 10%.
Electronics 11 00746 g010
Figure 11. The change of x8 with return oil part parameter varieties by 10%.
Electronics 11 00746 g011
Figure 12. The sensitivity index resulting from amplifier parameter variation.
Electronics 11 00746 g012
Figure 13. The change of x8 with feedback part parameter varieties by 10%.
Electronics 11 00746 g013
Figure 14. The sensitivity index resulting from power spool part parameter variation.
Electronics 11 00746 g014
Figure 15. The sensitivity index resulting from actuator parameter variation.
Electronics 11 00746 g015
Figure 16. The sensitivity index resulting from return oil part parameter variation.
Electronics 11 00746 g016
Figure 17. The hydraulic principle of ABPSVCS experiment platform.
Electronics 11 00746 g017
Figure 18. ABPSVCS experimental platform. (a) Load simulation experimental platform. (b) Brake pressure servo valve group.
Electronics 11 00746 g018
Figure 19. The hydraulic hose with different lengths.
Electronics 11 00746 g019
Figure 20. The experimental results of brake pressure with ps varieties by 10%.
Electronics 11 00746 g020
Figure 21. The experimental results of brake pressure with different hydraulic hoses.
Electronics 11 00746 g021
Figure 22. The sensitivity index comparison between simulation and experimental results. (a) Sensitivity index 1. (b) Sensitivity index 2.
Electronics 11 00746 g022
Table 1. The parameters of Figure 4a.
ParameterDefinitionUnit
ψ The armature/jet pipe rotation angle rad
K m The magnetic torque spring stiffness Nm / rad
K t The electromagnetic moment coefficient Nm / rad
K a The spring tube stiffness Nm / rad
B a The damping coefficient of the armature component Nm / rad / s
K f g The stiffness of the feedback rod N / m
r The distance from the rotation center of the feedback rod to the nozzle m
X c The initial offset of the second stage spool m
b The distance from the nozzle to the connection between the feedback rod and the spool m
A s The cross-sectional area of the jet nozzle m 2
P s The supply oil pressure Pa
r b The distance between the jet nozzle and the receiver m
P c The recovery pressure Pa
P h The return oil pressure Pa
M c The quality of the feedback spool kg
K c The feedback spring stiffness N / m
B c The viscous damping of the feedback level spool Nm / rad / s
P b Brake pressure Pa
A v The area of action of control pressure m 2
M v The power level spool mass kg
x v The displacement of the spool at the power level m
B v The viscosity damping of the power level spool Nm / rad / s
K The spring stiffness of the power level N / m
K f The steady-state fluid dynamic stiffness N / m
A g The effective area of the piston of the brake actuator m 2
V g b The brake cavity composed of the rodless cavity of the brake actuator and the hydraulic pipe m 3
M g The mass of the actuator piston kg
B g The viscosity damping coefficient of the actuator piston Nm / rad / s
K g The actuator spring stiffness N / m
A j The relief valve control pressure action area m 2
K s The steady-state fluid dynamic coefficient of the overflow valve core N / MPa
M j The mass of the moving parts of the relief valve kg
B j The relief valve damping coefficient Nm / rad / s
K j The relief valve pressure regulating spring stiffness N / m
Q s The flow rate of the jet nozzle m 3 / s
Q c The flow rate of the cavity for the relief valve m 3 / s
Q a The overflow valve flow m 3 / s
Table 2. The parameters of α .
NumberParameterUnitNumberParameterUnit
α 1 K t Nm / A α 2 K m Nm / rad
α 3 K f g N / m α 4 K a Nm / rad
α 5 B a Nm / rad / s α 6 J a kg m 2
α 7 A c m 2 α 8 r m
α 9 K C N / m α 10 B c Nm / rad / s
α 11 M C kg α 12 β Pa
α 13 k q m 2 / s α 14 k c m 3 / s Pa
α 15 r b m α 16 A v m 2
α 17 V c v m 3 α 18 A b m 2
α 19 A h m 2 α 20 B v Nm / rad / s
α 21 K N / m α 22 K f N / m
α 23 p s Pa α 24 M v kg
α 25 V g b m3 α 26 K d m 2 / s
α 27 C b m 3 / s Pa α 28 A g m 2
α 29 V h m 3 α 30 Q s m 3 / s
α 31 R c m 3 / s Pa α 32 K d 2 m 2 / s
α 33 B g Nm / rad / s α 34 K g N / m
α 35 M g kg α 36 A j m 2
α 37 B j Nm / rad / s α 38 K j N / m
α 39 k s N / m α 40 M j kg
α 41 V c j m 3
Table 3. Grouping of specific parameters.
Parameter GroupIncluded Parameters
Fluidic amplifier parametersα1 = Kt, α2 = Km, α3 = Kfg, α4 = Ka, α5 = Ba, α6 = Ja, α8 = r, α12 = βt, α13 = kq, α14 = kc, α15 = rb
Feedback level parametersα7 = Ac, α9 = Kc, α10 = Bc, α11 = Mc, α17 = Vc
Power level parametersα16 = Av, α18 = Ab, α19 = Ah, α20 = Bv, α21 = K, α22 = Kf, α24 = Mv, α26 = Kd
Brake actuator parametersα23 = ps, α25 = Vgb, α27 = Cb, α28 = Ag, α33 = Bg, α34 = Kg, α35 = Mg
Return oil channel parametersα29 = Vh, α30 = Qs, α31 = Rc, α32 = Kd2, α36 = Aj, α37 = Bj, α38 = Kj, α39 = ks, α40 = Mj, α41 = Vcj
Table 4. Parameters of the experimental platform.
Supply Oil PressureSystem FlowBrake Pipe (m)Return Oil Pipe (m)Return PressureLoad StiffnessLoad Damping
15 MPa6.25× 104 m3/sϕ0.006 × 1.50ϕ0.006 × 1.010.6 MPa1,000,000 N/m50 N·s/m
Table 5. The sensitivity index comparison.
ps (Parameter 23)Vh (Parameter 29)
SimulationExperimentSimulationExperiment
Index 15.36%7.34%0.73%0.99%
Index 2−107.9 MPa−142.7 MPa23.86 MPa28.77 MPa
Publisher’s Note: MDPI stays neutral with regard to jurisdictional claims in published maps and institutional affiliations.