
A Novel GPS Meaconing Spoofing Detection Technique Based on Improved Ratio Combined with Carrier-to-Noise Moving Variance


Abstract
:1. Introduction
- The existence of distortions of SPCA, SQM or variance analysis can only be observed for a short moment, making them easily missed.
- The implementation of an external auxiliary can be rather troublesome and expensive for civil applications.
- The encryption method needs adjustment to all currently used satellites and receivers, which is extremely expensive.
- The repeated acquisition and multipath effect require a lot of extra computations in the receiver, causing unnecessary burden and delay.
2. Spoofing Detection System and Data Collection
2.1. The Meaconing Spoofing System
2.2. The Detection Software
3. Methodology
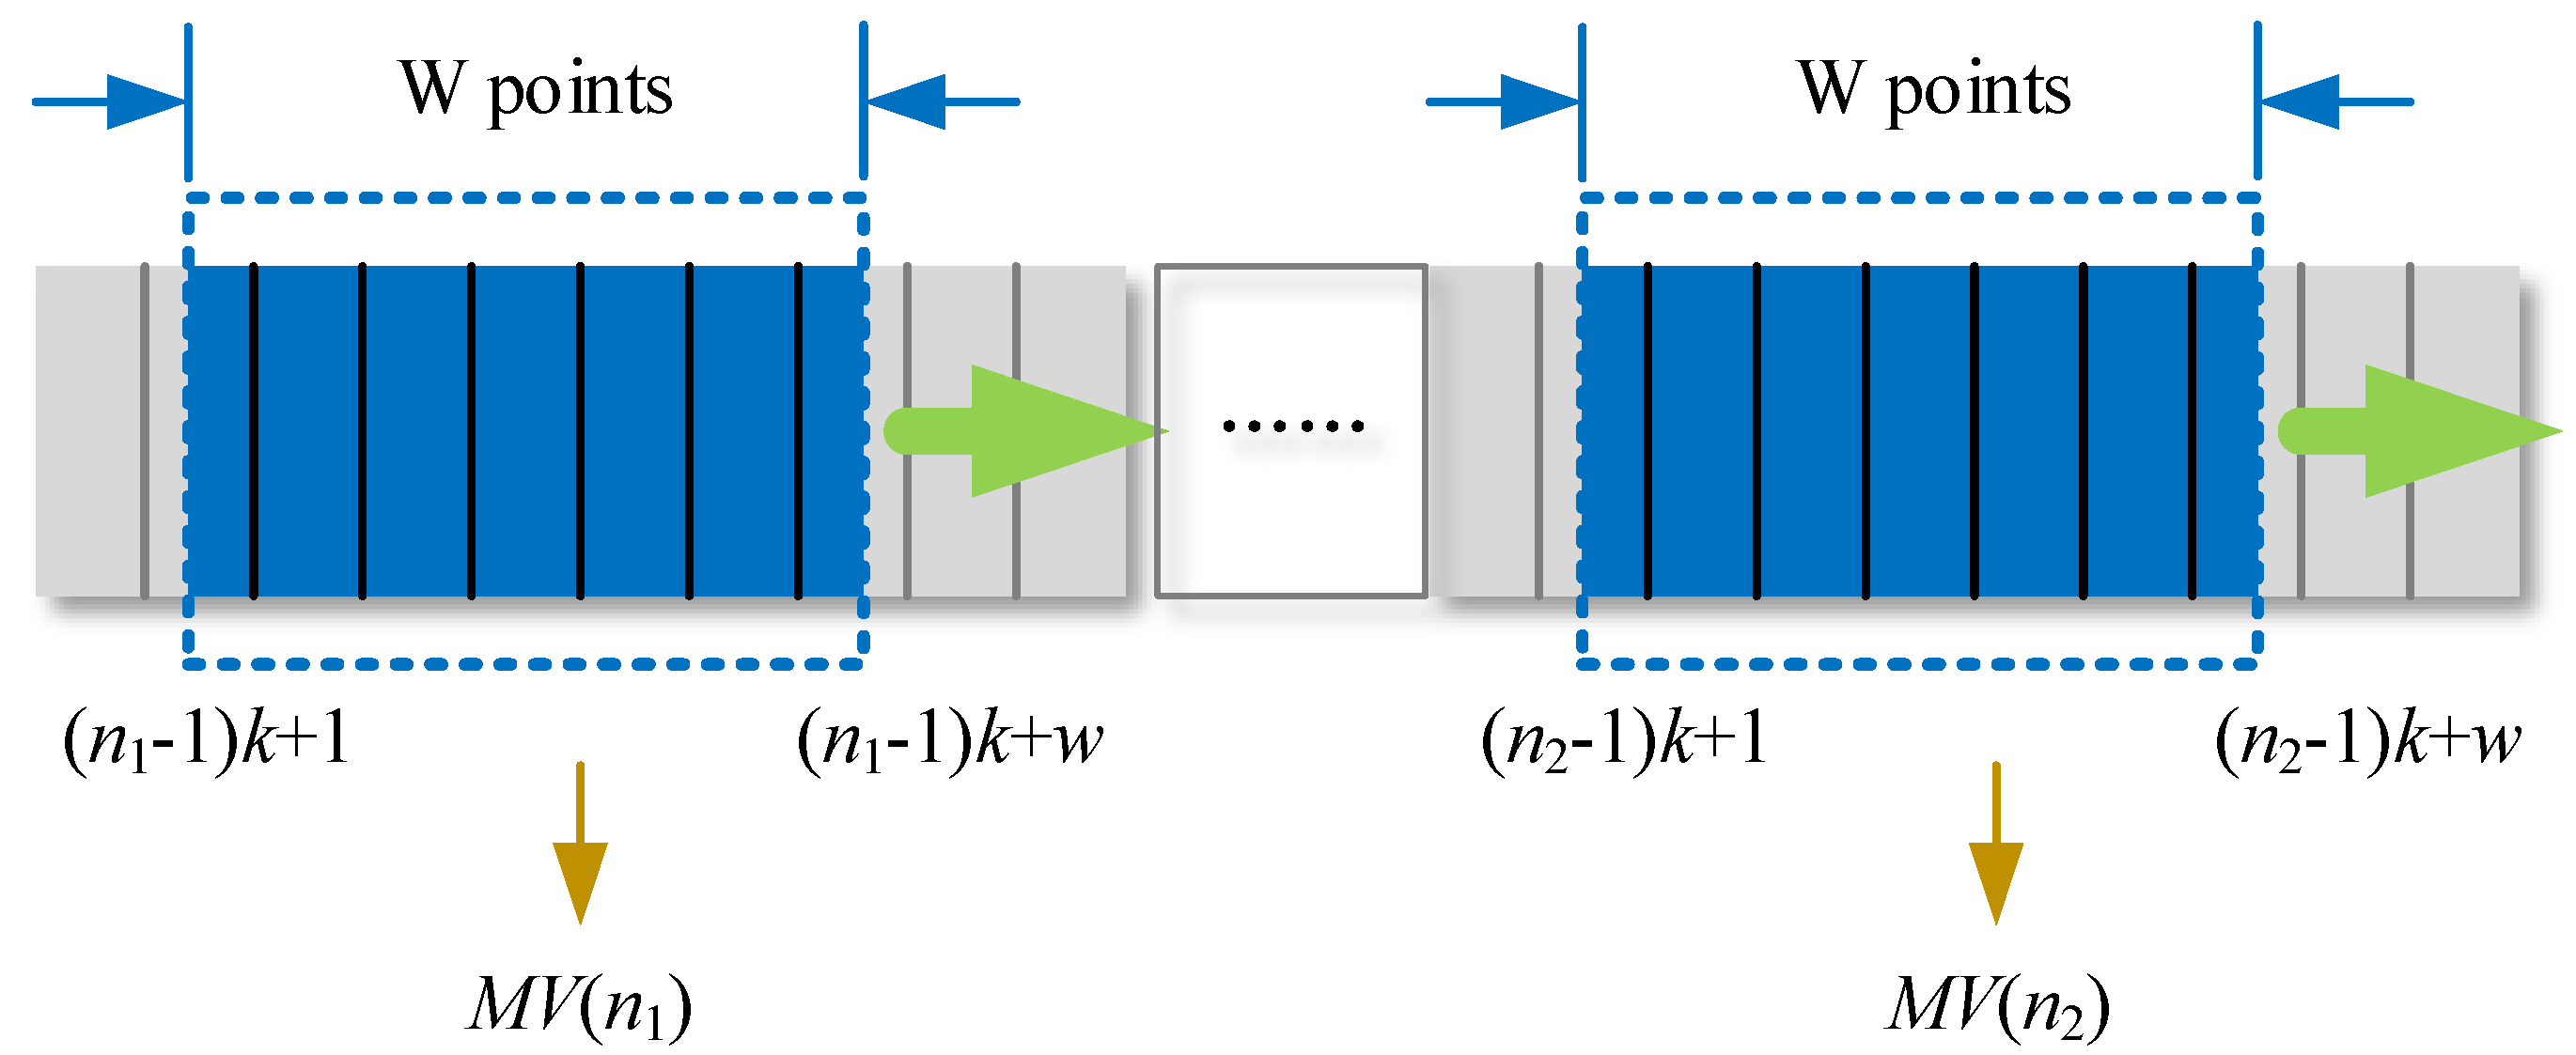
3.1. Derivation of the
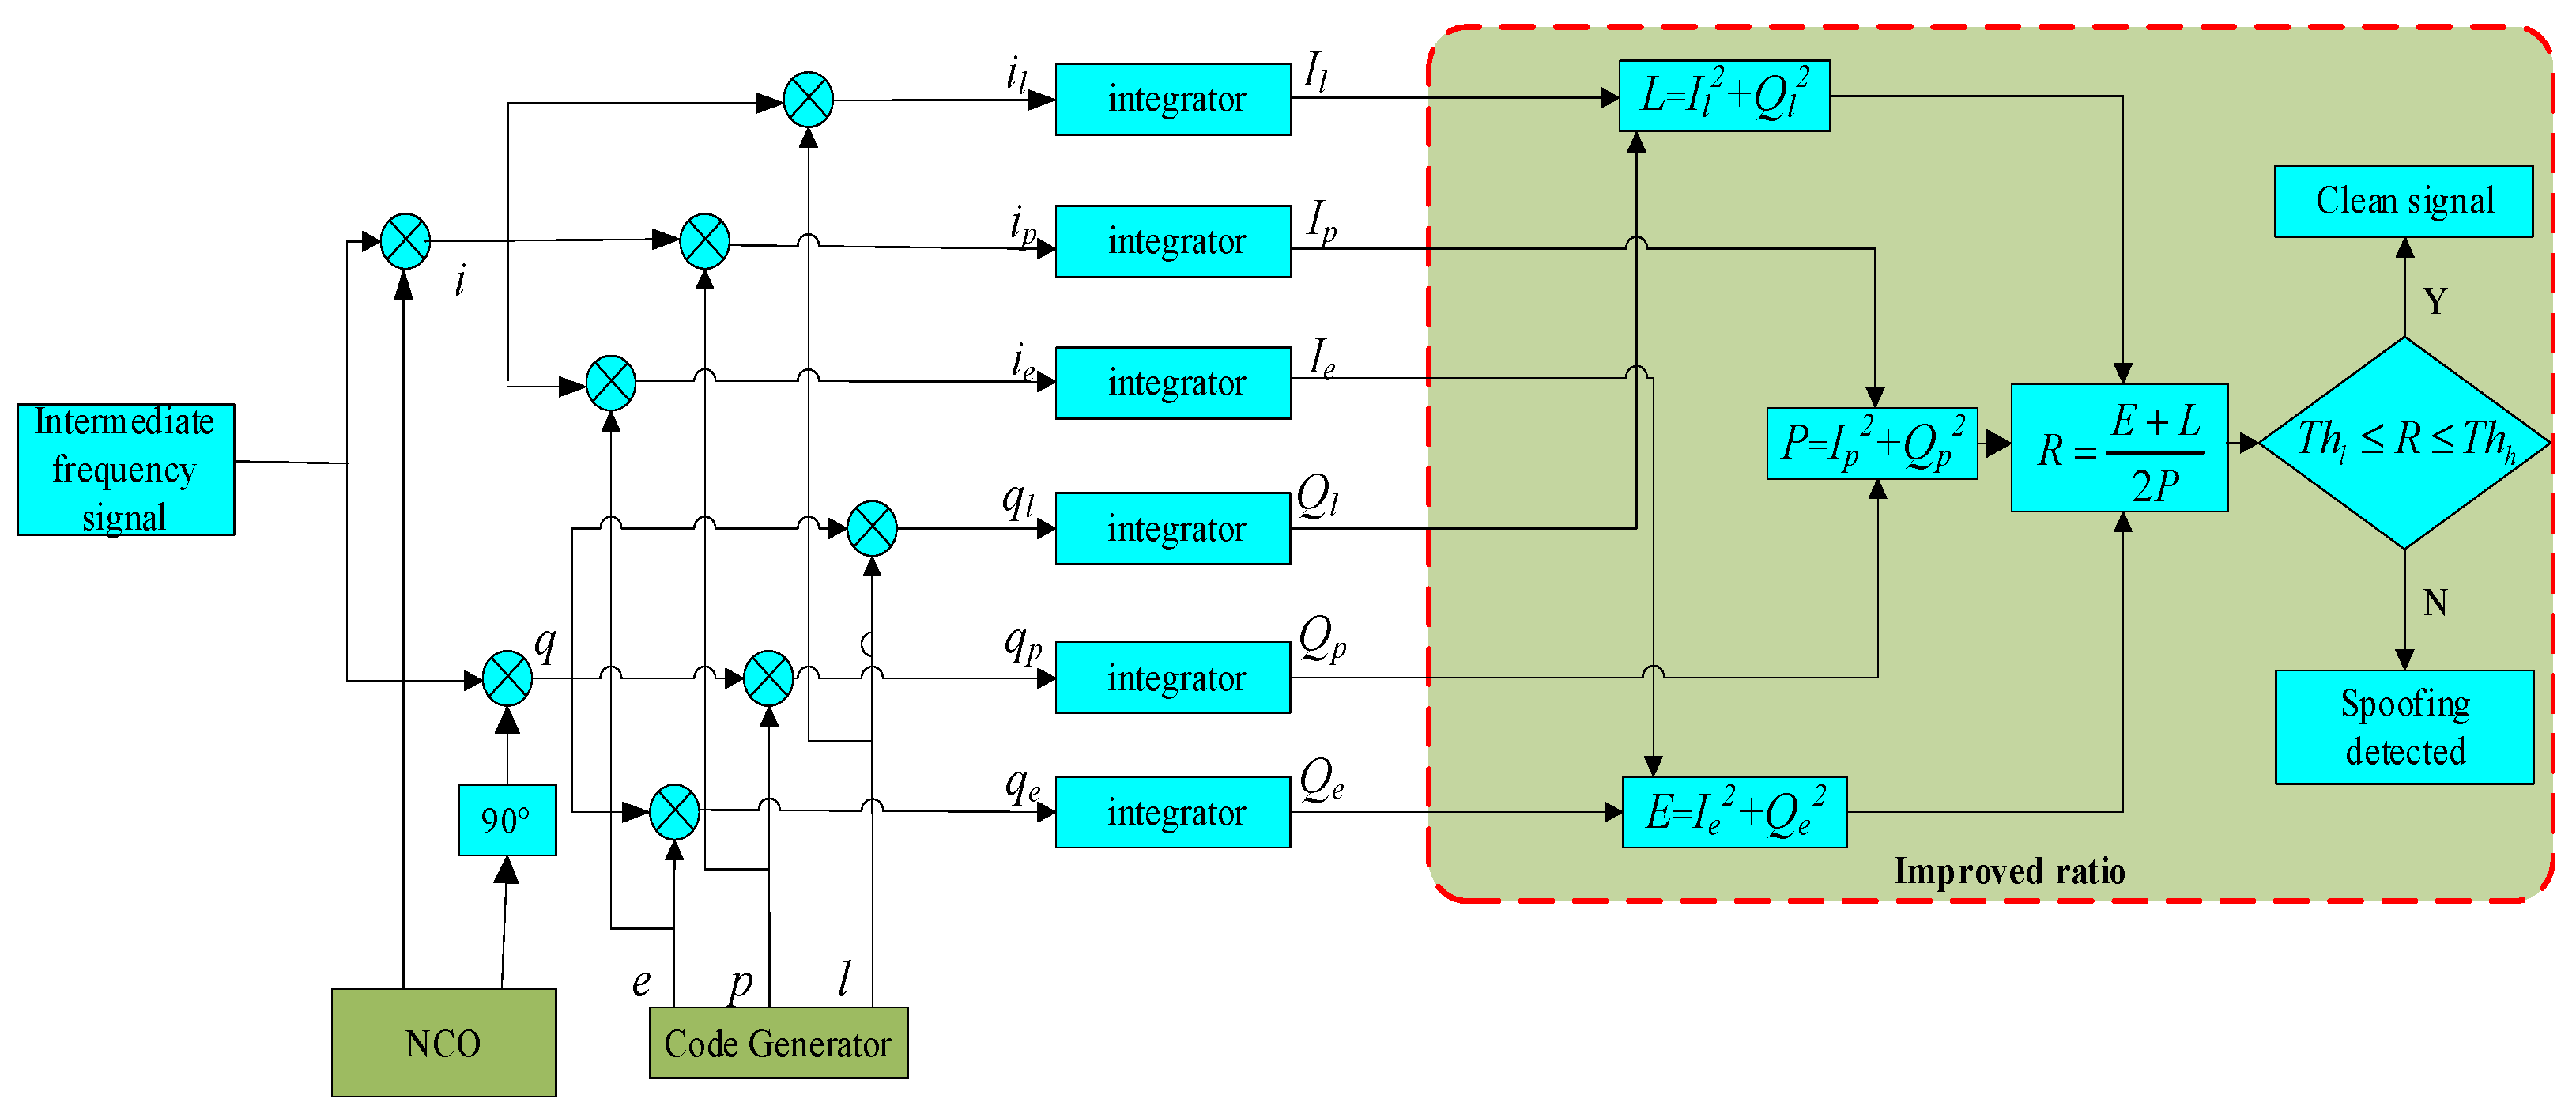
3.2. Derivation of Improved Ratio
4. Results and Discussion
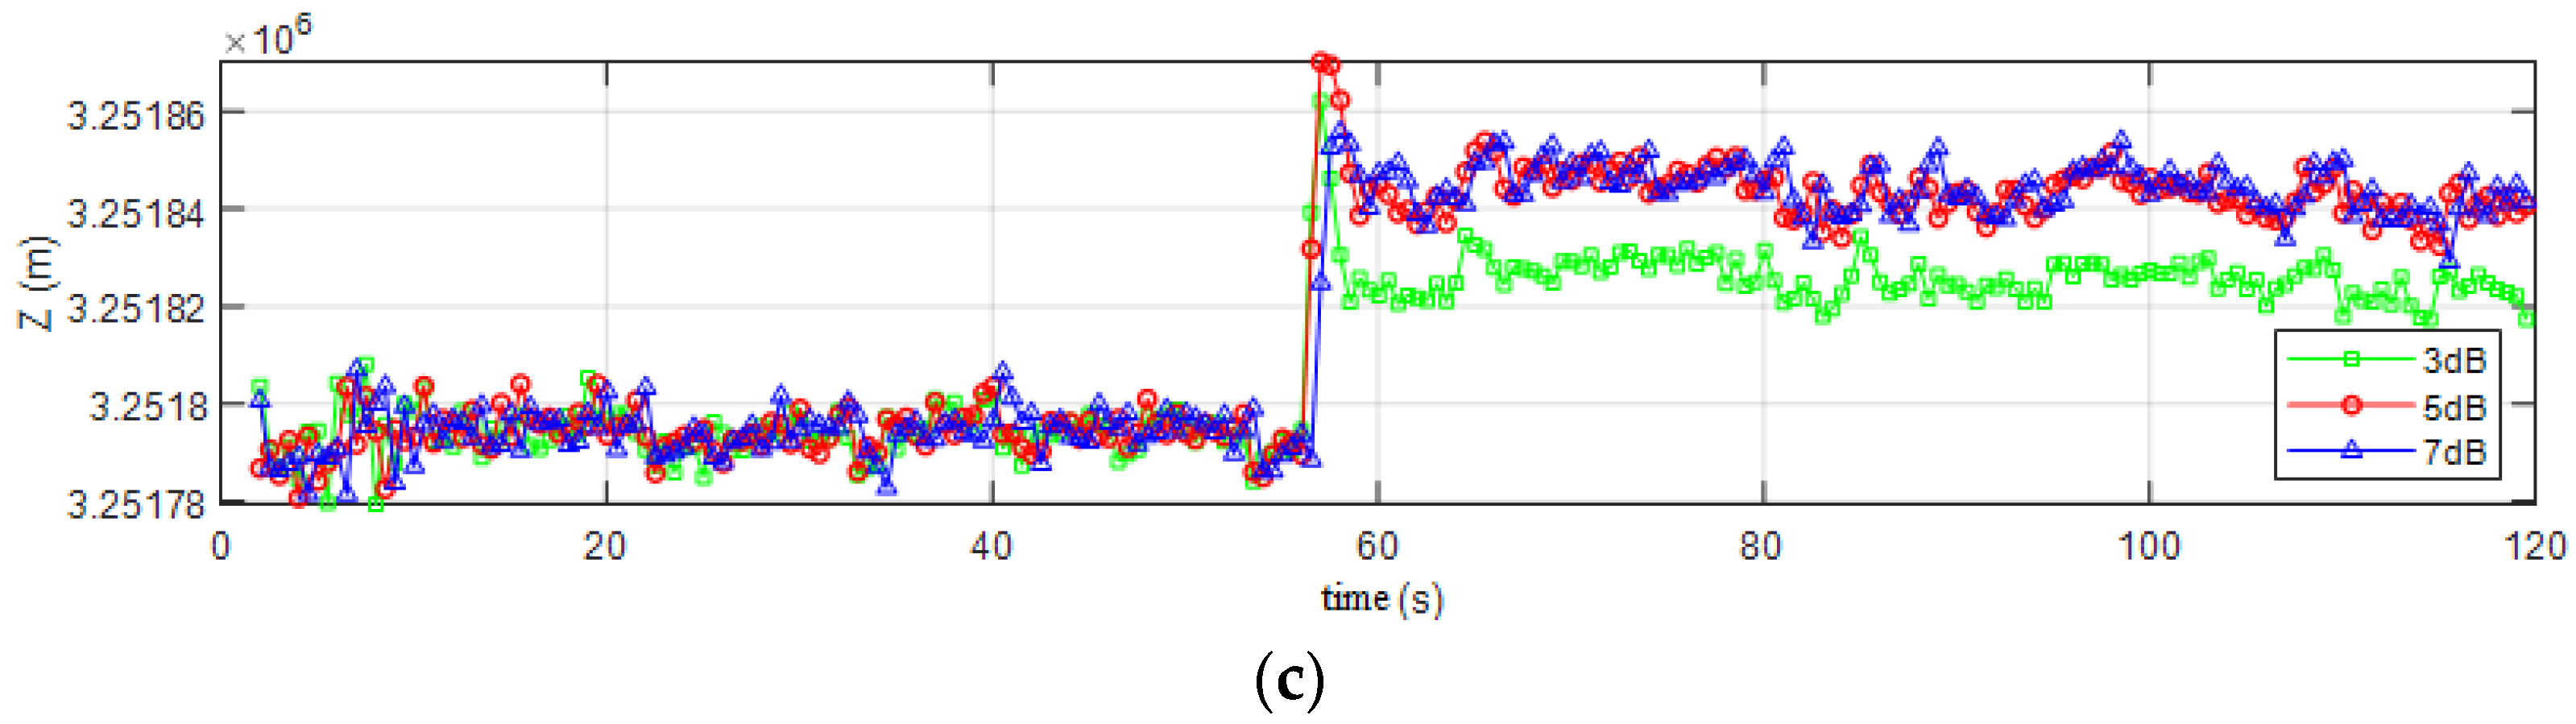
4.1. Meaconing Spoofing Detection Experiment
- Clean GNSS signal was generated and transmitted by the meaconing spoofing system in Figure 1 for the first 56 s, with data extracted from the SDR and stored in the database.
- The GNSS simulator generated the meaconing signal, along with the clean signal and sent them through the whole system. Data were recorded and saved at the meantime.
- We repeated the steps above with different power gain and delay set to meaconing signals.
- The detection software was later run upon the data kept in database.
4.2. Spoofing Detection
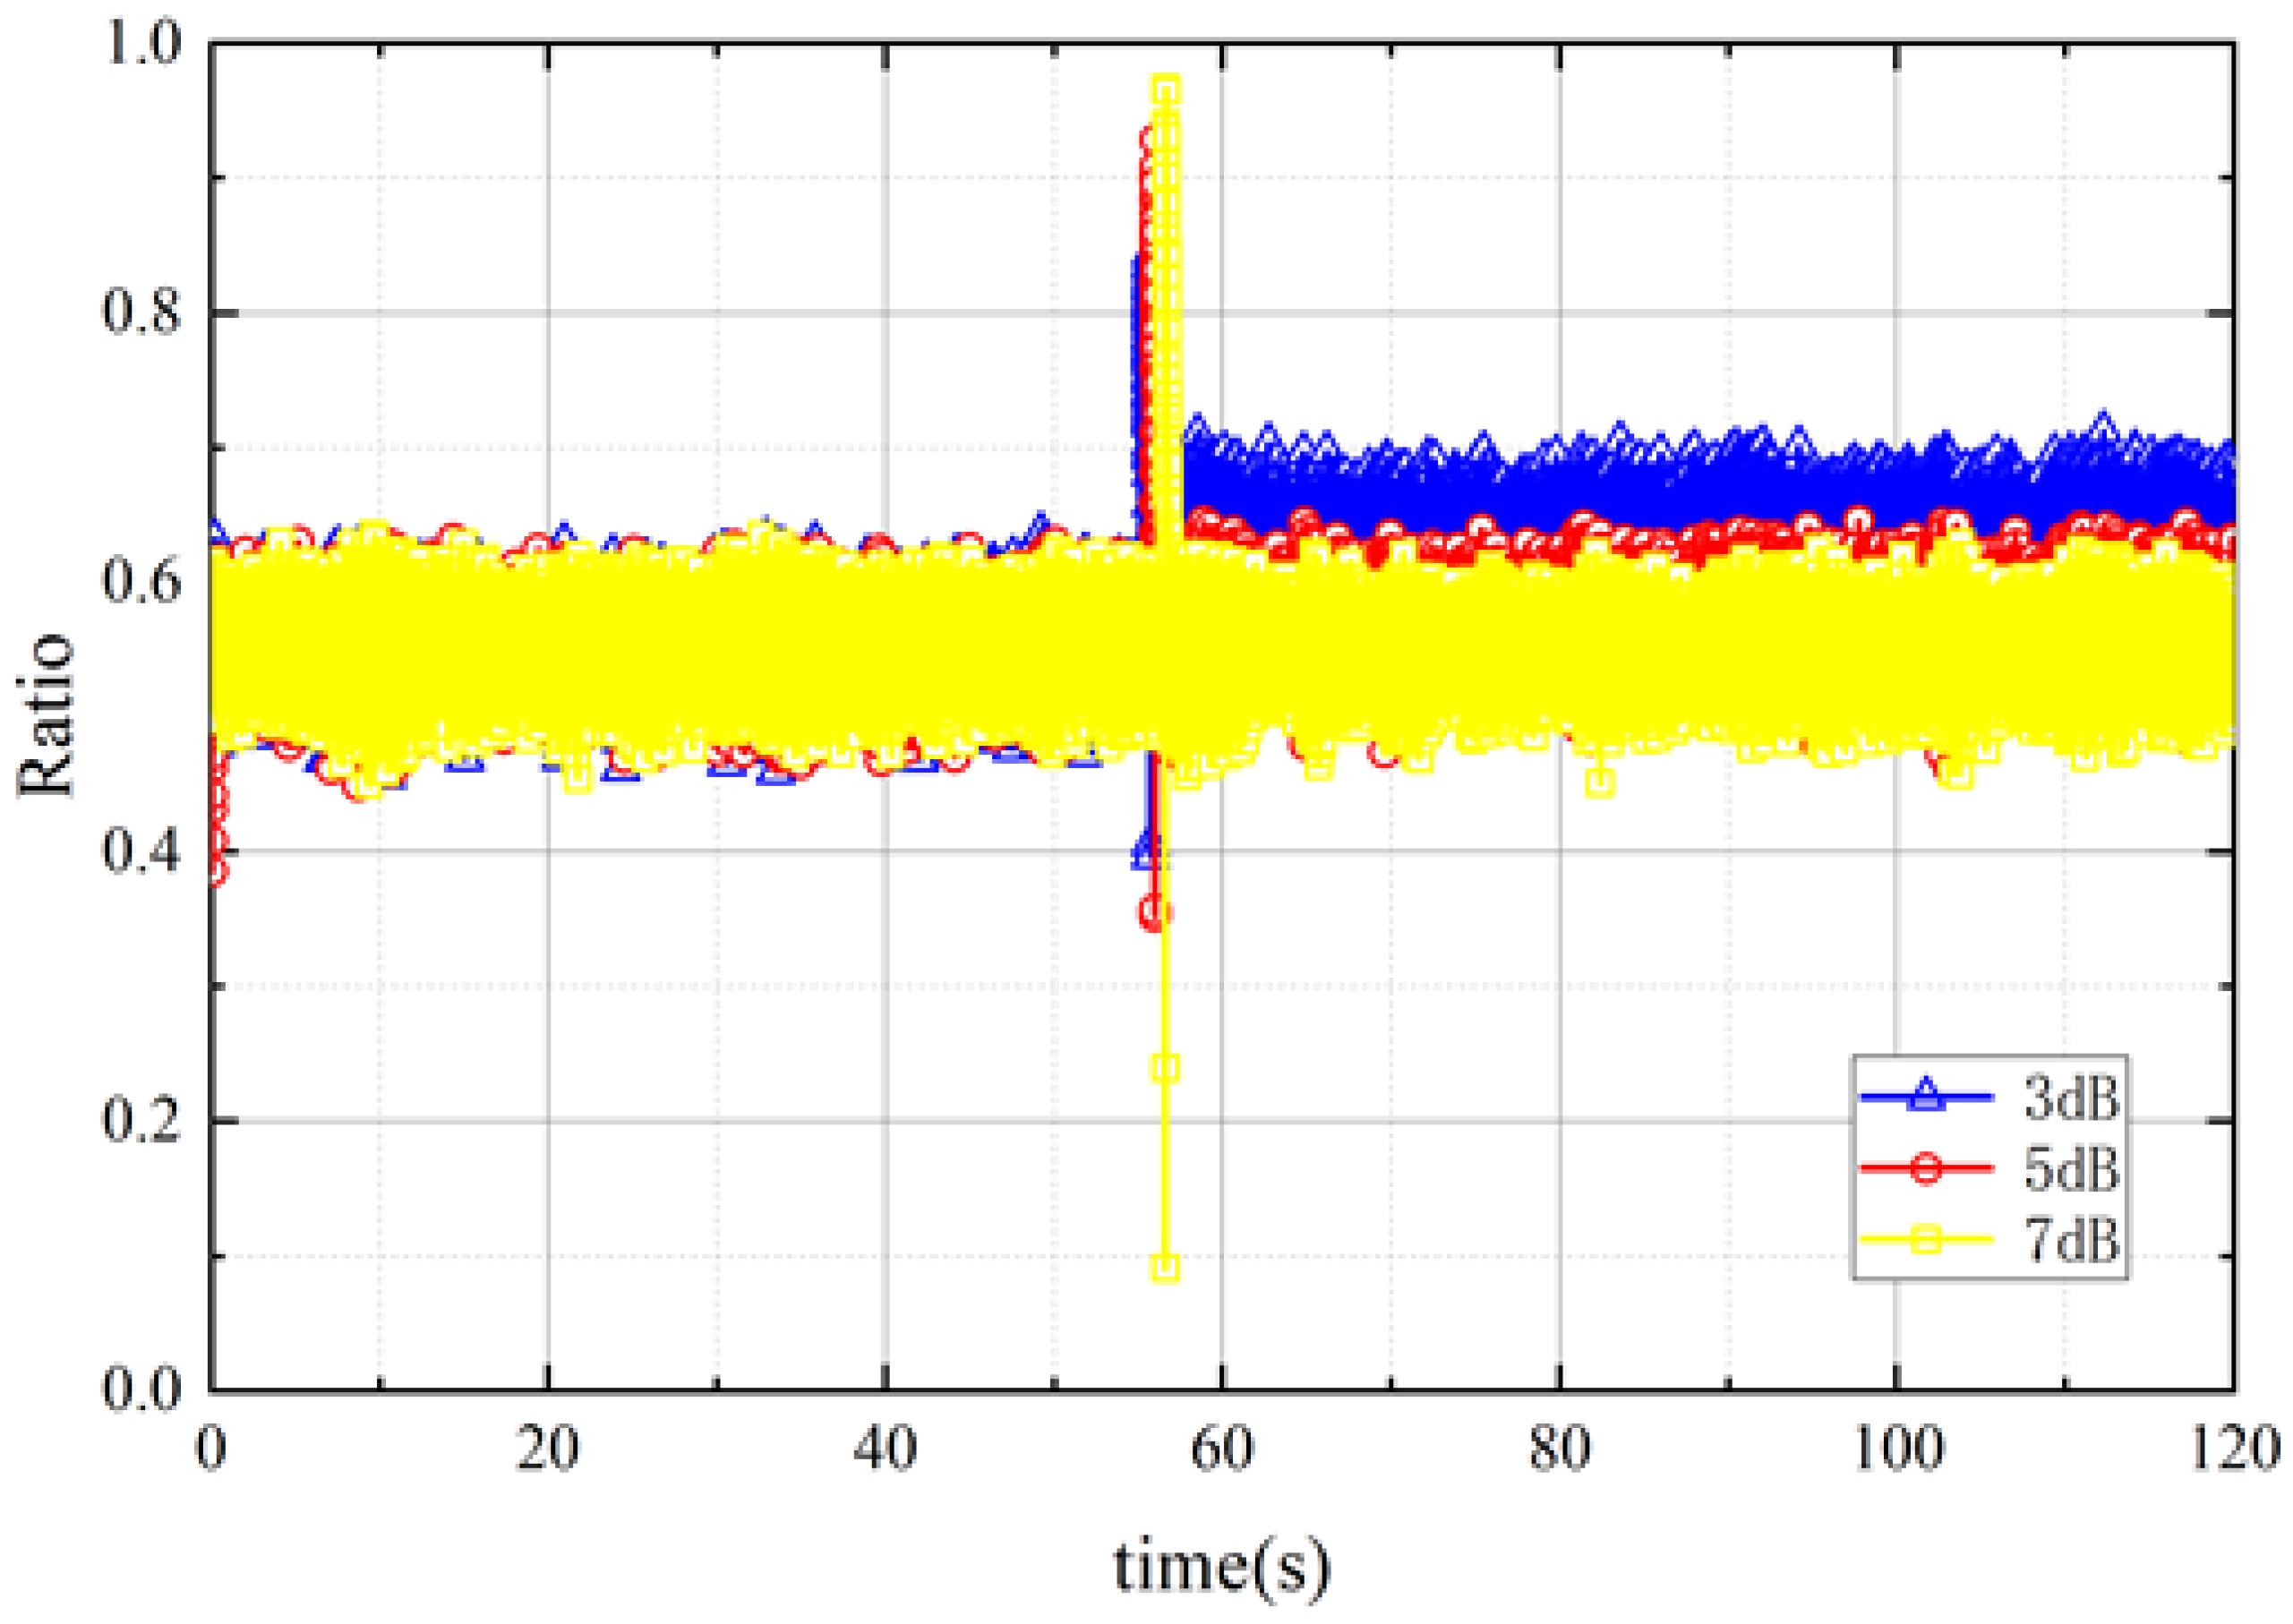
4.2.1. The Effectiveness of SQM Detection with Ratio Metric
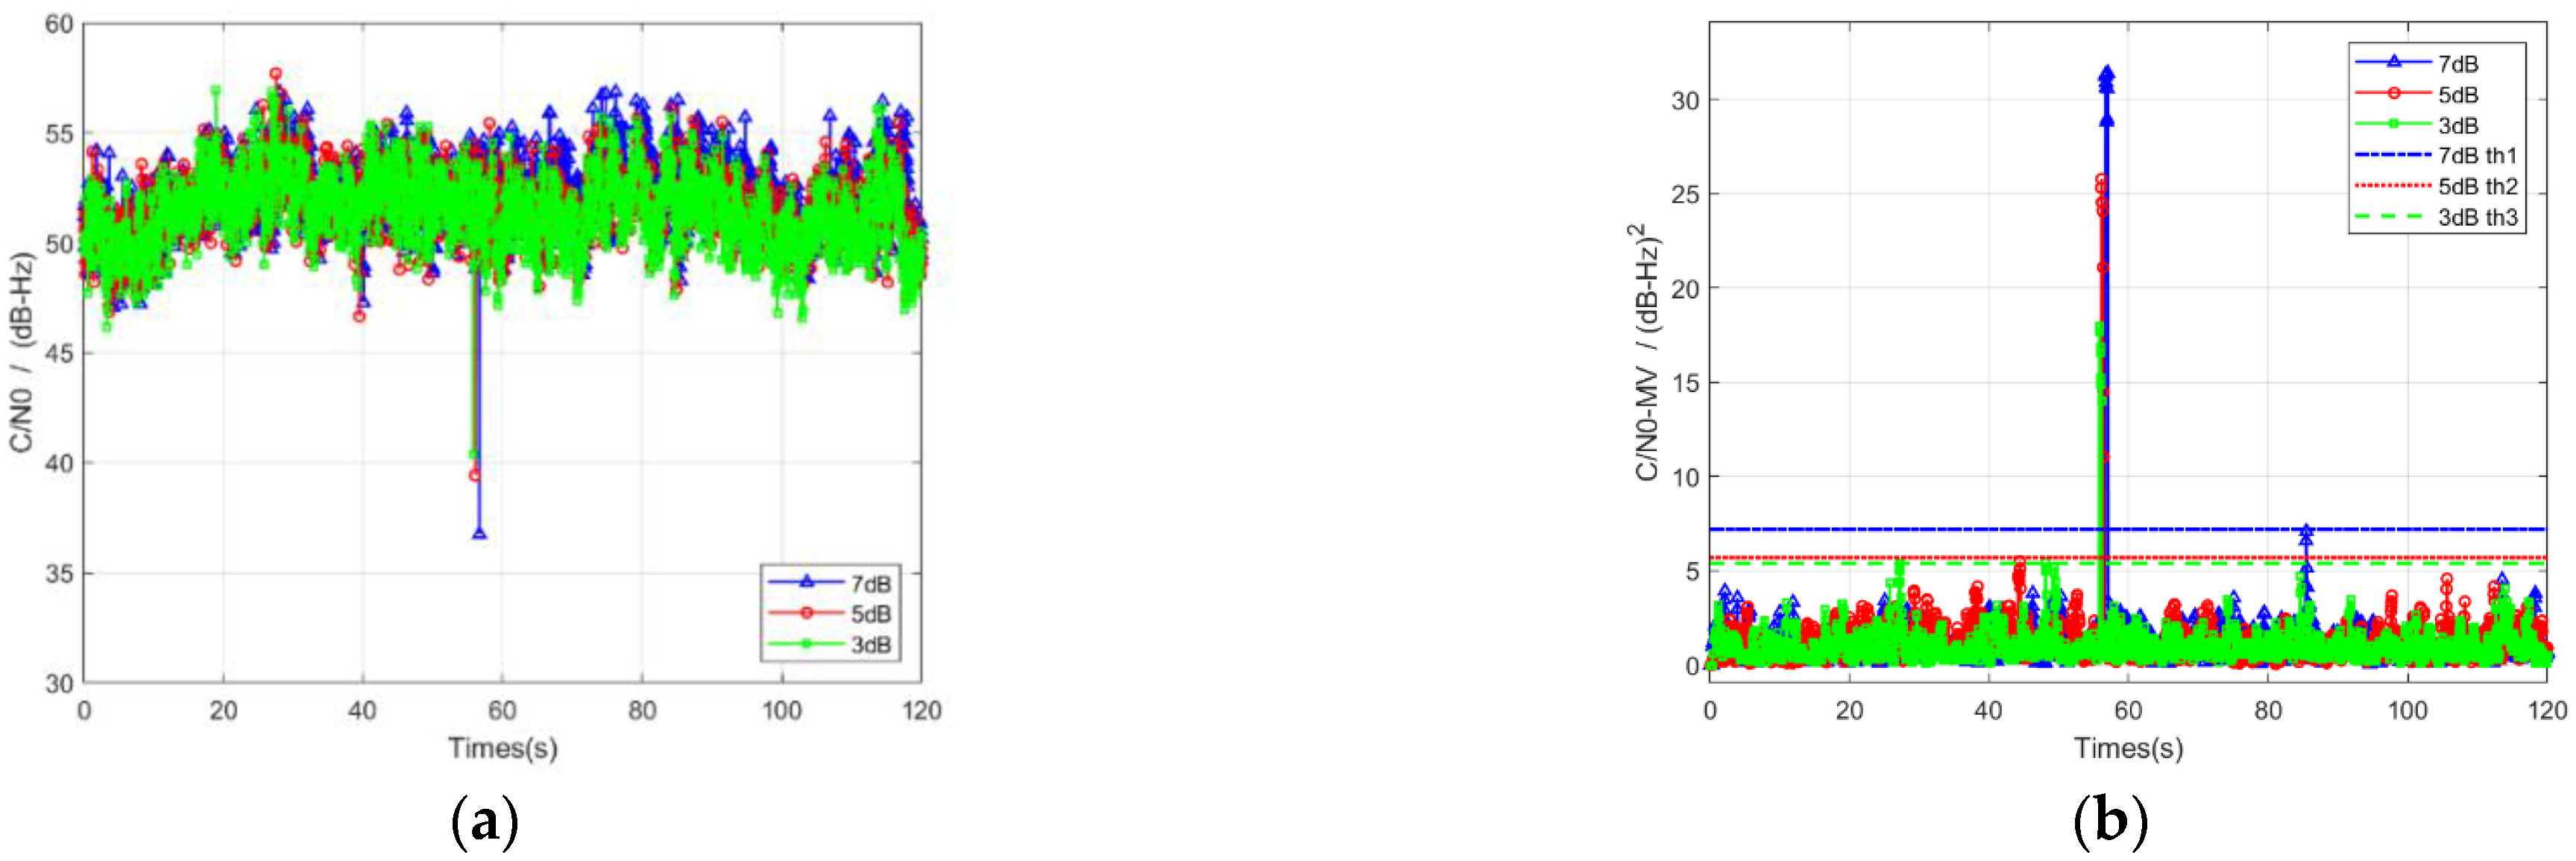
4.2.2. The Effectiveness of
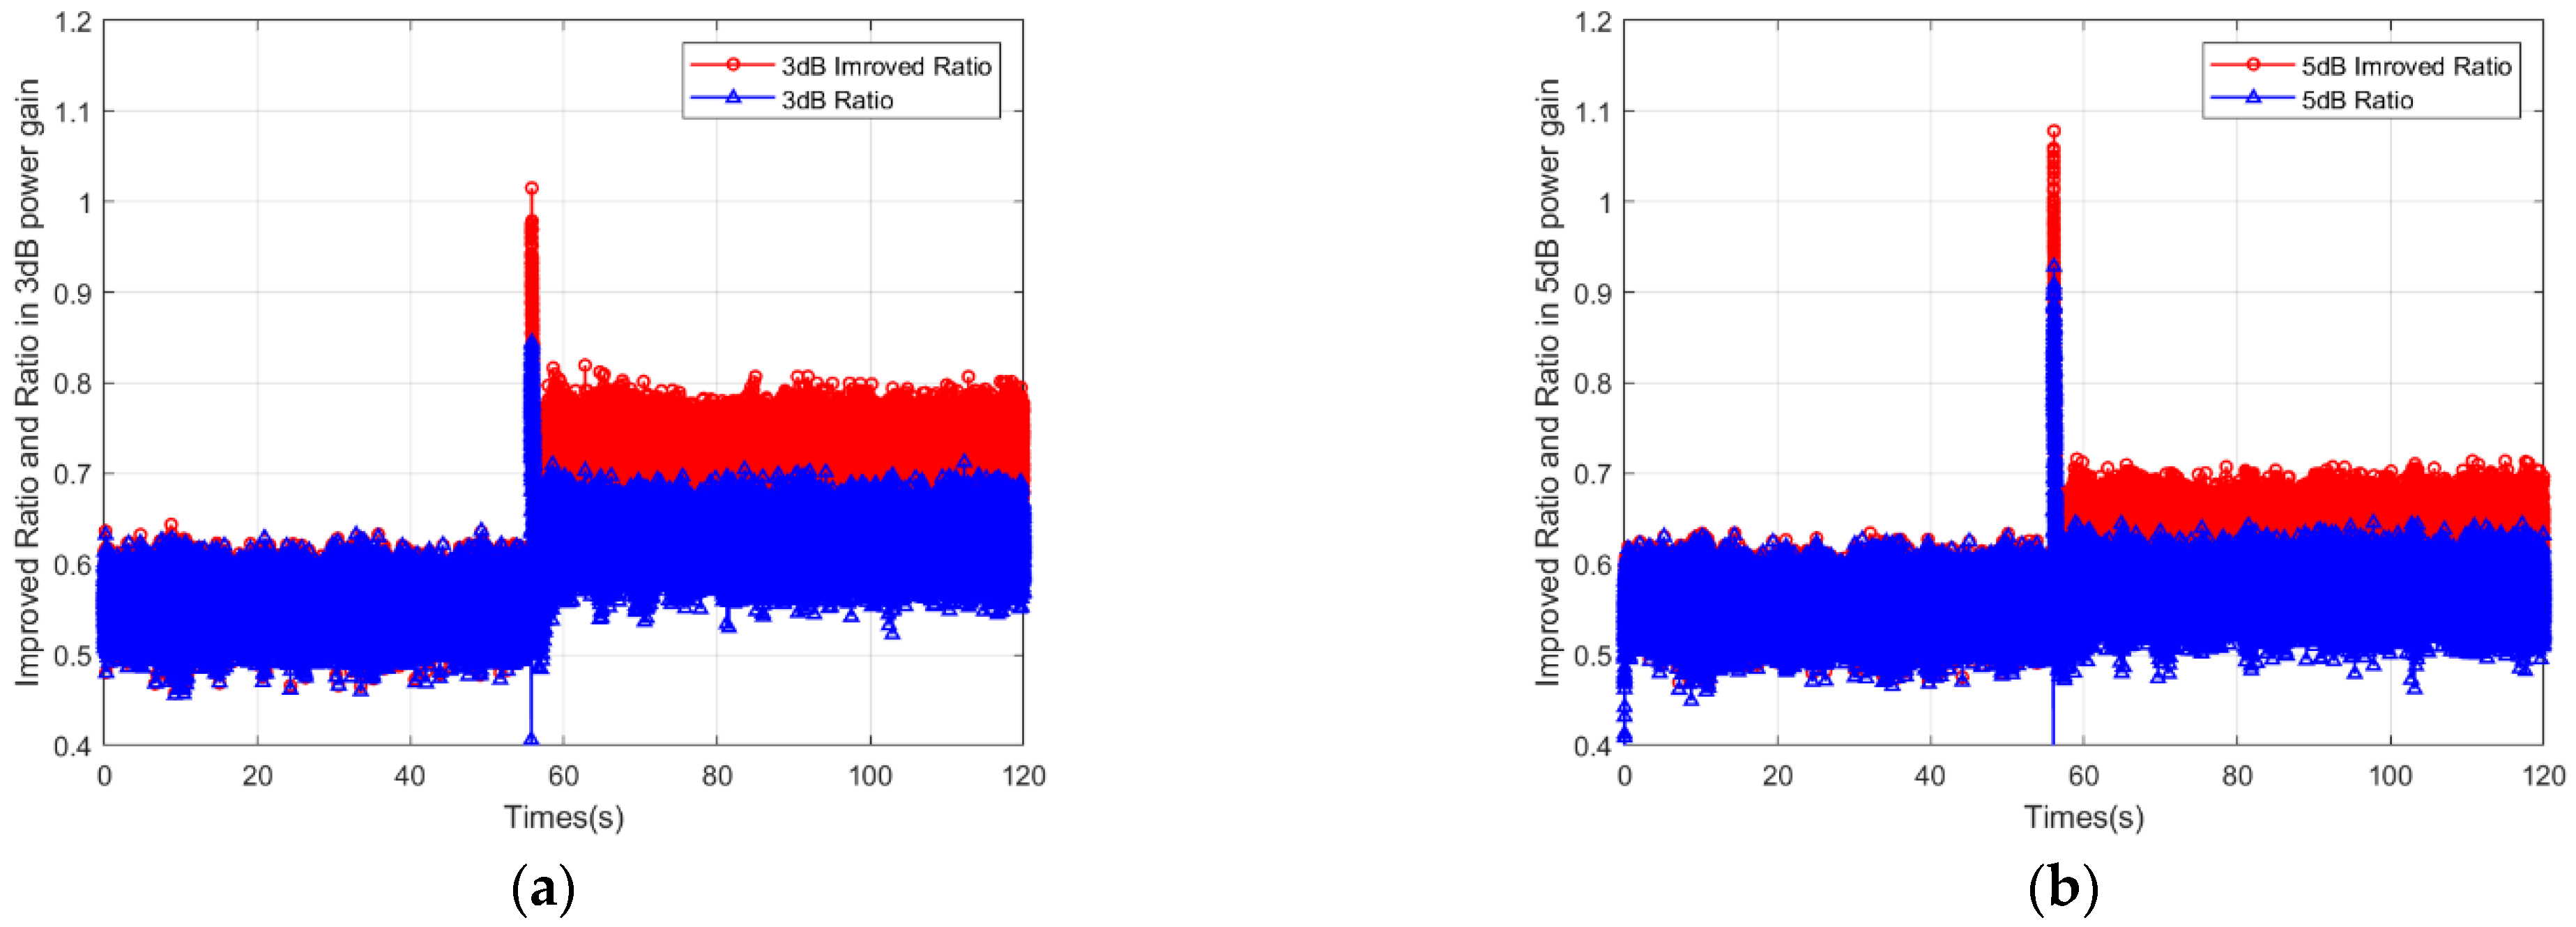
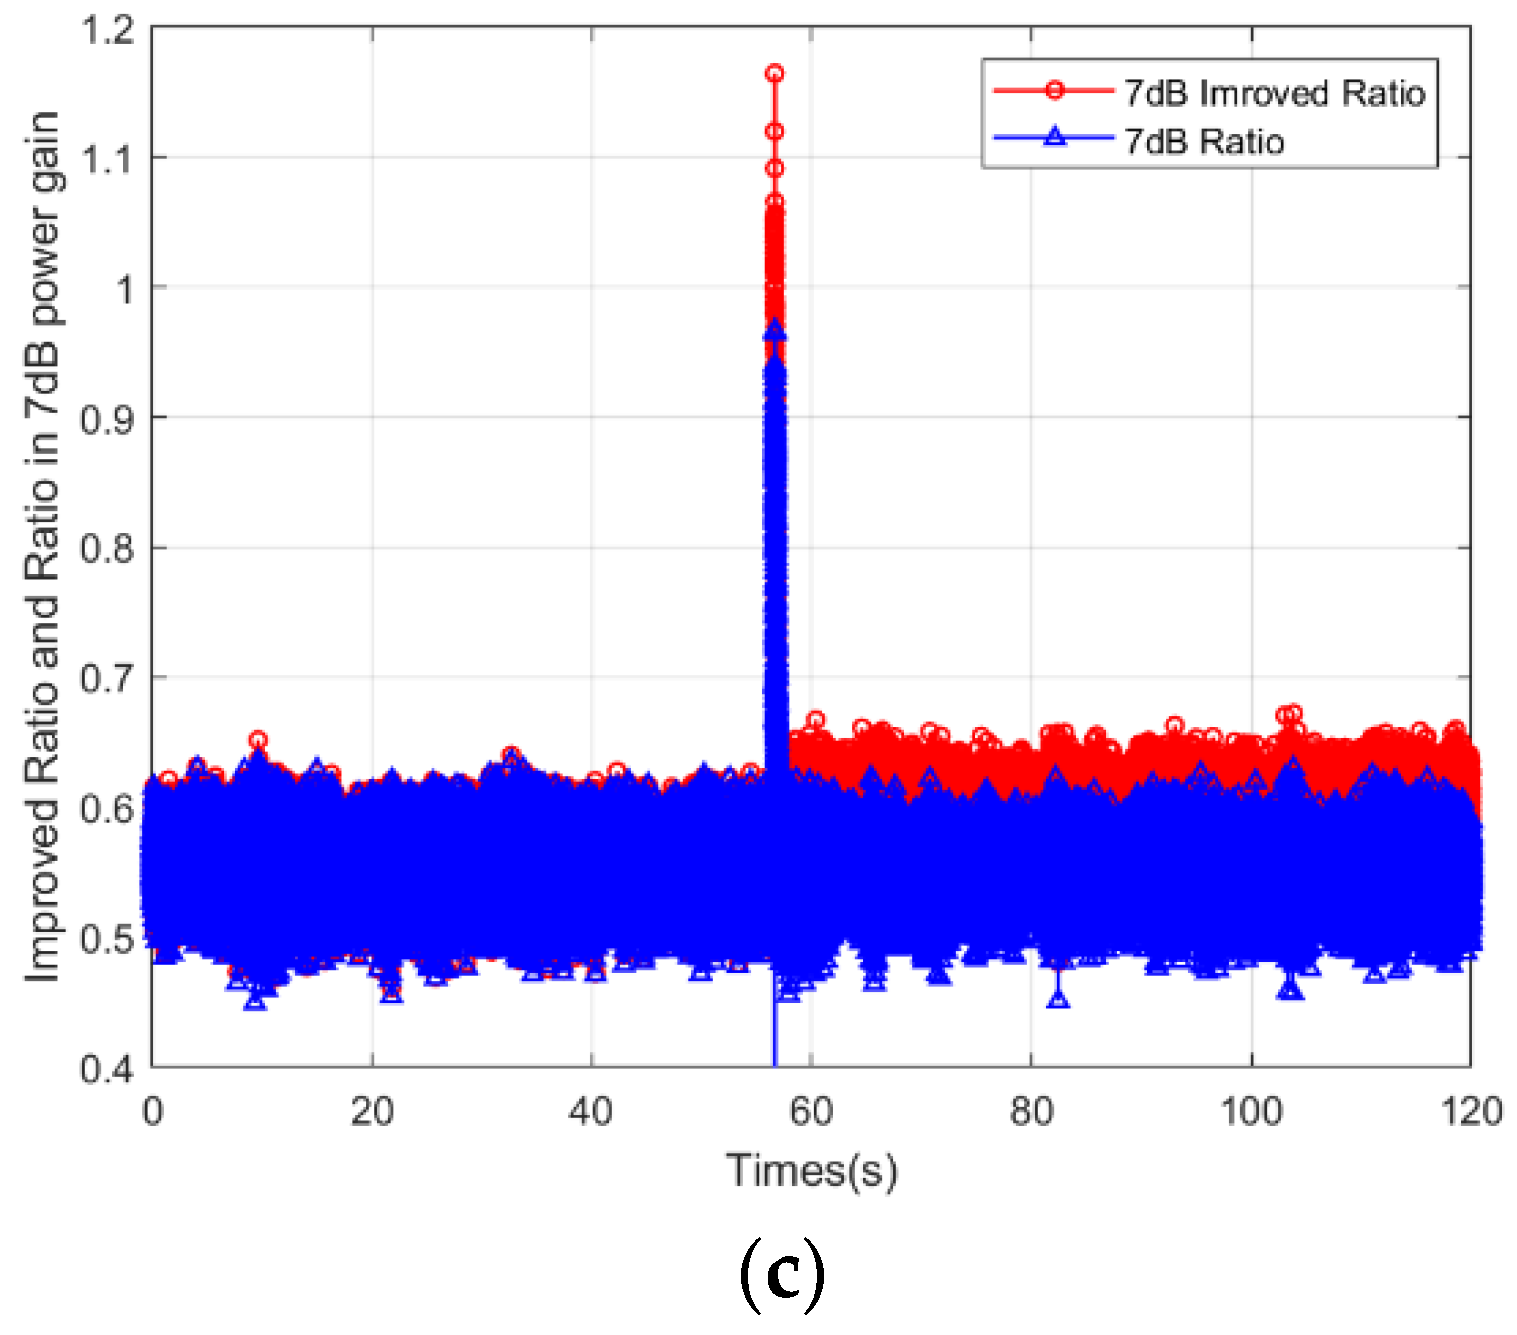
4.2.3. The Effectiveness of Improved Ratio
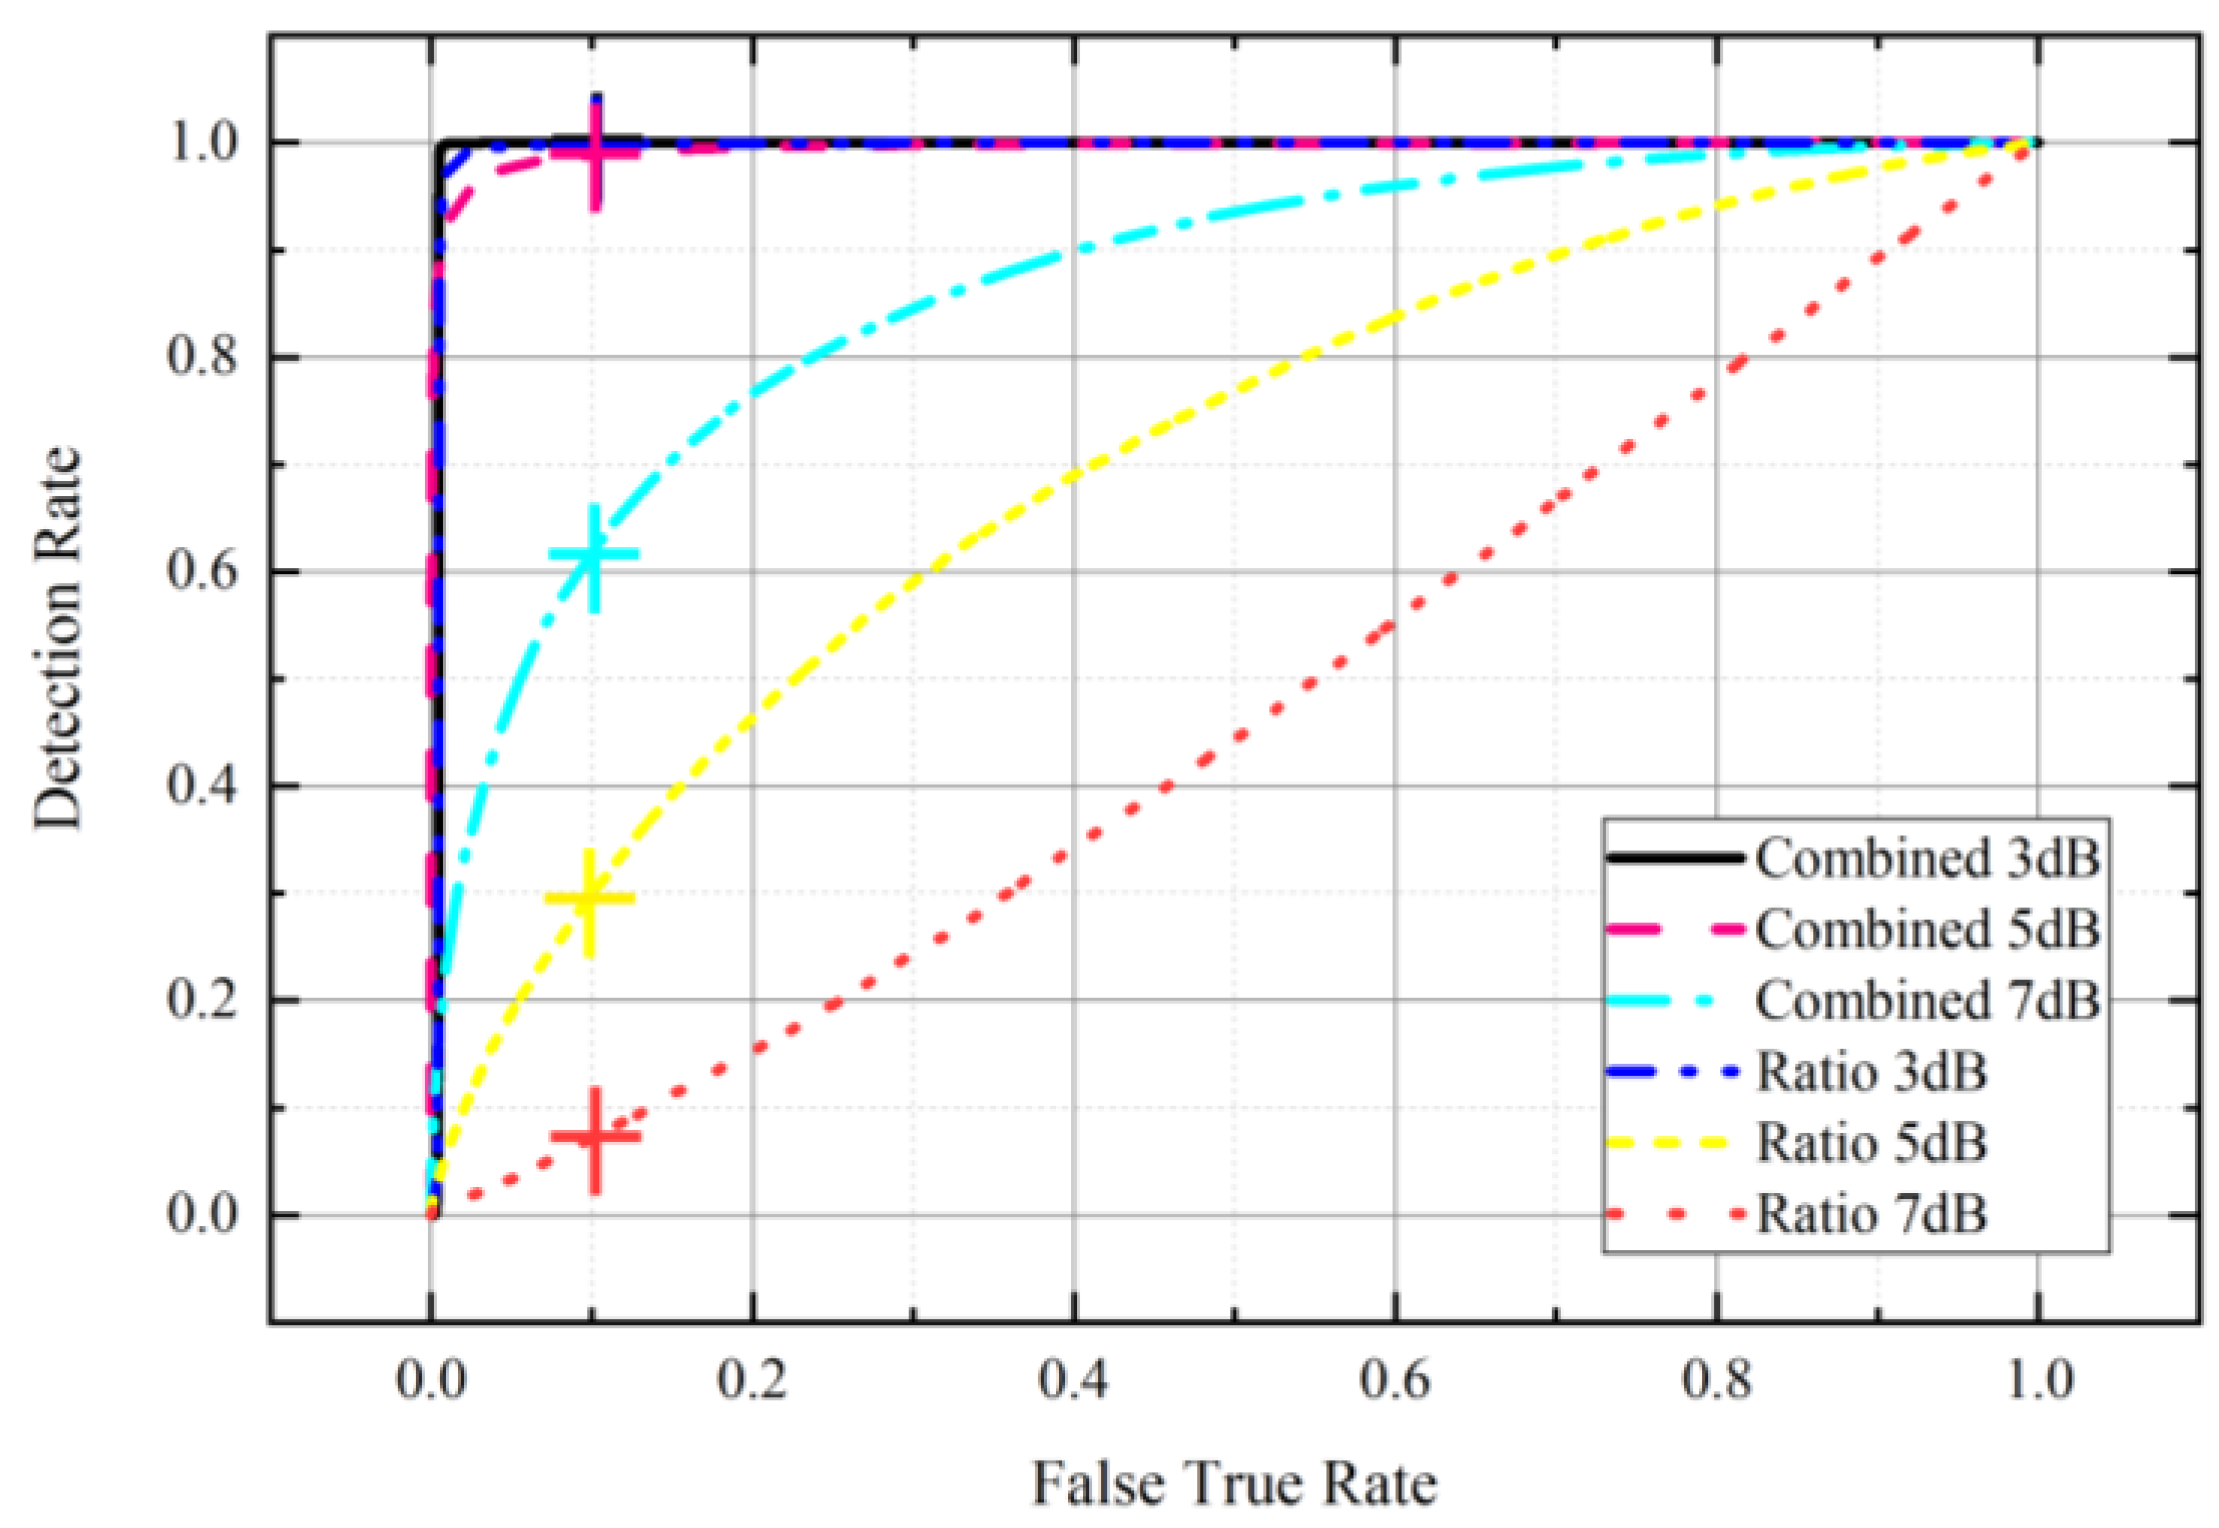
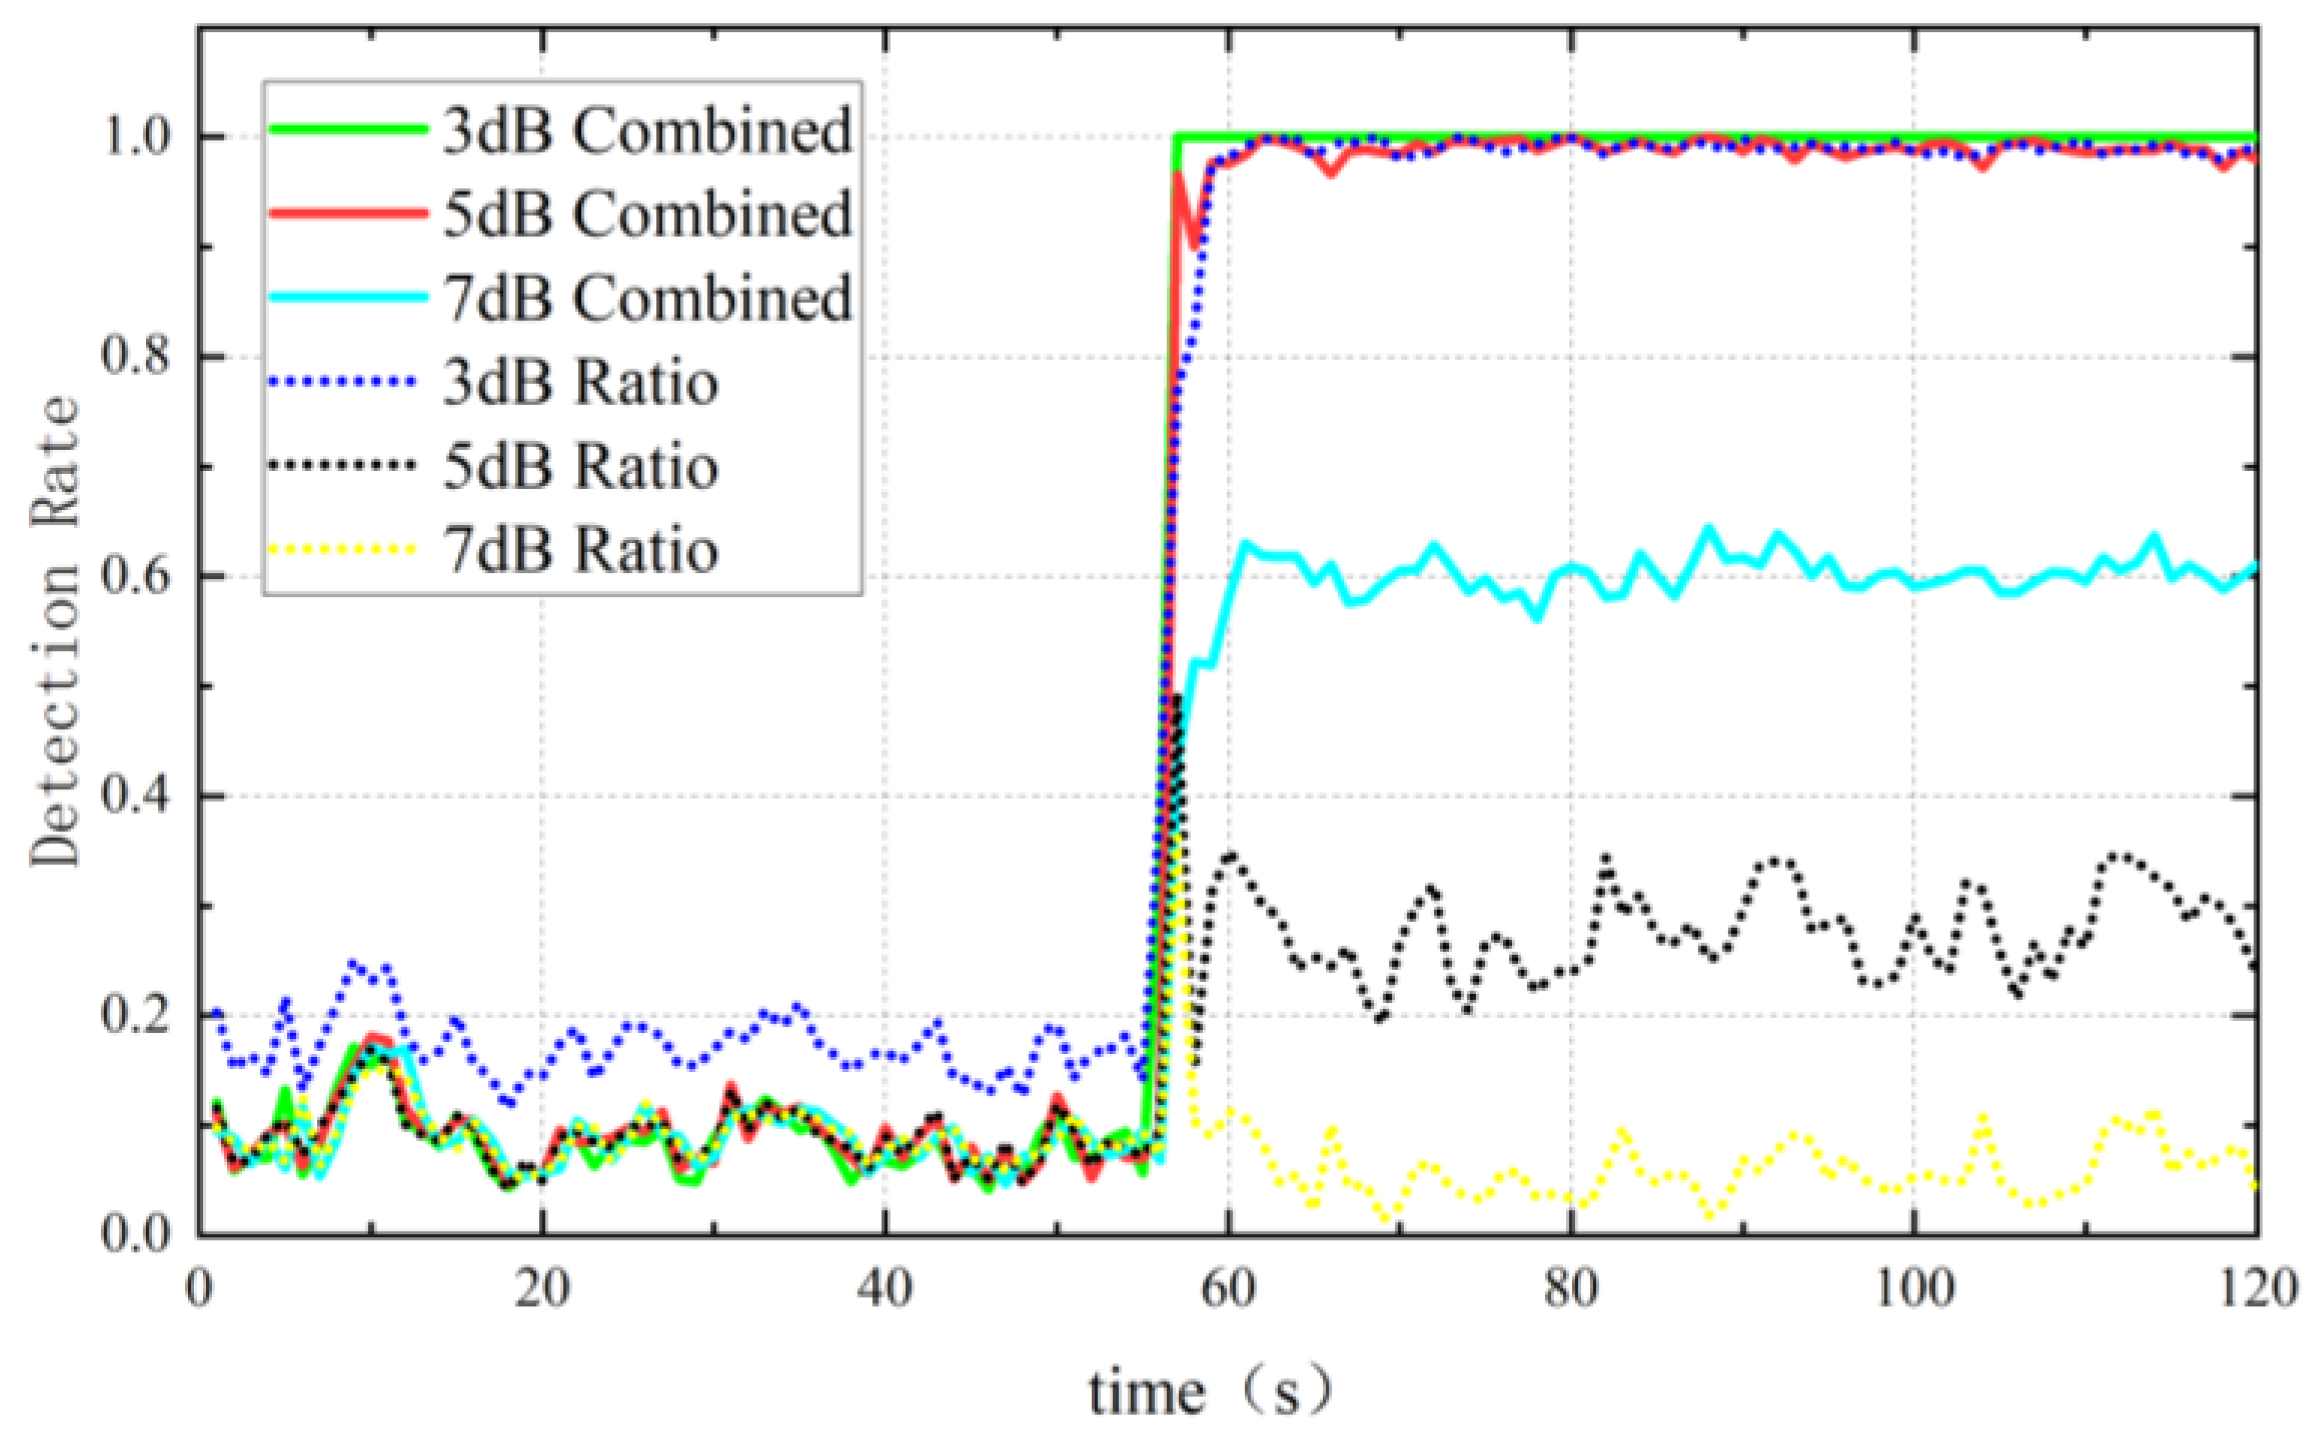
4.2.4. Analysis of Combined Method and SQM Detection with the Ratio Metric
5. Conclusions
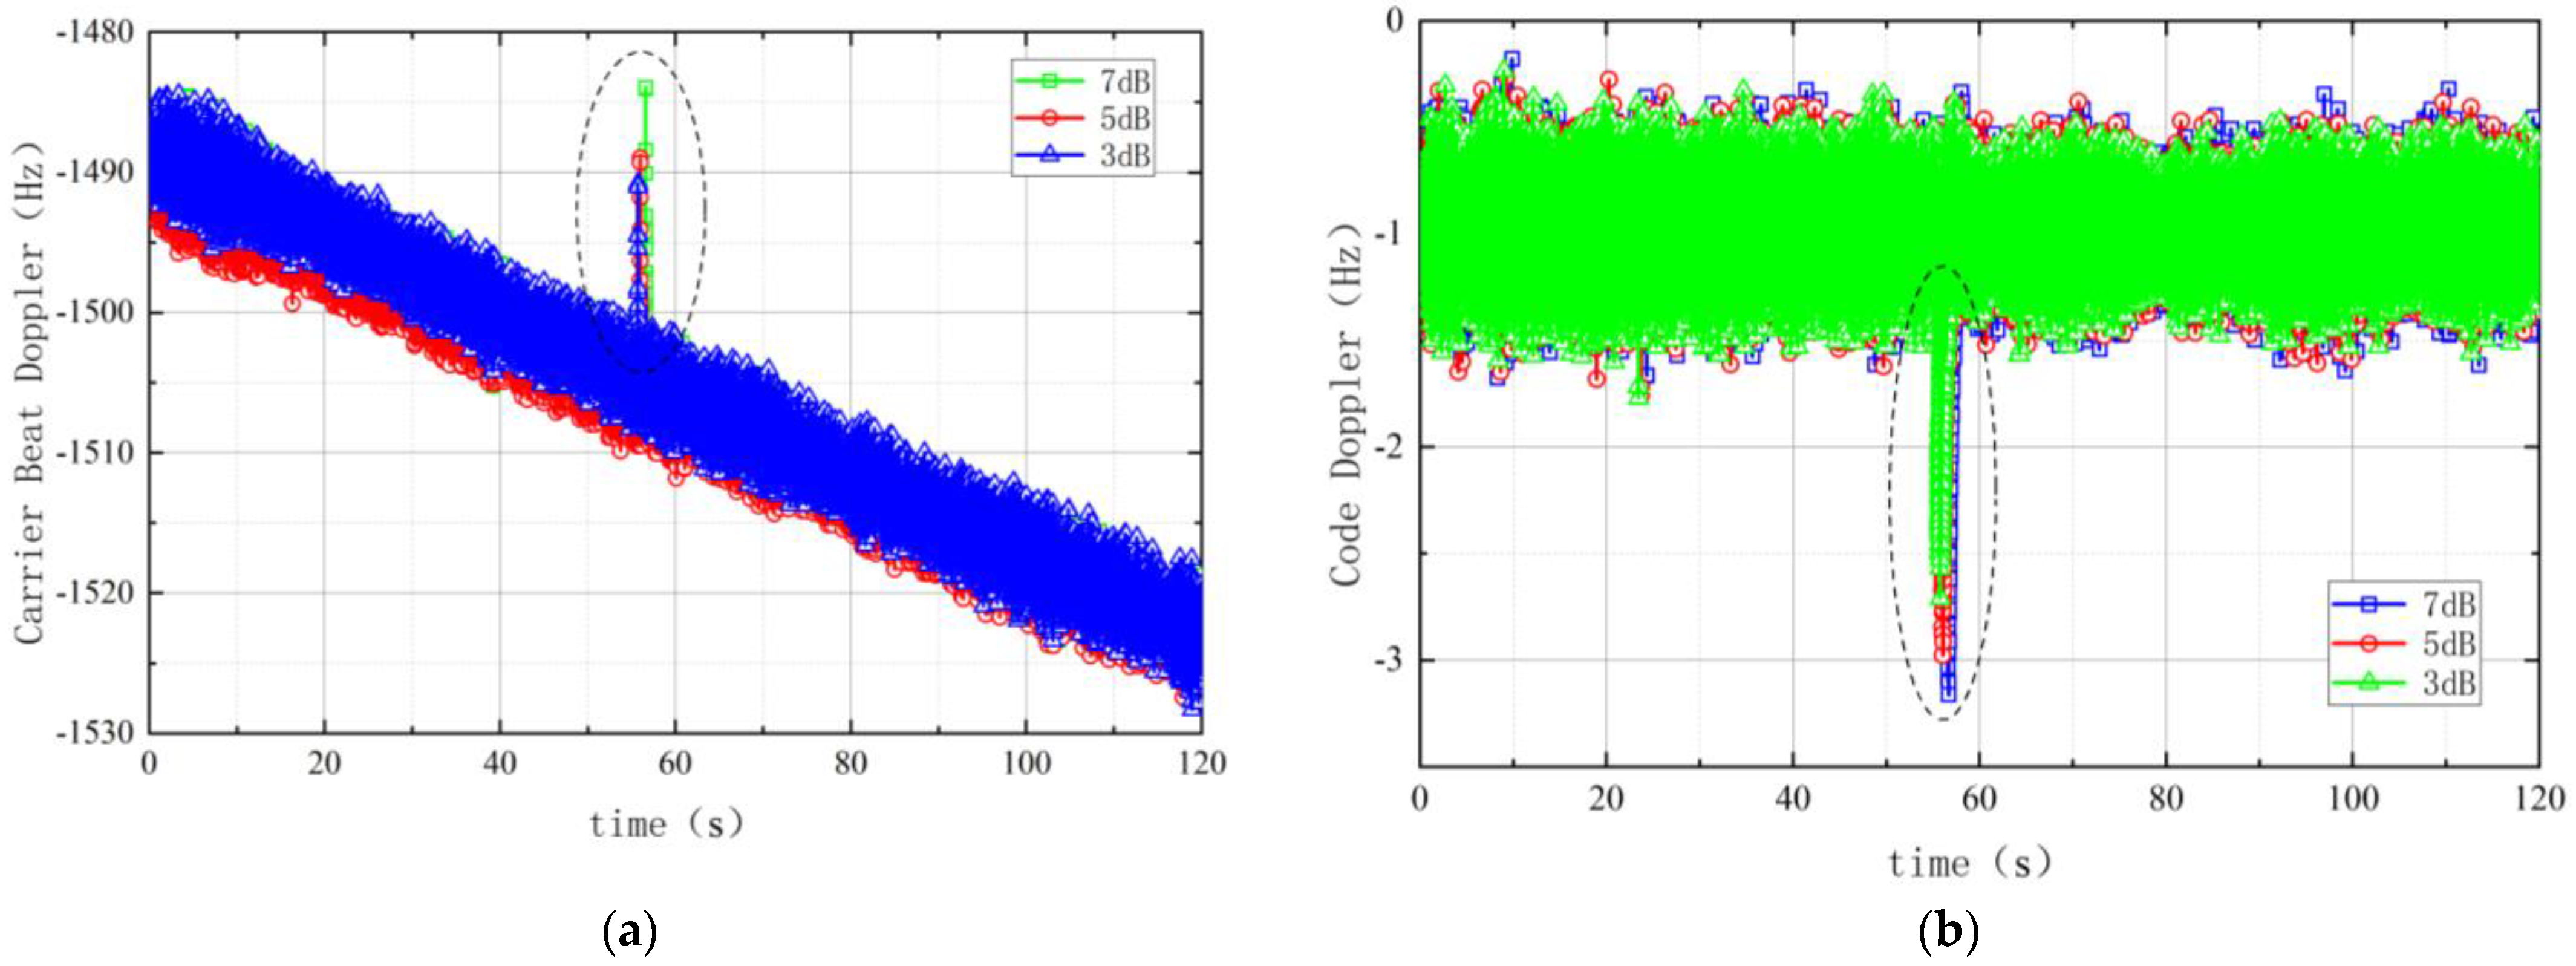
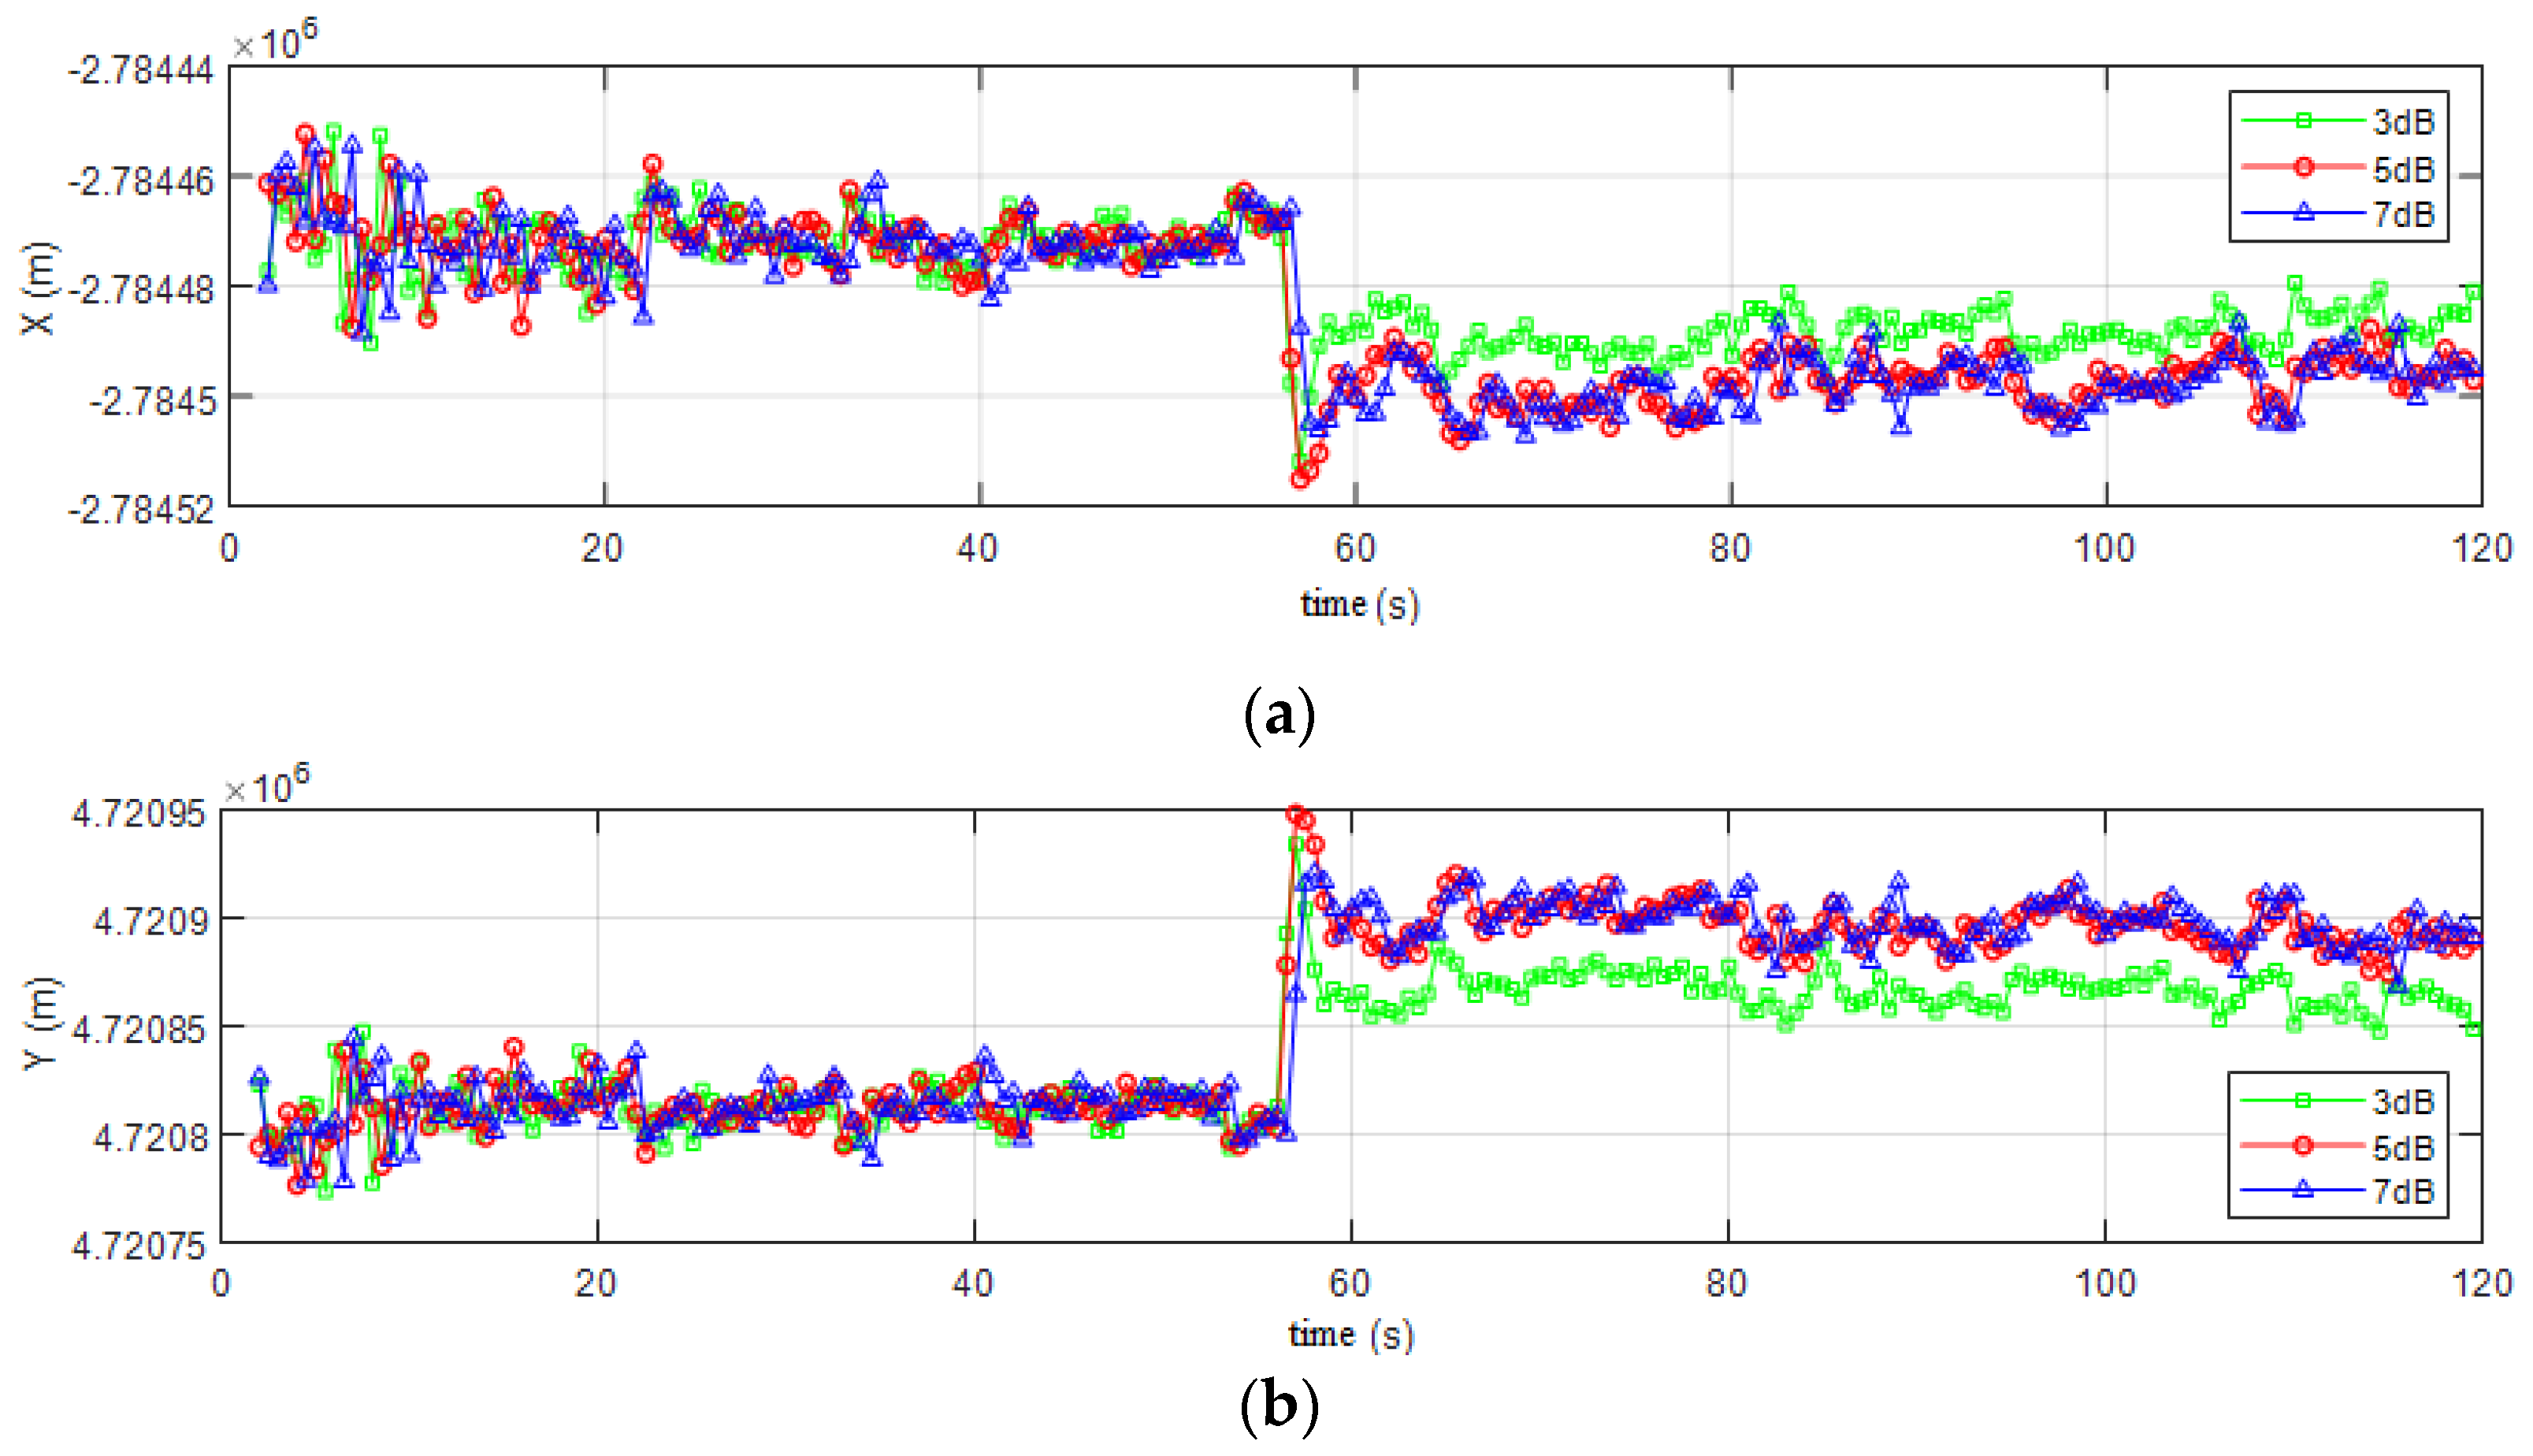
- The has better performance than the in triggering the successive spoofing detection.
- The Combined Method of Improved Ratio and outperforms the Ratio a lot under the same spoofing power. For instance, the Combined one reaches 98% under 5 dB power gain, whereas the Ratio reaches only about 30%.
Author Contributions
Funding
Data Availability Statement
Acknowledgments
Conflicts of Interest
References
- Liu, P.; Chen, S.; Ren, C.; Liu, S. Research and Analysis of Anti-Spoofing Technology for Satellite Navigation. Navig. Position. Timing 2020, 7, 123–130. [Google Scholar]
- Psiaki, M.L.; Humphreys, T.E. GNSS spoofing and detection. Proc. IEEE 2016, 104, 1258–1270. [Google Scholar] [CrossRef]
- Rawnsley, A. Iran’s Alleged Drone Hack: Tough, but Possible. Available online: http://www.wired.com/dangerroom/2011/12/iran-drone-hack-gps (accessed on 15 September 2020).
- Kerns, A.J.; Shepard, D.P.; Bhatti, J.A.; Humphreys, T.E. Unmanned aircraft capture and control via GPS spoofing. J. Field Robot. 2014, 31, 617–636. [Google Scholar] [CrossRef]
- Fu, N.; Fan, J.; Yang, F.; Xu, D. Study of anti–Jamming technology of GNSS timing receiver in electric power system. Radio Eng. 2020, 50, 81–84. [Google Scholar]
- Mosavi, M.R.; Baziar, A.R.; Moazedi, M. De-noising and spoofing extraction from position solution using wavelet transform on stationary single-frequency GPS receiver in immediate detection condition. J. Appl. Res. Technol. 2017, 15, 402–411. [Google Scholar] [CrossRef]
- Chen, J.; Chen, S.; Liu, P. Analysis of GNSS repeater deception jamming signal effect on the receiver. In Proceedings of the 9th China Satellite Navigation Academic Annual Conference-S03 Satellite Navigation Signal and Anti-jamming Technology, Harbin, China, 23 May 2018; pp. 74–78. [Google Scholar]
- Takujiebinuma. Software-Defined GPS Signal Simulator. Available online: https://github.com/osqzss/gps-sdr-sim (accessed on 17 September 2020).
- Shi, P.L.; Wang, X.Y.; Xue, R. Research on power control strategy of GNSS repeater deception jamming. Mod. Navig. 2021, 4, 79–89. [Google Scholar]
- Shi, P.; Jin, W.; Wu, S. Research on satellite selection algorithm of GNSS repeater deception jamming. Trans. Beijing Inst. Technol. 2019, 39, 524–531. [Google Scholar]
- Chen, J.; Chen, S.; Wu, H.; He, R. Cross correlation noise model of multiple GNSS spoofing signals. Appl. Res. Comput. 2019, 36, 2488–2491. [Google Scholar]
- Zhang, Q. Research on Anti-deception Jamming Technology of GNSS Navigation Signal Based on Residual Ssignal Detection. Master’s Thesis, University of Electronic Science and Technology of China, Chengdu, China, 2020. [Google Scholar]
- Broumandan, A.; Jafarnia-Jahromi, A.; Lachapelle, G.; Ioannides, R.T. An approach to discriminate GNSS spoofing from multipath fading. In Proceedings of the 2016 8th ESA Workshop on Satellite Navigation Technologies and European Workshop on GNSS Signals and Signal Processing (NAVITEC), Noordwijk, The Netherlands, 14–16 December 2016; pp. 1–10. [Google Scholar]
- Gong, J. Single antenna GNSS spoofing detection based on moving variance of SQM. Master’s Thesis, Civil Aviation University of China, Tianjin, China, 2020. [Google Scholar]
- He, H. Research on Anti-spoofing for Satellite Navigation Based on Array. Master’s Thesis, Harbin Engineering University, Harbin, China, 2019. [Google Scholar]
- Daneshmand, S.; Jafarnia-Jahromi, A.; Broumandan, A.; Lachapelle, G. A GNSS structural interference mitigation technique using antenna array processing. In Proceedings of the 2014 IEEE 8th Sensor Array and Multichannel Signal Processing Workshop (SAM), A Coruna, Spain, 22–25 June 2014; pp. 109–112. [Google Scholar]
- Wu, Z.; Wu, W.; Liu, K.; Tang, K. Research on Algorithm of Gradually Induced Spoofing Detection Based on Tightly Coupled INS/GNSS Integration. Navig. Position. Timing 2019, 6, 7–13. [Google Scholar]
- Liu, Y.; Li, S.; Fu, Q.; Zhou, Q. Chip-scale atomic clock aided INS/GNSS integrated navigation system spoofing detection method. J. Chin. Inert. Technol. 2019, 27, 654–660. [Google Scholar]
- Guo, J.; Sun, J.; Li, D. Analysis and design of a new GNSS encryption authentication scheme. Telecom World 2020, 27, 125–126. [Google Scholar]
- Zhao, W.; Tang, B.; Peng, A.; Meng, F. Global navigation satellite system spoofing detection based on time variant pattern of multipath signal power. J. Xiamen Univ. 2020, 59, 972–978. [Google Scholar]
- Shen, C.; Guo, C. Simulation of Spoofing Signal Detection in GNSS. Comput. Simul. 2019, 36, 109–113+119. [Google Scholar]
- Jahromi, A.J.; Broumandan, A.; Nielsen, J.; Lachapelle, G. GPS spoofer countermeasure effectiveness based on signal strength, noise power, and C/N0 measurements. Int. J. Satell. Commun. Netw. 2012, 30, 181–191. [Google Scholar] [CrossRef]
- Manfredini, E.G.; Dovis, F.; Motella, B. Validation of a signal quality monitoring technique over a set of spoofed scenarios. In Proceedings of the 2014 7th ESA Workshop on Satellite Navigation Technologies and European Workshop on GNSS Signals and Signal Processing (NAVITEC), Noordwijk, The Netherlands, 3–5 December 2014; pp. 1–7. [Google Scholar]


| Simulated Signals | Center Frequency | Signal Delay | Signal Power |
|---|---|---|---|
| original signal | GPS L1 (1575.42 MHz) | 0 ns | −130 dBm |
| meaconing signal 1 | GPS L1 (1575.42 MHz) | 500 ns | −127 dBm |
| meaconing signal 2 | GPS L1 (1575.42 MHz) | 500 ns | −125 dBm |
| meaconing signal 3 | GPS L1 (1575.42 MHz) | 500 ns | −122 dBm |
Publisher’s Note: MDPI stays neutral with regard to jurisdictional claims in published maps and institutional affiliations. |
© 2022 by the authors. Licensee MDPI, Basel, Switzerland. This article is an open access article distributed under the terms and conditions of the Creative Commons Attribution (CC BY) license (https://creativecommons.org/licenses/by/4.0/).
Share and Cite
Zhu, X.; Lu, Z.; Hua, T.; Yang, F.; Tu, G.; Chen, X. A Novel GPS Meaconing Spoofing Detection Technique Based on Improved Ratio Combined with Carrier-to-Noise Moving Variance. Electronics 2022, 11, 738. https://doi.org/10.3390/electronics11050738
Zhu X, Lu Z, Hua T, Yang F, Tu G, Chen X. A Novel GPS Meaconing Spoofing Detection Technique Based on Improved Ratio Combined with Carrier-to-Noise Moving Variance. Electronics. 2022; 11(5):738. https://doi.org/10.3390/electronics11050738
Chicago/Turabian StyleZhu, Xuefen, Zhengpeng Lu, Teng Hua, Fan Yang, Gangyi Tu, and Xiyuan Chen. 2022. "A Novel GPS Meaconing Spoofing Detection Technique Based on Improved Ratio Combined with Carrier-to-Noise Moving Variance" Electronics 11, no. 5: 738. https://doi.org/10.3390/electronics11050738
APA StyleZhu, X., Lu, Z., Hua, T., Yang, F., Tu, G., & Chen, X. (2022). A Novel GPS Meaconing Spoofing Detection Technique Based on Improved Ratio Combined with Carrier-to-Noise Moving Variance. Electronics, 11(5), 738. https://doi.org/10.3390/electronics11050738