1. Introduction
Fake news is part of feedback, opinions, and news, and this information is greatly increasing with each minute on social network platforms, such as Facebook, Instagram, and Twitter [
1]. In the last decade, social networks worked like a pipeline for many researchers, especially for text mining [
2]. One of the challenging topics nowadays is the textual data related to the Coronavirus (COVID-19) based on the education sector. This study investigates the subjective nature of this textual data by employing specialists that can assess E-learning-related textual data, to determine attitudes, sentiment, and fake news about COVID-19 [
3]. In today‘s challenging times, there is a dire need to analyze comments and people’s attitudes based on textual data on those platforms. The global education system was impacted by the COVID-19 pandemic, which resulted in the suspension of traditional educational activities. Moreover, conversion of such huge textual unstructured data into structured data and extracting useful knowledge from such data is also a complex task [
4]. This study has proposed an approach that overcomes this limitation, leading to promising results that were achieved based on the devised experiments.
Transforming unstructured textual data related to the education sector to a structured one is a way to examine the attitudes and sentiments towards COVID-19, based on people’s opinions and views. Some pre-processing steps to get the structured textual data are text cleaning, text transformation, and dimension reduction for the selection of meaningful and relevant text. The evaluation quality is the main measure for testing the accuracy of this structured data, with the main objective of examining the fake news of COVID-19. Therefore, evaluation of this data has an important role in determining the effect of the domain of education and providing better feedback for educational institutions to enhance the quality of their services [
5].
Based on related works, many studies have focused on the COVID-19 topic, [
6] testing the Twitter dataset to increase the community awareness of the COVID-19 epidemic. A study conducted by [
7] examined the government, organizations, and individuals’ viewpoints on Twitter during the pandemic. The authors in [
8] tested Twitter for European countries as a cross-language platform during the lockdown. The study in [
9] examined the social network data for guidance by tracking the effect of “life”-related terms on Twitter. In the light of the above, earlier works have numerous limitations; for instance, most of the research focused on testing the community awareness, viewpoints, and lifestyle, but did not lead us to suggest a novel method to extract useful applicable knowledge and salient information from huge social networks’ textual data. Using huge available online data demands new approaches to process vast information to extract the most vital and relevant information, and to obtain fast and efficient information. A year of data collection will help us to get not just a larger picture of the public debate and concerns over COVID-19 for E-learning, but identify significant shifts in main topics and sentiment during the duration of the epidemic. However, several challenges arise when moving from conventional learning methods to online teaching techniques. The E-learning boundary’s high devices and equipment cost and infrastructure for communication technology availability are limitations, as well as teachers’ and students’ technical knowledge being limited, and for profitable and effective online education, a cultural shift is required [
10].
In this study, our approach is based on the idea of “deep learning” for the classification of the text into five classes, such as very positive, positive, neutral, negative, and very negative. A fusion of multi-level features helps us evaluate data on the attitudes and sentiment towards COVID-19 that can be tracked almost immediately, by classifying the textual data into those five classes. Our TSA (Text Sentiment Analysis) approach includes multi-level features, such as phrase frequency, sentence score, sentiment shifter rules, sentiment knowledge, medical concept, word and sentence embedding, linguistic, and statistical knowledge. This study has used these nine features as input to our suggested model. It is pertinent to mention here that these features have not been fully examined with SA in the COVID-19 textual data before. The fusion of these sets of features will overcome the following issues: (i) limit the lexicon to a coverage list of words; (ii) adopt a vector space model for converting each sentence or word to a vector and then get vector representation in a low-dimensional space; (iii) word embedding has a problem with word senses, which implies that this model cannot distinguish synonyms for a word and only provides a single word form representation; (iv) the most difficult task is the context polarity within SA, related to SA of the context, where the previous word polarity changes concerning contexts; (v) the lexicon lacks specific fields in COVID-19; (vi) this research will focus on the subjective corpus and SA issues that deal with COVID-19, for instance, data with a large feature set, polarity shift, data sparsity, the lexicon of a specific domain, multi-classification, and accuracy. The word embedding model also faces important issues, such as disregarding the polarity of sentiment words.
The contributions of our suggested approach can be briefed as follows:
This study applied a denoising AutoEncoder and used a combination of an AutoEncoder with an attention mechanism for extracting the features of textual data and for extracting more precise features redisplaying the original information.
This research proposed a novel cross-feature fuse method that relies on the attention technique, which can efficiently fuse the features of various levels and afford more efficient and precise data for sentiment classifier tasks.
This study used multi-strategies, such as Weighted-Support Vector Machine (W-SVM), Chi-Squared Statistics (CSS), Weighted-Principal Component Analysis (W-PCA), and Value Average Weights (VAW), which help us produce the specific lexicon domain.
The deep learning-based model with unified features set has been adopted as a multi-classification model by using multi-level features with a COVID-19 dataset that can help us evaluate the attitudes, sentiment, and fake news towards COVID-19, especially when examining parents’, students’, and teachers’ (as of opinion) effect on the education sector.
This research is organized as follows: the next section summarizes the recent related works.
Section 3 presents our suggested approach in detail.
Section 4 explains our experimental results. Lastly, we give the conclusion and ideas for future works.
2. Related Work
2.1. Text Sentiment Analysis
TSA-related traditional approaches can be divided into three categories, which are hybrid approaches, lexicon, and machine learning. TSA is one of the dynamic research areas related to NLP, used to identify the orientation of a given set of documents, for instance, very positive, positive, neutral, negative, and very negative categorization. The modern TSA-related works are divided into three groups: aspect-based, sentence-based, and document-based.
The study proposed by [
11] examines sentiment analysis of tweets to have a clearer understanding of people’s opinions or sentiments about E-learning during the pandemic. The research conducted experiments applying RF (Random Forest), NB (Naïve Bayes), and KNN (K-Nearest Neighbour). Due to its capacity to function effectively with high-dimensional data, like text categorization, the multi-class classification with the RF (Random Forest) approach has the greatest accuracy of the classification task. Shakhovska et al. [
12] proposed a hybrid machine learning based-method, which combined rule-based algorithms, Support Vector Machine, XGBoost, and logistic regression. The Ukrainian language was used for their work and they collected 32,007 pieces of feedback from Google Maps and divided the dataset into testing (20%) and training (80%). One of the drawbacks was that they only used the TF-IDF (Term Frequency Inverse Document Frequency) feature, resulting in an accuracy of 0.88. Cagliero et al. [
13] developed a method based on the Latent-space model on a sentence-level dataset, related to hotel reviews consisting of 200,000 reviews. They adopted the Google word representation model for transferring the list of words from high to low dimensions, called BERT (Bidirectional Encoder Representations from Transformers) pre-trained language embeddings model. They applied a clustering K-means algorithm based on cosine distance, using K = 8, based on the cities, to classify the reviews into cities. The studies related to TSA are used by many machine learning methods, such as Naïve Bayes (NB) [
14], Support Vector Machine (SVM) [
15], Logistic Regression Algorithm (LRA) [
16], and Maximum Entropy (ME) [
17]. However, all these approaches suffer from high, large unstructured textual datasets, with a varying and large number of terms (textual) [
18]. There are some approaches applied based on a set of features, such as Part of Speech (POS), unigrams, bigrams, statistical methods, words, and sentence embedding [
19]. Recently, researchers have focused more on techniques using word embeddings in Deep Learning models [
20]. Doc2Vec and Word2Vec were applied in [
21] for the sentiment analysis task related to medical records. The authors of the study also used the Welsh statistic of the WordNet for the evaluation of unsupervised models for the medical domain. Atodiresei et al. [
22] proposed a method to classify fake news and users based on Twitter by applying text sentiment analysis, emoji, entity, and hashtag recognition. Rustam et al. [
23] investigated COVID-19 tweets based on sentiment analysis, applying lexicon-based techniques and machine learning. TextBlob was used to annotate the data that was collected from Twitter, and for machine learning methods, TF-IDF and BoW (Bag of Word) features were employed. The ETC (Extra Trees Classifier) models perform best with Textblob and BoW features, according to the results.
2.2. Deep Learning Methods
One of the newest areas of machine learning is “deep learning”, which is implanted using layers of neural networks stacked together, which are considered to be working like a human brain processing model. These hidden layers contain several nodes for each layer, starting from the input layer and ending at the output layer, with all layers including the hidden layers joined in a feedforward manner. A back-propagation algorithm is used in training those neural network layers so that parameters of the layers get tuned after successive iterations. These neural network-inspired deep learning models are used in sentiment analysis so that a better representation can be learned on the textual data, using selected features [
24]. Deep learning models have gained important attention in different SA-related NLP tasks and several TSA models have been suggested based on deep learning techniques [
25,
26].
In the study of [
27], BERT was proposed to predict the ICD (International Classification of Diseases) codes, resulting in an F1 value of 0.68. Named Entity Recognition (NER) was modeled using the bidirectional LSTM-RNN [
28] model and a transfer learning technique was used for the limited availability of labeled data for Chinese medical records.
Two famous techniques in deep learning, called Recurrent Neural Network (RNN) and Convolutional Neural Network (CNN), have gained considerable attention related to NLP tasks [
29]. RNN is applied for sequential data models in a wide range of applications. RNN’s approaches are used for sentiment classification by representing a full sentence of words embedding model. A variant of RNN, known as Long Short-Term Memory (LSTM), is more suitable for handling the sequencing problems, and has a considerable improvement in results compared to basic RNN, especially when applied for TSA where long term dependency is more common and problems of vanishing and exploding gradients could hamper the training of RNN models [
30].
On the other hand, CNN is used mainly in image processing, computer vision, and text processing [
31]. The architecture of CNN consists of a numerical input that converts the textual terms to a vector that is passed from the input layer to a fully connected layer, where various filters to recognize the patterns based on the number of kernel sizes are used. The pooling layer is used later to choose to minimize the number of parameters in the layers [
32]. Deepak et al. [
33] developed a deep learning based-approach, with LSTM and a Feed-Forward Neural Network (FNN), in combination with various vector representations of the word. The suggested approach mostly concentrates on gathering data from the news article that relies on the title and content.
2.3. Twitter Dataset Evaluation
Twitter is now a very active and challangineg dataset, as the number of tweets that are posted on Twitter is increasing at a staggering rate; for example, based on later statistics, there are around 300 billion tweets. The most complex networks contain nodes that are mutually interconnected to a larger extent than they are connected to the rest of the network. These numerous amounts of textual information are generated by users and so the extraction of useful information from this huge online text data is gaining attention in the NLP community. Recently, studies have evaluated producers’ quality based on people’s opinions on social media [
34]. Some studies focused on COVID-19, based textually on SA related to people’s lifestyle [
8,
35]. Additionally, the researchers in [
36] suggested a semi-supervised learning model for capturing fake applications on Twitter, applying confident valuable features.
Sharif et al. [
37] applied deep learning and machine techniques, which contained CNN-BiLSTM, BiLSTM, CCN, and SVM methods, with the Word2Vec embedding and TF-IDF approaches. Furthermore, Sharma et al. [
38] suggested a sentiment model that categorizes fake news or wrong information on Twitter related to COVID-19. They captured misleading and unreliable content that relied on checking the websites and examined the misinformation in tweets. Furthermore, the work in [
39] proposed a text-based method to detect fake news by applying a two-layer classification. The first one was applied to identify the fake topic and the second one was applied to identify the fake event. Similarly, Nyow et al. [
40] proposed an approach to determine the most significant features that affected the machine learning approaches’ performance when applied for the fake news classification and used this information to recognize real and fake tweets. However, the research stated above did not use an evolutionary classification approach to illustrate the most important features of the COVID-19 fake news data. Our proposed method goal is to fuse and/or reduce the number of features and attain better accuracy.
Most recently, with the growing computational power and the possibility to connect with huge text corpora, bottom-up methods applying machine learning or text-mining allow for “deeper” and more complex analyses of communication structures on social media, and such text can then be used to assess, for example, a certain text’s narrative coherence, its cognitive complexity, or determine its synchronicity, similarity or “match” with other texts [
41].
Deep learning can efficiently achieve non-explicit and nonlinear user–item relations and, furthermore, extracts complex relations between data from available data sources, such as visual, textual, and background information. The challenge with the Twitter dataset is that it is difficult to obtain good estimation. The most complex networks contain nodes that are mutually interconnected to a larger extent than they are connected to the rest of the network; therefore, there is a pressing need for societies to understand data distributed in complex networks to, between other considerations, make predictions about their behavior. While neural networks have the flexibility to handle a larger number of inputs, this research only considered fake news and misinformation related to COVID-19 tweets. Developing more complex networks with more hidden layers, more inputs, and various networks’ parameters, to enhance neural networks’ performance, warrants further investigation, which leads to learning more useful and complex representations in neural networks. The main goal of this work is to predict fake news and misinformation for the education sector during various periods of the year [
42,
43].
2.4. Topic Modeling
The method that can help to organize a huge amount of collected documents by categorizing these documents into different themes is called Topic Modeling (TM). TM is sometimes referred to as a possibility of clustering, but TM is more robust and usually affords more realistic outcomes than a clustering algorithm like k-means. The clustering algorithm assumes a distance between subjects is measured, and each document is assigned a topic, whereas TM allocates a document to a set of topics, with varying weights or probability, without making any assumptions about the distance between topics. Several TMs are available, of which the most extensively applied is the latent Dirichlet allocation (LDA) model [
44]. In order to extract common topics from such a massive number of tweets, we adopted the LDA algorithm for the TM task.
Understanding the nature of humanity is required for analyzing and modeling social networks as neural networks. If we built our understanding of neural networks based on connected relations and nodes only, then we may end up having no network from a human standpoint. Two factors need to be observed very carefully: (1) individuals have natural needs to receive the information or to be its source, (2) individuals are the information sources. the first point leads to the fact that each person in a network has attributes and those attributes can make changes to, or can be changed by, the social environment. The second point confirms that the flow of information is what produces complex networks, or what we call a “living network” [
43,
45].
The main goal of this research is identifying the themes and sentiments of COVID-19 related to the education sector, which relies on the complexity of social networks’ discussion and discerns the salient changes in themes and sentiments over time, for better understanding the public emotions, concerns, and perceptions, that may affect E-learning quality.
3. Proposed Method
In this study, a novel approach is proposed for SA to evaluate the data based on the attitudes, sentiments, and fake news towards COVID-19, for online learning extracted from opinions and views on Twitter. This study contains five main steps, namely: a collection of data, text pre-processing, lexicon building for a specific domain, model development based on extreme learning machine and denoising AutoEncoder, and a final step is evaluation and assessment. For evaluation and comparison, our proposed method uses metrics such as F1, precision, recall, and accuracy. This study also compared the proposed model with state-of-the-art approaches from the related works.
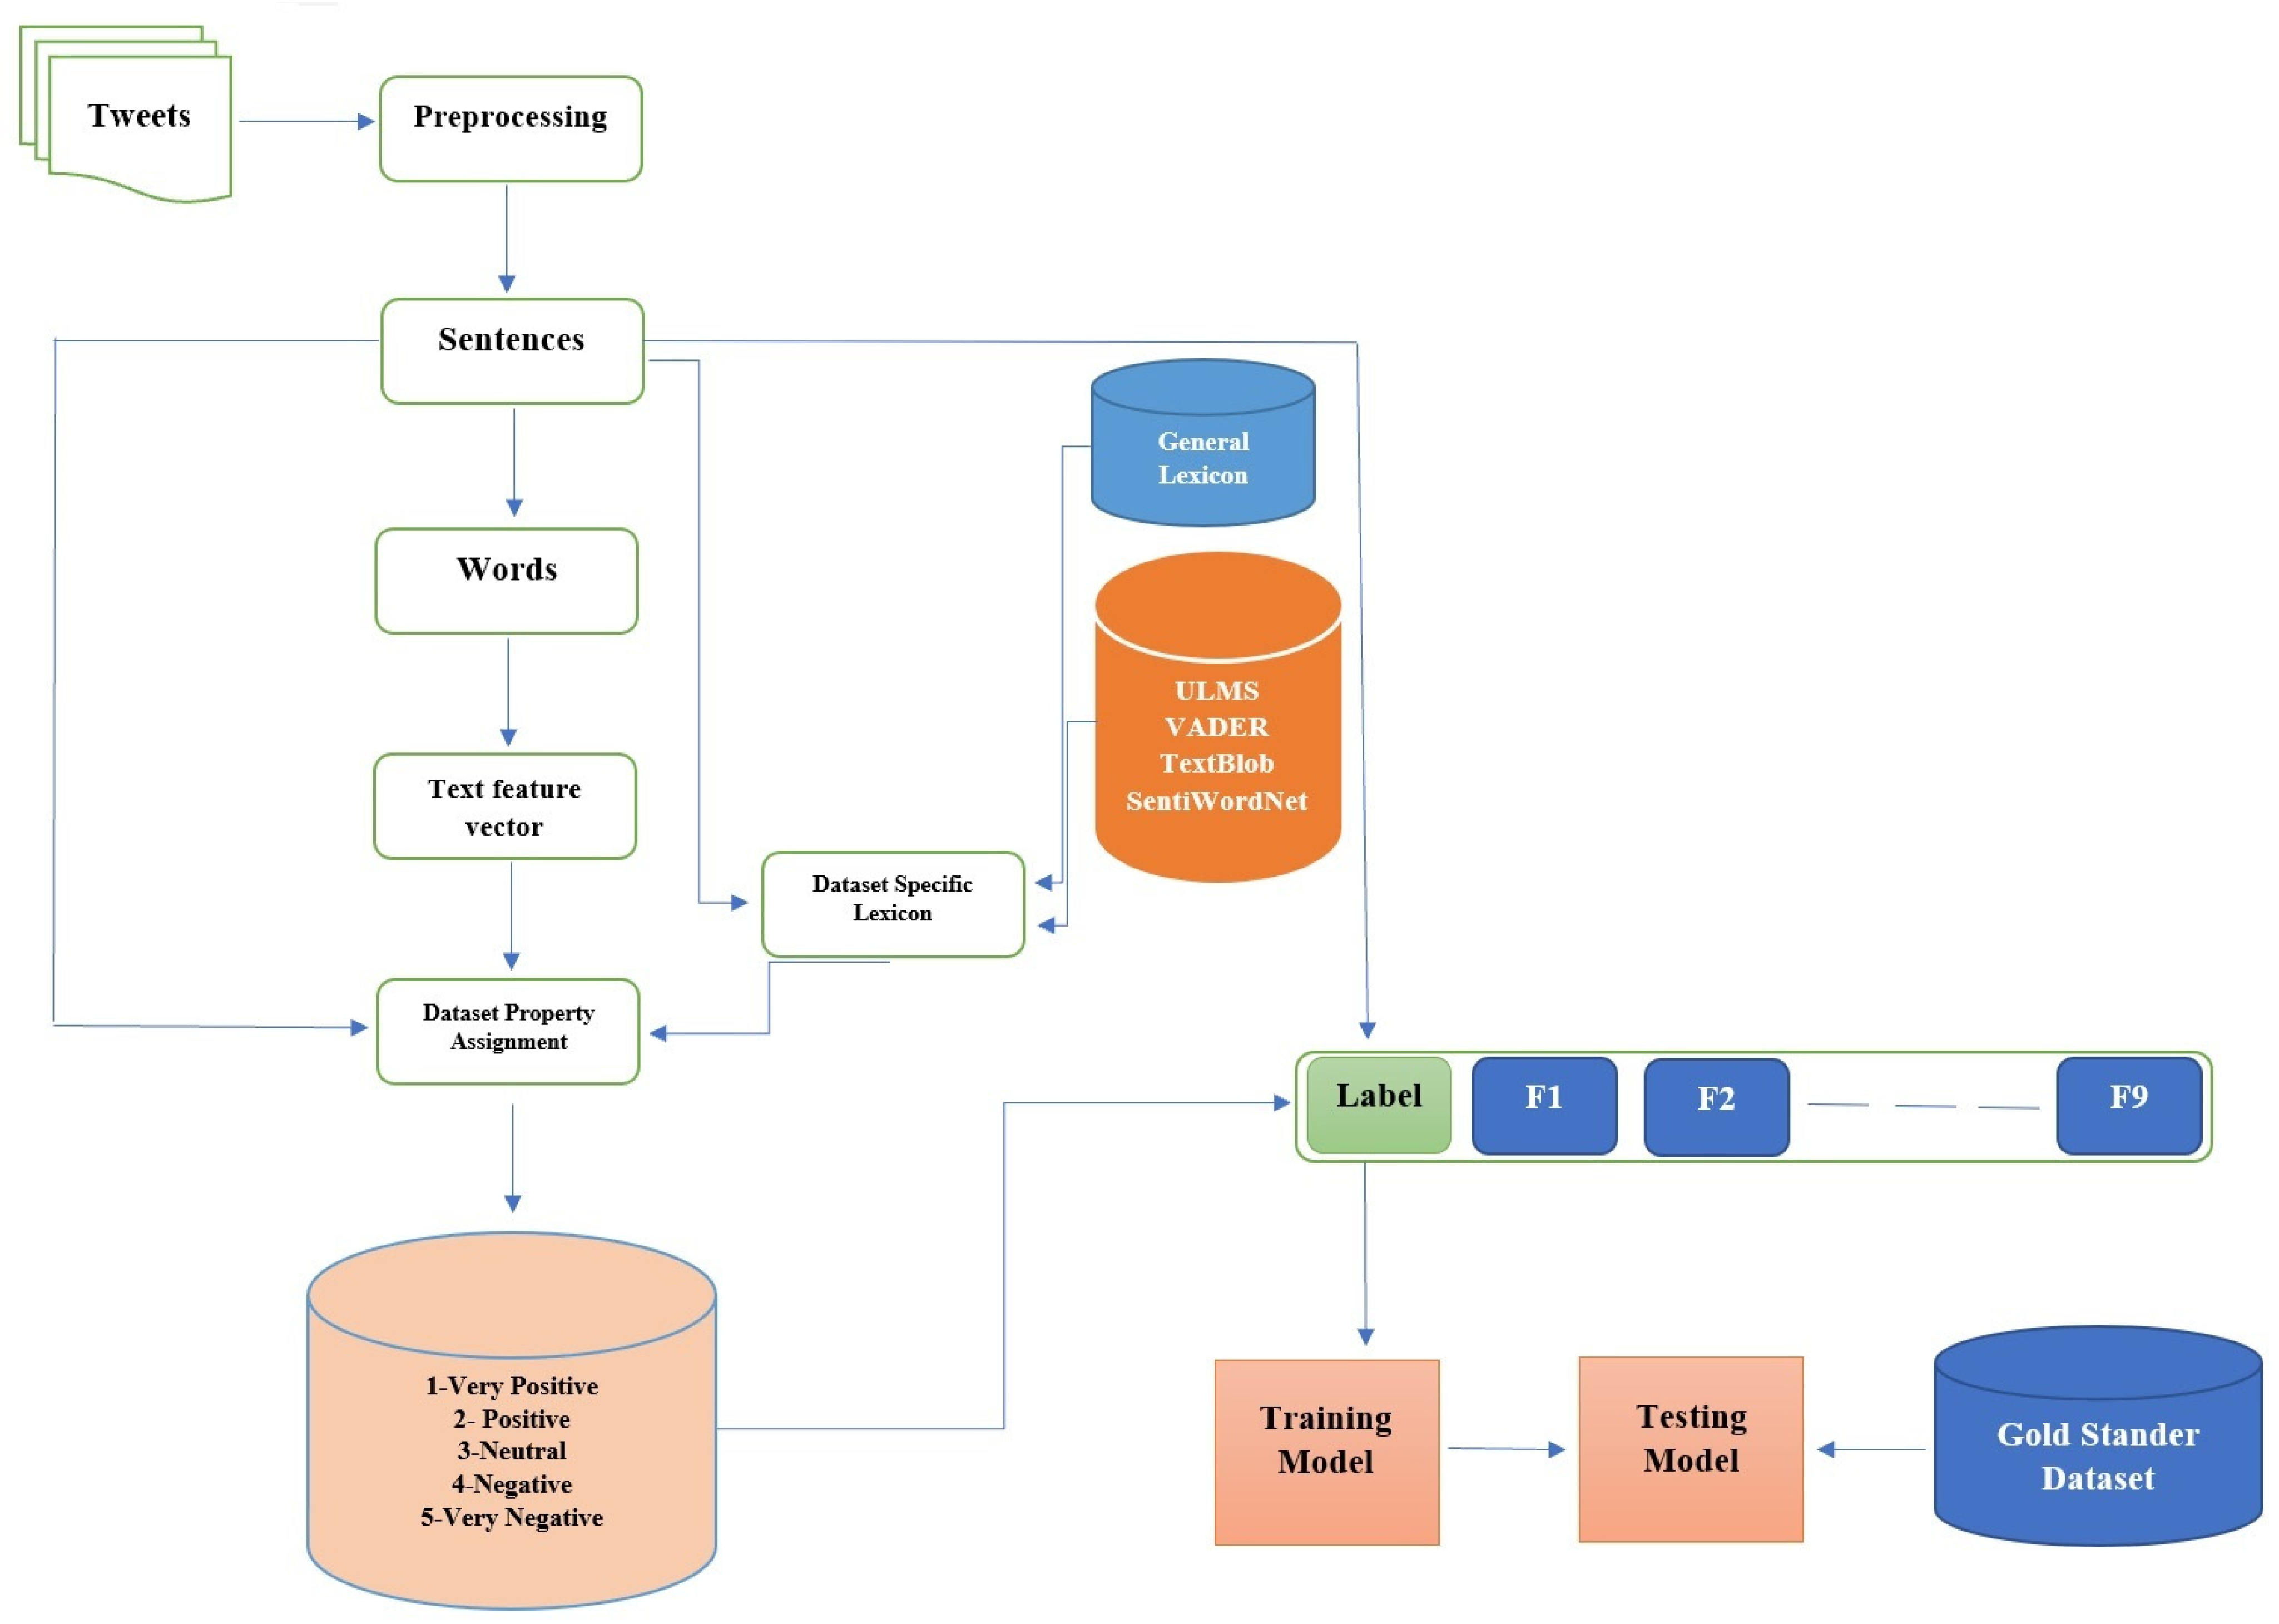
Figure 1 shows the main architecture for the suggested method.
The data collection is the first step and the first dataset is collected using the famous Twitter API (Application Programming Interface). This study used a query based on terms, (COVID-19, education, online learning, E-learning, teacher, and student) and collected 853,000 unique tweets between the dates of 20 December 2020 to 20 October 2021. The second dataset is the Fake News related to COV (
https://data.mendeley.com/datasets/zwfdmp5syg/1, accessed on 25 December 2021) ID-19
1 entered on 1 June 2021, which was published in [
46]. The second step is pre-processing and simplification of the text, and this step contains six sub-steps, such as tokenizing, which means dividing the input document into units with various levels for example paragraphs, sentences, and words, then Word2Vec was used for representing each word into a constant length of the numeric vector [
47]. Tokenizing processes the text based on punctuation and spaces to separate the text of the tweet into a list of words. The third step is how to solve the polarity issue by assigning the polarity to the list of sentences, building specific lexicon for the medical domain, adopting our lexicon for more information (see [
19]), and applying available lexicon ULMS (Unified Medical Language System), Valence Aware Dictionary for Sentiment Reasoning (VADER), TextBlob, and SentiWordNet to investigate the subjectivity and polarity of text. Step four is to apply the nine features (phrase frequency, sentence score, sentiment shifter rules, sentiment knowledge, medical concept, words and sentence embedding, linguistic, and statistical knowledge), extracting these textual features by using a Denoising AutoEncoder, to avoid the over-fitting issues. Synthetic Minority Oversampling Technique (SMOTE) is applied to produce synthetic data for the minority class in order to balance the dataset [
48]. The fusion of these features is achieved by applying an attention mechanism. These lists help us train our suggested model ELM-AE which is a Neural Network (NN) of one hidden layer, where the hidden layer weights are set at random and the output layer weights are calculated by training dataset. The fifth step is to evaluate if the proposed method is appropriate for evaluating the trustworthiness and usefulness of our suggested method to examine qualities such as eliminating redundancy, readability, comprehensibility, and noisy information. These approaches applied the following standard metric as follows:
where,
relates to the
ith input neurons and hidden neuron,
bi presents the
ith hidden neuron bias, connecting the output and the hidden neuron is presented by
βi. Within matrix form:
where,
Here,
H can be a matrix of non-square so there cannot exist
βi,
bi,
wi, where
i = 1, 2, …,
N such as
y = H β. The last square result of this approach is
Here,
H† is the Moore–Penrose popularized matrix
H opposite [
49].
4. Experiments and Results
An important question regards whether our proposed approach-based ELM-AE-LSTM and attention technique help improve the performance of SA to a vaccination textual dataset obtained from Twitter. Therefore, LSTM uses a one sentence-level node. One way of enriching the parameter space is to add more sentence-level nodes, each communicating with word-level nodes in the same way. The dropping probability for the dropout layers is 0.2. The number of nodes in each LSTM layer is always identical to the number of nodes in the input layer. In the following sections, we will discuss in detail the dataset used in this study, our proposed model components, designed experiments, and the results that our study achieved, based on the proposed model in the Dataset to validate the point that our proposed model is better.
4.1. The Dataset Collecting and Setup
This study applied SMMT (Social Media Mining Toolkit) [
50] to listen to the Twitter Stream API, and used the Twitter API for tweets with the described keywords, gathering the raw tweets, and it collected 853,000 unique tweets from 565,371 various users, based on six query words (COVID-19, education, online learning, E-learning, teachers, and students). Such a large number of raw tweets poses challenges, such as noise and redundant information, because the people who use social media are from a wide range of social domains and have inherent diversity, as well as local and political dynamics of the area that affect their views and opinions [
51].
For this work, there is also a need for a gold standard dataset, and for the creation of such a dataset, this work used the technique proposed in our previous work [
19]. This dataset also contains what is called the ground truth or corrected labels and for this task, seven annotators, including three lecturers and teachers, with good skills in understanding and reading the English language, and also an additional four Ph.D. students in English language linguistics, were asked to provide their services. All annotators worked on the dataset at a sentence level and labelled each of those sentences by using terms, “very positive”, “positive”, “neutral”, “negative”, and “very negative”. The list of sentences was labelled with the associated polarity based on the majority votes of the annotators. Finally, we were able to build a gold standard dataset for evaluating the suggested model at the sentence level, with 60,000 tweets or rows of sentences. The age criteria of the people included in the study were that we only used tweets from people aged 18 or above, so that a relatively mature and reliable textual dataset could be obtained. The numeric sentiment tags for each tweet with polarity are as follows: very positive = +1, positive = 0.5, neutral = 1, negative = −0.5, and very negative = −1.
Table 1 shows the dataset used for evaluation.
The second dataset, fake news, contains a gathering of fake and true news, correlated to COVID-19. The news articles were collected based on three query words: “COVID-19”, “coronavirus”, and “corona”. Its more than 6000 articles from various website outlets throughout the social network were included in the original dataset and gathered between December 2019 and July 2020. Additionally, the dataset contained three news subcategories: partially false, false, and true news. The data have been given labels of 1 for true news, 0 for partially false, and −1 for false news.
4.2. Text Pre-Processing
Normalization, which is also called “pre-processing” in the domain of NLP, is considered a crucial first step to clean the text and prepare the text in a standardized format that can be used in the training of machine learning or deep learning-based models for classification. Our strategy of developing the automated machine-learning model is divided into various steps. In the first step, this study removed punctuation, filtered stop words stemming, the lemmatizing, fixed-length vocabulary of size 30,000, and length of sentences between the ranges of 3 to 25 words for each of those documents [
52]. The part of Speech (POS) tagging method is also applied for classifying the terms of the textual dataset on the main classes of POS they belong to (verb, noun, adjective, and adverb), and the tagging of POS provides suitable information of lexicon [
53]. The yield of this stage is plaintext.
4.3. Lexicon Building
In the next step, we fed our processed dataset to the two embedding pre-trained models to get the numerical representation for each sentence. After that, UMLS, VADER, TextBlob, and SentiWordNet, and our statistical technique, were adopted in the method for building a specific lexicon (medical domain), which helps assign the polarity to each of the sentences (the details of this observation are discussed in [
19]). This study also used different sizes of the lexicon (number of terms) for examining the reliability of this approach [
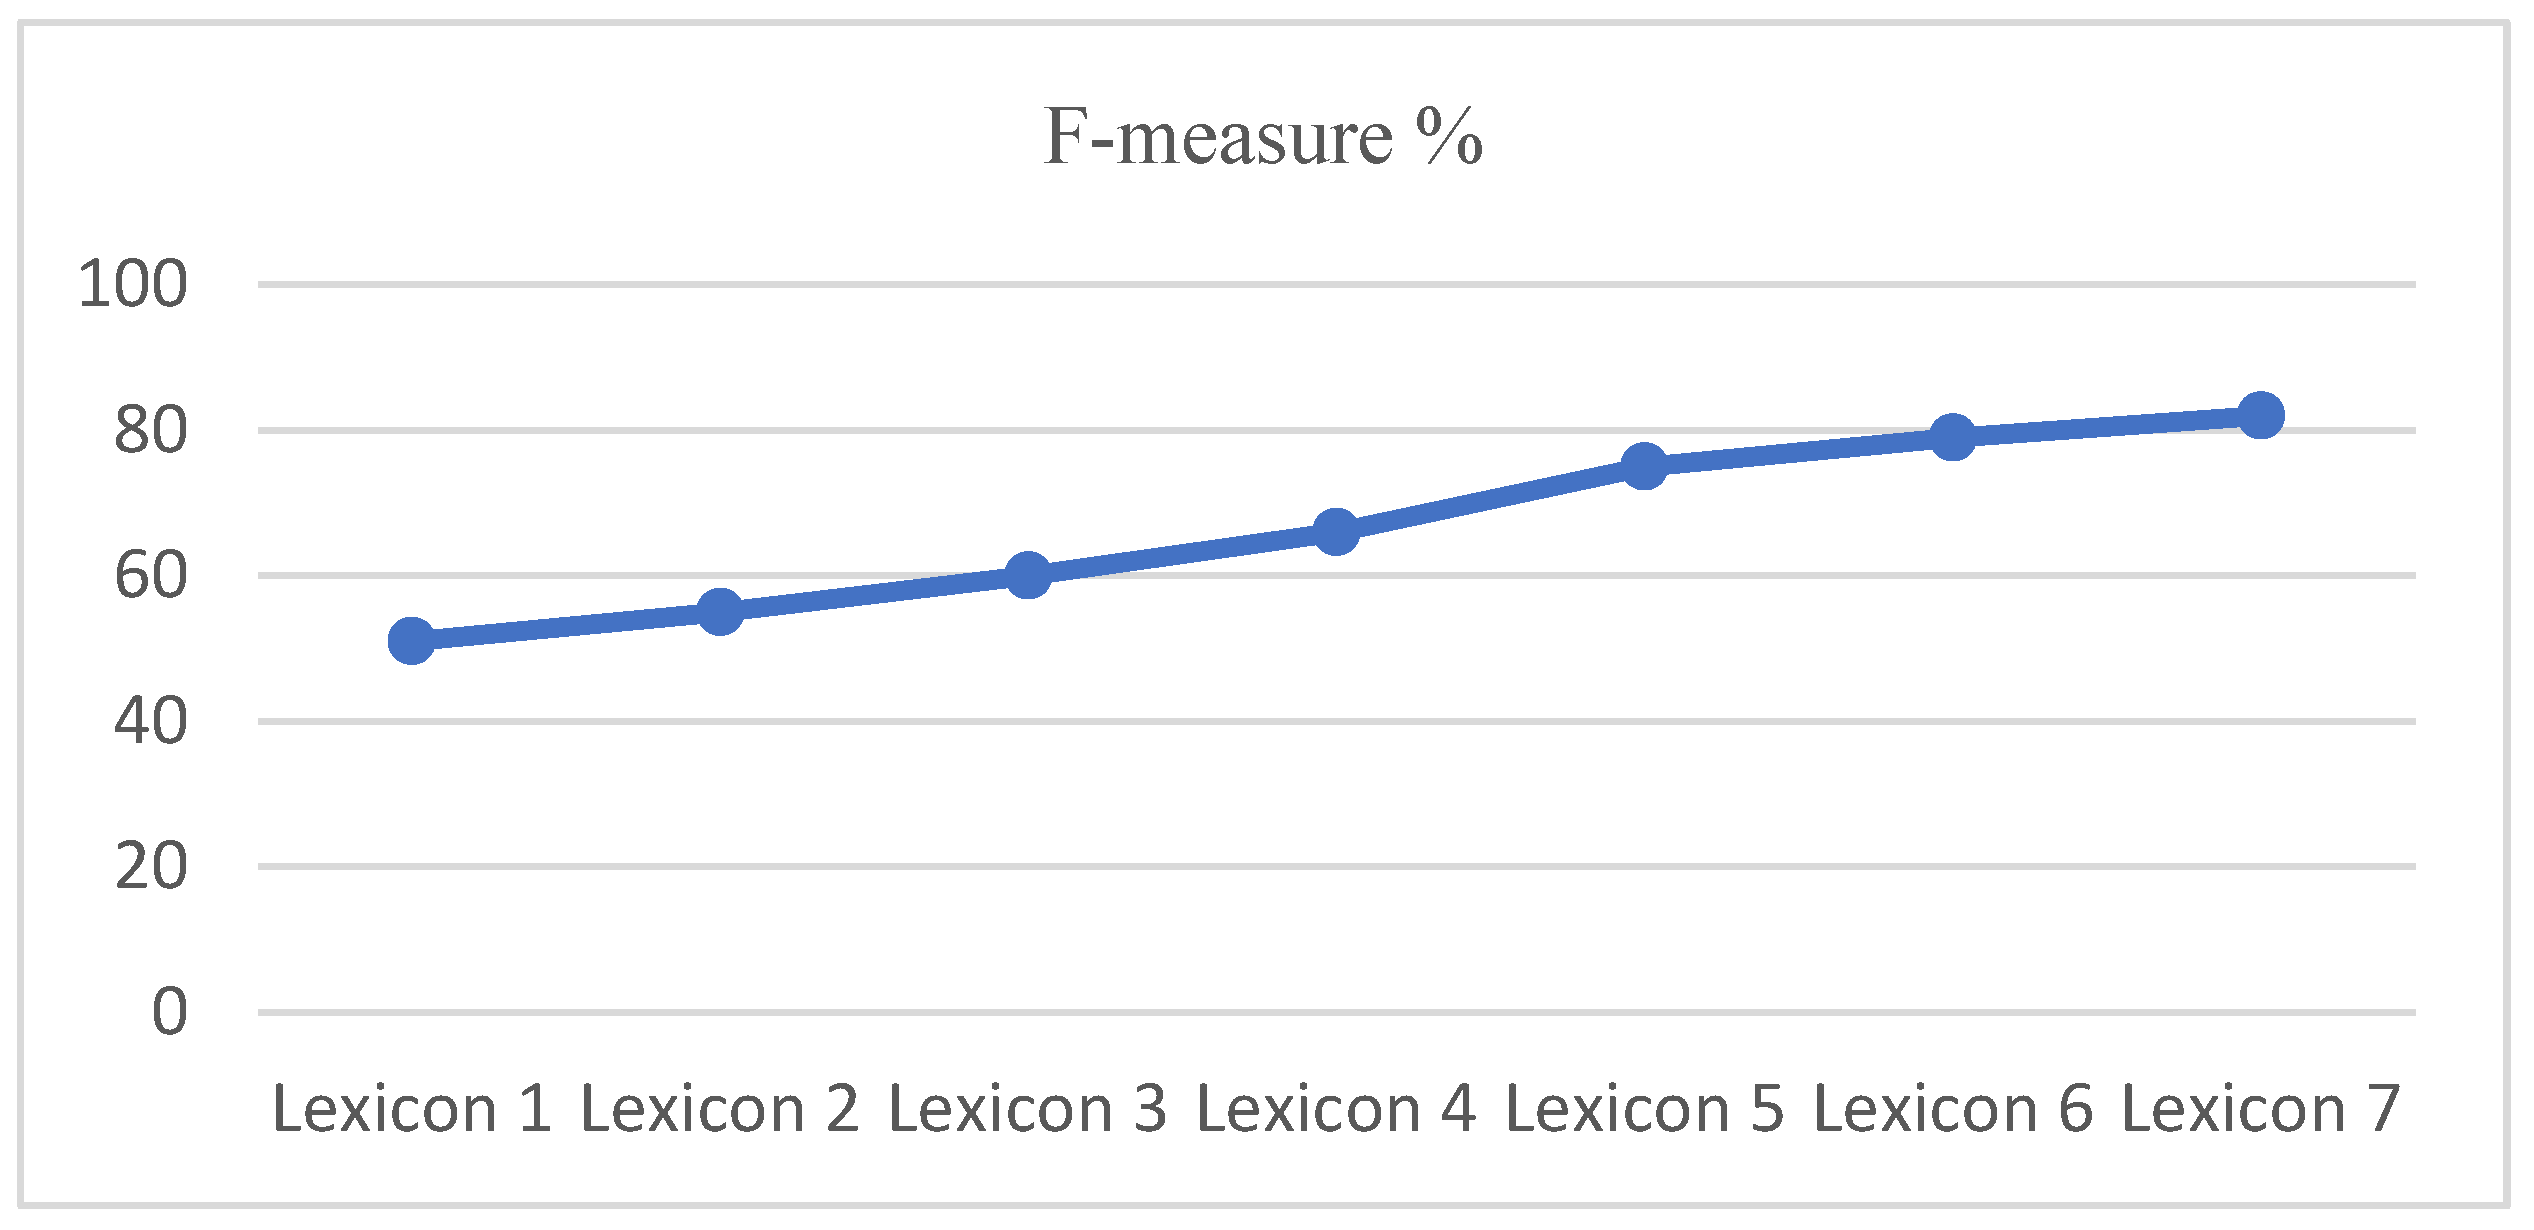
54]. The capacity of lexicons was tested (10,000, 20,000, 30,000, 40,000, 50,000, 60,000, and 70,000) and this study examined the various size of lexicons to investigate whether the biggest or smallest lexicon of sentiment can lead to promising results [
55]. The smallest lexicon resulted poorly and the biggest lexicon resulted in the highest performance [
56].
The sentiments ratio, after using the lexicons to assign the polarity, is not equivalent, so the model can be over-fit on the imbalanced dataset. SMOTE is applied to tackle issues with unbalanced datasets by balancing the sample’s number for all of the dataset’s classes. Balancing is performed by creating synthetic samples of the minority class in such a way that the number of samples to the minority class is almost equal to the number of samples to the majority class. As a result, when the SMOTE approach is used to generate synthetic samples of the minority class, models have a high level of accuracy [
57]. As a result, when the SMOTE approach is used to generate artificial samples of the minority class, models have a high level of accuracy. The F-measure is based on the number of terms in each lexicon, (lexicon 1 = 10,000, lexicon 2 = 20,000, lexicon 3 = 30,000, lexicon 4 = 40,000, and so on), see
Figure 2.
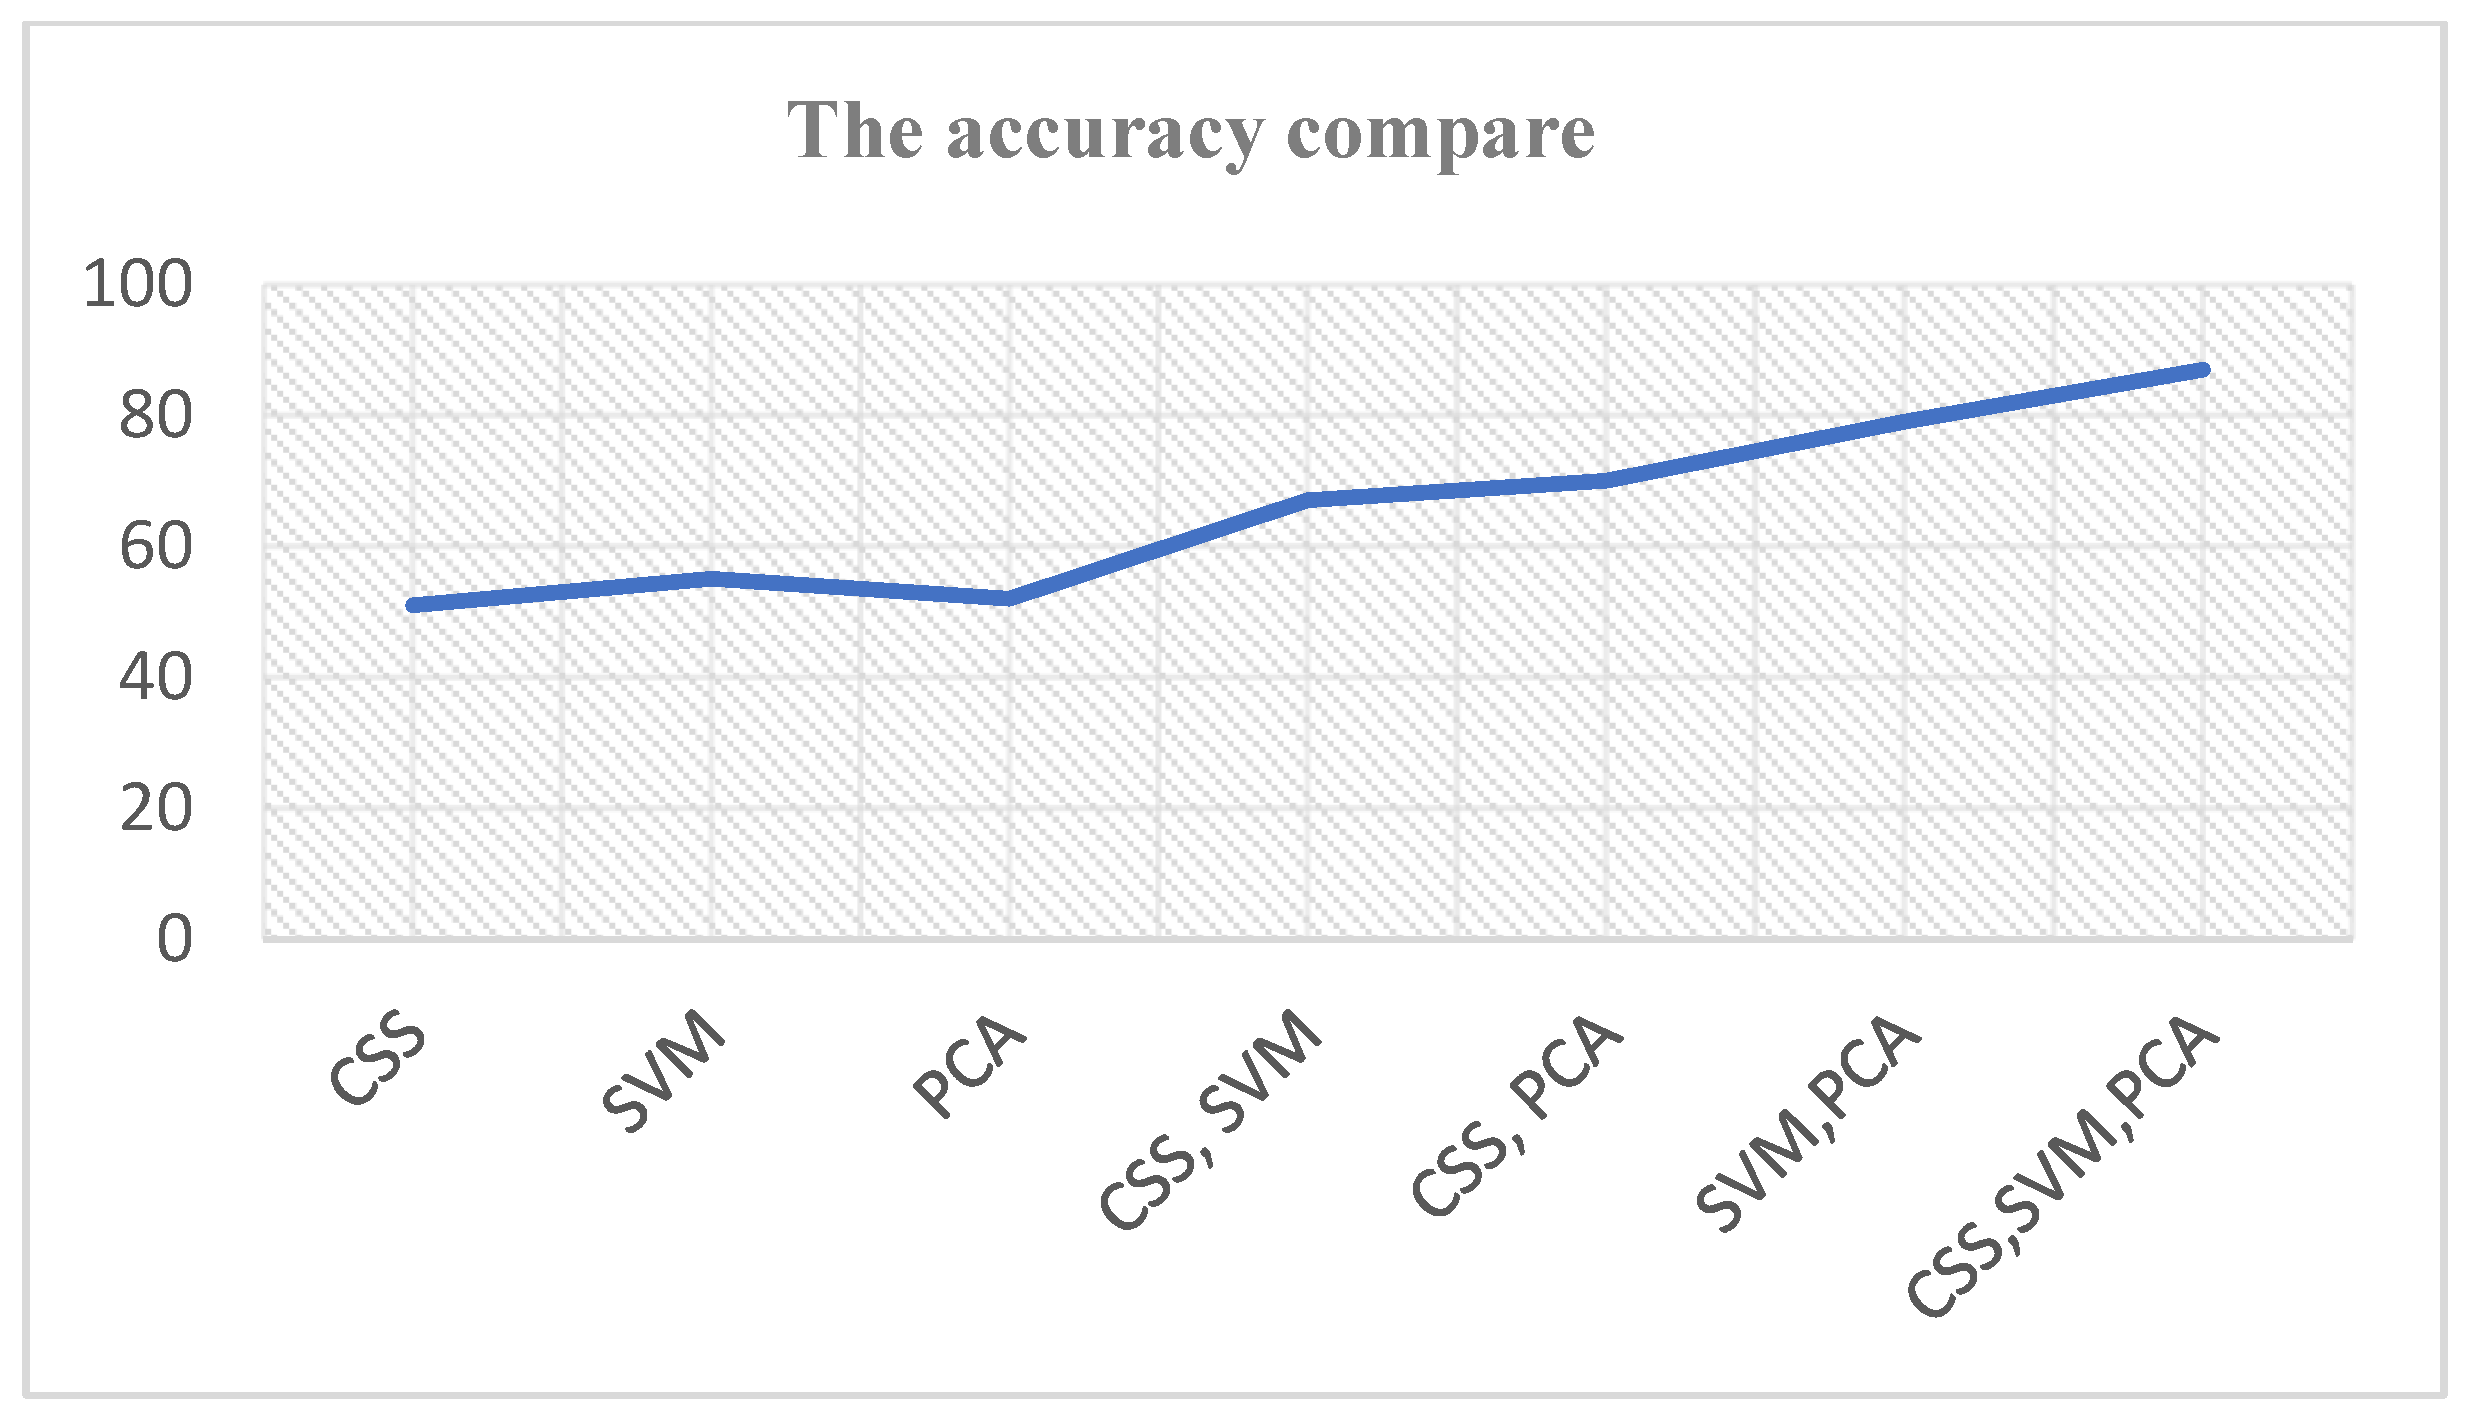
Figure 3 shows the accuracy results using our statistical techniques.
This study has also adopted some equations for assigning the polarity for each term and sentence. These equations help solve the coverage of the limited terms. The first equation is used to calculate the polarity of the word, as discussed in [
58]:
where
WP = word Polarity,
Ps = positive score, and
Ns = negative score. Then the second equation is:
where
SP = sentence Polarity,
Ps = positive score, and
Ns = negative score. Then the third and final equation is:
where
Ss = sentiment score,
P and
N indicate the number of positive and negative terms, respectively.
= the summation total number of positive words in the sentence, and
= the summation total number of negative words in the sentence. For the issue of how to calculate this for other classes, we adopted the rounding theory to the nearest number, for example, +0.9 can equal +1, as discussed in [
59].
Notes: Weighted by Chi-squared statistic (CSS), Support Vector Machine (SVM), and Principal Component Analysis (PCA).
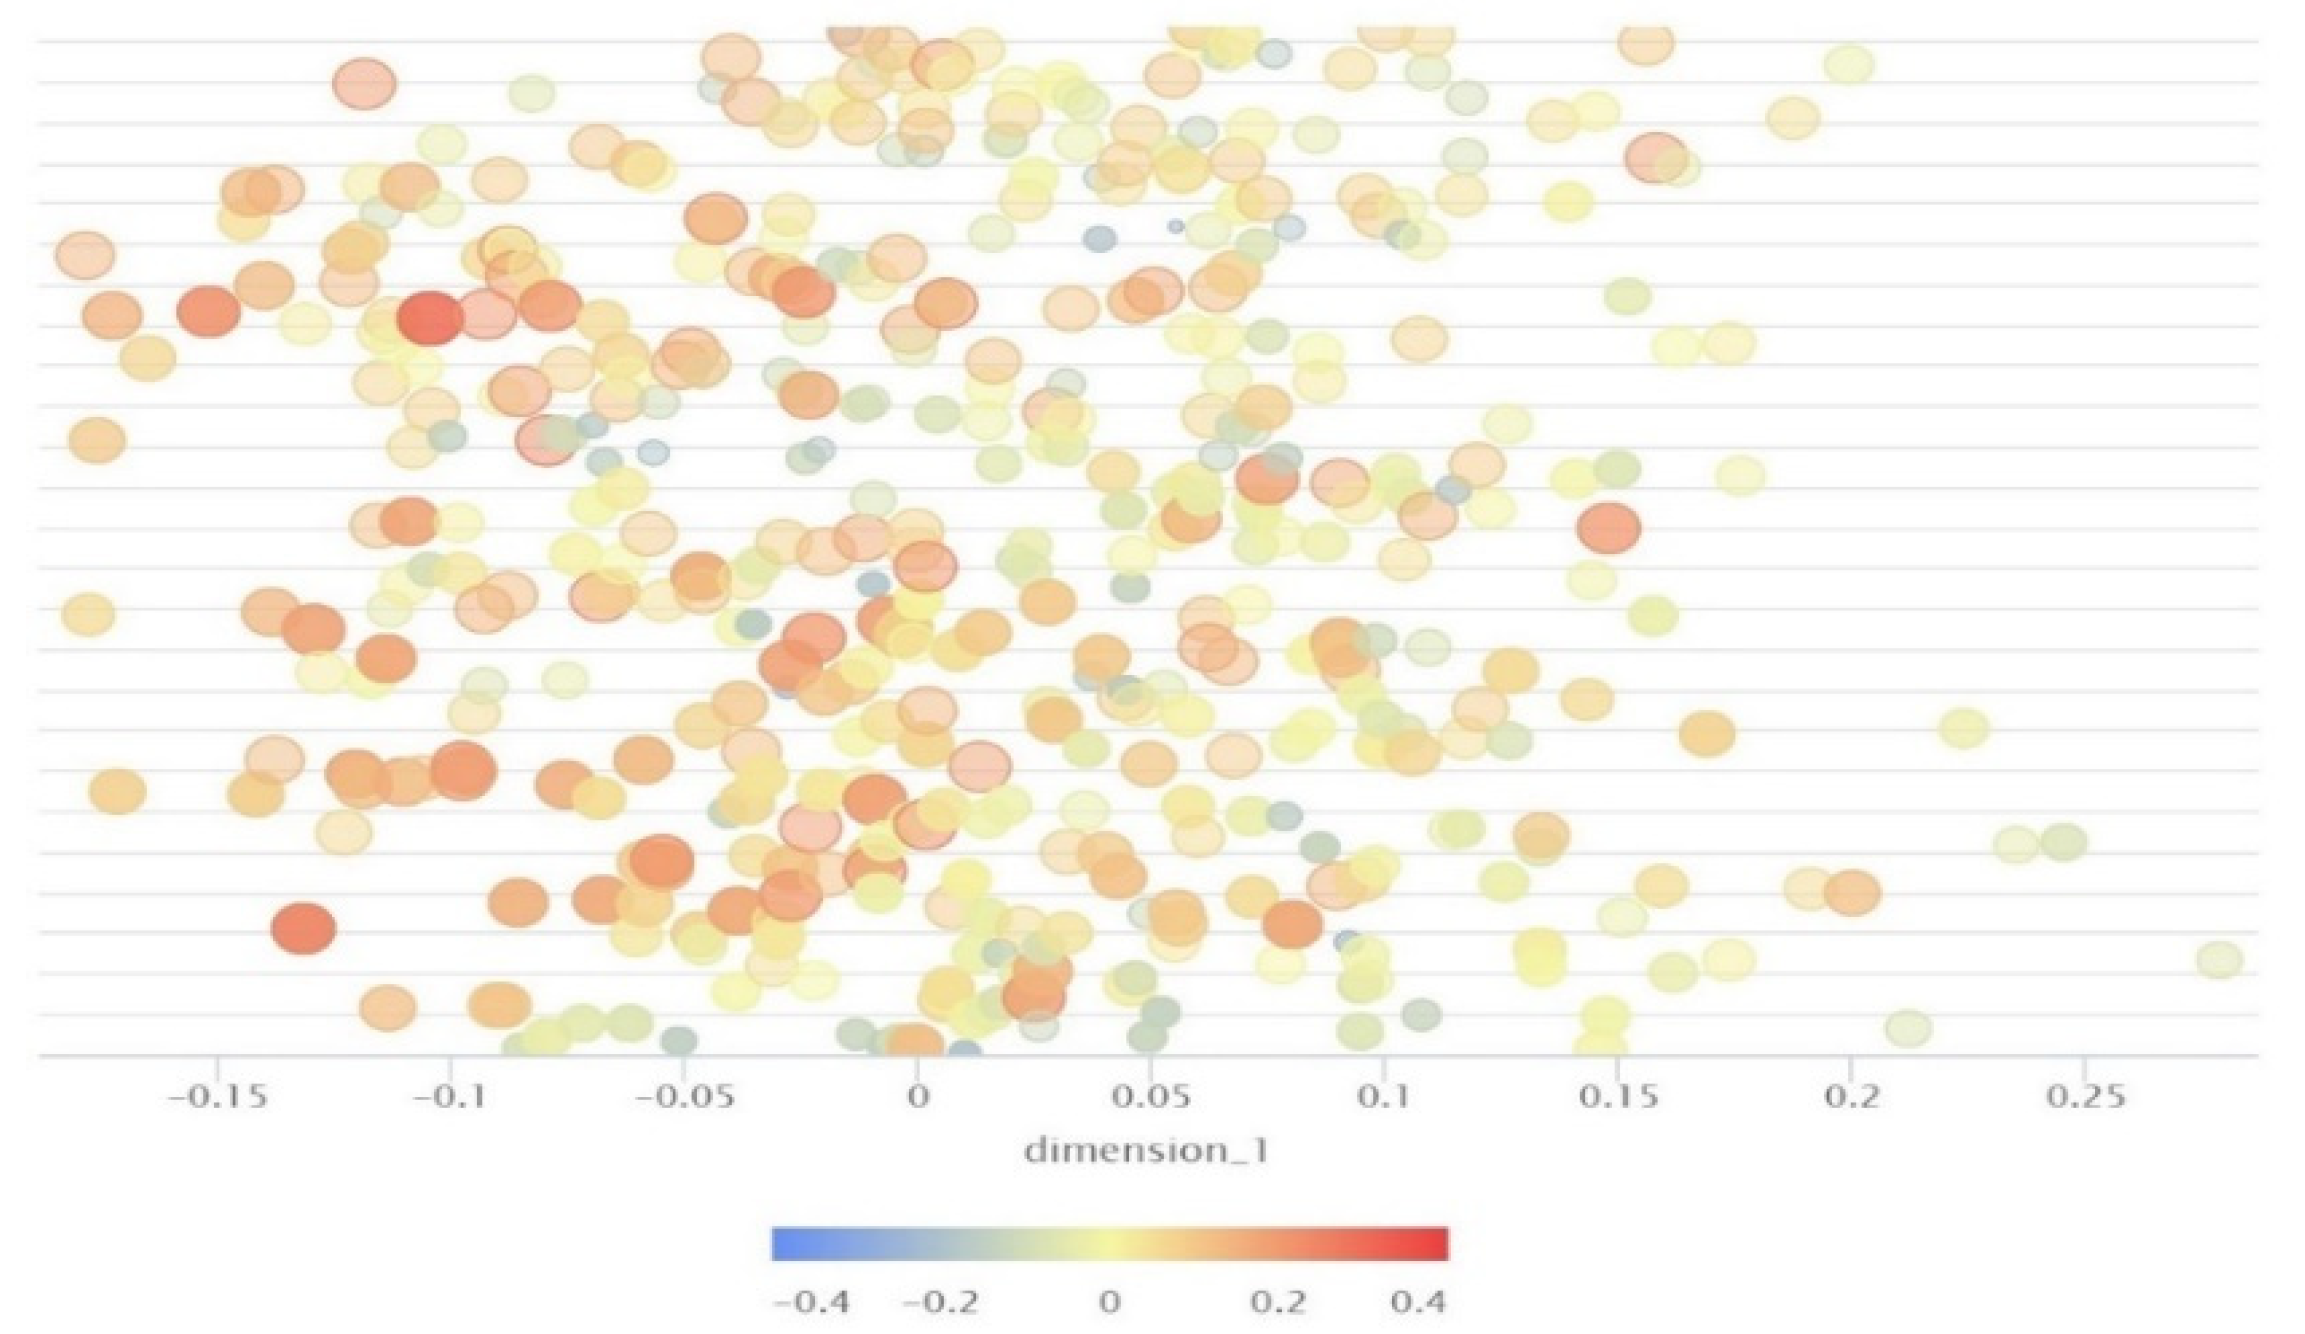
The result of this phase on the
Y-axis is that there is a list of sentences, and on the
X-axis, the dimension-1 of the chosen sentences is displayed based on the vector, see
Figure 4.
where
refers to important phrases’ frequency,
refers to sentence number that contains important phrases and
refers to the total number of the important frequency in documents.
where
SL refers to sentence location,
refers to the
sentence in the document, and
m is the maximum number of a sentence in document
d.
4.4. Vector Space Model
Deep Neural Network (DNN) uses the continuous bag-of-words method with other strategies that will be described in the following discussion to deal with the different problems in the model. We used the Word2Vec model as pre-trained on famous datasets, such as Wikipedia and Google News, with the embedding dimension of size 200. The main parameters of our model are the word minimal vocabulary frequency, the layer size, the text window size, and the negative numbers were set to 30, 200, 5, respectively. The values of 30 and 5 for the minimal vocabulary frequency and the text window size were chosen after doing experiments with a range of values for both parameters. Solving the issue related to shifter words, parameter values of minimum confidence were set to 0.8, gain theta to 2.0, and Laplace k to 1.0 [
19,
52,
56,
60].
Finally, one of the primary purposes of word embedding is to extract the meaningful numeric representation of fixed length, corresponding to the words in a language, but still, substantial noise occurs in the context information of social networks, which affects the feature extraction process. For eliminating noise information intrusion and obtain more robust features, this study applied a Denoising AutoEncoder (DAE) for textual feature extraction. The purpose for applying DAE instead of a vanilla AutoEncoder is that DAE adds noise to the input data in the encoder part and in the decoder part, original data are used for reconstruction. After training the DAE, either the embedding layer or the middle layer was extracted, as this layer corresponds to the lower number of neurons and it is believed that a useful representation of the high number of features is learned in a low dimension with a nonlinear representation [
61,
62].
4.5. Input Features
The list of multi-level features represents the textual characteristic used to capture data specific patterns. Nine key features (phrase frequency, sentence score, sentiment shifter rules, sentiment knowledge, medical concept, word and sentence embedding, linguistic, and statistical knowledge) were fed to the model for the training of the model for the classification task. The set of features with their details of calculation and working are discussed in detail in [
63].
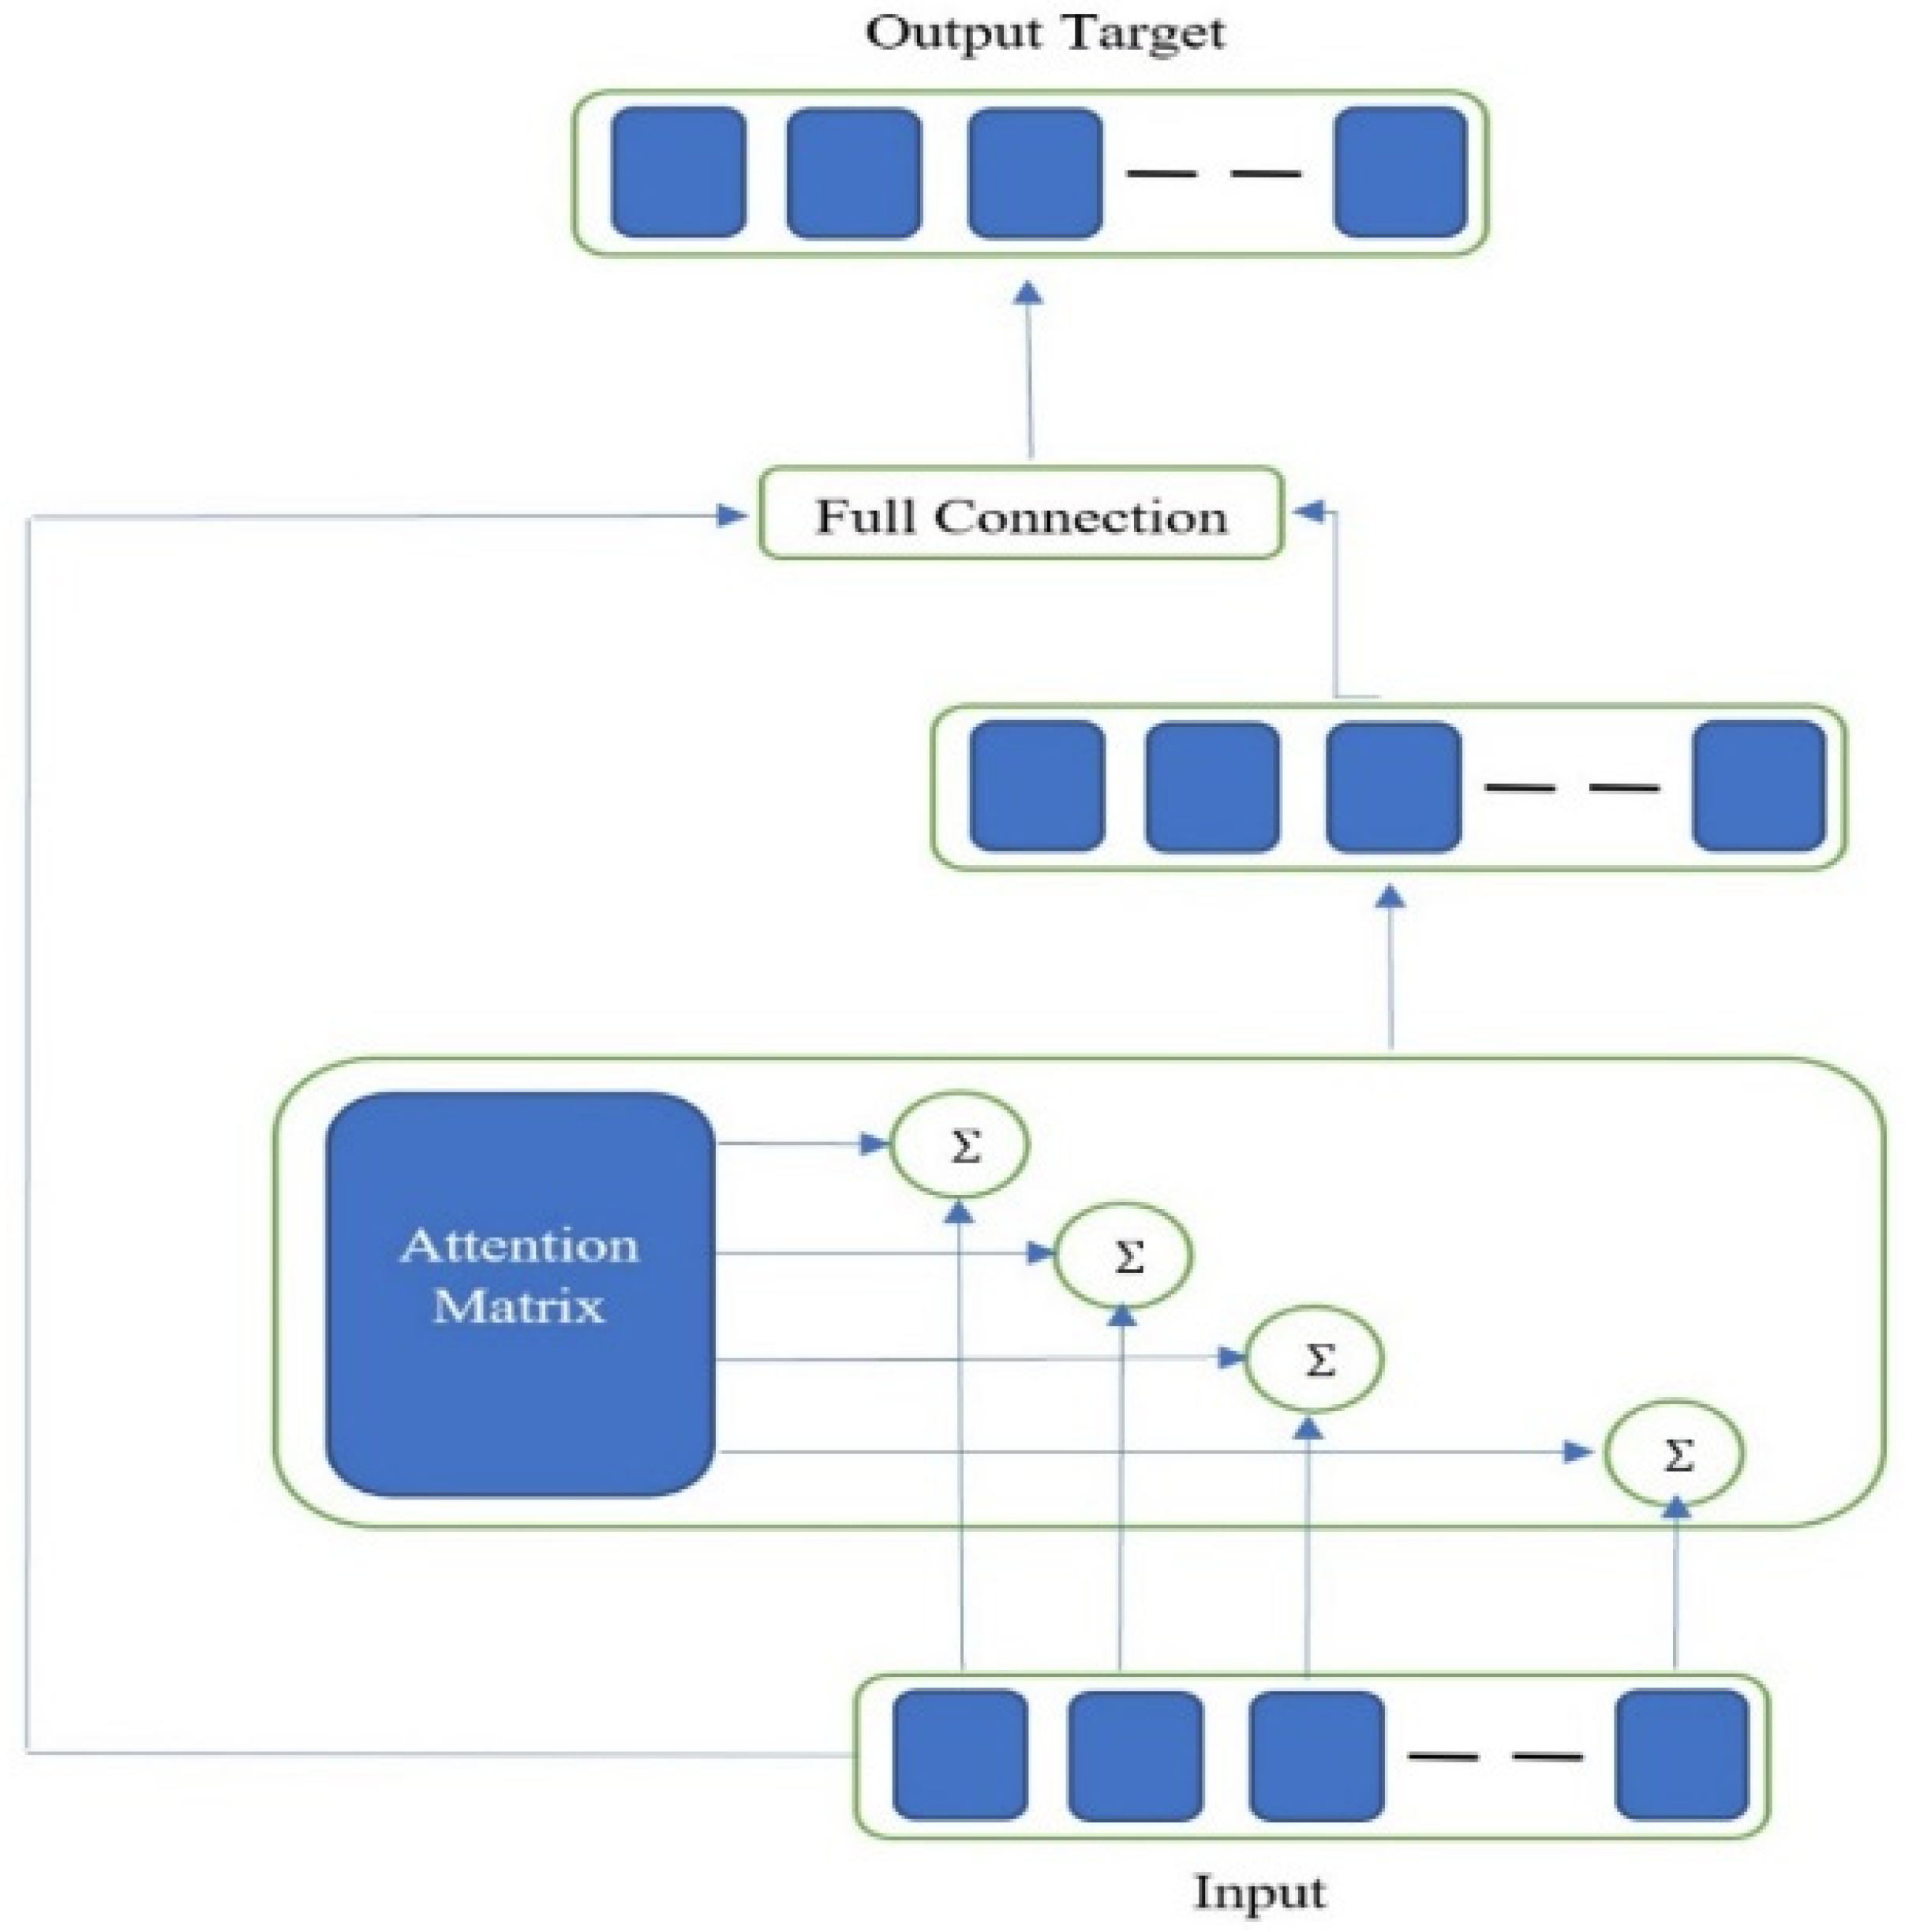
Table 2 shows a description of these nine features, presented, for clarity, to the readers. One of the challenging tasks is to use the fused features for SA on the Twitter dataset, and for this issue, an attention mechanism was adopted based on the textual feature extraction model [
64].
Figure 5 shows the details of the fusion features method. The results from the extraction method were used as input to the features fusion method.
Our goal in this study was to construct the most prominent or significant list of features that can select the most relevant sentences (tweets) to increase the context coverage and variety between tweets for final classification. It is pertinent to mention here that the outcome of any classifier model is extremely affected by the list of selected features, as these features play an important role in capturing the non-linear relationship between the classes and the features of the dataset.
Table 3 shows an improvement in the performance using a fusion of the approaches. This is based on the number of features applied; for example, Experiment 1 means one feature was used, Experiment 2 means two features were used, and Experiment 9 means the full list of features was used.
4.6. Data-Driven Modeling of Neural Networks
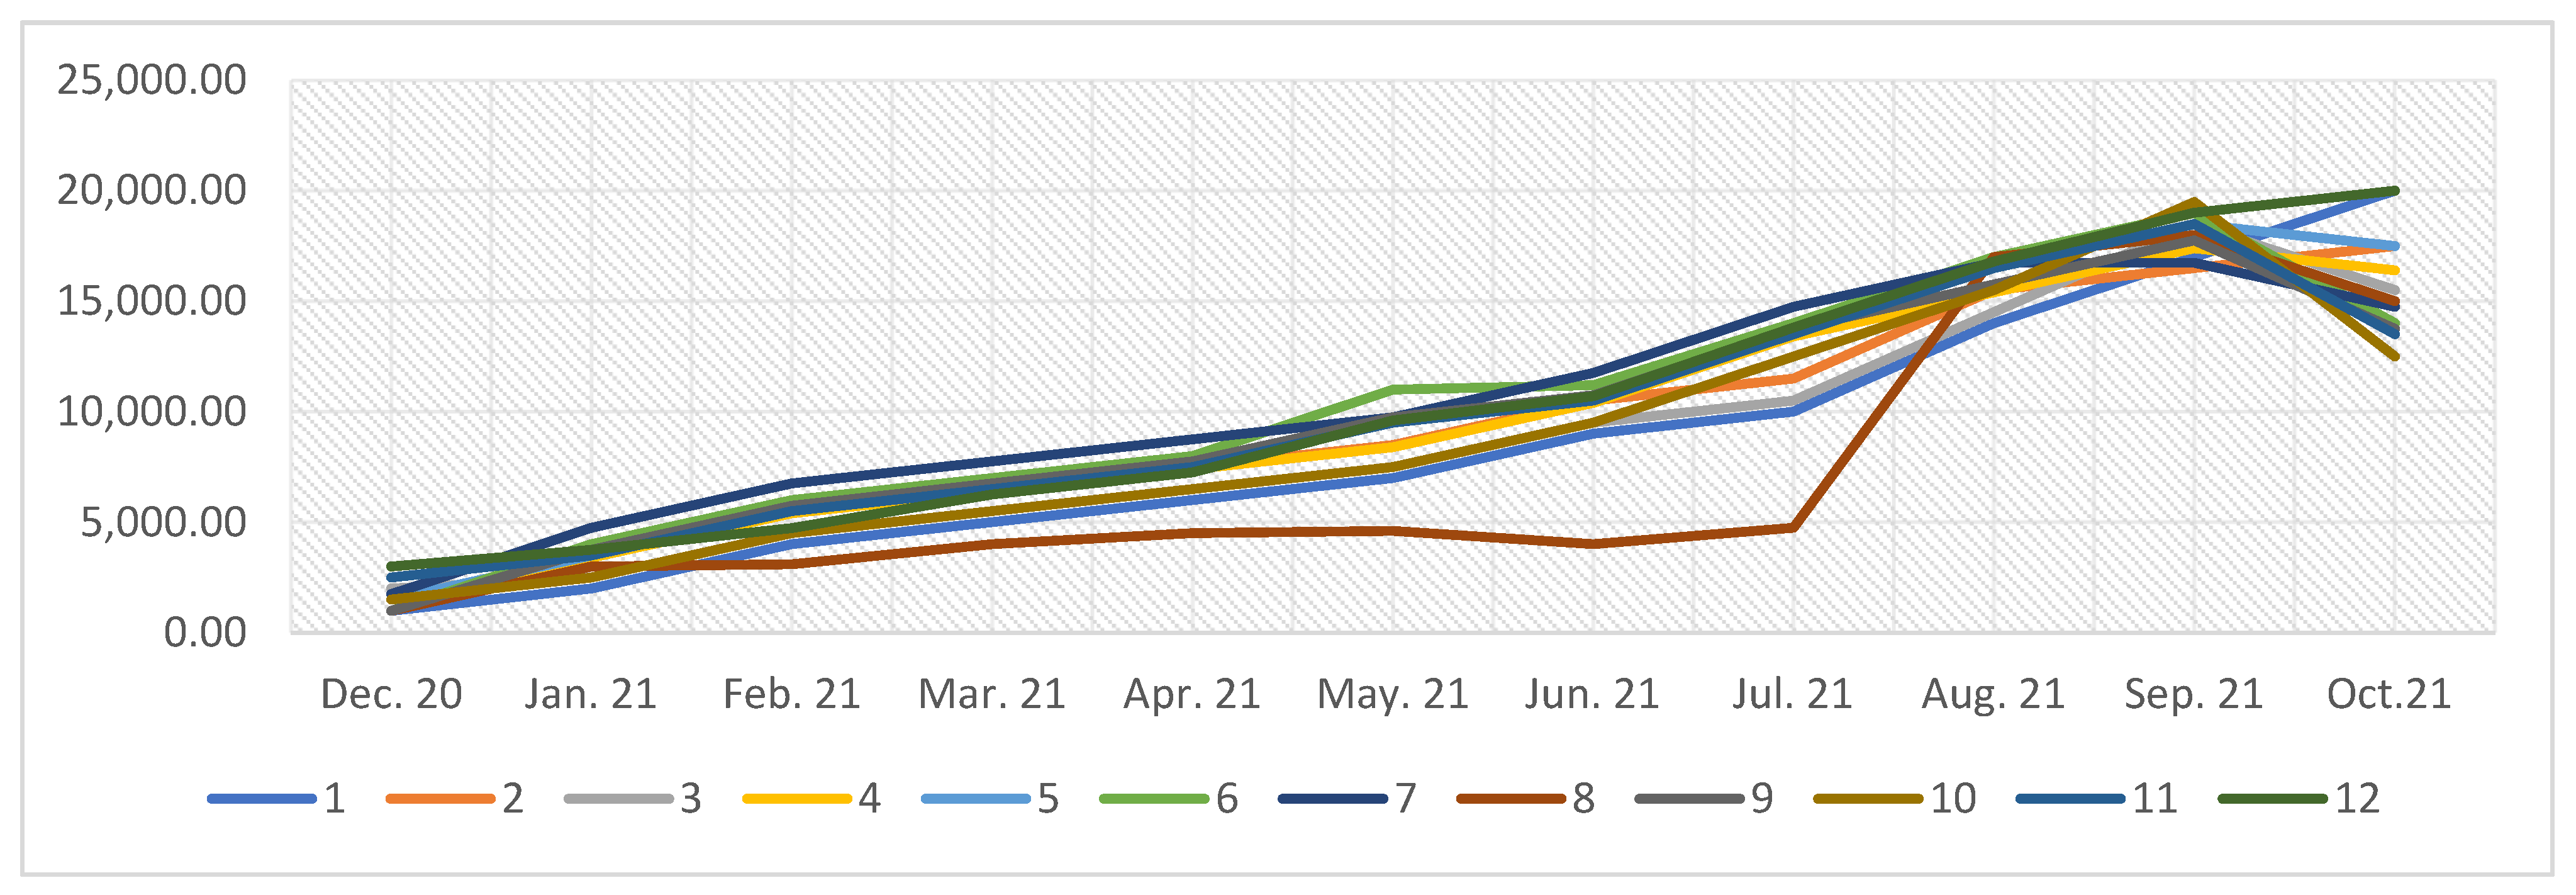
The tweets’ Topic modeling, related to the education sector, produced 12 topics, which were grouped into 4 major themes. We divided these topics based on the hottest topic discussed for each week of our selected period. Sentiments about the education sector (254,781/853,000 tweets, 21.73%) were the maximum tweeted theme and remained a hotly debated issue throughout our investigation. The topics are (1) Advantages of E-learning, (2) Effect of economics, (3) Viewpoints on online learning, (4) Collaboration and assistance on a global scale, (5) Instructions for receiving vaccinations, (6) Disadvantages of E-learning, (7) Immunization administration is progressing, (8) Educating communities, (9) Procedures for controlling teachers and students, (10) Vaccines Functioning, (11) Vaccination authorization, and (12) Fake news. In order to see the weekly frequency of the 12 topics from 20 December 2020 to 20 October 2021, see
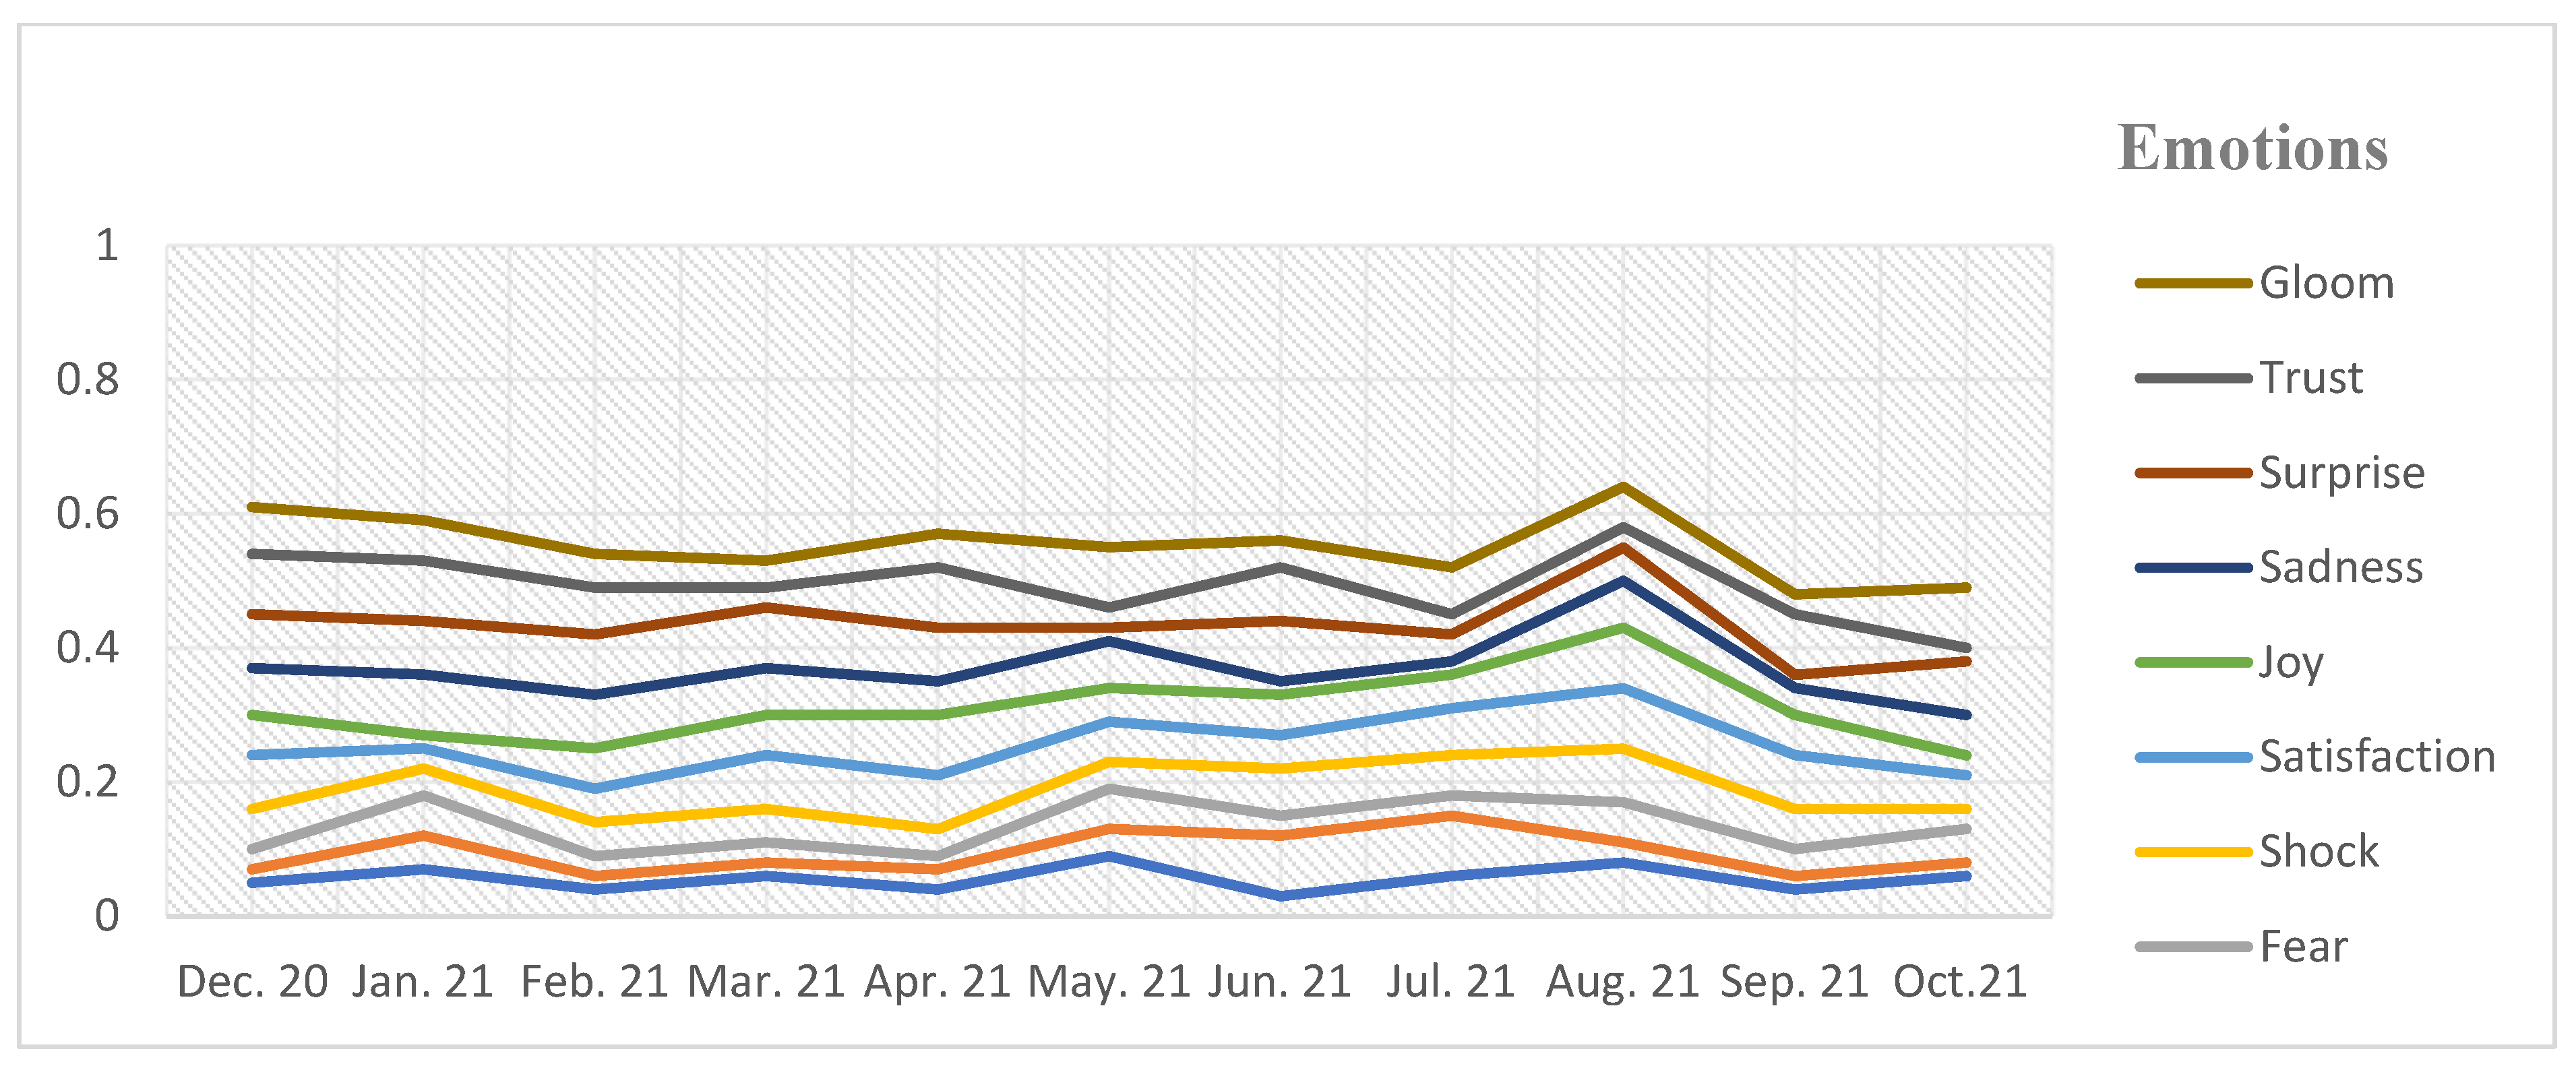
Figure 6. The overlap between each topic is grouped into four major themes, which are: (a) Emotions and opinions around E-learning, which included topics 1, 2, and 12. (b) Information about vaccines and online learning, which included topics 3, 5, and 6. (c) Vaccines as a universal problem, which included topics 4, 8, and 9. (d) Vaccine administration, development, and authorization, which included topics 7, 10, and 11. We applied LDA for selecting these 12 topics, based on the following reasons: the highest coherence score came with 12 topics; the second one is the TM with 12 topics, which achieves a compromise between being too tight and risking eliminating key issues, as well as being too wide and diluting the core focus. In this study, the weekly proportion of emotions is shown in
Figure 7. Based on this figure, we observed that individuals change their opinions according to the changes in the general situation around them, and this depends on the 12 topics that were selected, and also it is possible to observe the overlap and change of opinions weekly.
5. Evaluation and Comparison
The ELM-AE was applied with a dataset divided into training, verification, and testing sets (80%), (10%), and (80%), respectively, according to the 8:1:1 ratio, then we used an optimization grid to reduce computation costs, and number of parameters and running time were applied. The main parameters for our model are epoch, learning rate, batch size, and dropout, and the range values are 35–50, 0.001–0.0001, 32–128, and 0.3–0.9, respectively.
The model consists of an input layer, which contains the neurons’ number that represented the list of features number,
Nelm parameter, the hidden layer, which contains several nodes, and these parameters need tuning, composing
C and
λ. Parameters bias and weight for the hidden layer are produced at random, as discussed in [
65]. We also suggested an optimized parameters grid search, which has the ability to tune the key parameters for the classifier model in the sub-process for getting the ideal parameters. An equation was used to improve the approach, resulting in the highest F1 score when compared with traditional and state-of-the-art methods [
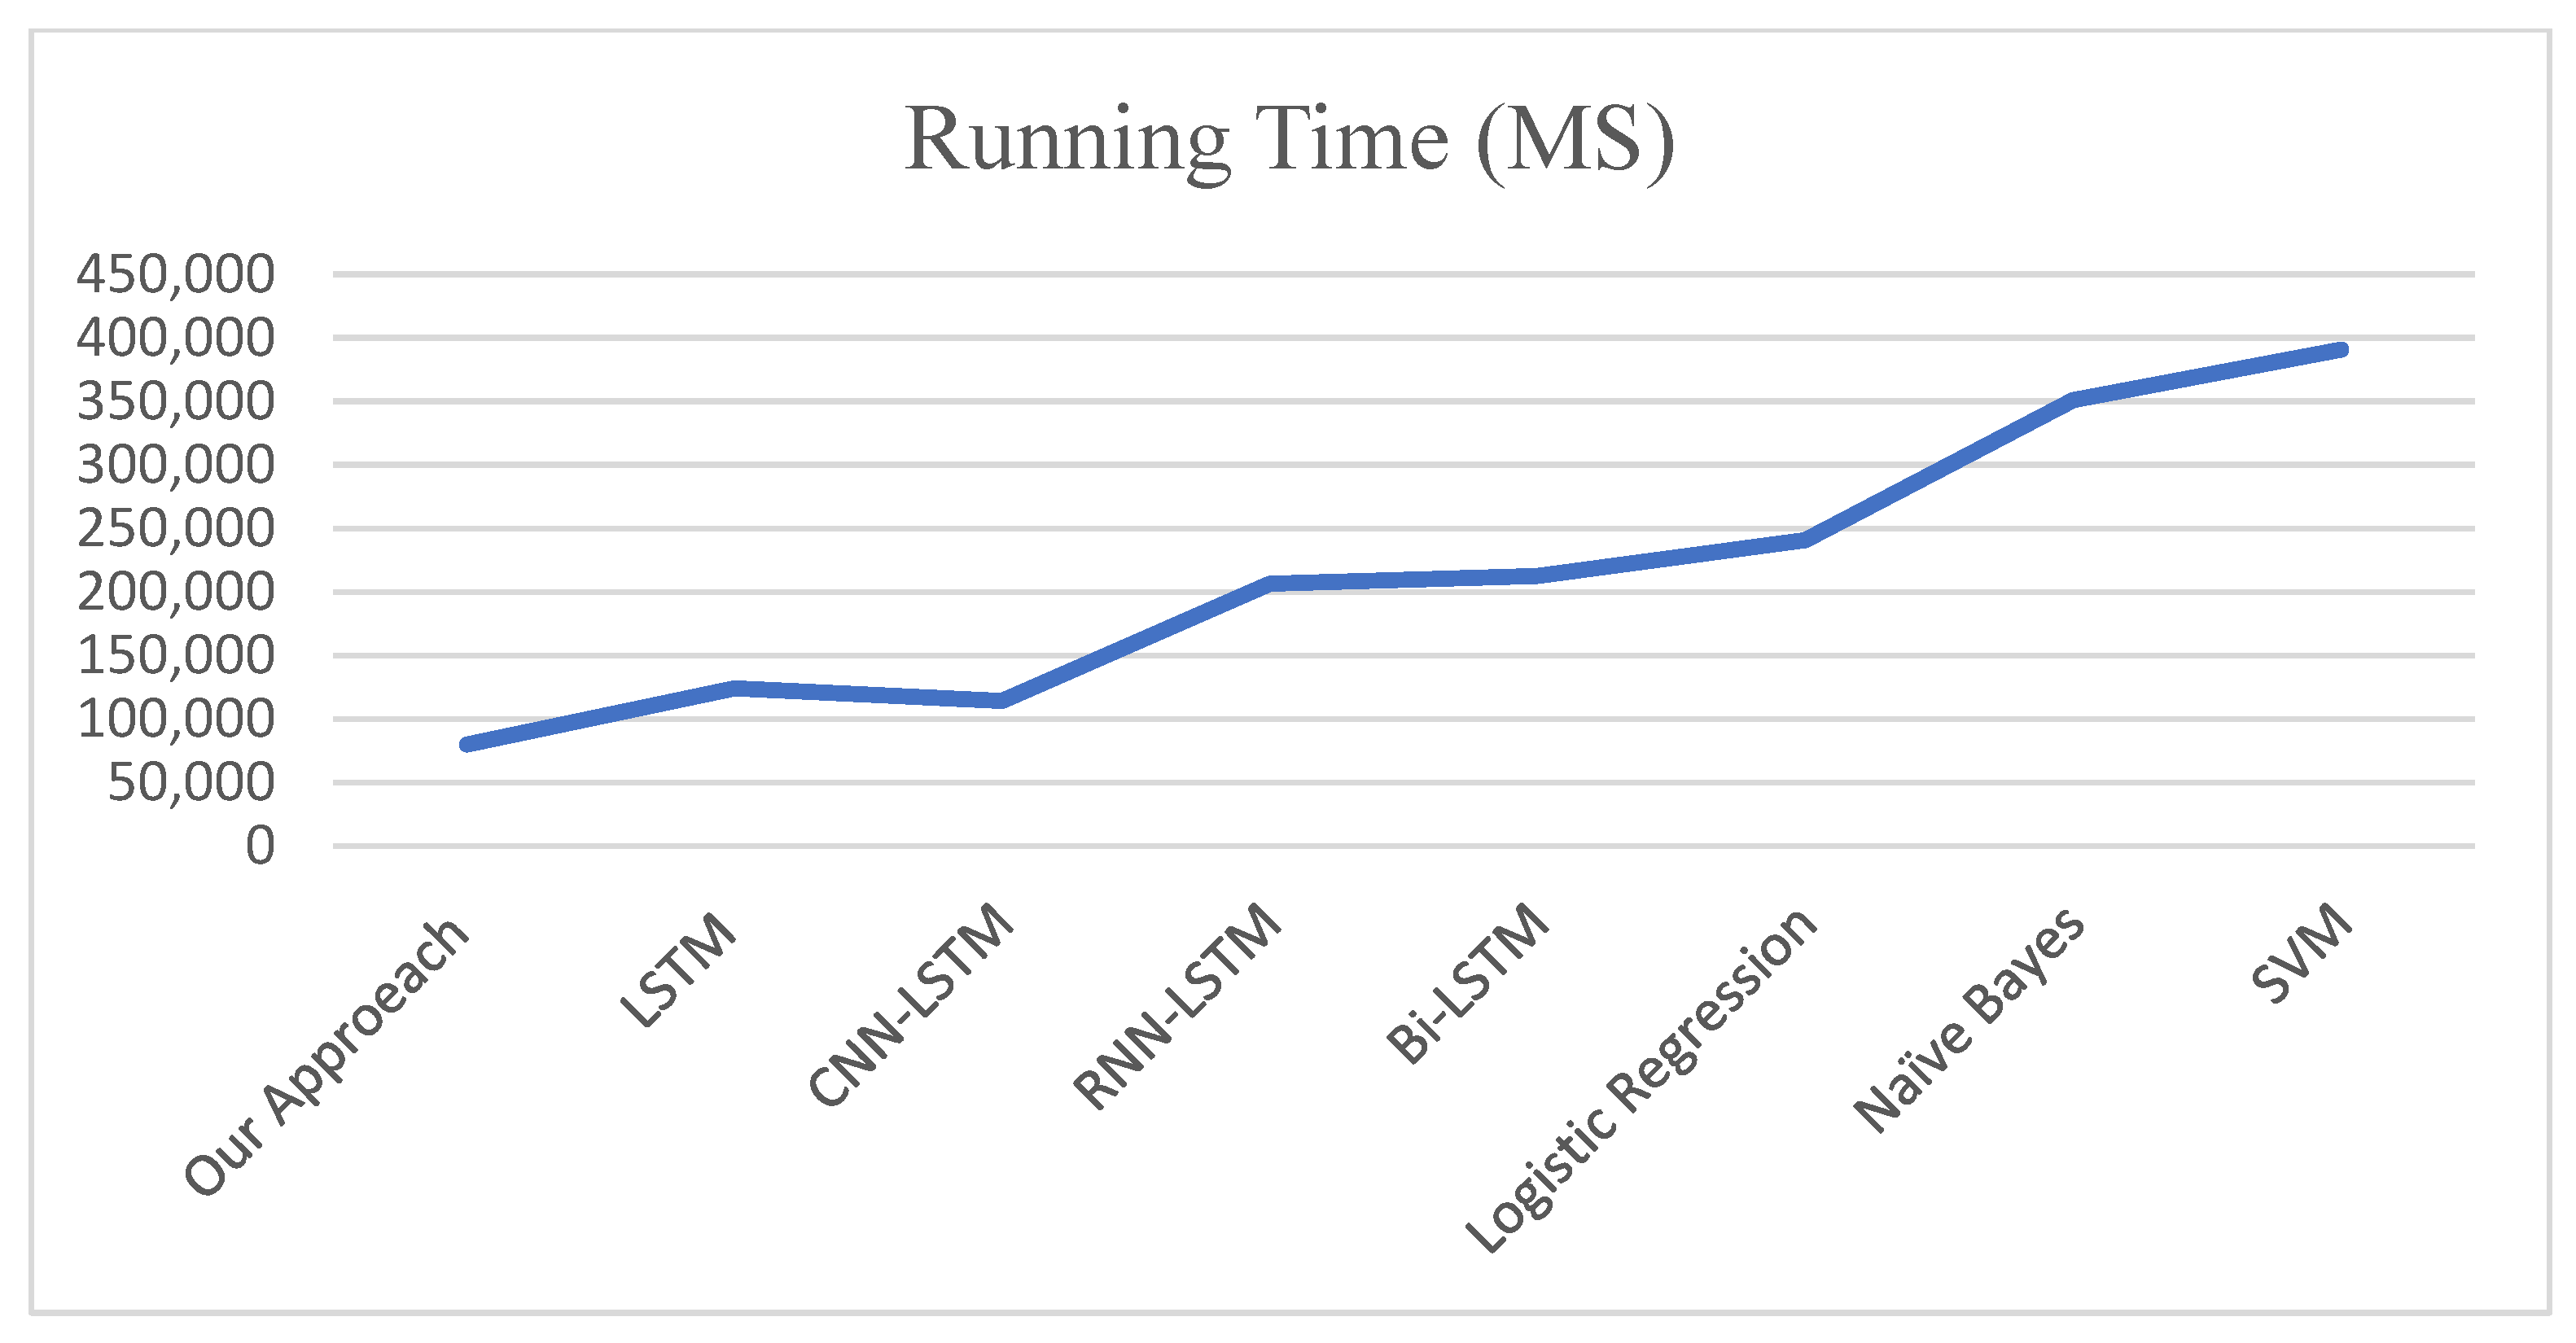
66]. In detail, the results are shown in
Figure 8. The running time was also examined for calculating the efficiency for each approach, illustrating the results in
Figure 9.
This study is aimed at measuring the attitudes, sentiments, and fake news towards COVID-19, based on the education sector, which can be tracked almost instantaneously, of two different keywords that are used in this epidemic (COVID-19 and E-learning). The patterns of connectivity are required between very positive, positive, neutral, negative, and very negative labels, related to people’s opinions, especially when the people try to evaluate the learning techniques (detail is presented in
Figure 10). The second dataset experimented on was based on our proposed model and comparisons with other classification approaches. This experiment will help researchers and other people easily detect between fake and true news, see
Table 4.
In the second experiment, we applied precision, recall, F-measure, and accuracy as evaluation measures. A confusion matrix was used to calculate these measures, where:
The false negatives (FN) represented the data that were forecasted as not fake but were fake.
The false positives (FP) were the data that were forecasted as fake but were non-fake.
The true negatives (TN) represented the data that were forecasted as not fake and were non-fake.
The true positives (TP) were the data that were forecasted as fake and were fake.
The following metrics were used:
Precision, which is the percentage of news that is successfully detected as fake out of all fake (good) news, is shown as follows, in Equation (14).
Recall, which is the model sensitivity, means how the technique can recognize the positive examples (phony) of news, and can be calculated according to Equation (15).
To calculate the F-measure by using the weighted average of the precision and recall measures, we provide Equation (16).
The ratio of properly diagnosed non-fake and fake news incidents overall correctly and incorrectly categorized cases is known as accuracy. Equation (17) is the accuracy equation.
6. Discussion
This research examined a long period of information based on sentiments and topics, by focusing on the debates in the education sector during the COVID-19 pandemic on Twitter, from 20 December 2020 to 20 October 2021, when all the education institutes transferred from conventional learning to the online teaching system.
Our proposed, semi-supervised technique uses a Word2Vec pre-trained model and LSTM, with attention making them into a hybrid model, ELM-LSTM-EA. We evaluated our model on the Twitter datasets related to vaccines, to measure the data on the attitudes and sentiment towards COVID-19 for E-learning. The dataset created was extracted from the Twitter text corpus, with COVID-19, education, online learning, E-learning, teachers, and students as keywords. A gold standard dataset based on tweets was also constructed, with very positive, positive, neutral, negative, and very negative as labels. Using these labels, we classified each of the documents into one of the categories corresponding to the label classes. The fusion of multi-level features related to the online education text domain, which includes the sentence score, sentiment shifter rules, sentiment knowledge, medical concept, word and sentence embedding, linguistic, and statistical knowledge.
Promising results based on the proposed model, when compared with state-of-the-art methods in the literature, using the metrics of F1, recall, precision, and accuracy were achieved. Equation 10 was used to examine the improvement in percentage when compared (SA-CD19-EL) with other methods; the results are +35.8, +33.6, +32.4, +32.5, +26.5, and +21.4, SVM, Naïve Bayes, Logistic Regression, Bi-LSTM, RNN-LSTM, CNN-LSTM, and LSTM, respectively. The proposed model also outperformed other methods using different testing and training ratios, and with two keywords, COVID-19 and E-learning; the accuracies based on data set evaluation are 0.878 and 0.945, respectively.
ELM was used in this study. Its inherent capability to model complex phenomena and fast training, and the combination of the weighted method and feature selection that was applied in our study, has resulted in better accuracy in the case of the imbalanced dataset because traditional classifiers are biased towards the majority class and are not useful in the case of imbalanced datasets. The chosen features are more compatible and robust with the ELM configuration, as seen in
Figure 8.
The computational complexity of generating the threshold for our model is determined based on how the list of sentences was transformed into a list of features, which was then applied to select testing and training segments. If there are 100 sentences in each vaccine category, the computational complexity, a function of the total sentence number in all the vaccines, is a factor of 100, but if we extract the gist of each sentence by using a few sentences based on a list of features, then the model complexity, as well as the density of the resultant classifier’s accuracy, is increased to a greater extent when compared with the gold standard dataset.
Furthermore, this paper applied a pre-trained Word2Vec model, extended the list of features, examined five classes, and tested different sizes of lexicons. The proposed approach is faster than other existing approaches, as explained in the time complexity section. This led us to apply our proposed model for experiments in other available datasets to test the attitudes, sentiment, and fake news towards COVID-19, within an online teaching system based on assigning labels as very positive, positive, neutral, negative, and very negative.
We conclude that applying a vector space model increases the number of robust features, and using the lexicon and applying novel statistical techniques to build lexicon in a specific domain produced better results than existing approaches, even when we applied the same classifier model compared with our previous work.
7. Conclusions and Future Work
In this study, we aimed to identify the sentiments and major topics about E-learning relating to the COVID-19 pandemic that have been raised on social networks, namely Twitter. The E-learning with COVID-19 discussion on Twitter was mainly driven by online teaching and has been the subject of numerous news stories recently and reflected the hot new themes across the majority of social media. Natural Language Processing is a sub-category of machine learning problems, which is considered challenging, with no gold standard algorithm that can be used efficiently for all NLP problems. To evaluate the data on the attitudes, sentiments, and fake news towards the COVID-19 textual dataset, we developed a novel method using the fusion of both unsupervised (association rules, Word2Vec, and SV-BOW), denoising AutoEncoder and semi-supervised (extreme machine learning AutoEncoder), with an attention mechanism. The phrase frequency, sentence score, sentiment shifter rules, sentiment knowledge, medical concept, word and sentence embedding, linguistic, and statistical knowledge, were applied as a set of features, which resulted in improved accuracy. Additionally, from the lexicon, we have identified the most relevant set of features related to our dataset. Our proposed approach obtained good performance, in terms of F1 measure, precision, recall, and accuracy, when compared with traditional state-of-the-art methods. Our approach outperformed other approaches based on the utilization of an SA technique, which was used to examine the attitudes, sentiments, and fake news towards COVID-19 that can be tracked almost instantaneously as a subjective corpus. The results show that combining data balance with SMOTE improves classification accuracy. Moreover, the ELM-AE as a classifier method, with five classes (very positive, positive, neutral, negative, and very negative) has a greater capability for exploring an aspect of feature set learning and has a reduced time complexity, which is encouraging for suggesting this approach as a promising machine learning method for complex data.
For future works, we propose more effective feature extraction approaches and feature fusion, for providing more efficient and relevant information using sentiment analysis. Our future objective will be to enhance the current model and examine further modalities, including images, videos, and audio, as a multimodal model.


