Article

Features and Always-On Wake-Up Detectors for Sparse Acoustic Event Detection

Faculty of Electrical Engineering and Computing, University of Zagreb, 10000 Zagreb, Croatia
*
Author to whom correspondence should be addressed.
Electronics 2022, 11(3), 478; https://doi.org/10.3390/electronics11030478
Submission received: 31 December 2021 / Revised: 2 February 2022 / Accepted: 4 February 2022 / Published: 6 February 2022
(This article belongs to the Special Issue Smart Sensing, Monitoring, and Control in Industry 4.0)

Abstract

:
The need to understand and manage our surroundings has led to increased interest in sensor networks for the continuous monitoring of events and processes of interest. To reduce the power consumption required for continuous monitoring, dedicated always-on wake-up detectors have been designed, with an emphasis on their low power consumption, simple and robust design, and reliable and accurate detection. An especially interesting application of these wake-up detectors is in detecting acoustic signals. In this paper, we present a study on the features and detectors applicable for the detection of sporadic acoustic events. We perform a state-of-the-art acoustic detector analysis, grouping the detectors based on the features they utilize and their implementations. This analysis shows that acoustic wake-up detectors predominantly utilize spectro-temporal (56%) and temporal features (36%). Following the state-of-the-art analysis, we select two detector architecture candidates for a case study on passing motor vehicle detection. We utilize our previously developed spectro-temporal decomposition detector and develop a novel level-crossing rate detector. The results of the case study shows that the proposed level-crossing rate detector has lower component count (44 compared to 70) and power consumption (9.1 µW compared to 34.6 µW) and is an optimal solution for SNRs over 0 dB.

1. Introduction

The growing need to better understand and manage our surroundings has led to increased interest in the continuous monitoring of events and processes, utilizing sensor networks consisting of hundreds or thousands of small, robust sensor nodes [1,2,3,4]. However, having a complex system continuously monitoring for events of interest consumes a lot of power [5,6]. To reduce this power consumption, dedicated always-on low-power wake-up detectors have been designed that wake up the more complex circuits with higher power consumption only when an event of interest is detected [3,7]. Such detectors determine the presence of event candidates by performing low-power extraction and analysis of the sensor signal’s features [8,9,10,11].
The key emphasis in the design of wake-up detectors is on low power consumption, cheap, simple design, and accurate detection [7,11,12,13,14] to ensure low false detection rates, even in the most adverse conditions, as false event detections increase the overall system’s power consumption by causing unnecessary activations of the main stage.
Wake-up detectors are often employed in acoustic event recognition because acoustic signals contain a lot of easily extracted information [15,16,17]. Because of this, they have been utilized in many fields, including safety and security [5,18,19,20,21], biomedical and health monitoring [22,23,24], environmental monitoring [12,25,26,27], Internet of Things (IoT) applications [2,8], structural health monitoring, non-destructive testing and machinery diagnosis [24], speech or voice activity detection [24,28,29,30,31,32,33], and others.
In this paper, we present a study on the signal features and wake-up detector architectures applicable for the detection of sporadic, rarely occurring transient acoustic events that appear in the lower end of the acoustic spectrum (up to a few kHz), such as passing motor vehicles.
Our contributions include a review of the state-of-the-art (SOTA) acoustic detectors, the selection of detector architectures of interest, and a comparison of their performance in a case study of motor vehicle (speedboat) detection. A dditionally, we develop a novel implementation of a level-crossing rate acoustic wake-up detector and analyze its performance.
The rest of the paper is organized as follows. Section 2 details the SOTA acoustic wake-up detector analysis. Stemming from the SOTA analysis, in Section 3, the detector selection is performed, and the principles of operation and generalized block schematics of the selected detectors are presented. In Section 4, a case study experiment is presented to evaluate the performance of the selected detectors in the detection of passing motor vehicles. Section 5 concludes the paper and presents future work.

2. State-of-the-Art Acoustic Wake-Up Detector Analysis

2.1. Methodology

To select the applicable detectors, we perform an analysis of SOTA acoustic wake-up detectors. We explore detector implementations, feature extraction domains (analog, digital, or mixed), power consumptions, and detection accuracies (true and false positive rates). The detector implementation is divided into embedded and integrated, and both are further divided into analog, digital, and mixed-signal detectors. The embedded implementations utilize commercial off-the-shelf (COTS) components, while the integrated implementations are custom-made.
In this analysis, we group the detectors by the acoustic signal features they utilize. To enable this grouping, we devise a feature categorization (Table 1) by analyzing the literature on acoustic signal features [34,35,36]. While a detailed description of each feature used in acoustic event detection would go beyond the scope of this paper, readers interested in a more detailed explanation of any mentioned feature can find detailed explanations in the literature focused on acoustic feature analysis [34,35,36].

2.2. Results

As we can see from the results of the SOTA acoustic wake-up detector analysis (presented in Table 2), six of the categorized acoustic feature subgroups are used in power-constrained wake-up detector event detection.
The spectro-temporal decomposition feature subgroup implies the filtering of the input signals into sub-bands, and the continuous extraction of each sub-band’s feature of interest (envelope, energy, power, root mean square (RMS)). After extraction, the feature values are quantified and converted into a binarized spectro-temporal template. A classifier determines this template’s resemblance to a preset template, defined by the event of interest. These detectors are usually implemented as mixed-signal detectors, with feature extraction and processing performed in the analog and classification in the digital domain.
The level-crossing rate feature subgroup entails converting the input signal’s crossings of a predefined level into pulses of fixed length and amplitude, estimating the number of those pulses in a defined time interval, quantifying it and, therefore, quantifying the level crossing rate and determining if it is within the bounds of level-crossing rates specific for the event of interest. These detectors are usually implemented fully digitally, but they can also be implemented completely in the analog domain.
The correlation subgroup requires the input signal to be compared to a delayed version of itself (autocorrelation) or to a preset template representing the event of interest (cross-correlation). Autocorrelation can also be employed to estimate the input signal’s spectral content by examining and locating the local maxima of the autocorrelation function, which appear at delay times equal to periods of the input signal’s dominant spectral components. These detectors are usually implemented as digital, because of the impracticality of the analog implementation of some required elements, such as delay lines or memories for storing templates.
The short-time energy feature subgroup implies measuring the input signal’s energy in short time windows and comparing it to a preset template. While the SOTA detector utilizing this feature subgroup ([31]) is implemented as digital, a mixed-signal implementation similar to the spectro-temporal decomposition could also be considered.
The spectral shape feature subgroup requires the signal spectrum to be determined, and then for certain parameters of its shape to be examined and quantified. To obtain a detailed enough spectrum representation, these detectors must be implemented as digital.
The cepstral coefficients entail estimating the signal’s spectrum, calculating the logarithm of the spectral amplitude, and then performing the discrete cosine transformation on it, generating a cepstrum. The amplitudes of the cepstrum peaks represent cepstral coefficients. Detectors utilizing these features can be implemented as mixed-signal detectors, employing analog domain filtering specific for the cepstral coefficients of interest, followed by digital domain cepstral coefficient estimation.

2.3. Discussion

As can be seen from Table 2, most acoustic wake-up detectors utilize spectro-temporal (56% of all analyzed detectors) and, to a lesser extent, temporal features (36% of all analyzed detectors). Furthermore, of those detectors, spectro-temporal-decomposition-based (61%), level-crossing rate-based (17%) and correlation-based (13%) detectors constitute the majority.
Next, we can see that the integrated custom designs account for 68% of all analyzed wake-up detector designs, while embedded implementations utilizing COTS components constitute around 32%.
There is approximately the same number of detectors that extract the features in the analog and digital domains, with only a few detectors extracting features in both domains simultaneously (8%).
Acoustic wake-up detectors have high detection accuracies (over 90% true positives and under 15% false positives, where stated) and their power consumptions vary from around 10 nW to around 600 µW, greatly depending on the detector implementation and utilized feature. Integrated mixed-signal and digital spectro-temporal decomposition detectors can reach sub-µW power consumptions, while embedded level-crossing rate detectors reach tens or even hundreds of µW.

3. Wake-Up Detector Selection

3.1. Criteria

Motivated by the passing motor vehicle use case scenario, we aim to develop a wake-up detector of sporadic, transient acoustic events, lasting for several seconds, with the bandwidth spanning up to 2 kHz.
We focus on wake-up detector architectures implementable with COTS components, operating on analog-domain signals, designed for direct interfacing with acoustic sensors with little or no amplification, and avoiding power-hungry analog-to-digital (AD) conversion [16]. Hence, the detector should be able to reliably operate with weak electric input signals (on the order of 10 mV).
Finally, a wake-up detector must have high detection accuracy, both in terms of high true positive rates, as a detector should not miss events, and low false positive rates, as false detections lead to wasting power due to unnecessary activations of the power-hungry main stage.

3.2. Results

As we can see from Table 3, wake-up detectors utilizing level-crossing rate and spectro-temporal decomposition meet all our selection criteria.

3.3. Selected Detectors

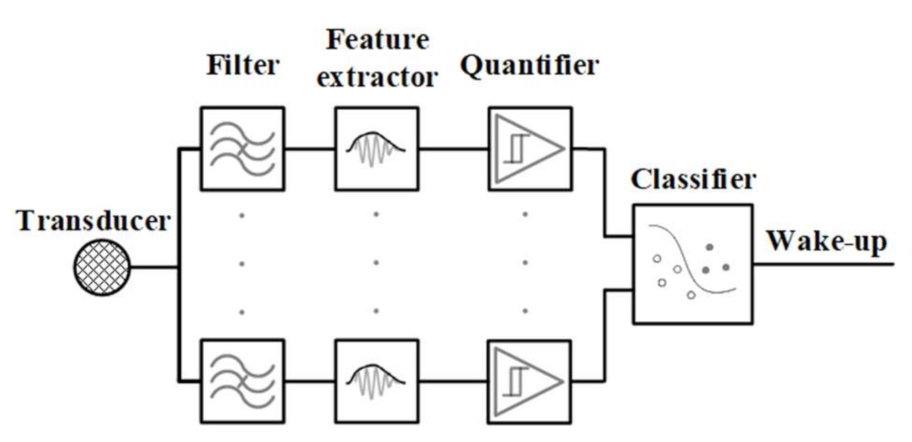
3.3.1. Spectro-Temporal Decomposition

The generalized architecture of the spectro-temporal decomposition wake-up detector is shown in Figure 1.
The spectro-temporal decomposition detector consists of a filter for spectral decomposition, a feature extractor, a quantifier for quantifying the extracted features, and a classifier to determine if the input signal is from an event of interest. It is usually implemented with multiple channels.

3.3.2. Level-Crossing Rate

The level-crossing rate wake-up detector general architecture is shown in Figure 2.
The level-crossing rate detector consists of a level-to-pulse converter that detects level crossings and converts them into pulses, a pulse rate estimator for estimating the level-crossing rate, and a quantifier for quantifying the level-crossing rate. It is usually implemented as a single-channel detector.

4. Motor Vehicle Passing Detection

In this section, we present a case study in which we evaluate the performance of the two selected detectors in the detection of passing motor vehicles through the analysis of their power consumption, minimal input voltage, detection accuracy, and component count (estimate of hardware complexity).

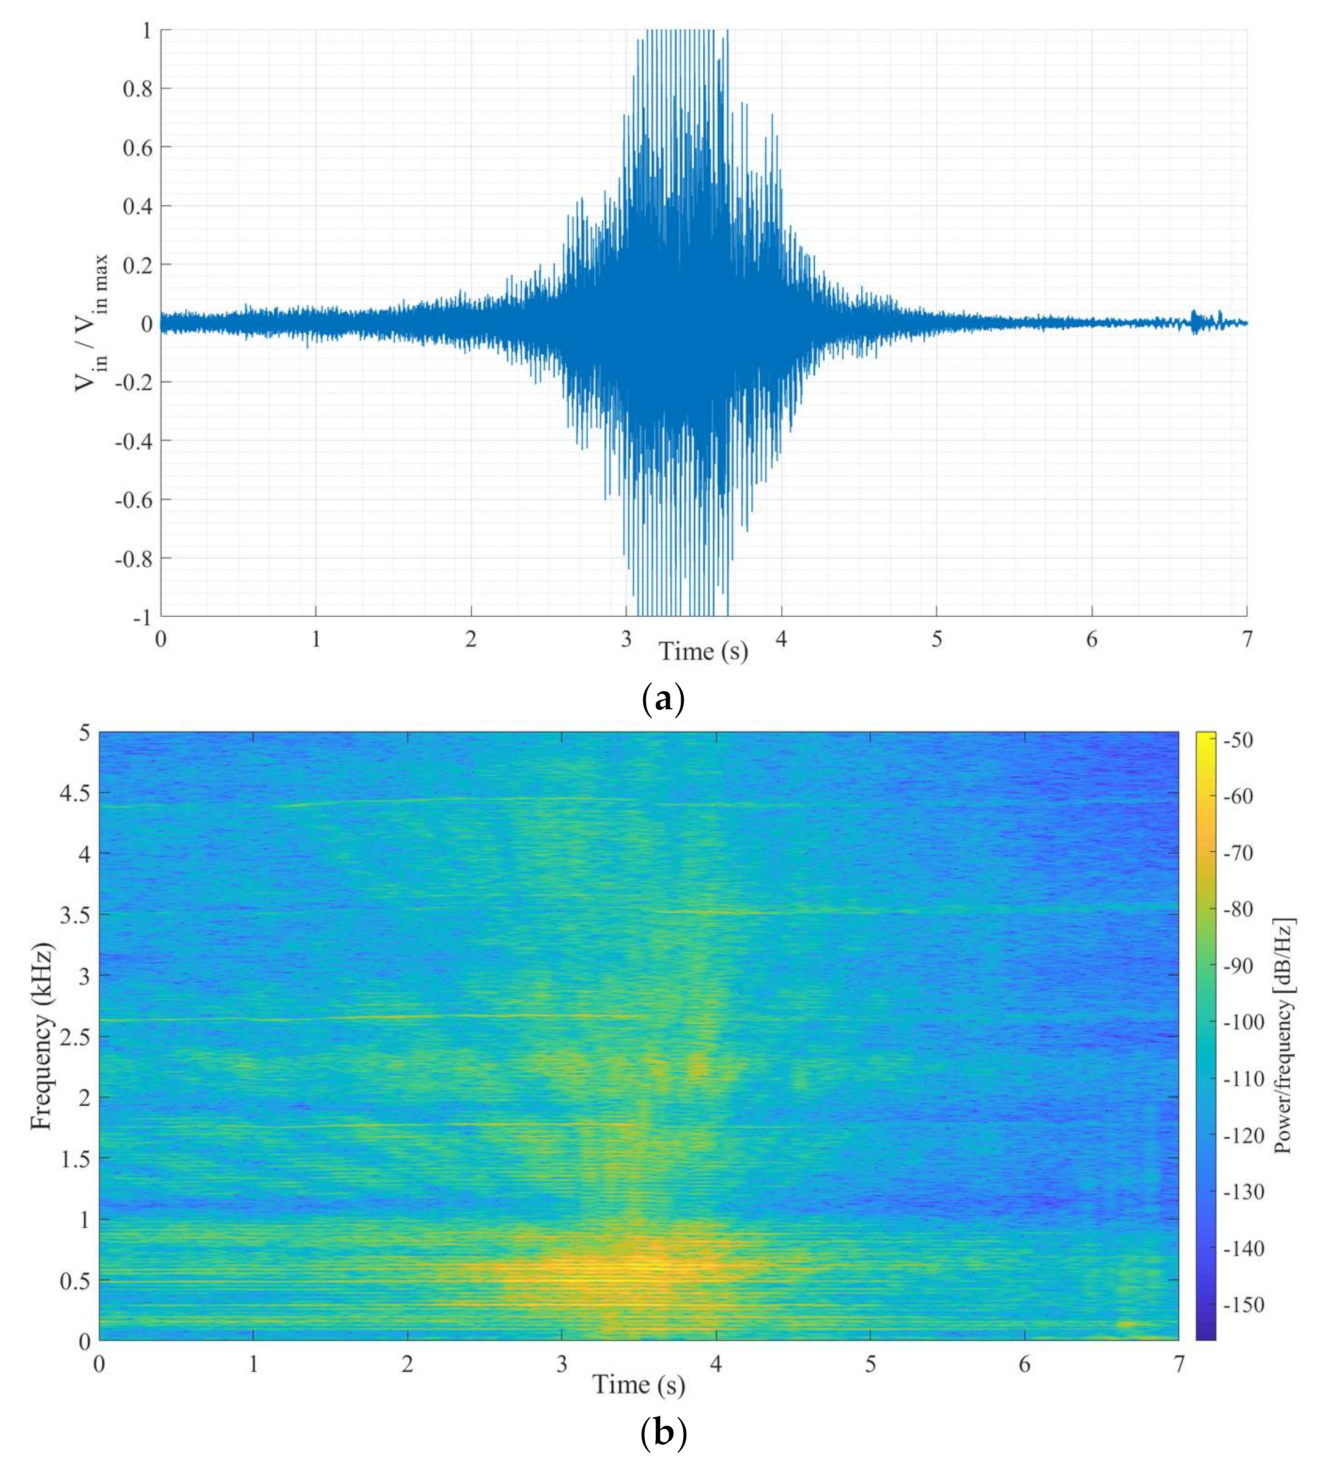
4.1. Motor Vehicle Passing Event and Signal

For our dataset, we used 11 prerecorded signals of a twin-engine speedboat passing over a hydrophone submerged approximately 1 m under the surface in shallow water [50]. A representative signal and its spectrogram are shown in Figure 3a,b, respectively.
In case of the wake-up detector utilizing spectro-temporal decomposition, the passage of the speedboat can be detected by detecting and tracking the duration of the presence of the signal in the characteristic frequency band (e.g., 100 Hz to 1 kHz for typically 0.5–5 s). On the other hand, a similar type of information is obtained by the level-crossing wake-up detector by tracking the rate at which the signal passes a predefined level in a set time interval.

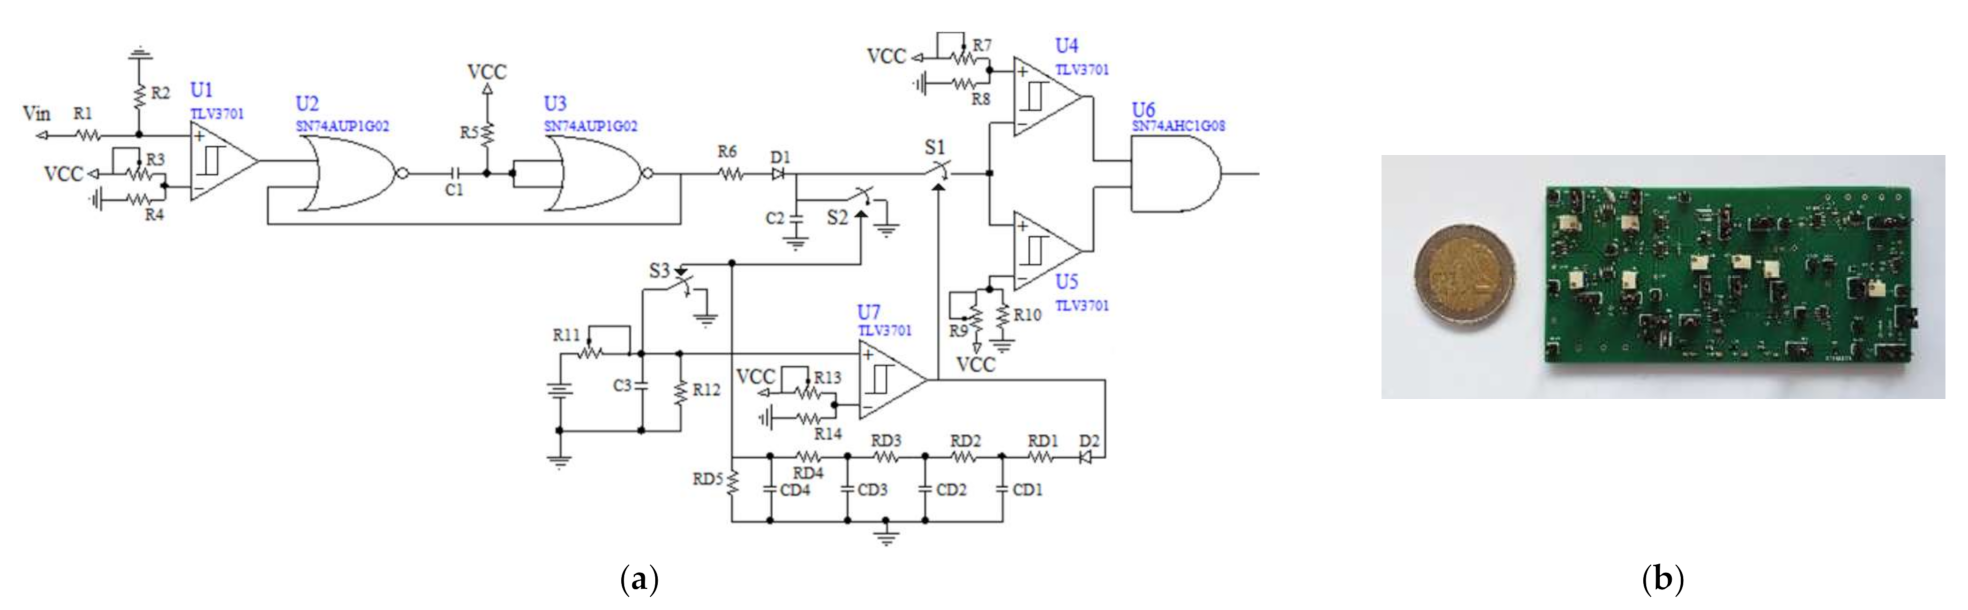
4.2. Detector Implementations

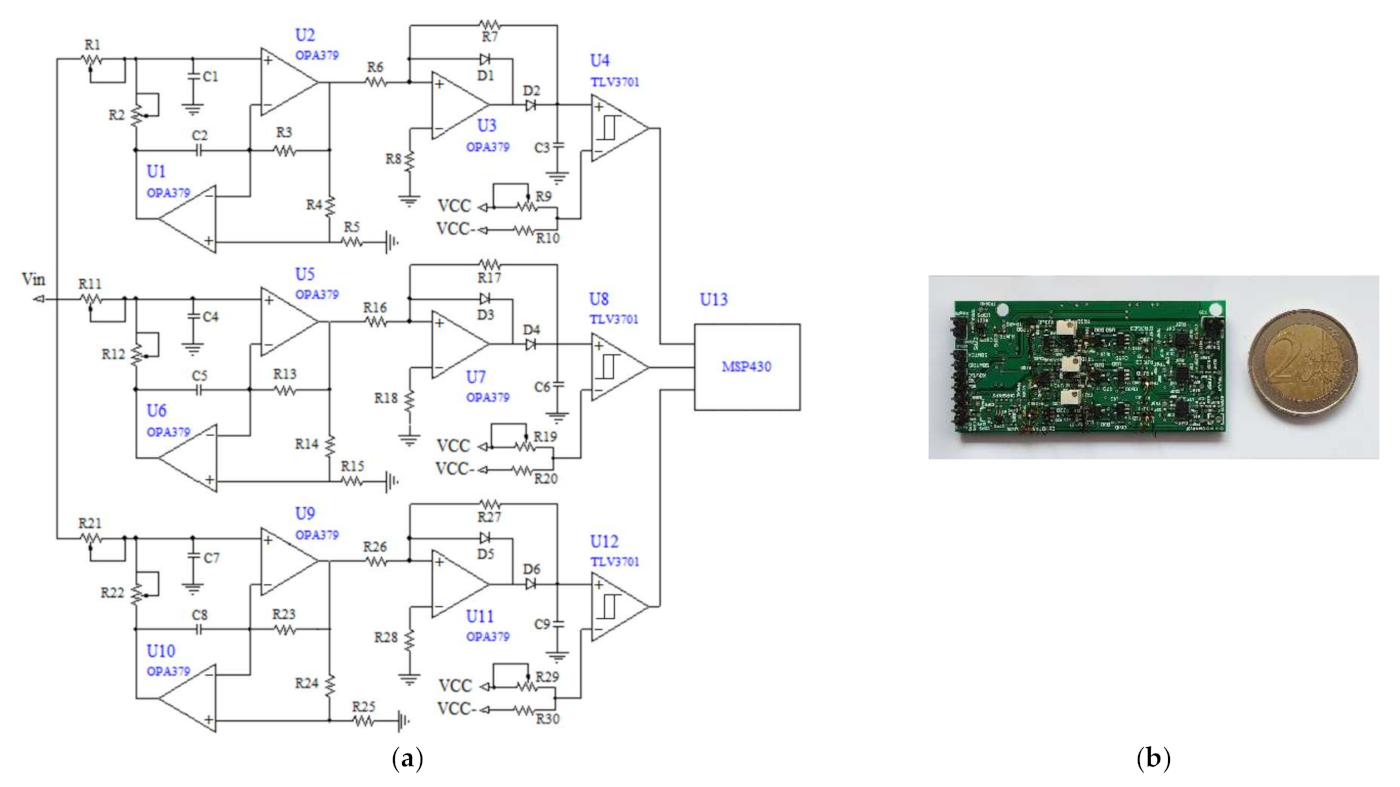
4.2.1. Spectro-Temporal Decomposition Detector Implementation

We utilize an embedded spectro-temporal decomposition detector that we first presented in [38] (schematic and photograph shown in Figure 4).
As can be seen from Figure 4a, the implemented detector consists of three channels. Each channel extracts information on signal presence within its frequency band. Each channel filters the input signal by a digitally programmable active bandpass filter in the general impedance converter (GIC) topology, implemented with two MCP6142 operational amplifiers. The first channel spans the frequency range from 200 Hz to 500 Hz, the second from 500 Hz to 1 kHz, and the third from 1 kHz to 2.5 kHz. The central frequency and bandpass are programmable (within set limits) in 256 steps by digitally adjustable AD5144 potentiometers.
After filtering, the envelope is extracted utilizing an active voltage doubler, consisting of an MCP6141 operational amplifier and two diodes. The envelope is then quantified using a TLV3701 comparator, with a digitally adjustable threshold, adjusted by another AD5144 potentiometer.
Classification is implemented by binary template matching. A template representing the signal of interest is programed into an MSP430F2013 low-power microcontroller, which also implements a three-channel digital sequence recognition state machine. If the spectro-temporal envelopes’ relations match the predefined template, a wake-up signal triggers a more power-hungry digital audio signal processing stage. To achieve this, the microcontroller implements a state machine, which in each state S0, …, Sk compares the binary outputs of the three comparators to the prestored three-channel template. The change from S0 to S1 is asynchronous, and occurs upon the first change of comparator state (started by an interrupt), while S1 to Sk each last 0.5 s up to the maximal sequence length. A more detailed explanation on the basics of the state machine implementation can be found in [9]. For this experiment, the sequence either ends without a wake-up after 7 s (in S14) if there is no template match, or with a wake-up signal if all three channels’ comparators are simultaneously in a high state for a duration between 0.5 s and 4 s (preset template). This sequence description leads to the state machine implementation with states S0 to S14. The state machine functionality is also illustrated in Figure 5.

4.2.2. Level-Crossing Rate Detector Implementation

We developed and utilized a novel embedded level-crossing rate detector, which is an adapted version of a similar detector presented in [13] (schematic and photograph shown in Figure 6).
The level-crossing detector consists of three main parts. In the first part, each level-crossing is detected with a TLV3701 comparator. The level is set by adjusting the comparator threshold and, for this experiment, it is set to 2.2 mV. Every time the comparator output changes to a high state, a monostable (consisting of two SN74AUP1G02 NOR gates) is triggered to generate a fixed-length pulse. These pulses are summed by a passive RC circuit, whose output, thus, represents the number of level crossings.
The second part is the timer that consists of a capacitor connected to a TLV3701 comparator with an adjustable threshold. The capacitor is charged by a fixed voltage source over a trimmer resistor. The trimmer resistor and comparator threshold values determine the capacitor charge time, which is set to around 600 ms for this experiment. When the capacitor voltage reaches the comparator threshold, the comparator output changes and closes the S1 switch (TMUX1101) to propagate the RC circuit voltage to the final detector part. After an interval determined by the delay line, the reset switches S2 and S3 (TMUX1101) of the RC circuit and the timer close, allowing their capacitors to discharge to the ground. During the reset, the switch S1 opens, disconnecting the RC circuit from the final detector part. After the RC circuit and timer resets are complete, the reset switches open, and a new level crossing counting interval starts. For this experiment, the delay of the reset signal is set to around 5 ms.
The final part consists of two TLV3701 comparators with adjustable thresholds and an AND logic gate. If the RC circuit voltage is both higher than the lower threshold and lower than the higher one, the level-crossing rate is within the set bounds, an event of interest is detected, and a wake-up pulse is generated at the AND gate output. For this experiment, the lower and upper bounds are set to 100 mV and 625 mV, respectively.

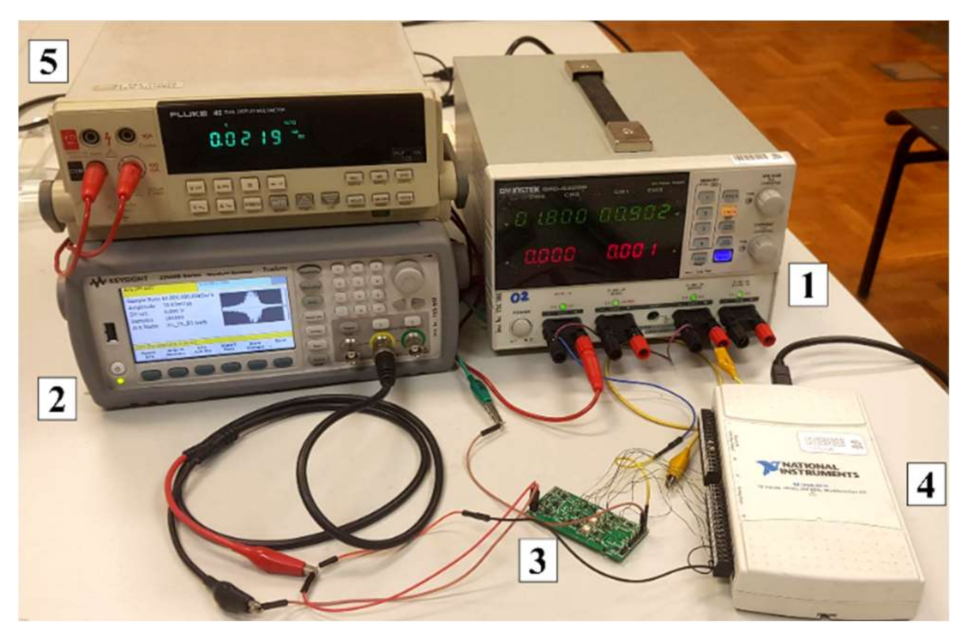
4.3. Experimental Setup and Procedure

4.3.1. Experimental Setup

The experimental setup utilized in this case study is shown in Figure 7.
The experimental setup (Figure 7) consists of a GW INSTEK GPD-4303S power source (1), a Keysight 33500B waveform generator (2), the tested detector PCBs (spectro-temporal decomposition or level-crossing rate detector) (3), a National Instruments USB-6211 data acquisition card (4), and a Fluke 45 multimeter (5).

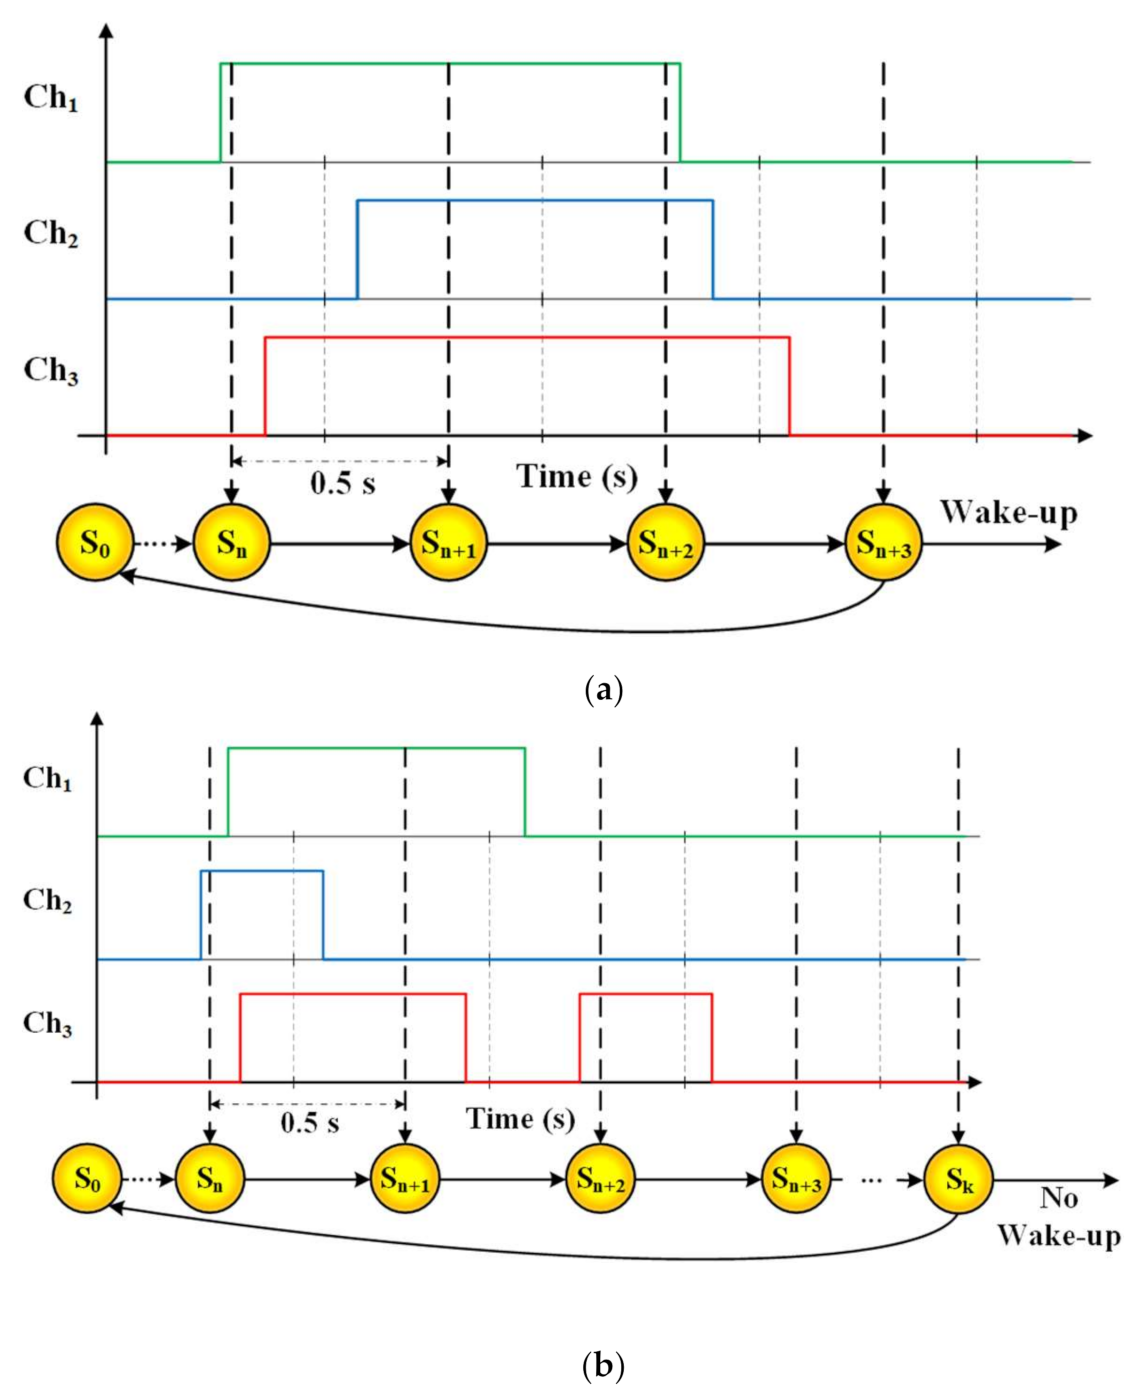
4.3.2. Experimental Procedure
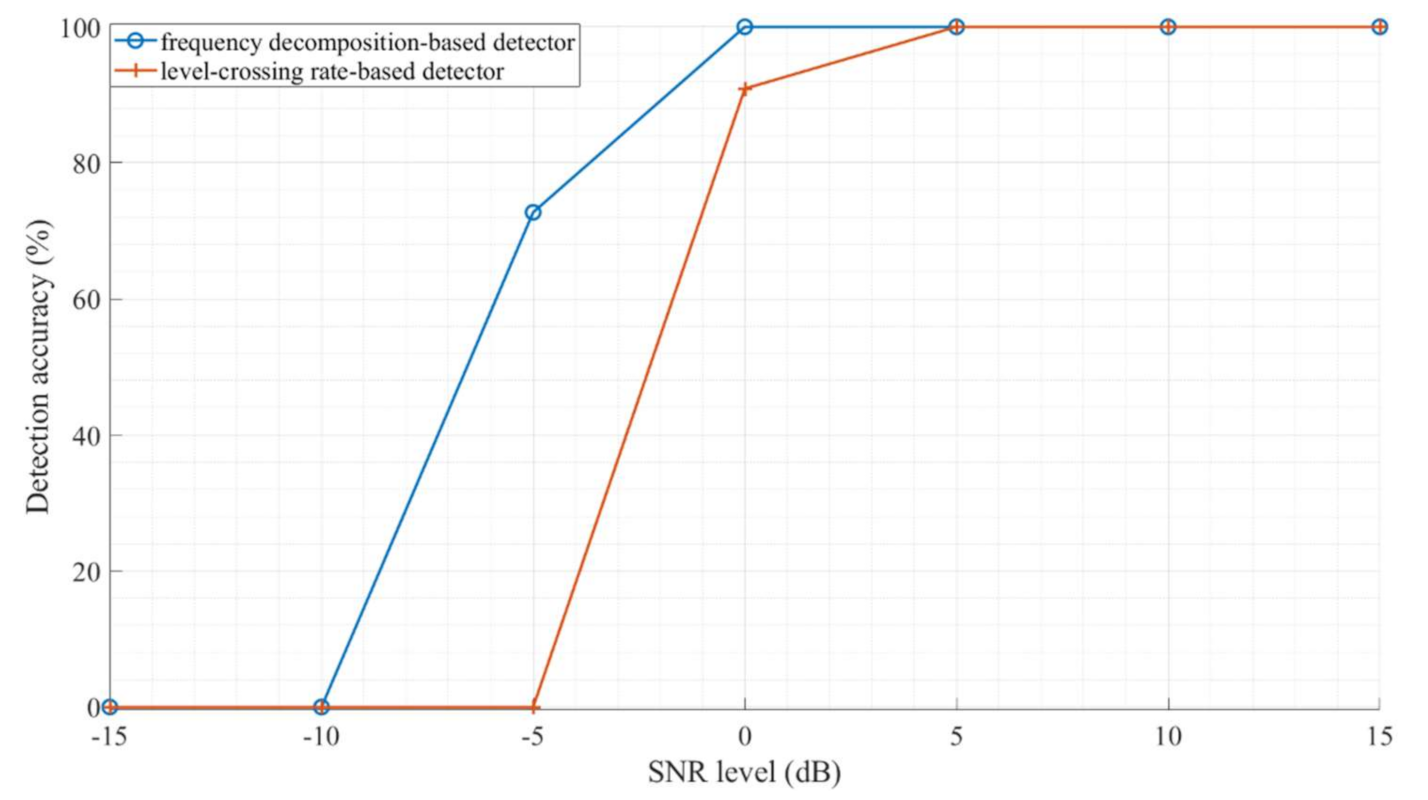
The prerecorded speedboat signals were processed in MATLAB, cropped to a duration of 7 s, and then attenuated to determine the lowest input signal with which each detector is operational. Then, for the detection accuracy test, the input signals are scaled to 10 mV and 20 mV peak-to-peak for the level-crossing and spectro-temporal detector, respectively. This voltage scaling adjusts the input signal peak-to-peak voltages to adequately represent the signals generated by passing speedboats on passive hydrophones. Additionally, both detectors are operational with higher voltage levels, with threshold adjustments. However, if the approximate expected voltage levels are not known for a given application, or the input signal dynamic range would expectedly exceed around 40 dB, an additional automatic gain control (AGC) amplifier would have to be added to each detector’s input to ensure correct operation.
To compare the performance of the two wake-up detectors, different levels of white noise were added to each signal to achieve signal-to-noise ratio (SNR) levels from −15 dB to 15 dB with a 5 dB step. Such signals were then stored in the waveform generator used as a signal source for the detectors. The detector outputs are recorded by a data acquisition card, and the recordings are processed using MATLAB.
For the spectro-temporal detector, a successful wake-up was recorded when its comparator outputs matched the predefined binary template and the detector generated a wake-up signal. On the other hand, for the level-crossing rate detector, successful detection is recorded if the RC circuit capacitor voltage was within predefined bounds, generating a wake-up signal.
The detector’s power consumption was assessed by measuring its supply current (using a multimeter) and multiplying it with the detector’s supply voltage, consumed in the steady state, while listening for the acoustic event.

4.4. Results

In Table 4 and Figure 8, we present the case study results, showing each detector’s power consumption, minimal input voltage, component count, and detection accuracy.
As we can see from Table 4 and Figure 8, the level-crossing rate detector has a significantly lower component count and would require around a 40% smaller area to implement (hardware complexity), has lower power consumption, and is operational with lower input voltages, while the spectro-temporal detector has slightly better performance with low-SNR signals, being operational even with −5 dB SNR, as opposed to the level-crossing rate one, which requires at least an SNR of 0 dB for the examined implementation.

5. Conclusions

In this paper, we presented a study on low-power always-on sporadic acoustic event wake-up detector designs. To determine the employable detectors and features for this application, we performed a SOTA acoustic wake-up detector analysis, which showed that most acoustic wake-up detectors utilize spectro-temporal (56%) and temporal features (36%), and that the dominant detector implementation is integrated custom-made detectors (68%). Following the SOTA analysis, we presented criteria and selected spectro-temporal decomposition and level-crossing rate as features that allow for the design of a low-power, embedded, always-on wake-up detector operating in the analog domain. These two wake-up detector designs were compared on a case study on passing marine motor vehicle detection. This case study showed that the level-crossing rate detector can be made with a significantly lower component count (44 compared to 70) and power consumption (9.1 µW compared to 34.6 µW), but a slightly narrower SNR range of operation (minimum of 0 dB SNR compared to −5 dB) than the spectro-temporal detector. In future work, the possibilities of utilizing features not utilized previously in wake-up detectors will be examined, and a more detailed study of the novel level-crossing rate detector will be performed.

Author Contributions

Conceptualization, M.G., D.O. and V.B.; data curation, M.G.; funding acquisition, V.B.; investigation, M.G.; methodology, M.G. and V.B.; project administration, V.B.; supervision, V.B.; validation, M.G.; visualization, M.G.; writing—original draft, M.G., D.O. and V.B. All authors have read and agreed to the published version of the manuscript.

Funding

Croatian Science Foundation, project: IP-2016-06-8379, SENSIRRIKA. Office of Naval Research Global, project: ONRG-NICOP-N62909-17-1-2160. The work of the doctoral student Marko Gazivoda has been supported in part by the “Young researchers’ career development project—training of doctoral students” of the Croatian Science Foundation, funded by the European Union from the European Social Fund. This research has been supported in part by the U.S. Office of Naval Research Global under the project ONRG-NICOP-N62909-17-1-2160, AWAKE—ultra-low-power wake-up interfaces for autonomous robotic sensor networks in sea/subsea environments, and partially by Croatian Science Foundation under the project IP-2016-06-8379, SENSIRRIKA—advanced sensor systems for precision irrigation in karst landscape.

Conflicts of Interest

The authors declare no conflict of interest. The funders had no role in the design of the study; in the collection, analyses, or interpretation of data; in the writing of the manuscript, or in the decision to publish the results.

References

  1. Alioto, M. From Less Batteries to Battery-Less Alert Systems with Wide Power Adaptation down to nWs—Toward a Smarter, Greener World. IEEE Des. Test 2021, 38, 90–133. [Google Scholar] [CrossRef]
  2. Alioto, M. IoT: Bird’s Eye View, Megatrends and Perspectives. In Enabling the Internet of Things; Alioto, M., Ed.; Springer International Publishing: Cham, Switzerland, 2017; pp. 1–45. ISBN 978-3-319-51480-2. [Google Scholar]
  3. Goux, N.; Badets, F. Review on event-driven wake-up sensors for ultra-low power time-domain design. Midwest Symp. Circuits Syst. 2018, 2018, 554–557. [Google Scholar] [CrossRef]
  4. Zikria, Y.B.; Ali, R.; Afzal, M.K.; Kim, S.W. Next-Generation Internet of Things (IoT): Opportunities, Challenges, and Solutions. Sensors 2021, 21, 1174. [Google Scholar] [CrossRef] [PubMed]
  5. Thoen, B.; Ottoy, G.; Rosas, F.; Lauwereins, S.; Rajendran, S.; De Strycker, L.; Pollin, S.; Verhelst, M. Saving energy in WSNs for acoustic surveillance applications while maintaining QoS. In Proceedings of the 2017 IEEE Sensors Applications Symposium, Glassboro, NJ, USA, 13–15 March 2017; pp. 1–6. [Google Scholar] [CrossRef]
  6. Rovere, G.; Fateh, S.; Benini, L. A 2.2-µW Cognitive Always-On Wake-Up Circuit for Event-Driven Duty-Cycling of IoT Sensor Nodes. IEEE J. Emerg. Sel. Top. Circuits Syst. 2018, 8, 543–554. [Google Scholar] [CrossRef]
  7. Olsson, R.H.; Bogoslovov, R.B.; Gordon, C. Event driven persistent sensing: Overcoming the energy and lifetime limitations in unattended wireless sensors. In Proceedings of the 2016 IEEE SENSORS, Orlando, FL, USA, 30 October–3 November 2016; pp. 1–3. [Google Scholar] [CrossRef] [Green Version]
  8. Fourniol, M.; Gies, V.; Barchasz, V.; Kussener, E. Low-Power Wake-Up System based on Frequency Analysis for Environmental Internet of Things. In Proceedings of the 2018 14th IEEE/ASME International Conference on Mechatronic and Embedded Systems and Applications (MESA), Oulu, Finland, 2–4 July 2018; pp. 1–6. [Google Scholar] [CrossRef]
  9. Oletic, D.; Korman, L.; Magno, M.; Bilas, V. Time-frequency pattern wake-up detector for low-power always-on sensing of acoustic events. In Proceedings of the 2018 IEEE International Instrumentation and Measurement Technology Conference (I2MTC), Houston, TX, USA, 14–17 May 2018; pp. 1–6. [Google Scholar] [CrossRef]
  10. Anastasopoulos, A.A. Signal Processing and Pattern Recognition of Ae Signatures. In Experimental Analysis of Nano and Engineering Materials and Structures; Springer: Dordrecht, The Netherlands, 2007; pp. 929–930. [Google Scholar] [CrossRef]
  11. Jensen, U.; Kugler, P.; Ring, M.; Eskofier, B.M. Approaching the accuracy–cost conflict in embedded classification system design. Pattern Anal. Appl. 2016, 19, 839–855. [Google Scholar] [CrossRef]
  12. Mayer, P.; Magno, M.; Benini, L. Self-Sustaining Acoustic Sensor with Programmable Pattern Recognition for Underwater Monitoring. IEEE Trans. Instrum. Meas. 2019, 68, 2346–2355. [Google Scholar] [CrossRef]
  13. Fourniol, M.; Gies, V.; Barchasz, V.; Kussener, E.; Barthelemy, H.; Vauche, R.; Glotin, H. Analog Ultra Low-Power Acoustic Wake-Up System Based on Frequency Detection. In Proceedings of the 2018 IEEE International Conference on Internet of Things and Intelligence System (IOTAIS), Bali, Indonesia, 1–3 November 2018; pp. 109–115. [Google Scholar] [CrossRef]
  14. Astapov, S.; Preden, J.S.; Ehala, J.; Riid, A. Object detection for military surveillance using distributed multimodal smart sensors. In Proceedings of the 2014 19th International Conference on Digital Signal Processing, Hong Kong, China, 20–23 August 2014; pp. 366–371. [Google Scholar] [CrossRef]
  15. Mayer, P.; Magno, M.; Benini, L. A2Event: A Micro-Watt Programmable Frequency-Time Detector for Always-On Energy-Neutral Sensing. Sustain. Comput. Inform. Syst. 2019, 25, 100368. [Google Scholar] [CrossRef]
  16. Bhattacharyya, S.; Andryzcik, S.; Graham, D.W. An Acoustic Vehicle Detector and Classifier Using a Reconfigurable Analog/Mixed-Signal Platform. J. Low Power Electron. Appl. 2020, 10, 6. [Google Scholar] [CrossRef] [Green Version]
  17. Jeong, S.; Chen, Y.; Jang, T.; Tsai, J.M.L.; Blaauw, D.; Kim, H.S.; Sylvester, D. Always-On 12-nW Acoustic Sensing and Object Recognition Microsystem for Unattended Ground Sensor Nodes. IEEE J. Solid-State Circuits 2018, 53, 261–274. [Google Scholar] [CrossRef]
  18. Wang, Y.; Zhou, R.; Liu, Z.; Yan, B. A Low-Power CMOS Wireless Acoustic Sensing Platform for Remote Surveillance Applications. Sensors 2020, 20, 178. [Google Scholar] [CrossRef] [Green Version]
  19. Kucukbay, S.E.; Sert, M.; Yazici, A. Use of Acoustic and Vibration Sensor Data to Detect Objects in Surveillance Wireless Sensor Networks. In Proceedings of the 2017 21st International Conference on Control Systems and Computer Science (CSCS), Bucharest, Romania, 29–31 May 2017; pp. 207–212. [Google Scholar] [CrossRef]
  20. Salazar-García, C.; Castro-González, R.; Chacón-Rodríguez, A. RISC-V based sound classifier intended for acoustic surveillance in protected natural environments. In Proceedings of the 2017 IEEE 8th Latin American Symposium on Circuits & Systems (LASCAS), Bariloche, Argentina, 20–23 February 2017; pp. 1–4. [Google Scholar] [CrossRef]
  21. Delgado Prieto, M.; Zurita Millan, D.; Wang, W.; Machado Ortiz, A.; Ortega Redondo, J.A.; Romeral Martinez, L. Self-powered wireless sensor applied to gear diagnosis based on acoustic emission. IEEE Trans. Instrum. Meas. 2016, 65, 15–24. [Google Scholar] [CrossRef] [Green Version]
  22. Oletic, D.; Bilas, V. Asthmatic Wheeze Detection from Compressively Sensed Respiratory Sound Spectra. IEEE J. Biomed. Health Inform. 2018, 22, 1406–1414. [Google Scholar] [CrossRef] [PubMed]
  23. Oletic, D.; Bilas, V. Energy-efficient respiratory sounds sensing for personal mobile asthma monitoring. IEEE Sens. J. 2016, 16, 8295–8303. [Google Scholar] [CrossRef]
  24. Tschope, C.; Duckhorn, F.; Richter, C.; Bl, P.; Wolff, M. An Embedded System for Acoustic Pattern Recognition. In Proceedings of the 2017 IEEE SENSORS, Glasgow, UK, 29 October–1 November 2017; pp. 1–3. [Google Scholar] [CrossRef]
  25. Mois, G.; Folea, S.; Sanislav, T. Analysis of Three IoT-Based Wireless Sensors for Environmental Monitoring. IEEE Trans. Instrum. Meas. 2017, 66, 2056–2064. [Google Scholar] [CrossRef]
  26. Luo, L.; Qin, H.; Song, X.; Wang, M.; Qiu, H.; Zhou, Z. Wireless Sensor Networks for Noise Measurement and Acoustic Event Recognitions in Urban Environments. Sensors 2020, 20, 2093. [Google Scholar] [CrossRef] [Green Version]
  27. Peckens, C.; Porter, C.; Rink, T. Wireless Sensor Networks for Long-Term Monitoring of Urban Noise. Sensors 2018, 18, 3161. [Google Scholar] [CrossRef] [Green Version]
  28. Yang, M.; Yeh, C.H.; Zhou, Y.; Cerqueira, J.P.; Lazar, A.A.; Seok, M. Design of an Always-On Deep Neural Network-Based 1-μ W Voice Activity Detector Aided with a Customized Software Model for Analog Feature Extraction. IEEE J. Solid-State Circuits 2019, 54, 1764–1777. [Google Scholar] [CrossRef]
  29. Lauwereins, S.; Meert, W.; Gemmeke, J.; Verhelst, M. Ultra-low-power voice-activity-detector through context- and resource-cost-aware feature selection in decision trees. In Proceedings of the 2014 IEEE International Workshop on Machine Learning for Signal Processing (MLSP), Reims, France, 21–24 September 2014; pp. 1–6. [Google Scholar] [CrossRef] [Green Version]
  30. Medeiros, J.E.G.; Chrisostomó, L.A.P.; Meira, G.; Toledo, Y.C.R.; Pimenta, M.; Haddad, S.A.P. A fully analog low-power wavelet-based Hearing Aid Front-end. In Proceedings of the 2013 IEEE Biomedical Circuits and Systems Conference (BioCAS), Rotterdam, The Netherlands, 31 October–2 November 2013; pp. 242–245. [Google Scholar] [CrossRef]
  31. Price, M.; Glass, J.; Chandrakasan, A.P. A Low-Power Speech Recognizer and Voice Activity Detector Using Deep Neural Networks. IEEE J. Solid-State Circuits 2018, 53, 66–75. [Google Scholar] [CrossRef]
  32. Raychowdhury, A.; Tokunaga, C.; Beltman, W.; Deisher, M.; Tschanz, J.W.; De, V. A 2.3 nJ/Frame Voice Activity Detector-Based Audio Front-End for Context-Aware System-On-Chip Applications in 32-nm CMOS. IEEE J. Solid-State Circuits 2013, 48, 1963–1969. [Google Scholar] [CrossRef]
  33. Shan, W.; Yang, M.; Wang, T.; Lu, Y.; Cai, H.; Zhu, L.; Xu, J.; Wu, C.; Shi, L.; Yang, J. A 510-nW Wake-Up Keyword-Spotting Chip Using Serial-FFT-Based MFCC and Binarized Depthwise Separable CNN in 28-nm CMOS. IEEE J. Solid-State Circuits 2021, 56, 151–164. [Google Scholar] [CrossRef]
  34. Alías, F.; Socoró, J.C.; Sevillano, X. A review of physical and perceptual feature extraction techniques for speech, music and environmental sounds. Appl. Sci. 2016, 6, 143. [Google Scholar] [CrossRef] [Green Version]
  35. Serizel, R.; Bisot, V.; Essid, S.; Richard, G. Acoustic Features for Environmental Sound Analysis. In Computational Analysis of Sound Scenes and Events; Springer International Publishing: Cham, Switzerland, 2018; pp. 71–101. [Google Scholar] [CrossRef] [Green Version]
  36. Chu, S.; Narayanan, S.; Kuo, C.J. Environmental Sound Recognition with Time–Frequency Audio Features. IEEE Trans. Audio Speech. Lang. Processing 2009, 17, 1142–1158. [Google Scholar] [CrossRef]
  37. Gazivoda, M.; Bilas, V. Low-Power Sensor Interface with a Switched Inductor Frequency Selective Envelope Detector. Sensors 2021, 21, 2124. [Google Scholar] [CrossRef] [PubMed]
  38. Oletic, D.; Gazivoda, M.; Bilas, V. A programmable 3-channel acoustic wake-up interface enabling always-on detection of underwater events within 20 µA. In Proceedings of the Eurosensors 2018 Conference, Graz, Austria, 9–12 September 2018; pp. 1–7. [Google Scholar] [CrossRef] [Green Version]
  39. Gutierrez, E.; Perez, C.; Hernandez, F.; Hernandez, L. VCO-based Feature Extraction Architecture for Low Power Speech Recognition Applications. In Proceedings of the 2019 IEEE 62nd International Midwest Symposium on Circuits and Systems (MWSCAS), Dallas, TX, USA, 4–7 August 2019; pp. 1175–1178. [Google Scholar] [CrossRef]
  40. Oh, S.; Kim, H.-S.; Sylvester, D.; Cho, M.; Shi, Z.; Lim, J.; Kim, Y.; Jeong, S.; Chen, Y.; Rothe, R.; et al. An Acoustic Signal Processing Chip With 142-nW Voice Activity Detection Using Mixer-Based Sequential Frequency Scanning and Neural Network Classification. IEEE J. Solid-State Circuits 2019, 54, 3005–3016. [Google Scholar] [CrossRef]
  41. Badami, K.M.H.; Lauwereins, S.; Meert, W.; Verhelst, M. A 90 nm CMOS, 6 μW power-proportional acoustic sensing frontend for voice activity detection. IEEE J. Solid-State Circuits 2016, 51, 291–302. [Google Scholar] [CrossRef] [Green Version]
  42. Rumberg, B.; Graham, D.W.; Kulathumani, V. A low-power, programmable analog event detector for resource-constrained sensing systems. In Proceedings of the 2012 IEEE 55th International Midwest Symposium on Circuits and Systems (MWSCAS), Boise, ID, USA, 5–8 August 2012; pp. 338–341. [Google Scholar] [CrossRef]
  43. Wang, Z.; Liu, Y.; Zhou, P.; Tan, Z.; Fan, H.; Zhang, Y.; Shen, L.; Ru, J.; Wang, Y.; Ye, L.; et al. A 148-nW Reconfigurable Event-Driven Intelligent Wake-Up System for AIoT Nodes Using an Asynchronous Pulse-Based Feature Extractor and a Convolutional Neural Network. IEEE J. Solid-State Circuits 2021, 56, 3274–3288. [Google Scholar] [CrossRef]
  44. Kim, C.M.; Lee, S.Y. A digital chip for robust speech recognition in noisy environment. In Proceedings of the 2001 IEEE International Conference on Acoustics, Speech, and Signal Processing. Proceedings (Cat. No. 01CH37221), Salt Lake City, UT, USA, 7–11 May 2001; Volume 2, pp. 1089–1092. [Google Scholar] [CrossRef]
  45. He, F. A Portable Low-Power Electronic Adherence Monitoring System for Cystic Fibrosis; University of Sheffield: Sheffield, UK, 2019. [Google Scholar]
  46. Goldberg, D.H.; Andreou, A.G.; Julián, P.; Pouliquen, P.O.; Riddle, L.; Rosasco, R. VLSI implementation of an energy-aware wake-up detector for an acoustic surveillance sensor network. ACM Trans. Sens. Netw. 2006, 2, 594–611. [Google Scholar] [CrossRef]
  47. Habibi, M.; Shakarami, M.; Khoddami, A.A. A low power mixed signal correlator for power efficient sound signature detection and template matching. Sens. Rev. 2017, 37, 213–222. [Google Scholar] [CrossRef]
  48. Sutton, F.; Forno, R.D.; Gschwend, D.; Gsell, T.; Lim, R.; Beutel, J.; Thiele, L. The Design of a Responsive and Energy-efficient Event-triggered Wireless Sensing System. In Proceedings of the 14th International Conference on Embedded Wireless Systems and Networks (EWSN 2017), Uppsala, Sweden, 20–22 February 2017; pp. 144–155. [Google Scholar] [CrossRef]
  49. Cho, M.; Oh, S.; Jeong, S.; Zhang, Y.; Lee, I.; Kim, Y.; Chuo, L.-X.; Kim, D.; Dong, Q.; Chen, Y.-P.; et al. A 6 × 5 × 4 mm3 general purpose audio sensor node with a 4.7 μW audio processing IC. In Proceedings of the 2017 Symposium on VLSI Circuits, Kyoto, Japan, 5–8 June 2017; pp. C312–C313. [Google Scholar] [CrossRef]
  50. Underwater Video of Twin Engine Boat Props High Speed. Available online: https://www.youtube.com/watch?v=6uQ7IDqbmAE (accessed on 7 June 2018).
Figure 1. Spectro-temporal decomposition wake-up detector generalized architecture.
Electronics 11 00478 g001
Figure 2. Level-crossing rate wake-up detector generalized architecture.
Electronics 11 00478 g002
Figure 3. (a) Speedboat passing signal and (b) its spectrogram.
Electronics 11 00478 g003
Figure 4. Spectro-temporal decomposition wake-up detector from [38]: (a) schematic and (b) photograph.
Electronics 11 00478 g004
Figure 5. Microcontroller state machine implementation and event detection scheme. Ch1 to Ch3 and the three colored lines (green, blue and red) represent each channel’s comparator output, and S0 to Sk are the state machine states, each lasting 0.5 s. (a) Event detected: at least 2 and no more than 9 consecutive states have all 3 comparator outputs in a high state, and a wake-up signal is generated. (b) No event detected: the total S0 to S14 sequence passes without meeting the detection condition, no wake-up signal is generated.
Electronics 11 00478 g005
Figure 6. Novel level-crossing rate wake-up detector: (a) schematic and (b) photograph.
Electronics 11 00478 g006
Figure 7. Experimental setup, with marked components: (1) power source, (2) waveform generator, (3) tested detector PCB, (4) data acquisition card, and (5) multimeter.
Electronics 11 00478 g007
Figure 8. Comparison of speedboat passing detections at given SNR with selected detectors.
Electronics 11 00478 g008
Table 1. Acoustic signal feature categorization.
TemporalSpectralSpectro-temporalCepstralOther
Level-crossing rate-basedSpectral shape-basedSpectro-temporal decomposition-basedMel-frequency cepstral coefficient-basedEigenspace-based
Temporal amplitude-basedBrightness-basedHurst parameter-basedOther cepstral coefficient-basedAcoustic environment-based
Temporal power-basedTonality-basedMP-based Gabor features--
Rhythm-basedChroma-basedSparse coding tensor-based -
Correlation-based----
Table 2. Acoustic wake-up detectors.
Feature GroupFeature SubgroupFeatureRef.Detector ImplementationFeature Extraction DomainPower (µW) Detection Accuracy
TP (%)FP (%)
Spectro-temporalSpectro-temporal decompositionSpectro-temporal envelope[37,
38]
Embedded mixedAnalog7.33;
34.92
90.91Not stated
[8,15]Embedded mixedAnalog26.8998.67; 10014;
0
[16]Integrated mixedAnalog431000
Spectro-temporal energy[39]Integrated mixedAnalog1.01Not statedNot stated
[32]Integrated digitalDigital~10096.632.33
Spectro-temporal power[40]Integrated mixedMixed0.14290–91.5Not stated
Spectro-temporal RMS[41]Integrated mixedAnalog689Not stated
Spectro-temporal (absolute) voltage[17]Integrated mixedDigital0.01296–98 0
[30]Integrated analogAnalog2.5Not statedNot stated
[28,
42]
Integrated mixedAnalog1;
27.77
~85;
~80
Not stated;
0
Spectro-temporal instant rate of change[43]Integrated digitalDigital0.14885–991–18
TemporalLevel-crossing rateZero-crossing rate[13]Embedded analogAnalog34Not statedNot stated
[8]Embedded digitalDigital~600Not statedNot stated
Zero-crossing rate with peak amplitude (ZCPA)[44]Integrated digitalDigitalNot stated98Not stated
Zero-crossing with short-time magnitude difference[45]Embedded digitalDigital30.7191Not stated
CorrelationAutocorrelation[31]Integrated digitalDigital24.455–955–20
[46]Integrated mixedDigital0.835970
Cross-correlation[47]Integrated mixedMixed1.5927
Short-time energyShort-time energy difference[31]Integrated digitalDigital8.555–955–20
MultipleRise time, min/max, energy[48]Embedded mixedDigital8.7100Not stated
SpectralSpectral shapePower spectrum density[49]Integrated mixedDigital4.7Not statedNot stated
CepstralCepstral coefficientsMel-frequency CC[33]Integrated digitalDigital0.5197.32–2.3
Table 3. Detector Selection.
Detectors UtilizingCriteria
Applicable for Signals of InterestEmbedded ImplementationNo AD ConversionDetection Accuracy
Autocorrelation/cross-correlation
Level-crossing rate
Spectro-temporal decomposition
Other features
Table 4. Wake-up detector’s power consumption, minimal input voltage and component count.
DetectorPower (µW)Minimal Input Voltage (mVpp)Number of Components
ActivePassiveDiodeTotal
Spectro-temporal envelope detector34.62012 + µC51670
Level-crossing rate detector9.110735244
Publisher’s Note: MDPI stays neutral with regard to jurisdictional claims in published maps and institutional affiliations.

