1. Introduction
The infrastructures and techniques that enable the deployment of IT services are constantly evolving. Today, it seems pretty natural to use online storage spaces to store heterogeneous documents, such as photographs, music files, or text documents. Web applications, which do not require additional software installed on clients and perform calculations via powerful remote servers, are also typical. There are also chargeable services that guarantee the ability to perform scientific calculations or exploit the computational capacity of hardware with specific power and cooling requirements. All this is possible thanks to modern technologies and software development models such as cloud computing. Users delegate the responsibility of creating available and reliable infrastructures to third-party companies that take care of the management and maintenance of the hardware necessary to complete the required tasks. This article will analyse the best practices for creating a modern and reliable cloud architecture, which exploits the potential of the most advanced software technologies, such as Docker containers, and guarantees high availability and scalability.
Nowadays, there are several aspects that have emerged with the spread of cloud environments, social networks and multimedia platforms that tend to capture personal information of users. This is despite the fact that many organisations (such as the European Union) have issued (e.g., through the General Data Protection Regulation, GDPR (
https://gdpr.eu/, accessed on 13 December 2021) a series of recommendations aimed at protecting personal data. There is no doubt that today this information constitutes an absolutely attractive asset for the big players in Information Technology because, through it, they are able to convey, in a much more incisive manner, messages and other services that suit the increasingly frequent uses and customs of the population. Our work aims to provide organisations and those sensitive to the importance of respecting the protection of personal data with a set of best practices that will enable them to implement a private or hybrid cloud environment, i.e., one that is able to interface with commercial providers to access computational resources without compromising the security of sensitive data. In order to facilitate the adoption of this best practices and the dissemination of these open solutions, thus also oriented to the mitigation of the lock-in (Lock-in refers to the tendency of proprietary solutions to anchor the user within the area of action of the services provided by the company) phenomenon, we have provided a use case that makes this adoption of open technologies easier and more transparent.
The use case that we present involves the implementation of a website based on a PHP backend assisted by an SQL database for data storage, the creation of a container for the management of IT services (e-mail, DNS), and we will make the necessary considerations for the management of the horizontal scalability of the webserver, under established metrics and the number of user requests. The design of an IT infrastructure must also consider the aspects concerning data security, protecting them from attacks that can occur from outside and from any catastrophic events that can lead to severe consequences, such as the complete loss of information. This article is divided as follows: in
Section 2, we analyse articles and manuscripts that have addressed this problem and that today represent the state of the art of academic research.
In
Section 3, we summarise the characteristics and aspects of the various types of IT infrastructures concerning disaster recovery techniques, highlighting their main strengths and weaknesses.
In
Section 4, we present an architecture capable of satisfying the requirements imposed by us and capable of exploiting the most current and modern technologies, defining best practices for the creation of scalable architectures using Docker containers. The proposed architecture is also adopted in an actual use case that uses the technologies and methods proposed in this article.
In
Section 5, we presented the infrastructure described in this article in the light of indicators showing the efficiency and cost savings obtained from adopting a solution capable of scaling down and up according to the load induced by users.
Section 6 describes the statistics and experimental results that have been collected over the period considered. The various graphs are explained in the light of the operations carried out, taking into account the trends observed in them for both CPU and memory by the various components of the architecture.
Section 7 reports the conclusions and results achieved by our experimental analysis, and possible future developments are also highlighted.
2. Related Works
Over the last 40 years, the rapid and relentless computerisation has permitted the handling and administration of huge volumes of data in ever-shorter time periods. Furthermore, the complexity of scientific and technological concerns, as well as the automation of industrial and economic operations, necessitated a highly sophisticated use of computer resources [
1,
2,
3,
4]. This has prompted the development of a number of technologies, ranging from the creation of more powerful CPUs, GPUs, TPUs, and other hardware components to the construction of computer clusters capable of working on the same problem in parallel [
5,
6,
7].
The investigation about calculation structures that are less eager for computational assets can essentially add to making data structures more proficient; in numerous application issues in the field of engineering and logistics, traditional scientific techniques for the productive pursuit of the most extreme or least upsides of a genuine capacity have been upheld by exceptionally successful heuristic and meta-heuristic arrangements [
8].
In extremely computationally complicated domains such as chemistry, mathematics, and scientific modelling, artificial intelligence technology is fundamental. It is also useful for detecting certain patterns in photos and other data aggregation, such as carcinoma detection, molecular structures, and emotion recognition from images and photographs [
9,
10,
11,
12,
13]. The mathematical framework must automatically, and in some cases intelligently, adapt to circumstances in which the system variables are large and vary fast [
14,
15]. Artificial Intelligence approaches have recently allowed us to boost the responsiveness of decision-making processes, as well as introduce forms of automation and relational empathy with machines at previously imagined levels, thanks to the rapid growth of AI techniques [
16,
17].
Undoubtedly, such widespread technological advances will have a major impact on society. A smart city opens the door to extraordinary views and scenarios about the potential of serving residents but even to well-founded concerns about its impact on the environment. Educational institutions have heavily invested in technical equipment and smart schools to improve the efficiency of education. Its actual results and benefits are still to be demonstrated [
18,
19,
20,
21,
22].
Over the years, the number of devices connected to the network has increased dramatically: the advent of the Internet of Things (IoT) has allowed heterogeneous devices to be integrated and communicated with each other, automating processes and making available information that we did not have before, with the clear advantage of optimising production processes and economic activities in real time [
23,
24,
25]. The importance of IoT devices resides in their capacity to capture specific data by combining privacy awareness with relevant information, ease of use with utility, economy with power, and versatility with precision.
Moreover, during 2020, the amount of data created and replicated reached a new high. Growth was higher than previously expected due to increased demand due to the COVID-19 pandemic as more people worked and learned from home and used home entertainment options more often. Storage capacity is also growing. However, only a small percentage of this newly created data are retained: in fact, only 2% of the data produced and consumed in 2020 was saved and retained in 2021. In line with the strong growth in the volume of data, the capacity installed storage base is expected to increase, with a compound annual growth rate of 19.2% in the forecast period from 2020 to 2025. This means that the effectiveness and efficiency of the computational structures capable of storing and processing information become essential and crucial requirements [
26].
As a result, the Cloud has become more important than ever as a resource to be able to react to all of these expectations for efficiency and effectiveness in the processing of the many different types of information that our society has grown inexorably addicted to [
27].
In contrast, Docker containers are compact cloud technologies gaining traction among IT solutions as they enable applications to be launched more quickly and effectively than virtual machines. Docker container usage in dynamic, heterogeneous settings, as well as the capacity to deploy and successfully manage containers across many clouds and data centres, have made these technologies popular and fundamental [
28,
29,
30,
31,
32]. The advancements in more outstanding performance and decreased overhead have rendered the cloud container method necessary for designing cloud environments that can keep up with the needs of diverse application domains [
33,
34].
3. Disaster Recovery
To design an IT architecture that is robust and resistant to cyber-attacks and natural events is necessary to perform a preliminary requisites analysis that establishes three fundamental parameters [
35]. The first parameter is the Service Level Agreement (SLA). It represents the percentage of time our IT system will work correctly during a calendar year. As the SLA value increases, the costs necessary for implementing an infrastructure capable of satisfying it will also increase. For example, if we wanted an SLA value equal to 90%, this would be equivalent to saying that our IT system could be offline (during a whole year of operation) for 36 d 12 h 34 m 55 s. An SLA value of 99.99%, on the other hand, is equivalent to saying that we can tolerate downtime of 52 m 35 s over a year.
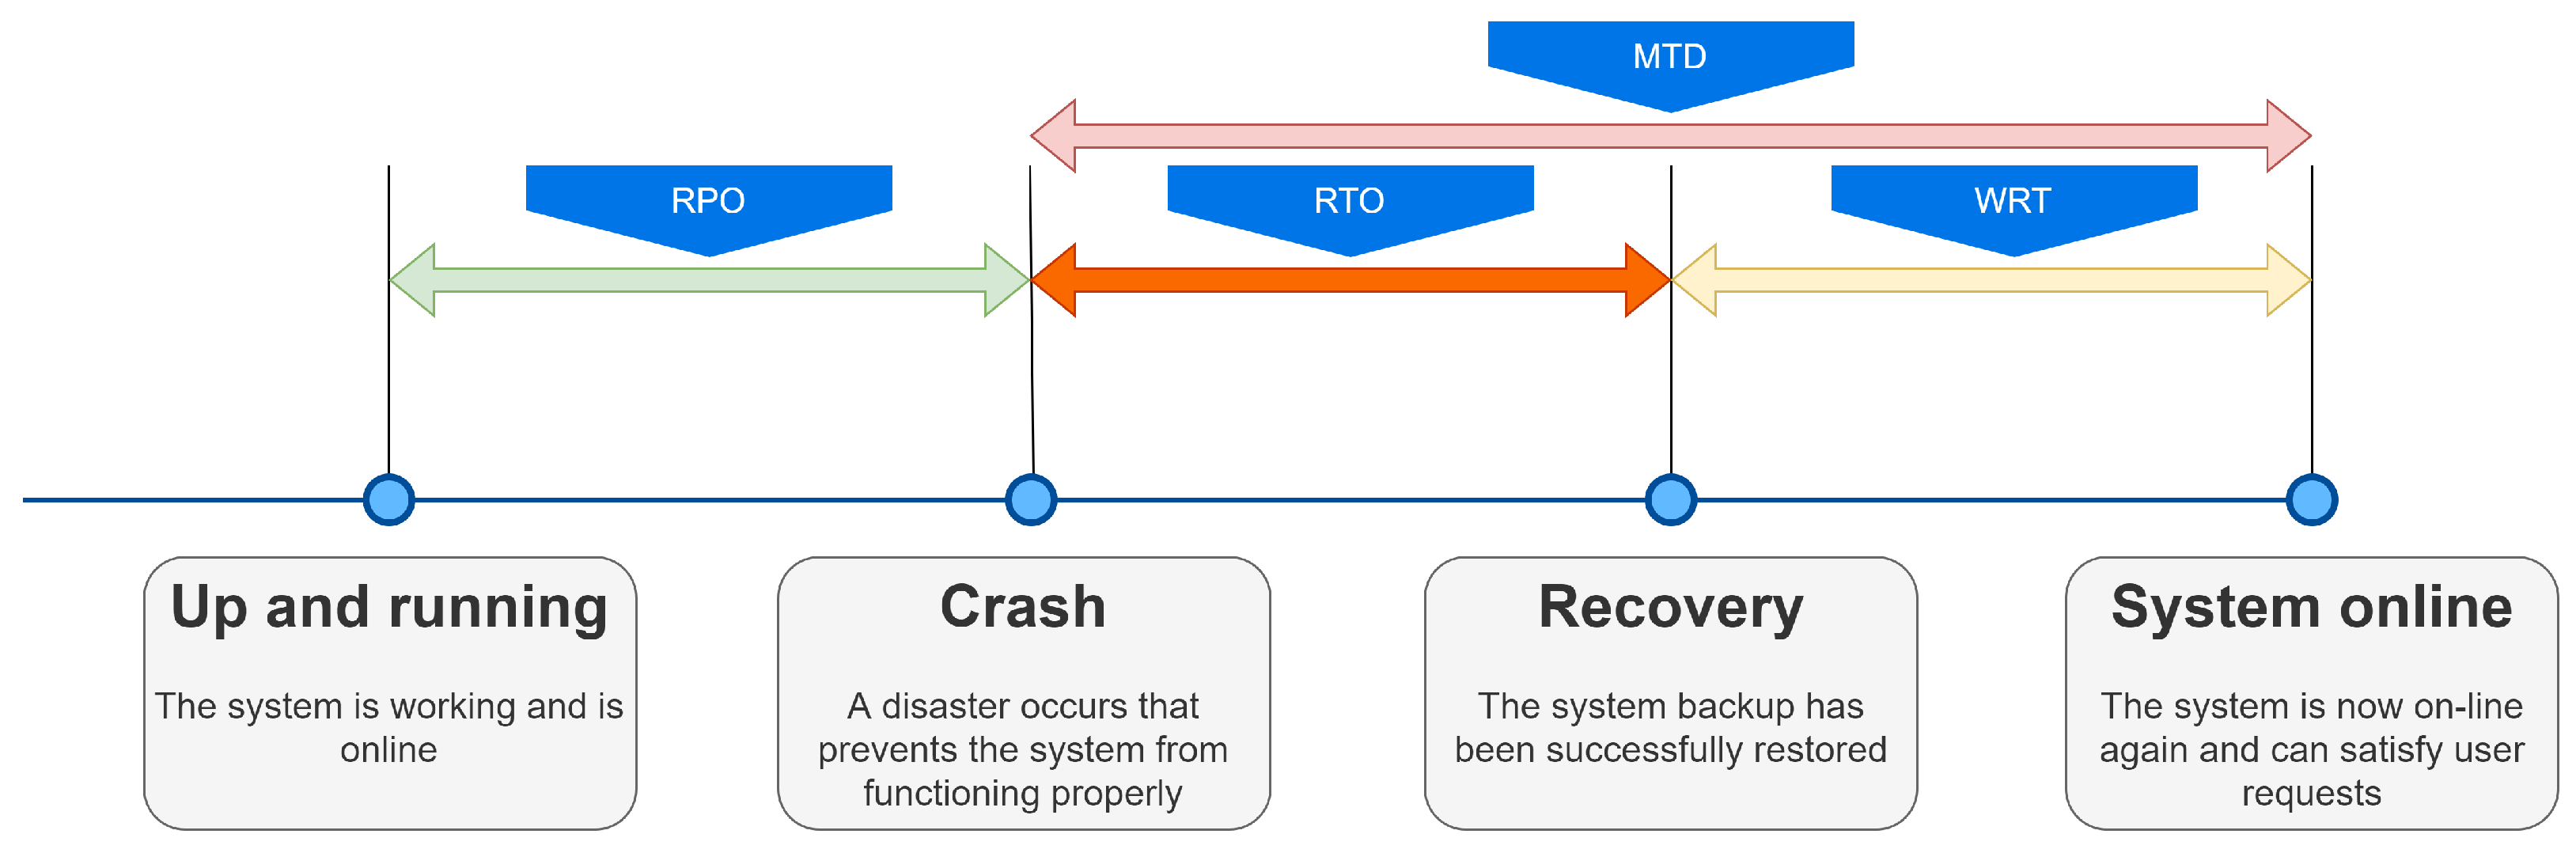
The second parameter that must be defined is the Recovery Point Objective (RPO) and represents the maximum time interval that we are willing to lose. This parameter is related to data backup, increasing cost and complexity as the required RPO value decreases.
The third parameter that must be defined is the Recovery Time Objective (RTO) and represents the time that we are willing to accept between the interruption of the operation of our IT infrastructure and its recovery. In general, we can say that older architectures have an RTO time of more than 48 h. For example, in the case of hardware problems, which require turning off the machine and replacing the non-functioning part, it is also necessary to consider the time required to find the components to be replaced and the time required to restore the system [
36,
37].
In addition, it is essential to define the Work Recovery Time (WRT), which indicates the maximum tolerable time frame required to verify the integrity of the data recovered. The sum of RTO and the WRT gives the Maximum Tolerable Downtime (MTD) parameter shown in
Figure 1 along with the other parameters.
Classification of Disaster Recovery
Considering that different levels of disaster recovery imply different costs and organisational complexities, four different plans have been defined in the literature [
38].
The first type is called “Backup and Restore” and involves the creation of manual or periodic data backups. If a failure or disaster occurs, the system will completely stop working, and it will be necessary to proceed with the restoration of the infrastructure manually; in the most severe cases, it will be necessary to shut down the system and restore the backup. It was frequently adopted in legacy architectures and is still used today for data systems and delivering non-critical services. This solution presents the lowest costs but exposes to the highest risks. The backup and restore type has an RPO parameter that can be measured in hours and an RTO that varies between 24 and 72 h.
A second type is the “Pilot light”, which provides the creation of data backups on an hourly or daily basis. The architectures that use this type are built using virtual machines or Docker containers and do not install the software that must provide the services directly on the machine’s main operating system since the data can be quickly restored in case of a disaster even remotely. The RPO value can be measured in minutes, while the RTO value can be measured in hours.
A third type is the “Warm Standby”. The systems that adopt it constantly replicate the data of the primary storage devices in auxiliary backup systems installed in remote locations. Thanks to the synchronisation of data that occurs almost in real-time, it is possible to obtain an RPO in seconds and an RTO parameter in minutes.
The fourth type is called “Active/Active”: it provides the highest level of reliability, implementing the application’s load balancing. Such infrastructure is built using at least two availability zones, far enough to guarantee service continuity even in natural disasters. Creating a second availability zone implies the complete replica of hardware and software resources. A load balancer service will allocate the user requests on the webserver instances available on the two availability zones, balancing them and constantly monitoring their health. The allocation of resources in the availability zones may be asymmetric. This type of architecture allows for obtaining an RPO in the order of milliseconds, which can even be 0 in some cases. The RTO value is instead potentially equal to 0. The types just described are shown in
Figure 2. We should note that the higher the requirements of the infrastructure, the greater the costs necessary for its implementation: by observing the figure, we can see that moving to the right increases both the general security of the system and the overall cost that must be faced to create the required IT architecture.
4. The Proposed System Architecture
This section describes the architecture proposed to create an IT infrastructure that guarantees high reliability and high resistance to failures. The infrastructure is built using the Active/Active disaster recovery type within the virtualisation environment provided by a cloud provider. The use case we intend to focus on is the management of a website based on PHP and bash for backend management; HTML5, JavaScript, and CSS3 for frontend management; SQL for the relational database. The site can manage a very high number of simultaneously connected users, dynamically scaling the number of PHP and databases nodes based on the number of users connected. We have two possible ways of increasing the resources available to an application: horizontal scaling and vertical scaling. By horizontal scaling, we mean the possibility of increasing the number of server instances based on the number of connected users and sentinel parameters that enable the mechanism to be activated. With the expression vertical scaling, we mean the increase in terms of RAM and CPU cores of the same server. Prudent use of resources, aimed at obtaining maximum performance at the best cost, requires careful planning of these two mechanisms to deal with situations of massive users with more powerful hardware. In this way, we obtain the advantage of low operating costs at night or idle scenarios with a low number of nodes, with costs that will increase when we have to afford high workloads. In the case of planned intensive workloads, it is recommended to perform a vertical scaling to afford the extraordinary workload better. The adoption of vertical scaling involves shutting down the virtual machines increasing the number of cores and the amount of RAM, redefining the related metrics for the horizontal scaling, and increasing the related costs.
The scheme of the architecture discussed in this section is shown in
Figure 3, and, in the following subsections, we will describe the main components.
4.1. The Load Balancer
The first element is the load balancer, which allocates the incoming requests on the resources available in the two availability zones [
39,
40,
41]. Several algorithms can be implemented for configuring a load balancer. The simplest algorithm is the “randomised” one; one of the target webservers is selected randomly for each new request. A disadvantage of this algorithm is that balancing requests between the available resources is not guaranteed.
Another algorithm is the “round-robin”. In this case, the requests will be sent in a perfectly balanced way to the two available resources. This algorithm has a disadvantage: it does not consider the number of pending requests on computing resources.
We recommend using the third available algorithm: the Least Outstanding Requests (LOR). A new request will be allocated to the resource with the lowest number of pending requests. In this case, if horizontal scaling is active, new requests will be allocated to the newly instantiated servers until a new equilibrium is reached between the requests allocated to each computational resource.
4.2. The Redis Database
Redis is a very high performance non-relational database, whose characteristics make it extremely suitable for managing session variables in a distributed environment [
42]. In fact, in a distributed environment, it is impossible to maintain the consistency of session variables since the user can switch from one server to another in the course of navigation. We have adopted a configuration based on two Redis servers, one configured as primary and the other as secondary, to guarantee this fundamental service’s high reliability. The official image for building a Redis server is distributed directly by the Docker repository (
https://hub.Docker.com/r/bitnami/redis/, accessed on 13 December 2021 ). To manage operation between the two Redis servers, one can use the Redis Sentinel daemon, which can monitor the health of the servers and manage the switching of roles if necessary (
https://hub.Docker.com/r/bitnami/redis-sentinel, accessed on 14 December 2021).
4.3. The SQL Database
Considering our proposed use case, an essential component of the architecture is the relational DataBase which manages the storage and high performance search of information. We adopted the MariaDB relational database, available under the open-source license GPL v2 [
43,
44]. At night, or when the workload is low, there are only two database instances, one in the primary Availability Zone and one in the secondary Availability Zone. The first instance can be identified as master, with write and read permissions. The second instance is configured as slave, with only read permissions. Relational databases must guarantee the consistency of the data structure within them; if we used two databases and both had write permissions, both might write data, and that, once inserted, it could violate the uniqueness conditions of a primary key inside of the tables. It will be possible to implement horizontal scaling mechanisms during intensive system load, i.e., to instantiate salve replicas. These replicas will enable high performance data reading. It should be noted that each replica of the database will have a latency time for the master, generally on the order of milliseconds or tenths of a millisecond. A latency of this type is utterly irrelevant to the use case we are presenting since, if users see new content with only a one-millisecond delay, there is no problem. Vertical scaling can be adopted in cases where latency is essential, for example because an application is used in a mission-critical environment.
Database Auto-Scaling
Too many simultaneous connections to the database may cause slowdowns and delays in delivering data to users. In order to efficiently scale the database, it is necessary to identify appropriate parameters to be used as metrics [
45], so that appropriate scaling policies can be activated when a peak in user requests is observed that generates the overcoming of limit thresholds. We have identified two fundamental parameters: CPU utilisation and the number of concurrently active connections. When defining CPU threshold, we have to consider the time a database takes to be instantiated; our tests show that, for a medium-sized database, it is necessary approximately 3 min. Our estimate for the CPU utilisation percentage threshold is 70%. A higher value could prevent the system from handling a peak of users, as the time required to start the database could be too long, and therefore users could encounter requests denied when using the service. A lower value would instead lead to a waste of money as we will run replicas of the database when there is no real need.
As per the number of concurrently active connections, our estimate for a medium-sized database is 30 connections. However, this parameter is also influenced by the machine’s computational power on the database. Each database is managed by two vCPUs and 4 GB of RAM in our case.
4.4. Storage Configuration
We consider the use case based on containers, which have no persistent memory. Therefore, it is necessary to configure a permanent memory that can be shared between the various active containers. Many Cloud providers offer proprietary technologies for the creation of highly available disks, such as Amazon EFS (Elastic File System) (
https://aws.amazon.com/en/efs/, accessed on 16 December 2021), Microsoft Azure File Storage (
https://azure.microsoft.com/it-it/services/storage/files/, accessed on 16 December 2021) or Oracle Direct NFS (
https://docs.oracle.com/en/database/oracle/oracle-database/12.2/ssdbi/about-direct-nfs-client-mounts-to-nfs-storage-devices.html, accessed on 20 December 2021). An open source solution is represented by GlusterFS (
https://www.gluster.org/, accessed on 20 December 2021), configured in the two virtual machines which are in charge of deploying the containers in the availability zones in use. To this end, each virtual machine must configure an XFS partitioned disk (
https://docs.oracle.com/cd/E37670_01/E37355/html/ol_about_xfs.html, accessed on 20 December 2021) on which the data will be stored. GlusterFS will perform real-time data replication between the various nodes that make up the cluster it manages.
4.5. The Containers in the Backend
The configuration of web containers requires a step-by-step approach. The first step must be done in a local environment by writing a Dockerfile [
46,
47]. The Dockerfile is a text file that contains the definitions of the software packages to be installed inside the Docker image we need to run. The second phase requires an in-depth test of the Docker image we have created. For example, in our case, we tested the web application by running the Docker container inside a dedicated Virtual Machine to which a domain name was assigned via DNS. Next, we need to configure an NAT to assign private IP addresses to the Docker containers we will instantiate. We have two ways to proceed to the next stage, which are now described in detail.
The first way is to manually configure a cluster that orchestrates the web containers and does not use the preconfigured services made available by the Cloud providers. In this case, one must first prepare a virtual machine with Docker installed. Since this machine will have to manage another number of containers, it should be instantiated with a high number of CPUs, and a suitable amount of RAM. Inside the machine, we can install the HAproxy (
http://www.haproxy.org/, accessed on 20 December 2021) daemon, which will sort requests between the Web containers that are part of the cluster we have created. The downside of this first route is that we will not be able to exploit auto-scaling effectively: it will not be possible to perform horizontal auto-scaling, but we can only perform vertical scaling since the maximum number of CPU cores in the cluster is determined at the time of creating the virtual machine.
The second way is to rely on the services offered by the Cloud provider. Many providers make it possible to orchestrate Docker containers automatically, managing horizontal scaling. Amazon provides the Elastic Container Service (ECS) (
https://aws.amazon.com/ecs/, accessed on 20 December 2021), Microsoft uses Azure Kubernetes Service (AKS) (
https://azure.microsoft.com/en-us/services/kubernetes-service/, accessed on 20 December 2021), Google provides Google Kubernetes Engine (GKE) (
https://cloud.google.com/kubernetes-engine, accessed on 20 December 2021). If one wants to use services offered by the Cloud provider, one needs to upload the Docker image generated to the private repository of the user’s account. Then, one can start the image within the container orchestration service, taking care to have the NAT previously configured manage the IP addresses of the nodes.
4.6. Auto-Scaling
After configuring the Docker containers that manage the backend, we can proceed to configure horizontal scaling, i.e., adding equivalent nodes that can handle the users’ requests [
48]. Since the auto-scaling feature ensures that the cluster delivers the computational power needed to manage users and minimises costs during idle states, we recommend assigning a modest amount of CPU and RAM to individual web nodes. For example, in our case, we allocated 1 vCPU and 2 GiB of RAM per node. These values depend very strongly on the use case and can only be estimated through system load tests and local tests that monitor RAM usage. However, it is advisable to keep these values low to take advantage of the benefits of auto-scaling.
There are several parameters for configuring an auto-scaling service. The first parameter is the minimum number of nodes we wish to have operational within an availability zone.
The second parameter indicates the maximum number of nodes that auto-scaling can instantiate. This parameter varies according to the use case; it is generally advisable to insert a high value capable of satisfying load peaks. Then, we have to define additional parameters concerning the Policies that activate auto-scaling and which we consider guidelines to be followed when configuring infrastructures of this type. The percentage of CPU utilisation represents the first parameter. If the average processor usage value within the cluster exceeds a certain threshold, the orchestrator will activate new nodes. It is necessary to remind that there is a start-up time for activating containers, so it is advisable to enter a value that is not too high; otherwise, we could not manage load peaks. In our use case, we consider that the optimal parameter for adding a new node is the 60% average CPU usage. The second parameter concerns the average RAM usage; in this case, we recommend a value of about 80% of the maximum RAM allocated to a node. According to our tests, sometimes auto-scaling based on CPU and RAM usage may not be sufficient. An essential parameter is the number of requests a node has handled in a given period. For example, it is possible to define a policy that monitors the requests received by a node over 5 min. In our use case, we have found that, in order to have effective and efficient auto-scaling, a value below 26,000 is recommended. It is interesting to note that a high number of requests within 5 min is not related to high processor utilisation, as requests can be of different kinds, from file system data requests to database data requests to computational calculations. However, it is essential to measure this parameter and calibrate it according to the particular use case by carrying out load tests before the system goes into production. The last configuration parameter concerns downscaling used to remove nodes when they are no longer required. For this policy, we recommend monitoring the cluster’s CPU utilisation. When the cluster reaches a low CPU utilisation, for example, around 15%, it is possible to remove one node at a time, keeping the system performance constant and reducing costs.
4.7. DNS Server
The architecture we propose involves configuring a DNS server inside a Docker container [
49], which enables the autonomous management of this service. An independently managed DNS allows for a refined configuration of zone parameters and makes it possible to propagate updates since the parameters can be managed internally quickly. A further advantage is the ability to backup DNS settings and configuration parameters since they are included in the persistent storage attached to the Docker container according to the presented use case. To install this service, one can use a docker image containing a server DNS, e.g., “bind” (A DNS server with a web interface and preconfigured for Docker:
https://hub.Docker.com/r/sameersbn/bind/, accessed on 20 December 2021), then open and expose in the Docker and firewall configuration files, the port 53 TCP (used for zone transfer) and port 53 UDP (used to answer client queries) and finally associate a storage space with persisting the DNS data. In order to achieve a configuration that respects the canons of high reliability and high availability, it is necessary to configure a master DNS in the main availability zone and a slave DNS in the secondary availability zone.
4.8. The Mail Server
Similarly to the DNS server, a Docker-based mail server should also be configured to allow complete management of the e-mail transit in our infrastructure. In order to reduce false positives of anti-spam software and enable reliable message delivery, mail servers must be authenticated through Domain Keys Identified Mail (DKIM), Sender Policy Framework (SPF), and Domain-based Message Authentication (DMARC). The DKIM key is added to the DNS file zone as a TXT record. It ensures that no messages going from server to server are tampered with and that messages can be identified. SPF authentication works by specifying the number of allowed IPs that can send e-mails from a specific domain. The domain manager can add a file or record on the server that tells the receiving server which domains are allowed to send e-mails. DMARC builds on SPF and DKIM to further validate e-mails by matching the validity of SPF and DKIM records. This allows for setting policies and getting alerts generated in case DMARC validation fails. There are various Docker images that allow you to build a mail server, for example Poste.io (
https://hub.docker.com/r/analogic/poste.io/, accessed on 20 December 2021), Mailu (
https://hub.docker.com/u/mailu/, accessed on 21 December 2021), Postfix (
https://hub.docker.com/_/postfixadmin, accessed on 22 December 2021) and many others. Once the image one wants to use is chosen, it is needed to create a Docker container that uses it, and then one has to expose all the ports necessary for the service to work. Finally, setting up a relay mail server in the secondary availability zone is advisable to avoid losing mail if the main availability zone goes offline.
4.9. WAF
Modern cyber threats exploit vulnerabilities and technologies that are increasingly effective and complex, so we need to protect software applications and equipment within our infrastructure to the best of our ability. There are attack patterns used by hackers and bots that can be identified by software designed to defend IT infrastructures. A WAF is a Web Application firewall, i.e., a firewall that works at level 7 of the ISO/OSI model [
50]. This application helps defend our software against SQL injection or cross-site scripting attacks, as it can also analyse the HTTP requests that clients make to our services. For example, it filters specific IP addresses by creating blacklists. These devices have undergone an evolution in time and might be classified into three types:
The first one can detect malicious pattern matches and use whitelists and blacklists to monitor traffic and cyber attacks.
The second one can automatically generate whitelists of acceptable request patterns, i.e., not considered dangerous for computer applications; the inconvenience of this generation is that human intervention is still required to verify the correctness of the lists automatically generated by the system.
The third one, where threat detection is based on logical rules, represents the most modern generation and combines the technologies of the second type WAFs to which they add real-time packet analysis with a categorisation of attacks based on boolean logic. The most interesting feature of this type of WAFs is the proactive defence of applications, capable of locating and identifying vulnerabilities in the services we provide before an attack occurs.
4.10. Backup
A final aspect that needs to be configured concerns backup policies. The backups must guarantee that they can be restored quickly, minimising data loss in the event of disasters and protecting as far as possible against cyber-attacks [
51]. Various parameters must be defined for data backup in the architecture described, which differ according to the service analysed. The first configuration parameter is the time interval between one backup and the following. The second parameter to configure is the retention time for a backup before its removal from the system.
Periodic and incremental backups are necessary: this means storing only the data that have really changed since the previous backup on disk. It is advisable to backup the database, the shared network file system disk, and the system disk used by the virtual machines. A proper value could be at least one backup per day and a retention time of at least three weeks to prevent threats that can damage data, such as ransomware attacks that aim to corrupt even system backups.
For the Redis database that manages the session, we did not set any backups because, in our use case, the most serious situation that could happen is that the user is asked again to enter the username and password to access the system. We also set up a permanent backup made when the system was fully functional and kept for possible future needs. All the backups described above are encrypted, password-protected, and cannot be accessed outside the infrastructure.
5. Discussion
The case study infrastructure we propose has been operational for about nine months. During this time, we have obtained statistics and metrics that have allowed us to refine the model until it reached its current state. The red line shown in
Figure 4 indicates the metric that induces the auto-scaling up (increasing in the number of server instances, fast process) and down (decreasing the number of server instances, slow process).
Every day about 1000 users use the web application delivered through the infrastructure. The users are divided into different roles, characterised by different activities, depending on the role. The average duration of the sessions is two hours; however, the type of activity differs according to the role assumed: in some cases, they are sporadic sessions, linked to information maintenance activities, of unpredictable duration, which can take place at any time of the day or night. In the other case, sessions take place at the same time, even in very large groups of users, and are characterised by intense activity for a period varying between half an hour and two hours. During this time, generally, a user performs operations that require a high number of disk input and output operations and a high number of database operations. We have extracted some graphs that we believe are significant for the functioning of the infrastructure; in particular, to make the data easily readable and interpretable, we focused on a time range of two weeks. A more extended period of time would have made it difficult to highlight the peaks and trends in the use and load levels of the system.
The data collected shows that designing a horizontally scalable architecture is the best solution that allows the expected level of performance to be borrowed with operating costs.
Figure 4 illustrates the data collected on the number of requests per time unit (see
Figure 4a), the number of requests for read and write operations (see
Figure 4b), the use of the shared network file system (see
Figure 4c) and operating costs (see
Figure 4d). Analysing the graphs, it can be seen that, when there are peaks in the number of requests, there are corresponding peaks in the other quantities measured. This proves that resources are only used when really needed, guaranteeing adequate performance and optimising costs. The use of the infrastructure undoubtedly influences the cost, but the costs curve shows an almost flat behaviour in correspondence of an idle system. However, thanks to the use of auto-scaling technologies, the infrastructure can be scaled down at low activity levels. Keeping an IT infrastructure active in an “always-on” state, with a high number of servers capable of satisfying the requests of thousands of users, would involve an unnecessary waste of resources. An infrastructure such as the one described in this paper, which is limited to low-end resources, may involve a monthly expense of approximately 550 USD.
6. Results
This section describes the experimental results we have collected.
Figure 4 shows also various statistics regarding the load balancer and the shared network file system disk.
Figure 4a shows the total number of requests received by the load balancer calculated in 5-min intervals. As previously discussed, this is a significant parameter because it identifies the appropriate moments to activate horizontal auto-scaling policies. A too high number of requests could mean high latency input and output operations and do not burden the CPU, but which cause delays in the delivery of services to users, increasing the platform’s response time. Especially in the first weeks, we monitored the data obtained from this metric very carefully, and on it, we based our auto-scaling policy. If the red line in
Figure 4a, which represents the number 26,000, is crossed, new nodes for PHP backend management will be created. The addition of new nodes occurs directly proportional to the load encountered by the system; when the load level returns to a state of rest, they will be progressively removed the excess nodes until returning to the initial state where there are only two nodes: one on the primary Availability Zone and one on the secondary Availability Zone.
Figure 4b shows the three different types of data access on disk: writings, readings and metadata access. In our case of use, the operations carried out more markedly are those of reading compared to those of writing.
Figure 4c illustrates the utilisation of the shared network file system disk by the infrastructure in terms of percentage throughput. The shared network file system disk configured by us has high performance in reading and writing, and that is why, even in peak moments, 10% of the maximum allowed throughput has not been exceeded.
Figure 5 shows the graph of the response time in the considered range of two weeks and a sampling time of 5 min. As we can see, the response time is excellent, except for a few peaks where it reaches an acceptable value between 1 and 2 s. These peaks coincide with an extreme stress period for the infrastructure because many users are connected at the same time, carrying out intense activities, or a maintenance system procedure involving intense access to the persistent storage has been carried out. In fact, the peak observed in
Figure 5 on 14 December at 7:25 p.m. is also observed in
Figure 4c at the same time interval. Meanwhile, the peaks on 10 December after the 6:20 a.m. and 4:15 p.m. marks are also related to the peaks shown in
Figure 6a (CPU load) and
Figure 4a (number of requests/5 min). The average response time is 21.7 milliseconds and the standard deviation is 76.3 milliseconds.
Figure 6 shows various statistics regarding the containers, the SQL database, and the Redis servers. In particular,
Figure 6a shows the average CPU usage levels of the containers that manage the PHP Web Server. As one can see, the average CPU load is not constant, but there are load peaks; these are due to user activity that occurs intensely only in certain time bands.
Figure 6b shows the average CPU usage of the SQL database. Generally, the CPU usage of the database with our application is particularly low, the peaks that are visible in Figure are due to a script, which runs every night at 1:00 a.m. and cleans the system from the activity that users carried out during the previous day by securely archiving data. In
Figure 6c, you can see the average RAM trend of the containers that manage the PHP Web Server. Our application needs a modest amount of RAM: the average occupation is generally less than 40% of the 2048 MiB available on each node.
It is interesting to note that there are areas in the graph where the peaks are very close to zero: this is due to a system update that we have carried out and which involved the restart of the containers. The technique we use to carry out an update, or the implementation of a security patch in the code used by the nodes, is the following: we run two or more nodes with the updated code, which runs in parallel to the nodes that use the previous code version. After the new nodes are started up and operational, in about 5 min, the old nodes will gradually stop working and will be shut down and decommissioned. In this way, users will not notice any disruptions and the continuity of the service is guaranteed. Upon restart, the new nodes are restarted with a RAM usage of less than 10%.
In
Figure 6d, you can see the average RAM trend of the Redis servers. Our application uses Redis servers only for user session management. The session is defined by a simple hexadecimal string, which occupies a minimal amount of memory, which is why, even with more than 1000 daily users, we observe an average use of RAM of less than 3% of the 512 MiB made available to the server.
7. Conclusions
This article discusses techniques for efficiently delivering web applications that provide an adequate level of service while optimising operating costs. We believe that what is presented in our use case can help organisations efficiently release their applications, guaranteeing the respect of personal data and the durability of the stored one. The solution presented lends itself to be implemented with different Cloud platforms and is based on open solutions, limiting the lock-in phenomenon by various Cloud providers. This paper also presents a possible implementation of a service that guarantees high fault tolerance and the ability to scale its computational power according to the number of incoming requests from users. We have discussed an efficient and modern model on which applications running in the cloud can be based. The architecture is made up of two availability zones in an Active/Active (50/50) configuration that are meant to support each other. In fact, if there is a technical problem in the main availability zone, the secondary availability zone will be perfectly capable of operating and ensuring the continuity of the service provided. The comparison between the various graphs that have been widely discussed in
Section 5 and
Section 6 makes the goodness of the choices made clear; in fact, the data relative to the response times measured for the application in the same temporal range show excellent values with peaks that are associated with events of exceptional load on the server, and, even though they are considerable, they do not exceed two seconds. This leads us to conclude that the infrastructure associated with the presented case study has the optimal characteristics to allow access to the application, which is fluid and constantly able to serve users with optimal service levels.
Author Contributions
Conceptualization, D.P., M.S. and O.G.; Data curation, D.P., M.S. and O.G.; Investigation, D.P., M.S. and O.G.; Methodology, D.P., M.S. and O.G.; Software, D.P., M.S.; Supervision, O.G.; Validation, D.P., M.S.; Writing—original draft, D.P., M.S. and O.G.; Writing—review & editing, D.P., M.S. and O.G. All authors have read and agreed to the published version of the manuscript.
Funding
This work was supported in part by the European Chemistry Thematic Network (ECTN), EchemTest® project, through recurrent donations to the LibreEOL Project of the Department of Mathematics and Computer Science of Perugia University and in part by the Italian Not for profit organization ICCSA (Fiscal ID IT01814970768).
Conflicts of Interest
The authors declare no conflict of interest.
References
- Fox, G.C.; Williams, R.D.; Messina, P.C. Parallel Computing Works! Elsevier: Amsterdam, The Netherlands, 2014. [Google Scholar]
- Golub, G.H.; Ortega, J.M. Scientific Computing: An Introduction with Parallel Computing; Elsevier: Amsterdam, The Netherlands, 2014. [Google Scholar]
- Stănciulescu, G.C.; Dumitrescu, F. Optimizing the IT Structures of Tourism SMEs Using Modern Applications and Resources (Cloud). Procedia Econ. Financ. 2014, 15, 1769–1778. [Google Scholar] [CrossRef]
- Saura, J.R.; Ribeiro-Soriano, D.; Palacios-Marqués, D. Evaluating security and privacy issues of social networks based information systems in Industry 4.0. Enterp. Inf. Syst. 2021, 1–17. [Google Scholar] [CrossRef]
- Rashid, Z.N.; Zeebaree, S.R.; Shengul, A. Design and analysis of proposed remote controlling distributed parallel computing system over the cloud. In Proceedings of the IEEE 2019 International Conference on Advanced Science and Engineering (ICOASE), Zakho, Iraq, 2–4 April 2019; pp. 118–123. [Google Scholar]
- Alzakholi, O.; Haji, L.; Shukur, H.; Zebari, R.; Abas, S.; Sadeeq, M. Comparison among cloud technologies and cloud performance. J. Appl. Sci. Technol. Trends 2020, 1, 40–47. [Google Scholar] [CrossRef]
- Madougou, S.; Varbanescu, A.L.; Laat, C.D.; Nieuwpoort, R.V. A Tool for Bottleneck Analysis and Performance Prediction for GPU-Accelerated Applications. In Proceedings of the 2016 IEEE International Parallel and Distributed Processing Symposium Workshops (IPDPSW), Chicago, IL, USA, 23–27 May 2016; pp. 641–652. [Google Scholar] [CrossRef]
- Li, H.; Weng, S.; Tong, J.; He, T.; Chen, W.; Sun, M.; Shen, Y. Composition of resource-service chain based on evolutionary algorithm in distributed cloud manufacturing systems. IEEE Access 2020, 8, 19911–19920. [Google Scholar] [CrossRef]
- Biondi, G.; Franzoni, V.; Gervasi, O.; Perri, D. An Approach for Improving Automatic Mouth Emotion Recognition. In Computational Science and Its Applications—ICCSA 2019, Proceedings of the 19th International Conference, Saint Petersburg, Russia, 14 July 2019; Proceedings, Part I, Lecture Notes in Computer Science; Misra, S., Gervasi, O., Murgante, B., Stankova, E.N., Korkhov, V., Torre, C.M., Rocha, A.M.A.C., Taniar, D., Apduhan, B.O., Tarantino, E., Eds.; Springer Nature AG: Cham, Switzerland, 2019; Volume 11619, pp. 649–664. [Google Scholar] [CrossRef]
- Franzoni, V.; Tasso, S.; Pallottelli, S.; Perri, D. Sharing Linkable Learning Objects with the Use of Metadata and a Taxonomy Assistant for Categorization. In Computational Science and Its Applications—ICCSA 2019, Proceedings of the 19th International Conference, Saint Petersburg, Russia, 14 July 2019; Proceedings, Part II, Lecture Notes in Computer Science; Misra, S., Gervasi, O., Murgante, B., Stankova, E.N., Korkhov, V., Torre, C.M., Rocha, A.M.A.C., Taniar, D., Apduhan, B.O., Tarantino, E., Eds.; Springer Nature: London, UK, 2019; Volume 11620, pp. 336–348. [Google Scholar] [CrossRef]
- Benedetti, P.; Perri, D.; Simonetti, M.; Gervasi, O.; Reali, G.; Femminella, M. Skin Cancer Classification Using Inception Network and Transfer Learning. In Computational Science and Its Applications—ICCSA 2020, Proceedings of the 20th International Conference, Cagliari, Italy, 1–4 July 2020; Proceedings, Part I, Lecture Notes in Computer Science; Gervasi, O., Murgante, B., Misra, S., Garau, C., Blecic, I., Taniar, D., Apduhan, B.O., Rocha, A.M.A.C., Tarantino, E., Torre, C.M., et al., Eds.; Springer Nature: London, UK, 2020; Volume 12249, pp. 536–545. [Google Scholar] [CrossRef]
- Laganà, A.; Gervasi, O.; Tasso, S.; Perri, D.; Franciosa, F. The ECTN Virtual Education Community Prosumer Model for Promoting and Assessing Chemical Knowledge. In Computational Science and Its Applications—ICCSA 2018, Proceedings of the 18th International Conference, Melbourne, VIC, Australia, 2–5 July 2018; Proceedings, Part V, Lecture Notes in Computer Science; Gervasi, O., Murgante, B., Misra, S., Stankova, E.N., Torre, C.M., Rocha, A.M.A.C., Taniar, D., Apduhan, B.O., Tarantino, E., Ryu, Y., Eds.; Springer: Berlin, Germany, 2018; Volume 10964, pp. 533–548. [Google Scholar] [CrossRef]
- Perri, D.; Simonetti, M.; Lombardi, A.; Lago, N.F.; Gervasi, O. Binary Classification of Proteins by a Machine Learning Approach. In Computational Science and Its Applications—ICCSA 2020, Proceedings of the 20th International Conference, Cagliari, Italy, 1–4 July 2020; Proceedings, Part VII, Lecture Notes in Computer Science; Gervasi, O., Murgante, B., Misra, S., Garau, C., Blecic, I., Taniar, D., Apduhan, B.O., Rocha, A.M.A.C., Tarantino, E., Torre, C.M., et al., Eds.; Springer Nature: London, UK, 2020; Volume 12255, pp. 549–558. [Google Scholar] [CrossRef]
- Delibasis, K.; Maglogiannis, I.; Georgakopoulos, S.; Kottari, K.; Plagianakos, V. Assessing image analysis filters as augmented input to convolutional neural networks for image classification. In International Conference on Artificial Neural Networks; Springer Nature: London, UK, 2018; pp. 188–196. [Google Scholar]
- Georgakopoulos, S.V.; Plagianakos, V.P. A novel adaptive learning rate algorithm for convolutional neural network training. In International Conference on Engineering Applications of Neural Networks; Springer: Berlin, Germany, 2017; pp. 327–336. [Google Scholar]
- Chakrabarty, S.; Engels, D.W. Secure Smart Cities Framework Using IoT and AI. In Proceedings of the IEEE 2020 Global Conference on Artificial Intelligence and Internet of Things (GCAIoT), Dubai, United Arab Emirates, 12–16 December 2020; pp. 1–6. [Google Scholar]
- Gao, J.; Bi, W.; Liu, X.; Li, J.; Shi, S. Generating Multiple Diverse Responses for Short-Text Conversation. Proc. AAAI Conf. Artif. Intell. 2019, 33, 6383–6390. [Google Scholar] [CrossRef]
- Bulman, G.; Fairlie, R. Chapter 5—Technology and Education: Computers, Software, and the Internet. In Handbook of the Economics of Education; Hanushek, E.A., Machin, S., Woessmann, L., Eds.; Elsevier: Amsterdam, The Netherlands, 2016; Volume 5, pp. 239–280. [Google Scholar] [CrossRef]
- Chauhan, S. A meta-analysis of the impact of technology on learning effectiveness of elementary students. Comput. Educ. 2017, 105, 14–30. [Google Scholar] [CrossRef]
- Simonetti, M.; Perri, D.; Amato, N.; Gervasi, O. Teaching Math with the Help of Virtual Reality. In Computational Science and Its Applications—ICCSA 2020, Proceedings of the 20th International Conference, Cagliari, Italy, 1–4 July 2020; Proceedings, Part VII, Lecture Notes in Computer Science; Gervasi, O., Murgante, B., Misra, S., Garau, C., Blecic, I., Taniar, D., Apduhan, B.O., Rocha, A.M.A.C., Tarantino, E., Torre, C.M., et al., Eds.; Springer Nature: London, UK, 2020; Volume 12255, pp. 799–809. [Google Scholar] [CrossRef]
- Au-Yong-Oliveira, M.; Gonçalves, R.; Martins, J.; Branco, F. The social impact of technology on millennials and consequences for higher education and leadership. Telemat. Inform. 2018, 35, 954–963. [Google Scholar] [CrossRef]
- Perri, D.; Simonetti, M.; Tasso, S.; Gervasi, O. Learning Mathematics in an Immersive Way. In Software Usability; IntechOpen: London, UK, 2021. [Google Scholar]
- Park, E.; Del Pobil, A.P.; Kwon, S.J. The role of Internet of Things (IoT) in smart cities: Technology roadmap-oriented approaches. Sustainability 2018, 10, 1388. [Google Scholar] [CrossRef]
- Azzawi, M.A.; Hassan, R.; Bakar, K.A.A. A review on Internet of Things (IoT) in healthcare. Int. J. Appl. Eng. Res. 2016, 11, 10216–10221. [Google Scholar]
- Saura, J.R.; Palacios-Marqués, D.; Ribeiro-Soriano, D. Using data mining techniques to explore security issues in smart living environments in Twitter. Comput. Commun. 2021, 179, 285–295. [Google Scholar] [CrossRef]
- Saggi, M.K.; Jain, S. A survey towards an integration of big data analytics to big insights for value-creation. Inf. Process. Manag. 2018, 54, 758–790. [Google Scholar] [CrossRef]
- Mariotti, M.; Gervasi, O.; Vella, F.; Cuzzocrea, A.; Costantini, A. Strategies and systems towards grids and clouds integration: A DBMS-based solution. Future Gener. Comput. Syst. 2018, 88, 718–729. [Google Scholar] [CrossRef]
- Abdelbaky, M.; Diaz-Montes, J.; Parashar, M.; Unuvar, M.; Steinder, M. Docker Containers across Multiple Clouds and Data Centers. In Proceedings of the 2015 IEEE/ACM 8th International Conference on Utility and Cloud Computing (UCC), Limassol, Cyprus, 7–10 December 2015; pp. 368–371. [Google Scholar] [CrossRef]
- Wan, X.; Guan, X.; Wang, T.; Bai, G.; Choi, B.Y. Application deployment using Microservice and Docker containers: Framework and optimization. J. Netw. Comput. Appl. 2018, 119, 97–109. [Google Scholar] [CrossRef]
- Guan, X.; Wan, X.; Choi, B.Y.; Song, S.; Zhu, J. Application Oriented Dynamic Resource Allocation for Data Centers Using Docker Containers. IEEE Commun. Lett. 2017, 21, 504–507. [Google Scholar] [CrossRef]
- Casalicchio, E.; Iannucci, S. The state-of-the-art in container technologies: Application, orchestration and security. Concurr. Comput. Pract. Exp. 2020, 32, e5668. [Google Scholar] [CrossRef]
- Naouri, A.; Wu, H.; Nouri, N.A.; Dhelim, S.; Ning, H. A Novel Framework for Mobile-Edge Computing by Optimizing Task Offloading. IEEE Internet Things J. 2021, 8, 13065–13076. [Google Scholar] [CrossRef]
- Maliszewski, A.M.; Vogel, A.; Griebler, D.; Roloff, E.; Fernandes, L.G.; Philippe O. A., N. Minimizing Communication Overheads in Container-based Clouds for HPC Applications. In Proceedings of the 2019 IEEE Symposium on Computers and Communications (ISCC), Barcelona, Spain, 29 June–3 July 2019; pp. 1–6. [Google Scholar] [CrossRef]
- Zhang, W.Z.; Holland, D.H. Using Containers to Execute SQL Queries in a Cloud. In Proceedings of the 2018 IEEE/ACM International Conference on Utility and Cloud Computing Companion (UCC Companion), Zurich, Switzerland, 17–20 December 2018; pp. 26–27. [Google Scholar] [CrossRef]
- Al-Masni, M.A.; Al-Antari, M.A.; Park, J.M.; Gi, G.; Kim, T.Y.; Rivera, P.; Valarezo, E.; Choi, M.T.; Han, S.M.; Kim, T.S. Simultaneous detection and classification of breast masses in digital mammograms via a deep learning YOLO-based CAD system. Comput. Methods Programs Biomed. 2018, 157, 85–94. [Google Scholar] [CrossRef]
- Chang, V. Towards a big data system disaster recovery in a private cloud. Ad Hoc Netw. 2015, 35, 65–82. [Google Scholar] [CrossRef]
- Khoshkholghi, M.A.; Abdullah, A.; Latip, R.; Subramaniam, S.; Othman, M. Disaster Recovery in Cloud Computing: A Survey. Comput. Inf. Sci. 2014, 7, 39–54. [Google Scholar] [CrossRef]
- Hamadah, S. Cloud-based disaster recovery and planning models: An overview. ICIC Express Lett. 2019, 13, 593–599. [Google Scholar]
- Al Nuaimi, K.; Mohamed, N.; Al Nuaimi, M.; Al-Jaroodi, J. A survey of load balancing in cloud computing: Challenges and algorithms. In Proceedings of the IEEE 2012 Symposium on Network Cloud Computing and Applications, Cambridge, MA, USA, 23–25 August 2012; pp. 137–142. [Google Scholar]
- Mishra, S.K.; Sahoo, B.; Parida, P.P. Load balancing in cloud computing: A big picture. J. King Saud-Univ.-Comput. Inf. Sci. 2020, 32, 149–158. [Google Scholar] [CrossRef]
- Mesbahi, M.; Rahmani, A.M. Load balancing in cloud computing: A state of the art survey. Int. J. Mod. Educ. Comput. Sci. 2016, 8, 64. [Google Scholar] [CrossRef]
- Matallah, H.; Belalem, G.; Bouamrane, K. Evaluation of NoSQL databases: MongoDB, Cassandra, HBase, Redis, Couchbase, OrientDB. Int. J. Softw. Sci. Comput. Intell. (IJSSCI) 2020, 12, 71–91. [Google Scholar] [CrossRef]
- Tongkaw, S.; Tongkaw, A. A comparison of database performance of MariaDB and MySQL with OLTP workload. In Proceedings of the 2016 IEEE conference on open systems (ICOS), Langkawi Island, Kedah, 10–12 October 2016; pp. 117–119. [Google Scholar]
- Zaslavskiy, M.; Kaluzhniy, A.; Berlenko, T.; Kinyaev, I.; Krinkin, K.; Turenko, T. Full automated continuous integration and testing infrastructure for MaxScale and MariaDB. In Proceedings of the IEEE 2016 19th Conference of Open Innovations Association (FRUCT), Jyväskylä, Finland, 7–11 November 2016; pp. 273–278. [Google Scholar]
- Feuerlicht, G.; Pokornỳ, J. Can relational DBMS scale up to the cloud? In Information Systems Development; Springer: Berlin, Germany, 2013; pp. 317–328. [Google Scholar]
- Boettiger, C. An introduction to Docker for reproducible research. ACM SIGOPS Oper. Syst. Rev. 2015, 49, 71–79. [Google Scholar] [CrossRef]
- Turnbull, J. The Docker Book: Containerization Is the New Virtualization; Glitch: New York, NY, USA, 2014. [Google Scholar]
- Vaquero, L.M.; Rodero-Merino, L.; Buyya, R. Dynamically scaling applications in the cloud. ACM SIGCOMM Comput. Commun. Rev. 2011, 41, 45–52. [Google Scholar] [CrossRef]
- Papadopoulos, P.; Pitropakis, N.; Buchanan, W.J.; Lo, O.; Katsikas, S. Privacy-Preserving Passive DNS. Computers 2020, 9, 64. [Google Scholar] [CrossRef]
- Betarte, G.; Giménez, E.; Martínez, R.; Álvaro, P. Machine learning-assisted virtual patching of web applications. arXiv 2018, arXiv:cs.CR/1803.05529. [Google Scholar]
- Jin, Y.; Tomoishi, M.; Matsuura, S.; Kitaguchi, Y. A secure container-based backup mechanism to survive destructive ransomware attacks. In Proceedings of the IEEE 2018 International Conference on Computing, Networking and Communications (ICNC), Maui, HI, USA, 5–8 March 2018; pp. 1–6. [Google Scholar]
| Publisher’s Note: MDPI stays neutral with regard to jurisdictional claims in published maps and institutional affiliations. |
© 2022 by the authors. Licensee MDPI, Basel, Switzerland. This article is an open access article distributed under the terms and conditions of the Creative Commons Attribution (CC BY) license (https://creativecommons.org/licenses/by/4.0/).


