Article

Application of Generative Adversarial Network to Optimize Vehicle Allocation at Dispatch Stations of Paratransit Services

1
Department of Industrial Engineering and Management, National Yunlin University of Science and Technology, Yunlin 640301, Taiwan
2
National Taiwan University Hospital, Yunlin 640203, Taiwan
3
Preparatory Office of National Center for Geriatrics and Welfare Research, Yunlin 632007, Taiwan
*
Author to whom correspondence should be addressed.
Electronics 2022, 11(3), 423; https://doi.org/10.3390/electronics11030423
Submission received: 31 December 2021 / Revised: 23 January 2022 / Accepted: 26 January 2022 / Published: 30 January 2022
(This article belongs to the Special Issue 5G Networks for Mobile and Vehicular Communication)

Abstract

:
As aging populations increase worldwide, many governments have introduced the concept of paratransit services to assist individuals with limited mobility with transportation. A successful paratransit service must be able to satisfy most requests to the system; this success is typically related to the allocation of vehicles to dispatch stations. A suitable configuration can reduce unnecessary travel time and thus serve more people. This resembles the classic Dial-a-Ride problem, which previous studies have solved using heuristic algorithms. Most of these algorithms, however, incur heavy computational costs and, therefore, cannot be operated online, especially when there are many conditions to consider, many configuration requirements, or many vehicles requested. Therefore, this paper proposes an approach based on the generative adversary network (GAN), which can reduce computation significantly. In online environments, this approach can be implemented in just a few seconds. Furthermore, the amount of computation is not affected by the number of conditions, configuration requirements, or vehicles requested. This approach is based on three important concepts: (1) designing a GAN to solve the target problem; (2) using an improved Voronoi diagram to divide the overall service area to generate the input of the GAN generator; (3) using well-known system simulation software Arena to swiftly generate many conditions for the target problem and their corresponding best solutions to train the GAN. The efficiency of the proposed approach was verified using a case study of paratransit services in Yunlin, Taiwan.

1. Introduction

In recent years, the transportation service known as paratransit services [1,2] (referred to as “community transport” in the United Kingdom) has received an increasing amount of attention. Unlike existing public transportation systems, paratransit services provide on-demand, door-to-door service from any origin to any destination within the service area; this type of transportation is widely applied in various social welfare services. The most common are government-funded service teams that carry patients with limited mobility to and from hospitals at designated times. For instance, Figure 1a displays the map of a city, including two dispatch stations, A and B, and three hospitals, α, β, and γ. Suppose the team has two small buses at A and one small bus at B. The operating schedule of Buses 1~3 is presented in Figure 1b; the timeline on the right shows when the citizens are scheduled for a ride. In this schedule, we can see that citizen x requested that a bus take him from his home to Hospital α at 9:30 A.M., so the team dispatches Bus 1 from A, the station nearest to citizen x’s home. Next, citizens y and z requested buses to Hospitals β and γ, respectively, also at 9:30 A.M., so the team dispatches Bus 2 and Bus 3 from A and B for these citizens. Note that while citizen z’s home is closer to A than to B, there are no more buses at A at this point, so the team can only dispatch the bus at B. After x, y, and z finish seeing the doctor, Buses 1~3 will take them home and then return to their original dispatch locations and wait for the next service request. As shown in Figure 1b, Buses 1 and 2 both serve other citizens in the afternoon.
The efficiency of daily paratransit service dispatch depends on the number of citizens who made requests but could not get service. A day in which more citizens cannot get a ride to their hospital appointments represents poorer dispatch efficiency. In Figure 1b, all five citizen requests made on that day were fulfilled, representing excellent dispatch efficiency. However, under the conditions presented in Figure 1a, if the team were to move all three buses to B (as shown in Figure 2a), the schedule would shift as shown in Figure 2b. After Buses 1~3 completed their services for x, y, and z, they would be unable to fulfill citizen requests in the afternoon, as by the time they would have returned to B, it would be close to the end of the service period. Dispatch efficiency would thus be reduced. This example demonstrates that the efficiency of paratransit services is highly correlated with the allocation of buses at dispatch stations. Thus, optimizing the vehicle allocation of paratransit service teams is an important avenue of research.
Dial-a-Ride [3] is a classic scheduling problem focused on planning or routing multiple rides requested by citizens simultaneously. Research using this approach can be divided into two types of operating models: single-vehicle models [4,5] and multi-vehicle models [6,7]. In the former, a single vehicle provides different types of services. Psaraftis [4,5] was the first to discuss this model, which uses the weighted total of total vehicle travel time, citizen weight time, and citizen ride time as an objective function solved using dynamic programming. Later, Desrosiers et al. [8] presented a solution using forward dynamic programming in conjunction with two-dimensional labeling and claimed that their approach could effectively increase the number of fulfilled citizen requests. Recently, Sexton and Boldin [5,6] proposed heuristic algorithms and demonstrated the validity of their proposed approach through experiments. Unfortunately, these methods cannot be directly applied to the problem considered in this study, which involves more than one vehicle providing different services.
The paratransit service issue discussed in this study resembles the multi-vehicle model [6,7], in which multiple vehicles provide the same service at the same time. The first multi-vehicle Dial-a-Ride models were developed by Jaw et al. [6] and Bodin and Sexton [7]; both studies proposed heuristic algorithms as solutions. Jaw et al. [6] additionally considered several constraints and incorporated a sequential insertion procedure to derive the optimal solution. In contrast, Bodin and Sexton [7] developed a cluster-first, route-second heuristic algorithm and used experiments to demonstrate the validity of their approach. Other researchers [9,10,11] expanded upon these heuristic-algorithm-based solutions. Dial-a-Ride problems can vary significantly from case to case, so some researchers dedicated themselves to developing and verifying algorithms for real-world cases, such as Madsen et al. [12], Toth and Vigo [13,14], and Borndörfer et al. [15]. While these studies achieved considerable success, we found that applying them to the context of paratransit services in practice is limited by the following shortcomings: (1) Such heuristic algorithms generally consider too many conditions, such as vehicle route distance and citizen wait time. Expecting employees to input these conditions one by one into the algorithm greatly increases their workload. (2) The online computation time (i.e., from input to output) of heuristic algorithms can be unfeasibly long, especially when the numbers of conditions, demands, and vehicles increase. The solution times of existing Dial-a-Ride approaches are shown in Table 1. Since Dial-a-Ride is a customization problem, the definition and conditions set by each paper may differ. However, it is clear that most of the heuristic algorithms require more than 5 min, or even exceed half an hour to run online, even when taking into account only 1 vehicle and 70 requirements. In practice, when the number of vehicles and number of requirements far exceed these values, the majority of heuristic algorithms will take more than half an hour to finish computing. If an algorithm were to take 3 to 4 h to obtain a result, employees would have to, at the latest, begin the calculations before getting off work the day before in order to determine which station each vehicle should be stationed at before work the next day. In other words, heuristic algorithms do not have the capacity to satisfy same-day requests. In practice, many citizens do not make requests on the paratransit service system until after work on the previous day or before work on the day in question. Therefore, a novel approach is needed.
We propose using generative adversarial networks (GANs) to aid paratransit services in allocating vehicles at their dispatch stations. A GAN is a type of deep learning model in the field of artificial intelligence; it can learn historical data and then generate new data with similar features. Goodfellow et al. [26] proposed the first version of GAN, which can learn existing handwritten numbers or human face data and then generate realistic handwritten numbers or human faces. Karras et al. [27] proposed progressive GAN and demonstrated that it can greatly improve results in terms of human face generation. Researchers have applied GANs to different types of images in recent years. For instance, Zhang et al. [28] proposed the multi-view GAN, which can generate realistic vehicle images with any view of the frame as the condition. GANs use two deep learning networks, a generator network and a discriminator network, to learn from each other to achieve realistic data generation, as shown in Figure 3. The generator creates realistic data with features that are similar to those of the historical data in the set of input vectors. The discriminator uses historical data to determine whether the generated data are real. During the training process of GAN, the generator and the discriminator are repeatedly trained. As the generator becomes more proficient, the discriminator must become better at differentiating the real data from the generated data, and vice versa.
Through several training rounds, the generated data become increasingly similar to the historical data. In this study, we established a generator model and a discriminator model as shown in Figure 4. The objective of the generator is to generate approximately optimal vehicle allocations for the dispatch stations after obtaining the number of paratransit service requests in each area on that day. The discriminator uses the optimal solutions that we obtained beforehand based on various conditions to verify the optimality of the generated results. After several training rounds, we anticipated that the discriminator would be able to simulate various conditions in the target paratransit service environment and that the vehicle allocations produced by the generator would be the approximately optimal solution. These results can be swiftly and conveniently calculated, making this approach well-suited to the daily context of paratransit service dispatch stations. Specifically, paratransit service employees need only input the numbers of citizen requests in various areas. Compared to inputting all quantified paratransit service conditions into heuristic algorithms, this approach can significantly lighten their workload. Furthermore, when our method is operated online, it is only necessary to execute the generator once to obtain the approximately optimal vehicle allocation, which takes tens of seconds at the most. In contrast, heuristic algorithms require several hours to obtain the optimal results. The proposed approach allows paratransit service employees to confirm the total number of paratransit service requests when they get to work in the morning before deciding on vehicle allocations. This enhances the efficiency of paratransit services. This study is the first to apply a GAN to the Dial-a-Ride problem.
To apply a GAN to the target problem, we must overcome two issues inherent to this type of approach: (1) determining the generator inputs and (2) generating a training set for the discriminator. We first discuss the means of generating inputs. As previously explained, the objective of the generator is to generate realistic vehicle allocations. Based on the Voronoi diagram [29,30] and the operating concepts of paratransit services, we developed a novel space partitioning algorithm that divides the paratransit service area into multiple sub-regions based on the locations of the dispatch stations. Citizen homes in the sub-regions are assigned to the nearest or second-nearest dispatch stations so that the number of citizen requests in each sub-region each day will equal the generator input. Next, we discuss the means of generating a training set for the discriminator. As previously mentioned, each item of data in the training set is the optimal solution for vehicle allocations under certain request circumstances. As this data set will be used to train the discriminator, which is a deep learning model, the amount of data must be substantial. To establish such a data set, heuristic algorithms are unsuitable, because they require an enormous amount of time to obtain a new solution whenever there is a change in the request circumstances, and our context features numerous possible request circumstances. We thus propose using the well-known system simulation program, Arena, to obtain the solution. Arena allows users to build various real-world environments. Once the environment has been established, Arena will use the equations designated by the user to generate large quantities of random objects that operate in the environment. Arena then records the various parameters of the objects and the environment and utilizes the records to determine the approximately optimal solution of the environment established by the user. Note that compared to heuristic algorithms, which require substantial amounts of time to obtain each solution, Arena can produce the results for each set of environmental conditions in tens of seconds. To summarize, in this paper we propose a new GAN-based framework for vehicle allocation problems (GAN-VAPS) for the context of paratransit services. GAN-VAPS includes three novel concepts: (1) using a GAN rather than conventional heuristic algorithms to obtain the solution, (2) designing a novel space partitioning algorithm that divides the entire paratransit service area into multiple sub-regions based on the locations of the dispatch stations and uses the total number of citizen requests in these sub-regions as the input of the generator in the GAN, and (3) using Arena to obtain the optimal vehicle allocations at dispatch stations for numerous different conditions and using these results as the training set for the GAN discriminator. We verified the efficacy of this approach using a real-world case study.
The remainder of this study is organized as follows. Section 2 introduces research relevant to this study, and Section 3 explains the content of our algorithm. Section 4 introduces our experimental simulations, and Section 5 presents our conclusion and suggestions for future work.

2. Related Work

This chapter introduces two issues associated with this study: Dial-a-Ride problems and system simulation.

2.1. Types of Dial-a-Ride Problems

Dial-a-Ride is a classic problem that has been widely explored [3,9,31]. However, due to space limitations, we introduce only those that are closely relevant to this study. First, Masmoudi et al. [32] proposed three types of heuristic algorithms to find the approximately optimal solution in a large search space within a certain amount of time while considering multiple vehicle stations, multiple routes, and driver break time. Masmoudi et al. [24] then proposed a hybrid genetic algorithm for the heterogeneous Dial-a-Ride problem to obtain initial route planning solutions for crossover problems. To solve multi-depot transfer and transportation problems involving multiple patients going to hospitals or clinics for medical attention and rehabilitation, Detti et al. [33] used the variable neighborhood search and tabu search algorithms to obtain optimal solutions. Their experimental results proved that their approach achieved relatively good performance in terms of costs and service quality. Tellez et al. [34] discovered that reallocating vehicles can effectively reduce transportation costs, but the solution is difficult to obtain due to varying passenger numbers and fixed vehicle numbers. As a result, they proposed a large neighborhood search heuristic algorithm, which they demonstrated using a case study transporting children with disabilities in France from their homes to medical centers. Paquay et al. [35] proposed a reactive algorithm for request cancelations or delays; however, they focused on making simple corrections to current plans rather than re-optimizing the entire plan in the event of disruptions. Marković et al. [36] proposed using statistics and a machine learning model to predict the maximum Dial-a-Ride demand. Riedler et al. [37] employed the Benders decomposition algorithm with mixed integer linear programming to meet maximum demand while considering user feelings.

2.2. Heuristic Algorithms for Dial-a-Ride Problems

This subsection outlines the four main types of heuristic algorithms that have been applied to Dial-a-Ride problems [38]: (1) Tabu search, (2) simulated annealing, (3) variable neighborhood search, and (4) large neighborhood search. We focus in particular on the differences between these and the proposed GAN-VAPS approach.
The Tabu search was proposed by Glover and Laguna [39]. This method first creates an initialized scheme and improves the quality of the solution by moving to another adjacent scheme. It has been proven to be helpful for jumping off local best solutions. Cordeau and Laporte [9] was the first study to apply the Tabu search to Dial-a-Ride problems. Subsequently, many scholars have explored its applicability to this topic, including Guerriero et al. [40], Paquette et al. [41], and Detti et al. [33].
Simulated annealing is a stochastic local-search metaheuristic algorithm inspired by the physical annealing process. The algorithm starts with a single point in the search space: each step chooses a “neighbor” before calculating the probability of reaching this neighbor from the existing location. If the probability is greater than the given threshold, the search goes to this neighbor; if the probability is small, it stays at the original position. Since such an approach is likely to fall into local best solutions, it might choose non-improved solutions at each step. Without guarantee of convergence, few researchers have used simulated annealing for Dial-a-Ride problems. These include Zidi et al. [42], Reinhardt et al. [43], and Braekers et al. [44].
The variable neighborhood search is an improved local search algorithm. It uses a neighborhood structure of different movements for alternating searches and claims to strike a good balance between concentration and evacuation. Its core philosophy is based on two important concepts: (1) the local optimal solution of one neighborhood structure is not necessarily the local optimal solution of another neighborhood, and (2) the global optimal solution is a local optimal solution for all possible neighbors. The latter concept makes this approach popular for Dial-a-Ride problems, for example, Detti et al. [33] and Muelas [45,46]. Souza et al. [47], Chen et al. [48], and Kaleche et al. [49] also successfully applied this approach in combination with other search methods.
The large neighborhood search is suitable for large-scale problems. Its search speed is faster than small neighborhood searches because it has a greater degree of local improvement at each iteration. Since Ropke and Pisinger [50] first applied this method to Dial-a-Ride problems, many scholars have explored this approach, including Gschwind and Drexl [25], Braekers and Kovacs [51], Hungerländer et al. [52], Masmoudi et al. [53], Montenegro et al. [54], Ma et al. [55], and Truden et al. [56].
These methods all obtain an initial solution, take this as the starting point, and continue to seek other solutions to approximate the best solution. Existing techniques to reduce online operations focus on reducing the number of solutions. However, no matter how many solutions are eliminated, all of the heuristic approaches need at least two more solutions, which means repeating the same calculation multiple times. In contrast, when using a GAN generator online, regardless of the input conditions, only one operation is required to obtain an approximate optimal solution without any repetition. Obviously, this puts the GAN-VAPS approach at a significant advantage over heuristic algorithms.

2.3. Definition of System Simulation and Related Work

In system simulation, simulation models describe the behavior processes or structures of systems, which use logical and numerical equations. For these, computer-based mathematical or logical models are constructed; basic models include structural models and quantitative analysis models. Simulation experiments are then conducted using these models. During simulation design, the models are evaluated as shown in Figure 5. The performance of the system is derived from the decision parameters and the system simulation model assumptions and becomes feedback for the decision parameters. This evaluation method enables the assessment of different combinations of decisions and advances the understanding of the operating behavior of the overall system through the simulation process, thereby improving the simulation from within and providing reference for new system designs.
However, the greatest advantage of simulations is that they can predict or analyze more complex behavior or assess the cost-effectiveness of existing and non-existing systems. Researchers previously divided system simulation methods into two categories: continuous and discrete system simulation. The main difference between the two categories is the mathematical model; the variables in continuous models change with time, whereas the variables in discrete models have event points, with discrete changes between event points. Common simulation software programs can be divided into three types: (1) Excel software, (2) simulation languages (e.g., Java, Visual Basic, C++), and (3) simulators (e.g., Arena, ProModel). The latter two are the most commonly used for simulation design. The advantage of simulation languages is that they are less restrictive with regard to the details of system definitions, range of application, and design model. Their disadvantages, however, are that the user must have a certain level of technical proficiency and that development using simulation languages is slower. In this study, we used the simulator Arena, which does not require a high level of technical proficiency for development, enables faster development speed, and offers many powerful analytical tools.
Arena has been applied in various fields. Regarding inventory and logistics problems, Vamanan et al. [57] combined Arena simulations with optimization using CPLEX to solve the supply chain problems of suppliers in logistics operations, including purchase, packaging, storage, and shipment. Dinu et al. [58] used Arena to simulate the arrival, waiting, loading, unloading, location occupation, and departure of ships in ports to improve the efficiency of these processes. Tasoglu and Yildiz [59] also used Arena to simulate the seaside operations in a typical dock storage area and incorporated simulated annealing to optimize the completion time of the last ship in the port with the objective of minimizing the duration of operating procedures. In airport operations, AlKheder et al. [60] performed simulations on the security inspection systems of checked baggage. With collected information as data, they used Arena to analyze the factors that influence baggage movement and wait time, ultimately improving the overall efficiency of airport procedures. With regard to vehicles and traffic, Okeke [61] used Arena to simulate the possibility of vacating more parking spots to provide directions for land development and planning and enhance the usage efficiency of electric vehicles. Karimi et al. [62] used Arena to simulate various pre-operative and operative procedures in hospitals. Improvements were made and the post-improvement results were investigated and analyzed. Azcarate et al. [63] proposed a novel simulation framework for more authentic mathematical modeling to optimize bed management in intensive care units.

3. GAN-Based Framework for Vehicle Allocation Problems (GAN-VAPS) in the Context of Paratransit Services

Figure 6 presents the GAN-VAPS designed in this paper. It comprises four stages. The first stage divides all paratransit service regions into multiple sub-regions with the improved Voronoi diagram based on historical data. A dispatch station is then assigned to each sub-region. The second stage establishes the simulation environment on Arena, which generates the number of possible service requests in each sub-region in a day based on historical data. This number and the established environment allow us to obtain the optimal number of vehicles for each dispatch station. With further iterations, we can obtain the optimal allocation of vehicles based on various conditions. In the third stage, we train the GAN with the data collected in the second stage. The generator of the GAN then creates a set of results for each dispatch station, and the discriminator verifies whether the generated results are similar to the optimal solution obtained by Arena. Finally, the fourth stage uses the trained generator in online processing to obtain optimal vehicle allocation for the current day.
We describe each of the three stages in detail. The fourth stage, which involves applying the trained generator, is similar to the third, so we do not detail it here. In these descriptions, we abbreviate the variables of “the total number of people requesting service in each sub-region” and “the number of vehicles deployed at each dispatch station” as “Req-Reg” and “Station-Car”, respectively. If there are m stations in the target service region, both variables will be a 1 × m vector.

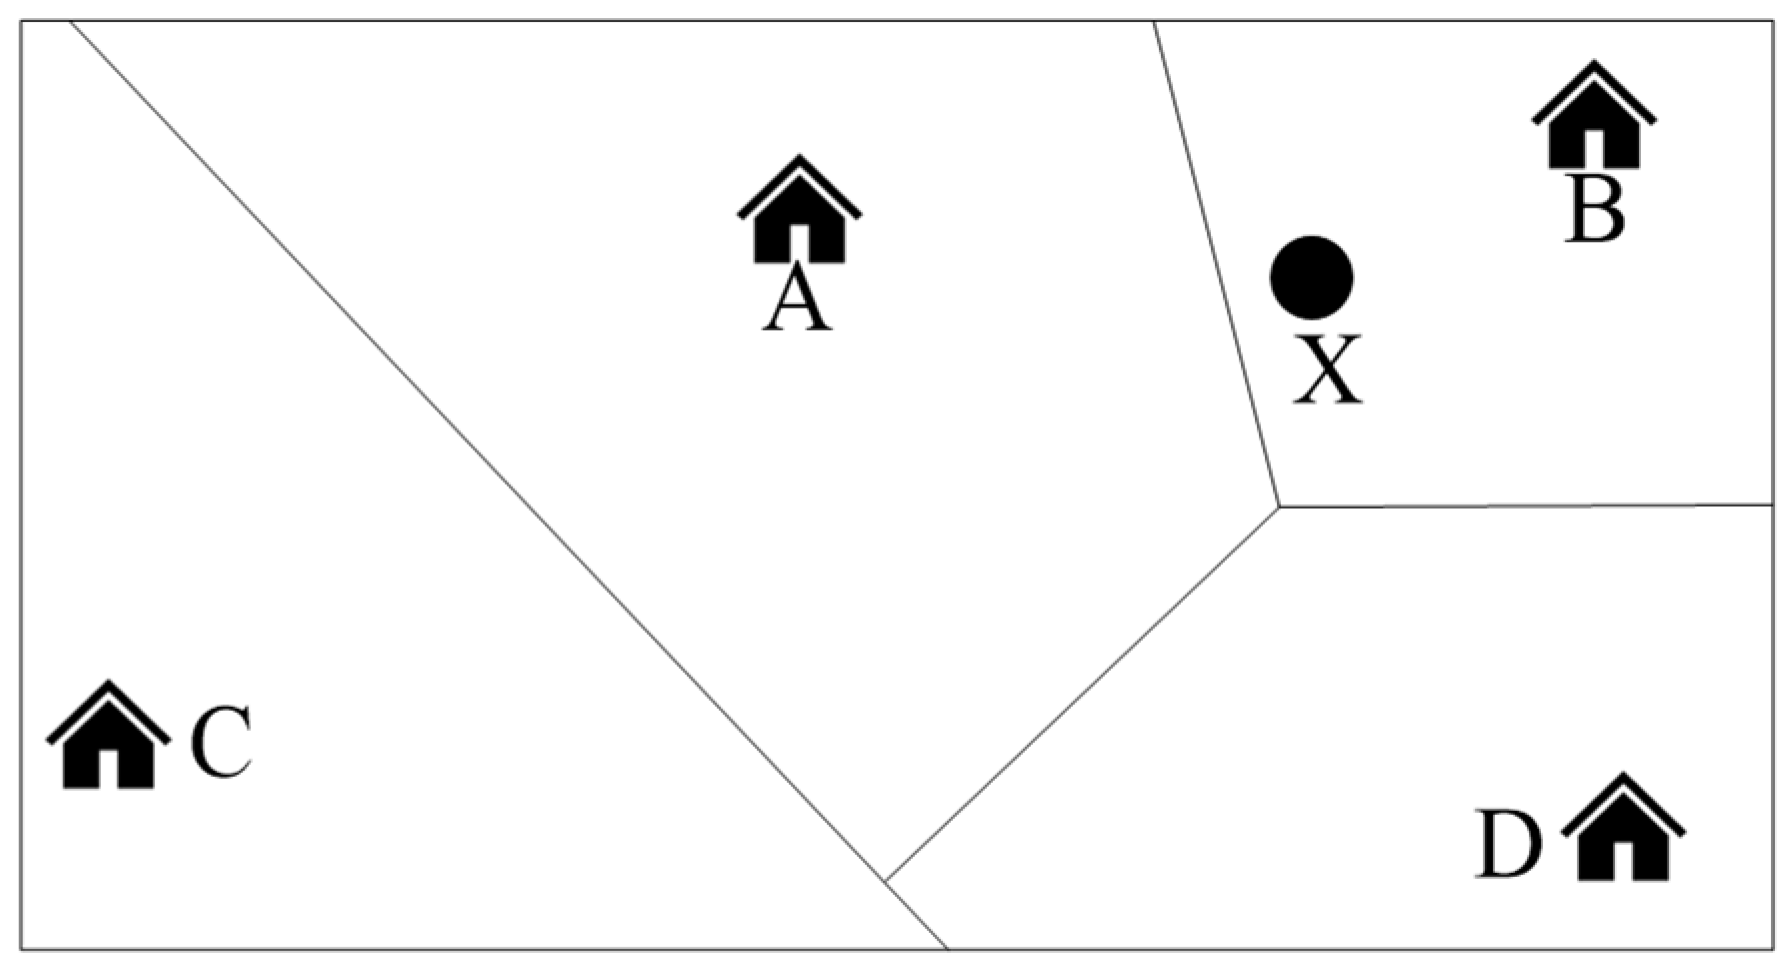
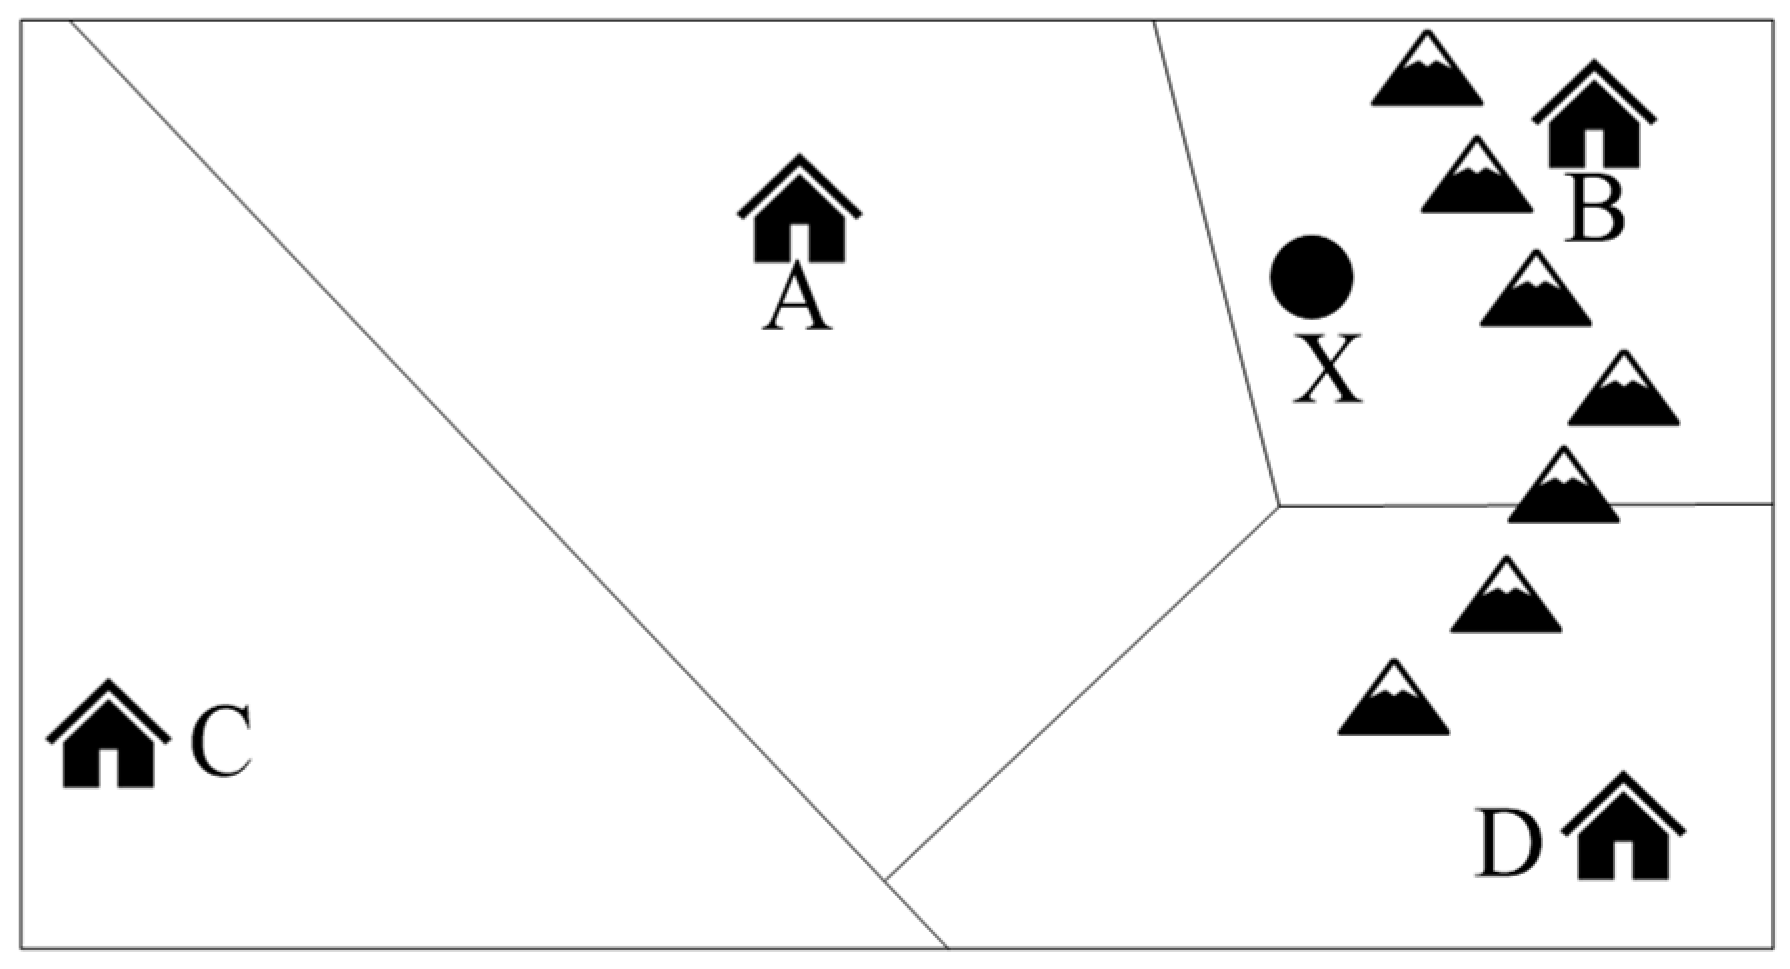
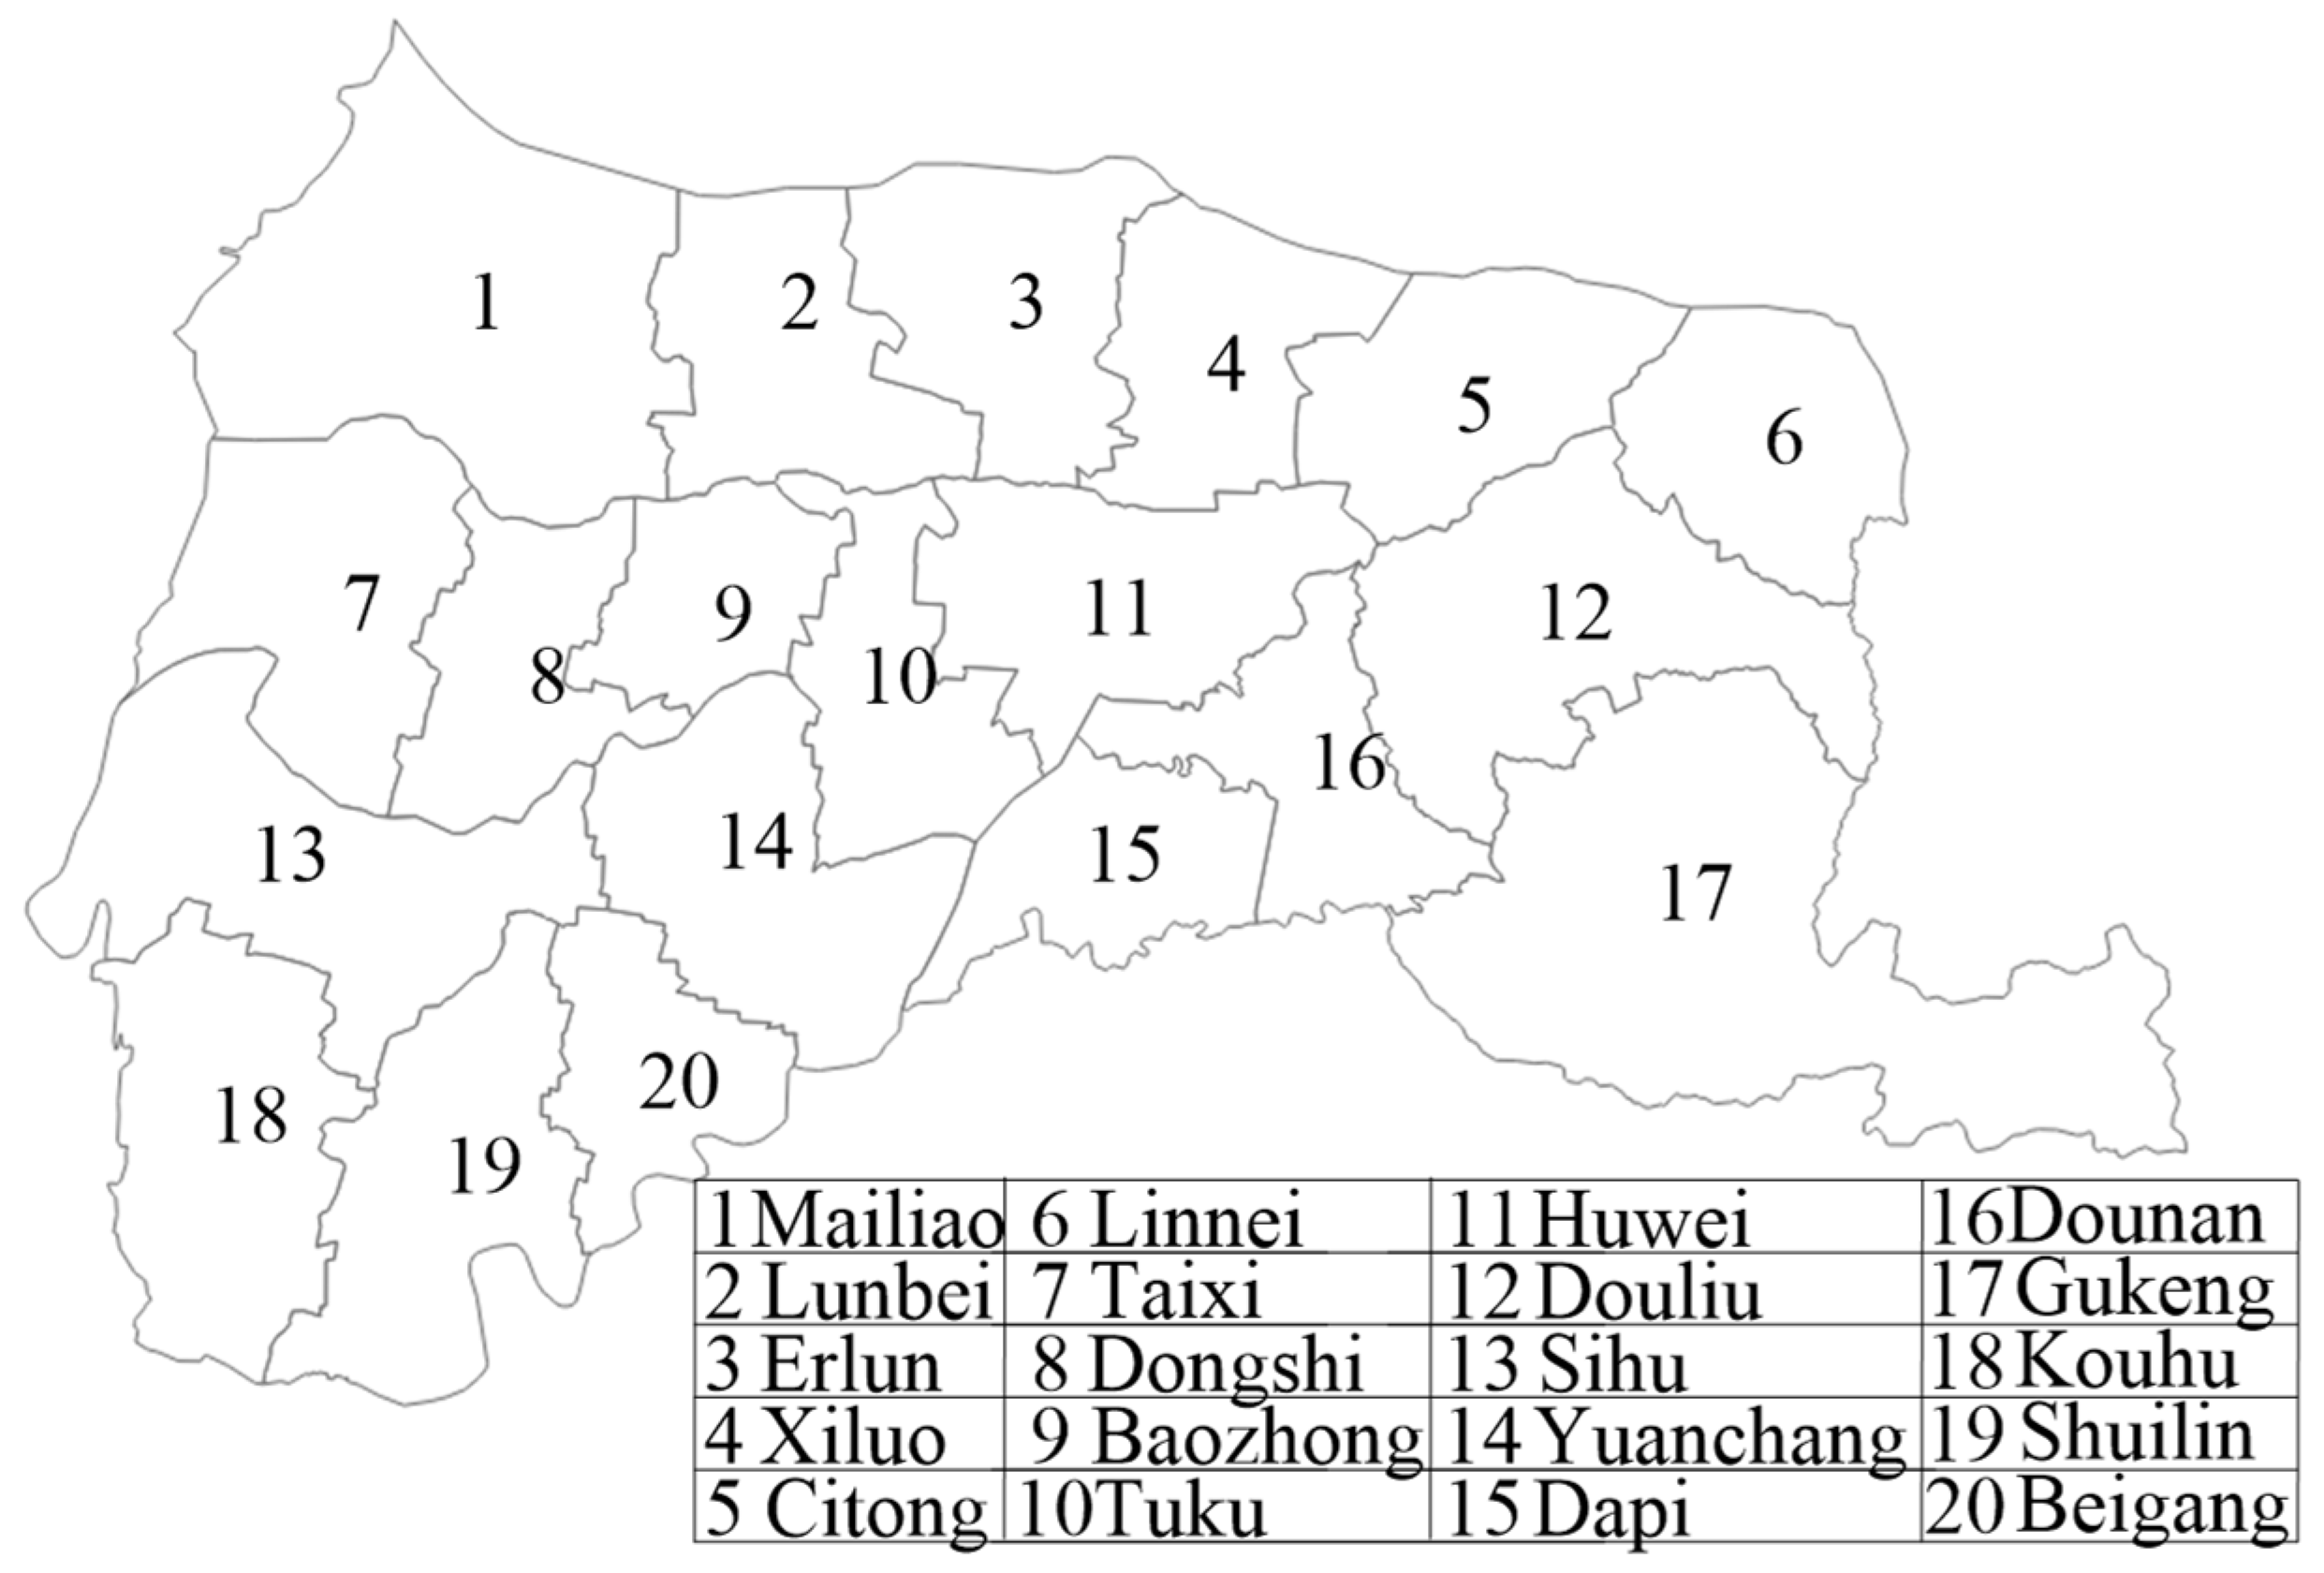
3.1. Division of Paratransit Service Region

The purpose of the first stage is to divide the service region into several sub-regions. From the perspective of efficiency, there are three important points to consider: (1) Each citizen should be served by a station close to his/her home. (2) Citizens with similar needs (i.e., similar service times or similar destinations) should be included in the same sub-region. (3) The division method depends on the data formats used by the service teams. The two most common data formats are address and latitude and longitude. Service teams using the address format mostly offer reservations by phone, while those using the coordinate format usually offer reservations by mobile app.
Based on these points, we designed the division algorithm as shown in Figure 7. It divides the basic service sub-regions using the Voronoi diagram, and then adjusts the service sub-regions according to the data format. We describe use of the diagram and the adjustments in detail below.
The Voronoi diagram is a widely used algorithm that is described fully in [29,30]. For our purposes, we first draw all of the dispatch stations on the map and then connect the stations in pairs. For each pair, we draw the perpendicular bisector. This creates the basic sub-region, as shown in Figure 8. In this figure, the perpendicular bisector between stations A and B divides the region into two parts, and the distance between any point in the region to which point A belongs and point A must be less than the distance between this point and point B, and vice versa. Citizens are then allocated to these sub-regions to ensure that each citizen is matched with the closest dispatch station as well as possible. This is a particular advantage of the Voronoi diagram. The results of other region division algorithms, such as k-means [64,65] or density-based spatial clustering of applications with noise (DBSCAN) [66,67], do not offer this.
However, the Voronoi diagram can only use straight lines to divide regions, which does not meet the needs of geographical space division. A simple case is shown in Figure 9. Even though dispatch station B is close to the home of citizen x in terms of straight-line distance, the route from station B to the citizen’s home is long and circuitous because of the mountains between them. Therefore, in terms of road distance, it is better to dispatch a vehicle from dispatch station A. In other words, the sub-regions generated by the Voronoi diagram must be adjusted further to meet requirements.
The adjustments to the obtained sub-regions must be made according to the selected data format. First, for the address format, administrative districts can be usefully applied to divide the region, which makes it convenient to count the total number of people requesting service in each sub-region every day. We adjust the division as follows: (1) We compare the overlapping ratio between each administrative region and the basic region created by the Voronoi diagram. (2) If the overlapping ratio between administrative region x and basic region y is greater than a certain threshold, we classify x into y, otherwise x will be classified into a sub-region in the next step. A special case would occur when a basic region fails to overlap with any administrative region. For this case, we can directly assign an administrative region based on the location of the dispatch stations. (3) If administrative region x overlaps with multiple basic regions, we check which overlapping basic region is the most similar based on the conditions of citizen requests (i.e., time and destination). As for the similarity score, we recommend using Pearson’s correlation coefficient [68,69] to obtain it. Finally, after the similarity scores of administrative region x and all overlapping basic regions have been calculated, we choose the basic region with the highest similarity score, with x as the sub-region for x.
The adjustment for the coordinate format is relatively intuitive. Coordinates allow paratransit employees to directly obtain the location of the citizen and dispatches, so historical dispatches serve as the approximate optimal solution. The division of the service region is adjusted as follows: We first identify the points where citizens requested service within σ km of the boundary line of two basic regions x and y, where σ is the threshold value defined by service team, and then sort through the dispatch decision records of these identified points. If more points belong to region x, the region that these identified points belong to will be divided into x, otherwise it will be divided into y. These steps are repeated until all points at the junction have been checked once.

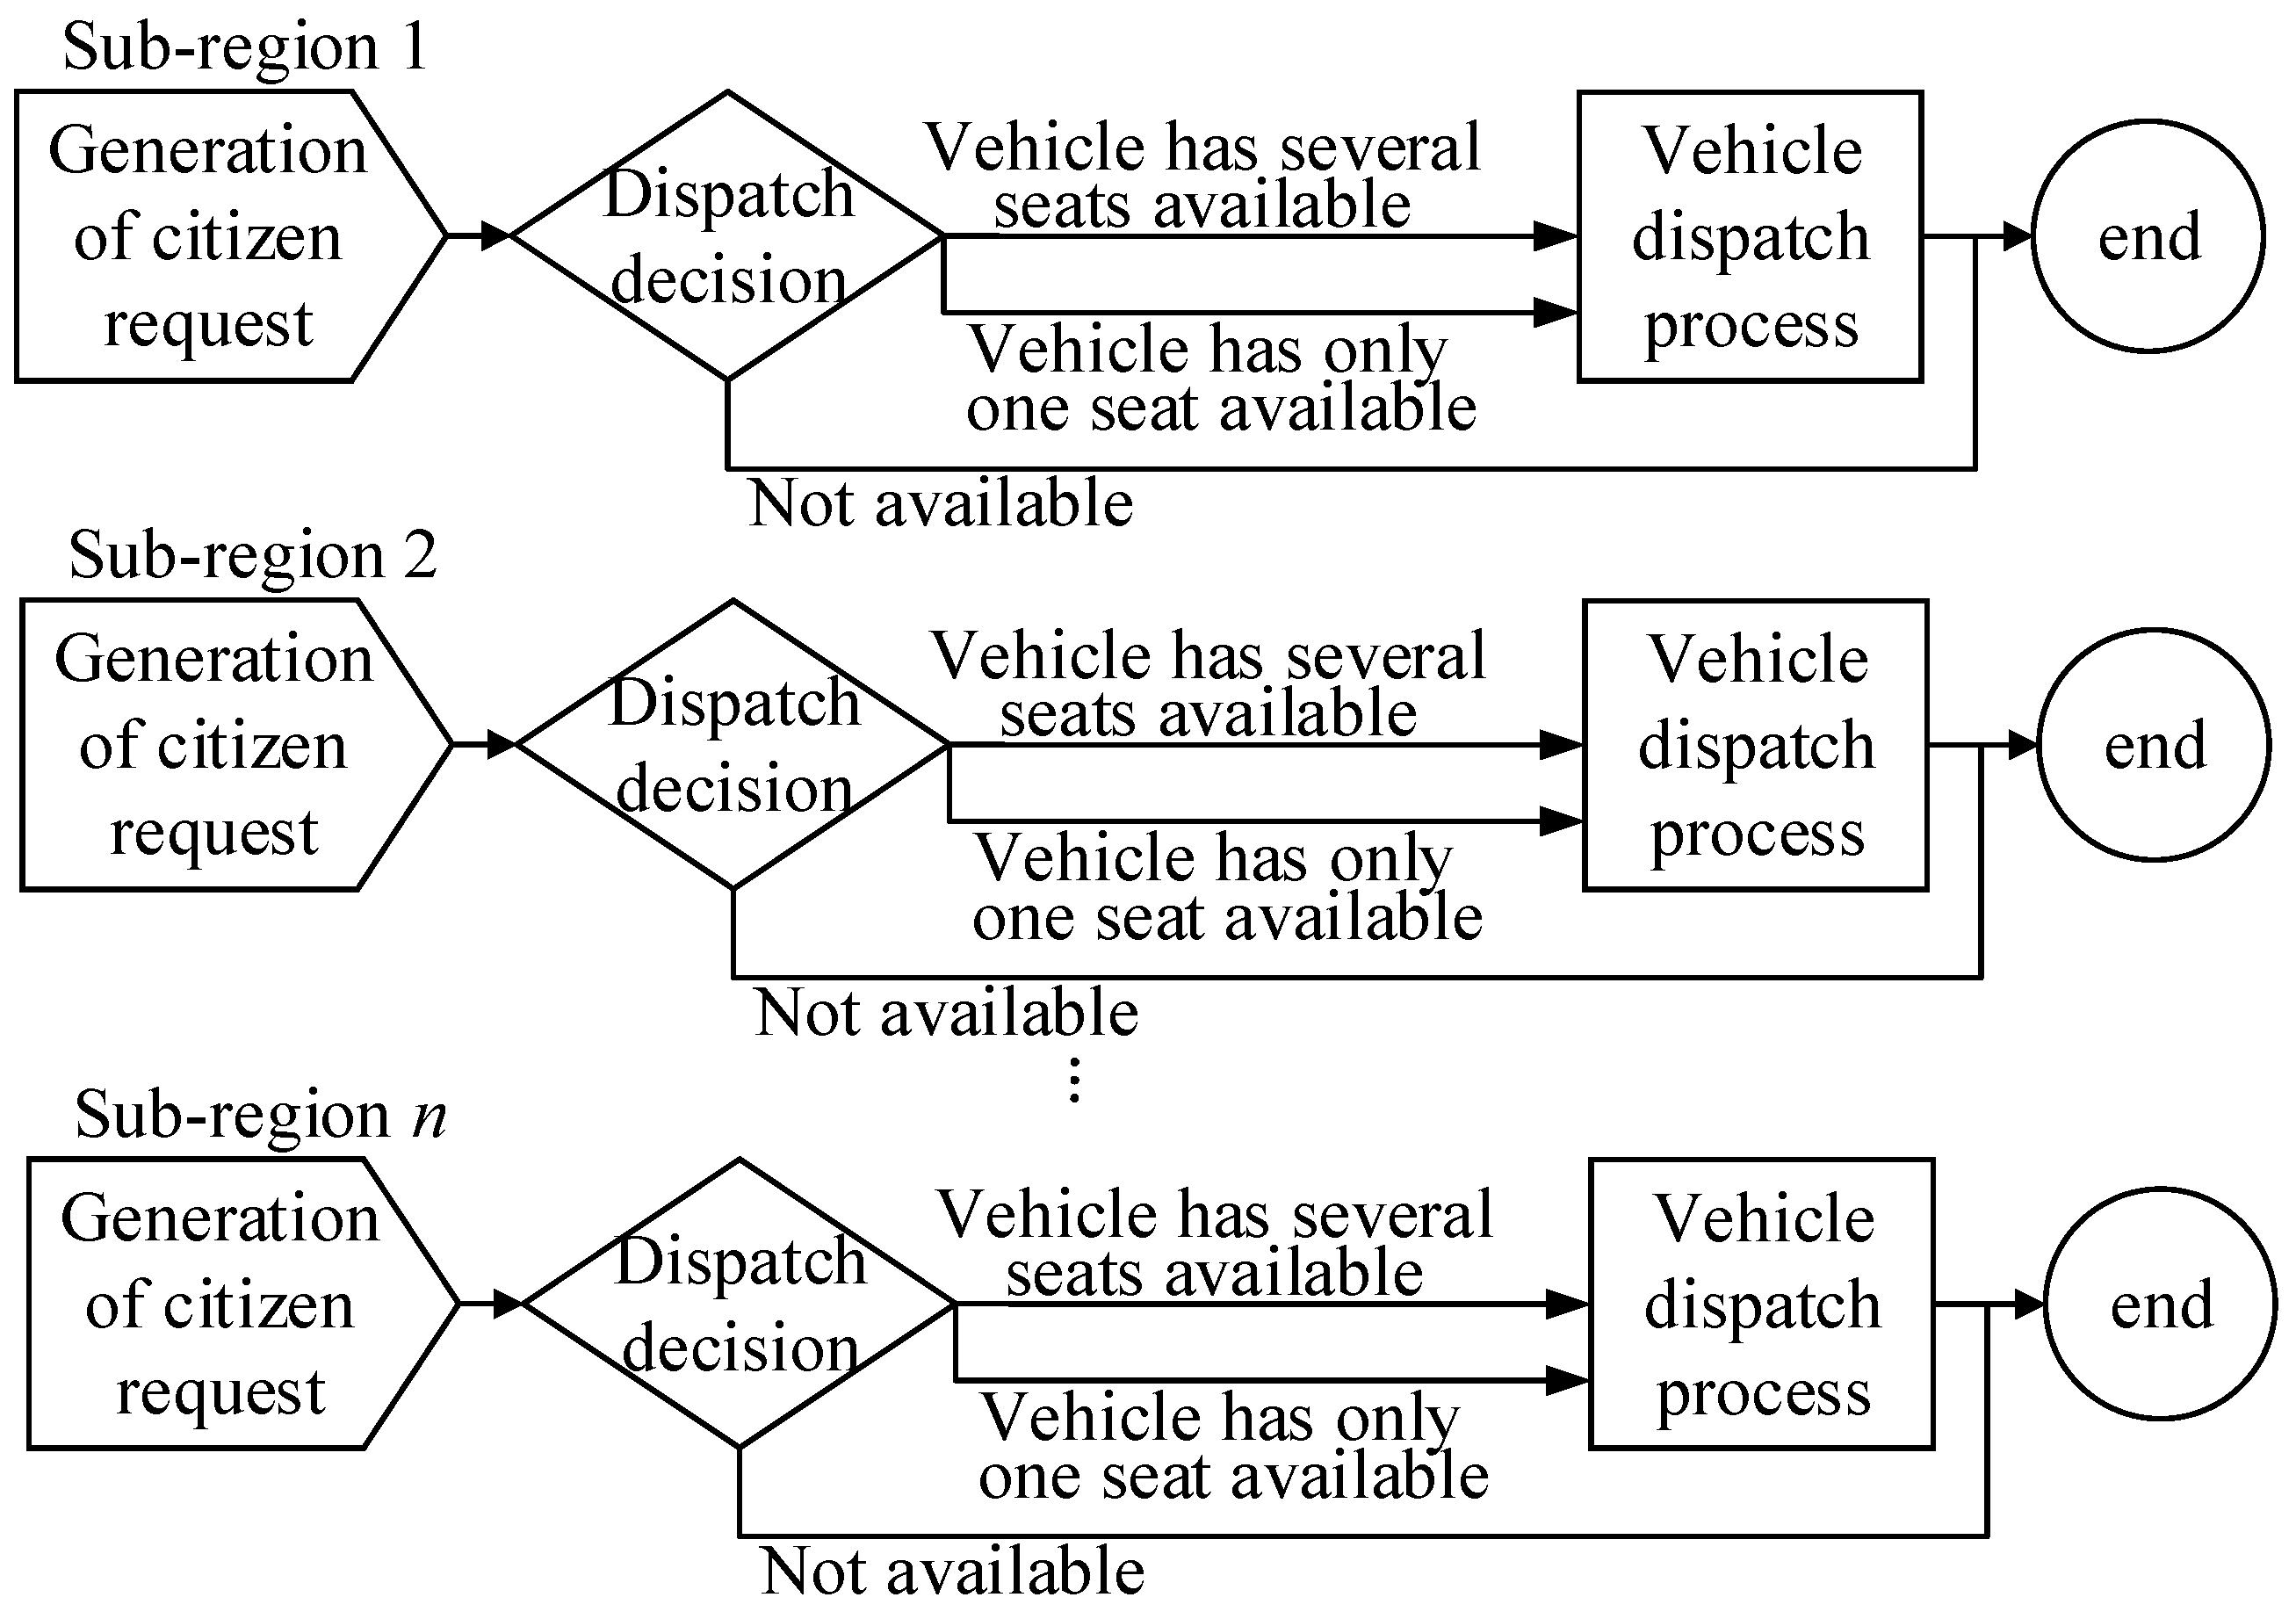
3.2. Training Data Set of GAN Established by Arena

Arena establishes the data set needed for the next stage of GAN training. This process comprises two parts. The first part uses historical service data to establish the simulation environment. The second part generates multiple sets of Req-Reg that conform to the historical distribution in this environment, and then finds the best Station-Car for each set of Req-Reg.
Figure 10 presents a schematic diagram of an environment we established in Arena. The figure contains multiple subprocesses. If we assume that the target service region has n dispatch stations in total, the simulation environment will contain n subprocesses. Each subprocess will simulate one of the following three actions: “generation of citizen request”, “vehicle dispatch decision”, or “vehicle dispatch process”. The first action is achieved through Arena’s “Create” component. We set a distribution function to generate the time interval between requests for service. For example, we can set the distribution function as Poisson distribution. In order to accurately simulate citizen requests, we recommend setting this function based on historical records. These can be analyzed using the Input Analyzer in the Arena kit to determine the historical distribution. We recommend setting the distribution function of each sub-region separately.
The second module, “vehicle dispatch decision”, is implemented using the “Decide” component of Arena, which checks whether there are vehicles available at the target dispatch station after receiving the request generated by the previous module. There will be three possible results. There could be a vehicle available at the target dispatch station. If this vehicle has more available seats, the module will ask the vehicle to wait for a while, and will not send the received request to the next module, “vehicle dispatch process”, until waiting for a minimum threshold. If the available vehicle has only one seat available for the current citizen request, the module will send the request for further processing by the “vehicle dispatch process”. If there is no vehicle available at the target dispatch station, the module will increase the number of people who cannot be served by 1 and politely decline the request (i.e., the request disappears from the simulation environment).
The “vehicle dispatch decision” module is implemented by the “Process” component of Arena, which simulates the process of vehicles moving from stations to citizens’ homes, carrying citizens from their homes to their designated destinations and home again, and returning to the stations. We can set an appropriate distribution function in this module to determine the vehicle task time. We recommend that service employees input the task times of their vehicles into the historical records for use by the Input Analyzer to obtain a realistic parameter. We recommend setting the distribution function of each sub-region separately.
The established environment is used to collect the data required for GAN training. This part is implemented through the OptQuest kit in Arena, which determines how many variables should be set to maximize or minimize the objective function. It also suggests controllable variables to be considered, the range of each controllable variable and its variation, and the objective function. For our aims, we implement the OptQuest kit as follows: (1) Generate a set of Req-Reg. In order to make Req-Reg close to the real situation, we recommend obtaining Req-Reg directly from the number of daily citizen requests in each sub-region from historical records or integrating multiple historical records using the synthesized minority oversampling technique [70,71]. (2) Set the Arena environment according to the Req-Reg determined in Step 1. (3) Set the controllable variables in OptQuest kit, that is, Station-Car, the number of vehicles to be allocated. This setting includes the upper and lower limits of the number of vehicles that can be allocated to each dispatch station and the number by which these vehicles can be increased or decreased for optimization. (4) Set the objective function in the OptQuest kit, that is, the total number of citizens who cannot be served; the smaller this number is, the better. (5) The OptQuest kit will output the optimized Station-Car result relative to Req-Reg to minimize the total number of citizens who cannot be served. A piece of GAN training data will be established after this step, in which Req-Reg is the input of the generator of GAN and Station-Car is the output of the discriminator of GAN. (6): Repeat Steps 1 to 5 several times until enough training data have been collected.

3.3. GAN Training

After the training data set is established, the GAN architecture can be applied. The operational concept of the proposed architecture is shown in Figure 11. It includes a generator and a discriminator. The input of the generator is Req-Reg, and its output is the estimated Station-Car. The discriminator checks the similarity between the estimated Station-Car and the optimized Station-Car identified by Arena and supplies the result to the generator as feedback, so that the generator can adjust its internal parameters. The process continues until the Station-Car estimated by generator closely resembles the optimized Station-Car.
The generator in the proposed GAN includes n + 2 layers, including an input layer, n fully connected layers, and an output layer. If we assume that the target service region has m stations in total, the input layer will have m neurons, and the kth neuron is the total number of citizens who are served by the kth station (i.e., the value of the kth number of Req-Reg). In addition, neurons in this layer are mainly used to transfer input data to the model. Then, the architecture of n fully connected layers is introduced, in which it is suggested that n is set by the service employee according to the complexity of the target service region; more layers are necessary for more complex regions. We recommend that the number of neurons in the last fully connected layer is 2^ ceil (log2m), of which ceil (•) is an unconditional carry function. The number of neurons in the kth layer from the end is 2^ (k − 1) ∗ 2^ ceil (log2m), which can reduce the number of neurons in the fully connected layer by 1/2 times starting from the layer closest to the input layer to match with most of the existing research settings [72,73]. At last, assuming that the target service region has m stations in total, the output layer will have m neurons, and the lth neuron of the output layer is used to integrate outputs from the last fully connected layer to obtain the optimized result of the number of vehicles to be allocated to the lth station.
The discriminator used in this research adopts a one-dimensional convolutional neural network, including one input layer, n convolutional layers, and one output layer. Assuming that the target service region has m stations in total, the input layer will have 2m neurons, of which m are used to receive the Station-Car vector (1 × m) estimated by the generator, and the other m are used to receive the optimal Station-Car identified by Arena for input Req-Reg of the generator. In addition, neurons in this layer are used to transfer input data to the model. The model contains n convolutional layers, and n can be determined by the service employee according to the complexity of the service environment. In addition, the number of vehicles allocated to each dispatch station is usually independent, so we recommend that service employees set the size of the convolved kernel of this layer to m, so that m stations can be considered. In order to avoid affecting the training results during the use of the traditional Relu function, we recommend that the convolutional layer of this model use LeakyRelU as the activation function. The final layer of the discriminator is a fully connected layer that outputs the similarity between Station-Car estimated by the generator and the optimal Station-Car identified by Arena after integrating the output of the last layer of the convolutional layer.
The proposed GAN is trained using back-propagation. The objective is to maximize the following:
1 N i = 1 N log D ( X i ) + 1 N i = 1 N log ( 1 D ( G ( R i ) ) ) ,
where G ( R i ) represents the Station-Car estimated by generator, D ( G ( R i ) ) represents the probability that discriminator recognizes the estimated Station-Car as the optimal Station-Car, D ( X i ) represents the probability that discriminator recognizes the optimal Station-Car as the optimal Station-Car, and is the number of data input to the discriminator.

4. Simulations

4.1. Introduction to Data Sets and Experimental Parameters

To verify the proposed approach, we performed a case study using a data set provided by a hospital in Yunlin County. Yunlin is the most rapidly aging area in Taiwan, with nearly 20% of the population (nearly 140,000 people) over 65 years of age. Paratransit services are, therefore, in high demand in this area. The area is served by 76 vehicles carrying an average of 100 people each day. The data for this case study were collected from 17 June 2019 to 9 April 2020. This represents a total of 204 working days, comprising 18,857 appointments at the participating hospital in Yunlin County. The data set included citizens’ homes in the form of residential addresses, all of which are under the jurisdiction of the 20 sub-administrative regions of Yunlin County (see Figure 12 for a map of the administrative regions). The service team allocated the vehicles to 11 dispatch stations in Yunlin County.
The generator and discriminator architectures used in this experiment are shown in Table 2 and Table 3. The number of neurons in the generator’s input layer and output layer is the same as the number of dispatch stations (i.e., 11). However, the number of neurons in the discriminator’s input layer is twice that of the number of dispatch stations (i.e., 22), while the output layer only has 1 neuron, which measures similarity. The number of hidden layers in the generator and discriminator was set to 4 based on trial and error. This was identified as optimal for Station-Car estimation capability, while the activation functions for the generator and discriminator were Tanh and LeakyRelU, respectively. The number of data generated by Arena is 5100, among which 70% is used for training and 30% is used for testing. The GAN is implemented by Python using an Intel Core i7-9700KF 3.6 GHz CPU with 16 GB of memory, Intel® Pentium® 3825U 1.90 GHz CPU, and the operating system Windows 10.

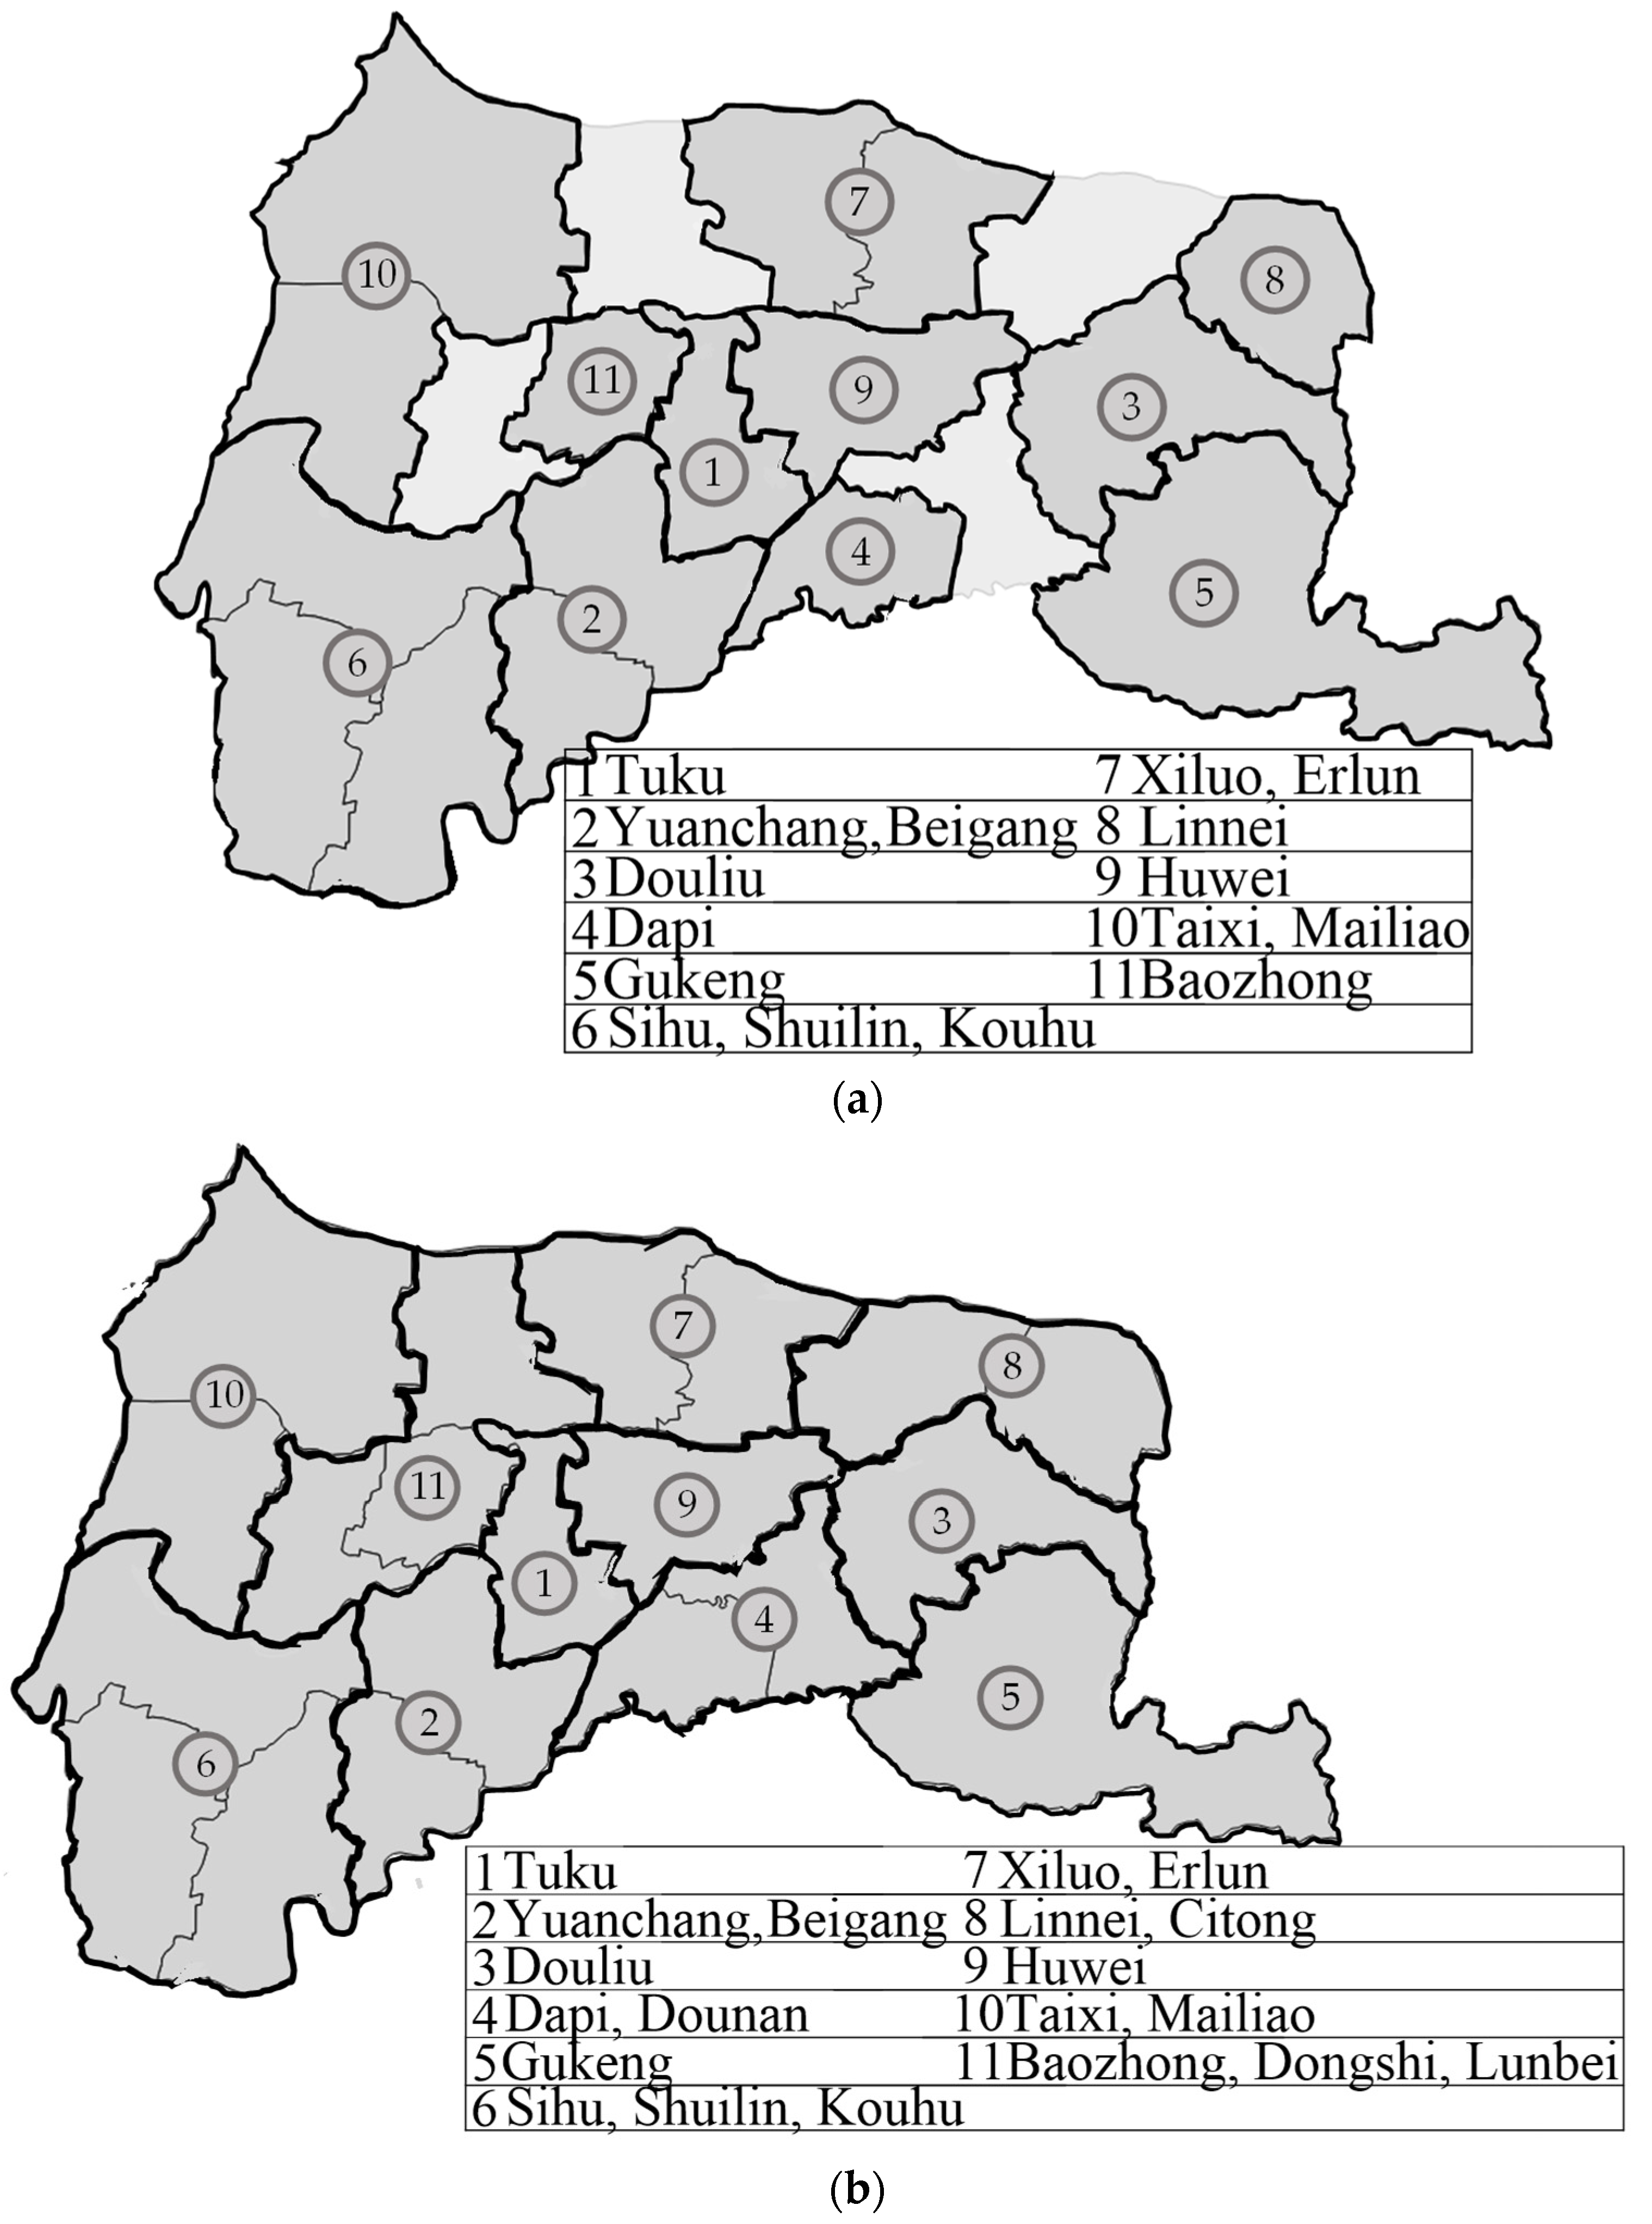
4.2. Division of Service Region

Figure 13a shows the basic division of Yunlin County’s 20 administrative regions, in which the 11 stations are located in the regions of Tuku, Beigang, Douliu, Dapi, Gukeng, Sihu, Xiluo, Linnei, Huwei, Taixi, and Baozhong, so these will be the central administrative regions of their sub-regions. The remaining nine administrative regions include Yuanchang, Shuilin, Kouhu, Erlun, and Mailiao. As described in Section 3.1, we can use the proposed algorithms to identify appropriate sub-regions. However, for the last four administrative regions (Dounan, Citong, Dongshi, and Lunbei), it is difficult to determine which sub-region they are subordinate to, so we need to calculate the similarity between citizen requests in these regions and those in the central administrative regions of other sub-regions. Similarity results are shown in Table 4. It is simple to directly select the central administrative region closest to Dounan, Citong, and Lunbei. However, the results for Dongshi are identical to Sihu and Baozhong, which makes it difficult to determine which sub-region it is subordinate to. However, the number of citizen requests from the sub-regions of Sihu (i.e., Sihu, Shuilin, Kouhu) is 1548, which is far more than that in the sub-regions of Baozhong (i.e., Lunbei and Baozhong) at 1133. Therefore, we put Dongshi into the sub-region of Baozhongzi. See Figure 13b for the final division of Yunlin County’s 20 administrative regions.

4.3. Arena Environment Configuration and Optimized Solution Results

The following four parts of the Arena environment need to be configured: (1) inputting the distribution function of time intervals between citizen requests in each sub-region in the module “citizen request generation”, (2) inputting the distribution function of vehicle task time in the module “vehicle dispatch process”, (3) setting the upper and lower limits of the number of vehicles allocated to each dispatch station when using the specific Req-Reg and OptQuest kit to solve the optimal solution of the Station-Car, and (4) Arena solution results.
To set the distribution function of time intervals between citizen requests, the historical records of all requests (both fulfilled and unfulfilled) of the 11 sub-regions were input to Arena’s Input Analyzer. The result for each sub-region is shown in Table 5. There are three main functions in this table: BETA(•), LOGN(•), and EXPO(•). BETA(•) represents Beta distribution, which is suited to finite intervals when the amount of data is small. LOGN(•) represents the logarithmic normal distribution, that is, the logarithmic normal distribution of random variables. When the distribution of data is close to normal, but there is a large amount of it, the logarithmic normal distribution has an obvious upward trend. EXPO(•) represents exponential distribution, which is a continuous probability distribution usually used to indicate the time interval between independent random events. Among the 11 variables in this table, we can see that the proportion of the exponential distribution is small and only one sub-region is involved. This is because all of the citizens in this data set visit the same medical center, and their appointments are usually scheduled for early morning or early afternoon, so the distribution is relatively concentrated. The logarithmic normal distribution and beta distribution of the remaining sub-regions account for roughly half. Influenced by the amount of data, sub-regions 1, 7, 10, and 11 with beta distribution have a small number of requests, only around 1100. The other sub-regions (i.e., 2, 3, 4, 6, 8, and 9) have more than 1500 requests (up to 5000 in some), so they exhibit logarithmic normal distribution.
To set the distribution function of vehicle task time, we consider our data set, which includes the total travel time with passengers (time taken to travel from citizens’ homes to their destinations and time taken to return from destinations to citizens’ homes), but no other data (e.g., time taken to travel from the dispatch station to citizens’ homes, time spent waiting for citizens to complete their appointments, and time taken to return to the dispatch station from citizens’ homes). In this case, if we input the historical records directly into Arena’s Input Analyzer, the result is likely to be inaccurate. Therefore, triangular distribution is applied. We selected this method because the traffic time is influenced by road distance. In addition, various conditions on the road, such as the number of red lights, will have a small effect as well. The distribution functions we obtained for 11 sub-regions are shown in Table 6, in which the minimum, mean, and maximum of triangular distribution are presented with minutes as the unit of measurement.
The upper and lower limits of the number of vehicles allocated to each station is determined using the OptQuest kit. In order to make the vehicle allocation conform to historical records, we directly count the daily maximum and minimum dispatches in the 11 sub-regions. These serve as the upper and lower limits. These are presented in Table 7.
The optimal solution of Station-Car is solved by Arena. The results are shown in Figure 14, which compares the distribution of citizens who are not served over 204 working days from the historical records with Arena’s simulation results. Note that the simulation results consider the limitation of random factors, so the number of citizen requests counted by Arena do not exactly match the historical record. The range of difference is ±20%. Therefore, we performed Arena simulation 10 times, and averaged the results. We can see from Figure 14 that the number of citizens who are not served in the historical records is significantly more than in the averaged simulations. The number of citizens who are not served in historical records is between 4 and 45 per day, while in the simulation, that range drops to between 0 and 8. This proves that Arena’s optimized results are better than historical records. This makes them suitable for training the GAN.

4.4. Station-Car Results Inferred by GAN

The next step is to determine whether Station-Car inferred by GAN is close to the optimal solution for Station-Car found by Arena. However, since we cannot directly estimate the daily number of unfulfilled citizen requests from the results of GAN’s Station-Car calculations, we must input the Station-Car derived from GAN back to Arena, set the daily Req-Reg parameters separately in the Arena environment, and use Arena to figure out how many citizens would be left unserved by GAN’s Station-Car. This process is cumbersome and time-consuming, which makes it difficult to test all 204 days in the original data set. Therefore, we use a case study to discuss whether GAN’s projected Station-Car results are close to the optimal solution found by Arena. Eight Req-Reg cases are used in this section and the Req-Reg values for each case are shown in Table 8. The first four cases in the table are historical cases, which are used to verify that GAN’s extrapolation applies to the target data set. The latter four cases in Table 8 are hypothetical. They represent the following: (1) the historical minimum is used as the number of requests for all sub-regions, (2) the historical maximum is used as the number of requests for all sub-regions, (3) the historical value of one date in the data set is used as the number of requests for all sub-regions except sub-region 7 (for which the number of requests is extremely high), and (4) the historical maximum is used as the number of requests for all sub-regions except sub-region 7. Sub-region 7 features an urban renewal project [74], which is expected to draw in a large number of new residents. This experiment thus also tests if the GAN model can estimate the optimal solution of Station-Car without re-training if there is a significant population influx. With these special cases, we can determine whether the GAN trained using only Req-Reg historical data can still be applied to extreme cases.
Table 9 and Figure 15 compare estimations of unfulfilled requests for the first four Req-Reg cases using Arena and GAN. Since Arena tends to produce multiple optimal solutions, it would be unfair to compare the results of the GAN with only one of these many solutions. We thus present Arena’s Station-Car solution as a range. This range is Arena’s minimum number out of 25 solution sets. Such ranges are rendered with upper and lower bounds in Table 9 and with gray areas in Figure 15. In Table 9, it is clear that the GAN is capable of finding the same number of unfulfilled requests as Arena. This confirms that in the target data set, we can use GAN directly to determine the optimal number of vehicles per dispatch station. Finally, in Figure 15, we can see that most of the Station-Car solutions found by GAN fall within the range produced by Arena. This makes sense, since the GAN was trained with the best Arena solutions. Surprisingly, there were a few instances for each case where the number of vehicles identified by GAN did not fall within the range produced by Arena. Even so, the Station-Car found by GAN minimizes the number of unfulfilled citizen requests, which can be explained by the fact that GAN can find feasible solutions based on the best solutions of Arena, which allows GAN to find the best solution to Station-Car for all cases.
Table 10 and Figure 16 compare the last four Req-Reg cases using Arena and GAN to estimate the number of unfulfilled requests in Station-Car. Note that since Arena produces multiple best solutions, it would be unfair to compare the results of the GAN with only one of the solutions. Therefore, we apply the same method as in Table 10 and Figure 16. In Table 10, we can see that in case 5 and case 7, the estimated Station-Cars generated by GAN’s generator was as low as Arena’s optimal Station-Car. This confirms that the proposed approach is applicable when Req-Reg is low or when there is a surge in the number of requests for services for only one sub-region. Next, in Table 10 we can also see that in case 6 and case 8, the number of citizens not served by the GAN solution was far more than that of Arena. This does not necessarily indicate an issue with the GAN itself. The GAN in this experiment was trained only with historical data and similar historical data, and these training data did not include case 6 and case 8. Therefore, it was not possible for the GAN to find the best solution under these conditions. However, if the GAN was trained with more extreme cases, it is likely that it would successfully identify the optimal solutions. In Figure 16, GAN’s Station-Car values do not fall into the Arena range more than in the previous four cases, but GAN’s values vary with the trend of Arena’s range for almost every dispatch station. As shown in Figure 16c,d, the GAN recommends dispatching a large number of vehicles to sub-region 7 to fulfill the surge in service demand. This could be seen as an attempt by GAN to adapt its existing parameters to various Req-Reg cases, which would make the GAN more practically applicable.
In conclusion, we find that the results of the GAN are similar to those of Arena when the Req-Reg is similar to historical data and the Req-Reg has only one abnormal station. However, when all Req-Reg stations face extreme demands, the GAN may not be able to find a reasonable Station-Car, because this situation does not exist in the training data. Therefore, if it becomes necessary to apply this approach to extreme cases, it would be of benefit to include extreme values in the training data set.

5. Conclusions and Directions for Future Research

The paratransit service concept has continued to grow, with many governments setting up paratransit teams to serve the aging populations within their jurisdiction. The key to maintaining an efficient service is optimal allocation of vehicles at the dispatch stations. Previous studies have applied heuristic algorithms to this type of problem, which represents a version of the classic Dial-a-Ride problem. These approaches first identify the various environments faced by the target paratransit service, then define the objective function and apply a heuristic algorithm to find the best solution. However, these approaches are not feasible in practice. There are too many conditions to input, which significantly increases the workload of the paratransit team, and the online computational time is too long (several hours), as service teams must allocate vehicles for each station an hour or two before dispatching the vehicles. Therefore, this paper proposes using a GAN to determine optimal vehicle allocation. The GAN’s discriminator can remember the complex conditions associated with paratransit service environment conditions, so that the service team does not need to manually input the conditions each day. In addition, GAN is fast, taking only 1 to 10 s, thus allowing the paratransit service to determine optimal allocation on the morning of the deployment. This study represents the first attempt to use GAN to address the target problem. There are two major difficulties inherent to the GAN approach: determining the input of the GAN generator and finding a large number of optimal solutions to assist in the training of the GAN. We propose using the improved Voronoi diagram and Arena simulation to achieve the above goals. The efficacy of the proposed approach was verified using historical data from the paratransit service of Yunlin County.
Regarding future research, since this paper is the first to apply GAN to Dial-a-Ride problems, the topics discussed in this paper are relatively simple and narrow. Since our results verify the feasibility of this approach, directions for future research include the following: (1) When defining the topic, we only considered the optimization of ride-dialing conditions and vehicle configuration, but there are many more factors relevant to Dial-a-Ride problems, such as time window, depot(s), vehicle capacity, ride time, and duration route. We thus plan to expand the proposed method to encompass more conditions and objects. (2) Regarding topic categories, only static topics are considered in this study, but dynamic topics, such as queue cutting or cancellation of reservations, are widely discussed in the literature. We plan to explore whether the proposed GAN-VAPS can be extended to solve these dynamic issues. (3) Many heuristic methods incorporate techniques such as the branch-and-cut algorithm, the branch-and-price algorithm, and lessons learned, to speed up or optimize the searching process. In this paper, GAN-VAPS solves the problem using the most intuitive approach. Incorporating additional techniques may serve to further accelerate and optimize the performance of the proposed approach.

Author Contributions

Conceptualization, Y.-C.C.; methodology, Y.-C.C.; software, Z.-J.C.; validation, F.-C.W. and C.-H.L.; investigation, Z.-J.C.; data curation, Z.-J.C.; writing—original draft preparation, Z.-J.C., F.-C.W. and C.-H.L.; writing—review and editing, Y.-C.C.; visualization, Z.-J.C.; supervision, Y.-C.C.; project administration, Y.-C.C.; funding acquisition, S.-H.F., C.-Y.W. and Y.-C.C. All authors have read and agreed to the published version of the manuscript.

Funding

This study was supported by the Research Assistantships funded by the Ministry of Science and Technology, Taiwan (grant number MOST 108-2314-B-002-100-MY3, to S.-H.F.; MOST 110-2121-M-224-001, MOST 107-2119-M-224-003-MY3 to Y.-C.C.) and National Taiwan University Hospital Yun-Lin Branch (grant numbers NTUHYL 109.C030, NTUHYL 109.X009, and NTUHYL 109.F005 to S.-H.F.).

Data Availability Statement

The research data set of the experiment is PS service data provided by the Yunlin County government. Those data are not publicly available.

Conflicts of Interest

The authors declare no conflict of interest.

References

  1. Fu, L.-P.; Ishkhanov, G. Fleet Size and Mix Optimization for Paratransit Services. Transp. Res. Rec. J. Transp. Res. Board 2004, 1884, 39–46. [Google Scholar] [CrossRef] [Green Version]
  2. Gupta, D.; Chen, H.-W.; Miller, L.; Surya, F. Improving the efficiency of demand-responsive paratransit services. Transp. Res. Part A Policy Pract. 2010, 44, 201–217. [Google Scholar] [CrossRef]
  3. Cordeau, J.-F.; Laporte, G. The Dial-a-Ride problem (DARP): Variants, modeling issues and algorithms. Q. J. Oper. Res. 2003, 1, 89–101. [Google Scholar] [CrossRef]
  4. Psaraftis, H.N. A dynamic programming approach to the single-vehicle, many-to-many immediate request Dial-a-Ride problem. Transp. Sci. 1980, 14, 130–154. [Google Scholar] [CrossRef]
  5. Psaraftis, H.N. An exact algorithm for the single-vehicle many-to-many Dial-a-Ride problem with time windows. Transp. Sci. 1983, 17, 351–357. [Google Scholar] [CrossRef]
  6. Jaw, J.-J.; Odoni, A.R.; Psaraftis, H.N.; Wilson, N.H.M. A heuristic algorithm for the multi-vehicle advance-request Dial-a-Ride problem with time windows. Transp. Res. Part B Methodol. 1986, 20, 243–257. [Google Scholar] [CrossRef]
  7. Bodin, L.D.; Sexton, T. The multi-vehicle subscriber Dial-a-Ride problem. TIMS Stud. Manag. Sci. 1986, 2, 73–86. [Google Scholar]
  8. Desrosiers, J.; Dumas, Y.; Soumis, F. A dynamic programming solution of the large-scale single vehicle Dial-a-Ride problem with time windows. Am. J. Math. Manag. Sci. 1986, 6, 301–325. [Google Scholar] [CrossRef]
  9. Cordeau, J.-F.; Laporte, G. A tabu search heuristic for the static multi-vehicle Dial-a-Ride problem. Transp. Res. B 2003, 37, 579–594. [Google Scholar] [CrossRef] [Green Version]
  10. Samuel, W.L. Autonomous Dial-a-Ride Transit Benefit-Cost Evaluation; Volpe National Transportation System Center: Cambridge, MA, USA, 1998. [Google Scholar]
  11. Teodorovic, D.; Radivojevic, G. A fuzzy logic approach to dynamic Dial-a-Ride problem. Fuzzy Sets Syst. 2000, 116, 23–33. [Google Scholar] [CrossRef]
  12. Madsen, O.B.G.; Ravn, H.F.; Rygaard, J.M. A heuristic algorithm for the a Dial-a-Ride problem with time windows, multiple capacities, and multiple objectives. Ann. Oper. Res. 1995, 60, 193–208. [Google Scholar] [CrossRef]
  13. Toth, P.; Vigo, D. Fast local search algorithms for the handicapped persons transportation problem. In Meta-Heuristics: Theory and Applications; Osman, I.H., Kelly, J.P., Eds.; Kluwer: Boston, MA, USA, 1996; pp. 677–690. [Google Scholar]
  14. Toth, P.; Vigo, D. Heuristic algorithms for the handicapped persons transportation problem. Transp. Sci. 1997, 31, 60–71. [Google Scholar] [CrossRef]
  15. Borndörfer, R.; Klostermeier, F.; Grötschel, M.; Küttner, C. Telebus Berlin: Vehicle scheduling in a Dial-a-Ride system. In Computer-Aided Transit Scheduling. Lecture Notes in Economics and Mathematical Systems; Wilson, N.H.M., Ed.; Springer: Berlin/Heidelberg, Germany, 1999; Volume 471, pp. 391–422. [Google Scholar]
  16. Jih, W.R.; Kao, C.Y.; Hsu, F.Y.J. Using Family Competition Genetic Algorithm in Pickup and Delivery Problem with Time Window Constraints. In Proceedings of the IEEE International Symposium on Intelligent Control, Vancouver, BC, Canada, 27–30 October 2002; pp. 496–501. [Google Scholar]
  17. Jorgensen, R.M.; Larsen, J.; Bergvinsdottir, K.B. Solving the Dial-a-Ride problem using genetic algorithms. J. Oper. Res. Soc. 2007, 58, 1321–1331. [Google Scholar] [CrossRef]
  18. Parragh, S.N.; Doerner, K.F.; Hartl, R.F. Variable neighborhood search for the dial-a-ride problem. Comput. Oper. Res. 2010, 37, 1129–1138. [Google Scholar] [CrossRef]
  19. Parragh, S.N.; Schmid, V. Hybrid column generation and large neighborhood search for the dial-a-ride problem. Comput. Oper. Res. 2013, 40, 490–497. [Google Scholar] [CrossRef] [Green Version]
  20. Masson, R.; Lehuédé, F.; Péton, O. The dial-a-ride problem with transfers. Comput. Oper. Res. 2014, 41, 12–23. [Google Scholar] [CrossRef] [Green Version]
  21. Ritzinger, U.; Puchinger, J.; Hartl, R.F. Dynamic programming based metaheuristics for the dial-a-ride problem. Ann. Oper. Res. 2016, 236, 341–358. [Google Scholar] [CrossRef] [Green Version]
  22. Molenbruch, Y.; Braekers, K.; Caris, A. Benefits of horizontal cooperation in dial-a-ride services. Transp. Res. Part E Logist. Transp. Rev. 2017, 107, 97–119. [Google Scholar] [CrossRef]
  23. Chassaing, M.; Duhamel, C.; Lacomme, P. An ELS-based approach with dynamic probabilities management in local search for the dial-a-ride problem. Eng. Appl. Artif. Intell. 2016, 48, 119–133. [Google Scholar] [CrossRef]
  24. Masmoudi, M.A.; Braekers, K.; Masmoudi, M.; Dammak, A. A hybrid genetic algorithm for the heterogeneous dial-a-ride problem. Comput. Oper. Res. 2017, 81, 1–13. [Google Scholar] [CrossRef]
  25. Gschwind, T.; Drexl, M. Adaptive Large Neighborhood Search with a Constant-Time Feasibility Test for the Dial-a-Ride Problem. Transp. Sci. 2019, 53, 480–491. [Google Scholar] [CrossRef] [Green Version]
  26. Goodfellow, I.; Pouget-Abadie, J.; Mirza, M.; Xu, B.; Warde-Farley, D.; Ozair, S.; Aaron, C.; Bengio, Y. Generative adversarial nets. In Proceedings of the 27th International Conference on Neural Information Processing Systems, Montreal, QC, Canada, 8–13 December 2014; Ghahramani, Z., Welling, M., Cortes, C., Lawrence, N.D., Weinberger, K.Q., Eds.; MIT Press: Cambridge, MA, USA, 2014; pp. 2672–2680. [Google Scholar]
  27. Karras, T.; Aila, T.; Laine, S.; Lehtinen, J. Progressive Growing of GANs for Improved Quality, Stability, and Variation. In Proceedings of the 6th International Conference on Learning Representations, Vancouver, BC, Canada, 30 April–5 May 2018. [Google Scholar]
  28. Zhang, F.; Ma, Y.; Yuan, G.; Zhang, H.; Ren, J. Multiview image generation for vehicle reidentification. Appl. Intell. 2021, 51, 5665–5682. [Google Scholar] [CrossRef]
  29. Aggarwal, A.; Guibas, L.J.; Saxe, J.; Shor, P. A linear-time algorithm for computing the Voronoi diagram of a convex polygon. Discret. Comput. Geom. 1989, 4, 591–604. [Google Scholar] [CrossRef]
  30. Alitappeh, R.J.; Jeddisaravi, K. Multi-robot exploration in task allocation problem. Appl. Intell. 2022, 52, 2189–2211. [Google Scholar] [CrossRef]
  31. Toth, P.; Vigo, D. The Vehicle Routing Problem; Society for Industrial and Applied Mathematics: Philadelphia, PA, USA, 2002. [Google Scholar]
  32. Masmoudi, M.A.; Hosny, M.; Braekers, K.; Dammak, A. Three effective metaheuristics to solve the multi-depot multi-trip heterogeneous Dial-a-Ride problem. Transp. Res. Part E Logist. Transp. Rev. 2016, 96, 60–80. [Google Scholar] [CrossRef]
  33. Detti, P.; Papalini, F.; de Lara, G.Z.M. A multi-depot Dial-a-Ride problem with heterogeneous vehicles and compatibility constraints in healthcare. Omega 2017, 70, 1–14. [Google Scholar] [CrossRef]
  34. Tellez, O.; Vercraene, S.; Lehuédé, F.; Péton, O.; Monteiro, T. The fleet size and mix Dial-a-Ride problem with reconfigurable vehicle capacity. Transp. Res. Part C Emerg. Technol. 2018, 91, 99–123. [Google Scholar] [CrossRef]
  35. Paquay, C.; Crama, Y.; Pironet, T. Recovery management for a Dial-a-Ride system with real-time disruptions. Eur. J. Oper. Res. 2020, 280, 953–969. [Google Scholar] [CrossRef] [Green Version]
  36. Marković, N.; Kim, M.E.; Schonfeld, P. Statistical and machine learning approach for planning Dial-a-Ride systems. Transp. Res. Part A Policy Pract. 2016, 89, 41–55. [Google Scholar] [CrossRef]
  37. Riedler, M.; Raidl, G. Solving a selective Dial-a-Ride problem with logic-based Benders decomposition. Comput. Oper. Res. 2018, 96, 30–54. [Google Scholar] [CrossRef]
  38. Ho, S.C.; Szeto, W.Y.; Kuo, Y.-H.; Leung, J.M.Y.; Petering, M.; Tou, T.W.H. A survey of dial-a-ride problems: Literature review and recent developments. Transp. Res. Part B Methodol. 2018, 111, 395–421. [Google Scholar] [CrossRef]
  39. Glover, F.; Laguna, M. Tabu Search; Springer: Boston, MA, USA, 1997. [Google Scholar]
  40. Guerriero, F.; Bruni, M.E.; Greco, F. A hybrid greedy randomized adaptive search heuristic to solve the dial-a-ride problem. Asia-Pac. J. Oper. Res. 2013, 30, 1250046. [Google Scholar] [CrossRef]
  41. Paquette, J.; Cordeau, J.-F.; Laporte, G.; Pascoal, M.M.B. Combining multicriteria analysis and tabu search for dial-a-ride problems. Transp. Res. Part B Methodol. 2013, 52, 1–16. [Google Scholar] [CrossRef] [Green Version]
  42. Zidi, I.; Mesghouni, K.; Zidi, K.; Ghedira, K. A multi-objective simulated annealing for the multi-criteria dial a ride problem. Eng. Appl. Artif. Intell. 2012, 25, 1121–1131. [Google Scholar] [CrossRef]
  43. Reinhardt, L.B.; Clausen, T.; Pisinger, D. Synchronized dial-a-ride transportation of disabled passengers at airports. Eur. J. Oper. Res. 2013, 225, 106–117. [Google Scholar] [CrossRef]
  44. Braekers, K.; Caris, A.; Janssens, G.K. Exact and meta-heuristic approach for a general heterogeneous dial-a-ride problem with multiple depots. Transp. Res. Part B Methodol. 2014, 67, 166–186. [Google Scholar] [CrossRef]
  45. Muelas, S.; LaTorre, A.; Peña, J.-M. A variable neighborhood search algorithm for the optimization of a dial-a-ride problem in a large city. Expert Syst. Appl. 2013, 40, 5516–5531. [Google Scholar] [CrossRef]
  46. Muelas, S.; LaTorre, A.; Peña, J.-M. A distributed VNS algorithm for optimizing dial-a-ride problems in large-scale scenarios. Transp. Res. Part C Emerg. Technol. 2015, 54, 110–130. [Google Scholar] [CrossRef]
  47. Souza, A.L.S.; Bernardo, M.; Penna, P.H.V.; Pannek, J.; Souza, M.J.F. Bi-objective optimization model for the heterogeneous dynamic dial-a-ride problem with no rejects. Optim. Lett. 2022, 16, 355–374. [Google Scholar] [CrossRef]
  48. Chen, R.; Chen, S.; Cui, H.; Meng, Q. The container drayage problem for heterogeneous trucks with multiple loads: A revisit. Transp. Res. Part E Logist. Transp. Rev. 2021, 147, 102241. [Google Scholar] [CrossRef]
  49. Kaleche, R.; Bendaoud, Z.; Bouamrane, K. An Improved Biogeography-Based Optimization for the Long-Term Carpooling Problem. Appl. Artif. Intell. 2021, 35, 745–764. [Google Scholar] [CrossRef]
  50. Ropke, S.; Pisinger, D. An adaptive large neighborhood search heuristic for the pickup and delivery problem with time windows. Transp. Sci. 2006, 40, 455–472. [Google Scholar] [CrossRef] [Green Version]
  51. Braekers, K.; Kovacs, A.A. A multi-period dial-a-ride problem with driver consistency. Transp. Res. Part B Methodol. 2016, 94, 355–377. [Google Scholar] [CrossRef] [Green Version]
  52. Hungerländer, P.; Maier, K.; Pachatz, V.; Truden, C. Improving Sharing Rates of a Dial-a-Ride Problem implemented for an Austrian Mobility Provider. Transp. Res. Procedia 2021, 52, 525–532. [Google Scholar] [CrossRef]
  53. Masmoudi, M.A.; Hosny, M.; Demir, E.; Pesch, E. Hybrid adaptive large neighborhood search algorithm for the mixed fleet heterogeneous dial-a-ride problem. J. Heuristics 2020, 26, 83–118. [Google Scholar] [CrossRef]
  54. Galarza Montenegro, B.D.; Sörensen, K.; Vansteenwegen, P. A large neighborhood search algorithm to optimize a demand-responsive feeder service. Transp. Res. Part C Emerg. Technol. 2021, 127, 103102. [Google Scholar] [CrossRef]
  55. Ma, B.; Hu, D.; Chen, X.; Wang, Y.; Wu, X. The vehicle routing problem with speed optimization for shared autonomous electric vehicles service. Comput. Ind. Eng. 2021, 161, 107614. [Google Scholar] [CrossRef]
  56. Truden, C.; Ruthmair, M.; Kollingbaum, M.J. Analysis of Schedules for Rural First and Last Mile Microtransit Services. In Computational Logistics; ICCL 202; Mes, M., Lalla-Ruiz, E., Voß, S., Eds.; Springer: Cham, Switzerland, 2021; pp. 332–346. [Google Scholar]
  57. Vamanan, M.; Wang, Q.; Batta, R.; Szczerba, R.J. Integration of COTS software products ARENA & CPLEX for an inventory/logistics problem. Comput. Oper. Res. 2004, 31, 533–547. [Google Scholar]
  58. Dinu, O.; Rosca, E.; Dragu, V.; Rosca, M.; Ilie, A. Optimization of the transfer function through handling productivity control in port container terminals. Procedia Manuf. 2018, 22, 856–863. [Google Scholar] [CrossRef]
  59. Tasoglu, G.; Yildiz, G. Simulated annealing based simulation optimization method for solving integrated berth allocation and quay crane scheduling problems. Simul. Model. Pract. Theory 2019, 97, 101948. [Google Scholar] [CrossRef]
  60. AlKheder, S.; Alomair, A.; Aladwani, B. Hold baggage security screening system in Kuwait International Airport using Arena software. Ain Shams Eng. J. 2020, 11, 687–696. [Google Scholar] [CrossRef]
  61. Okeke, O.B. The impacts of shared autonomous vehicles on car parking space. Case Stud. Transp. Policy 2020, 8, 1307–1318. [Google Scholar] [CrossRef]
  62. Karimi, A.; Sepehri, M.M.; Yavari, E. A simulation model approach to decrease the length of stay of patients undergoing cataract surgery. Perioper. Care Oper. Room Manag. 2020, 21, 100133. [Google Scholar] [CrossRef]
  63. Azcarate, C.; Esparza, L.; Mallor, F. The problem of the last bed: Contextualization and a new simulation framework for analyzing physician decisions. Omega 2020, 96, 102120. [Google Scholar] [CrossRef]
  64. Fränti, P.; Sieranoja, S. K-means properties on six clustering benchmark datasets. Appl. Intell. 2018, 48, 4743–4759. [Google Scholar] [CrossRef]
  65. Hamerly, G.; Elkan, C. Learning the k in k-means. In Proceedings of the 16th International Conference on Neural Information Processing Systems, Whistler, BC, Canada, 9–11 December 2003; Thrun, S., Saul, L.K., Schölkopf, B., Eds.; MIT Press: Cambridge, MA, USA, 2014; pp. 281–288. [Google Scholar]
  66. Schubert, E.; Sander, J.; Ester, M.; Kriegel, H.P.; Xu, X.-W. DBSCAN Revisited, Revisited: Why and How You Should (Still) Use DBSCAN. ACM Trans. Database Syst. 2017, 42, 1–21. [Google Scholar] [CrossRef]
  67. Birant, D.; Kut, A. ST-DBSCAN: An algorithm for clustering spatial–temporal data. Data Knowl. Eng. 2007, 60, 208–221. [Google Scholar] [CrossRef]
  68. Ahlgren, P.; Jarneving, B.; Rousseau, R. Requirements for a cocitation similarity measure, with special reference to Pearson’s correlation coefficient. J. Am. Soc. Inf. Sci. Technol. 2003, 54, 550–560. [Google Scholar] [CrossRef]
  69. Ly, A.; Marsman, M.; Wagenmakers, E.-J. Analytic posteriors for Pearson’s correlation coefficient. Stat. Neerl. 2018, 72, 4–13. [Google Scholar] [CrossRef] [PubMed]
  70. Guan, H.; Zhang, Y.; Xian, M.; Chen, H.D.; Tang, X.-L. SMOTE-WENN: Solving class imbalance and small sample problems by oversampling and distance scaling. Appl. Intell. 2021, 51, 1394–1409. [Google Scholar] [CrossRef]
  71. Chawla, N.V.; Bowyer, K.W.; Hall, L.O.; Kegelmeyer, W.P. SMOTE: Synthetic minority over-sampling technique. J. Artif. Intell. Res. 2002, 16, 321–357. [Google Scholar] [CrossRef]
  72. Chiu, S.-M.; Chen, Y.-C.; Lee, C. Estate price prediction system based on temporal and spatial features and lightweight deep learning model. Appl. Intell. 2021, 52, 808–834. [Google Scholar] [CrossRef]
  73. Li, J.-H.; Zhang, M.; Martins, J.R.R.; Shu, C. Efficient Aerodynamic Shape Optimization with Deep-learning-based Geometric Filtering. AIAA J. 2020, 58, 4243–4259. [Google Scholar] [CrossRef]
  74. The Entrusted Technical Service for Designation of the Urban Renewal Area in Xiluo Town, Yunlin County and Drafting of Urban Renewal Plan. 2019. Available online: https://twur.cpami.gov.tw/zh/urban/govplan/view/314 (accessed on 31 December 2021).
Figure 1. (a) City map including locations of dispatch stations, hospitals, and citizen’s house (note that station A has one bus and station B has 2 buses). (b) Timeline of the fleet where T_x represents the time period that bus1 is occupied by the citizen x.
Electronics 11 00423 g001
Figure 2. (a) City map with all three buses allocated to station B. (b) Timeline of the fleet (note there is not enough time for afternoon service).
Electronics 11 00423 g002
Figure 3. GAN architecture with both generator and discriminator.
Electronics 11 00423 g003
Figure 4. GAN model used in this work, where generator input is the historical daily request from Arena simulation and discriminator input is the optimized vehicle allocation from Arena.
Electronics 11 00423 g004
Figure 5. Evaluation model of system simulation.
Electronics 11 00423 g005
Figure 6. Proposed GAN-VAPS.
Electronics 11 00423 g006
Figure 7. Flowchart of service region division.
Electronics 11 00423 g007
Figure 8. Basic sub-region according to Voronoi diagram where dot represents the home of citizen x and each small house is a dispatch station.
Electronics 11 00423 g008
Figure 9. Limitations of Voronoi diagram with regard to geographical barriers.
Electronics 11 00423 g009
Figure 10. Arena environment setup where each sub-region has its own process modules with similar structures.
Electronics 11 00423 g010
Figure 11. GAN architecture used for training.
Electronics 11 00423 g011
Figure 12. Sub-administrative regions of Yunlin County.
Electronics 11 00423 g012
Figure 13. (a) Basic division of Yunlin County’s 20 administrative regions, with four administrative regions undetermined. (b) Final division of Yunlin County’s 20 administrative regions.
Electronics 11 00423 g013
Figure 14. Distribution diagram of number of people who are not served: (a) historical records, (b) Arena simulation results. The vertical ticks on the left and right are the repetition of days and the probability of appearance at given number of people who are not served.
Electronics 11 00423 g014
Figure 15. Arena vs. GAN’s Station-Car results in first four cases where gray shaded area covers lower and upper bounds of each case, solid lines are vehicle allocations from GAN, and open circles indicate the sub-region where the number of vehicles identified by GAN did not fall within the range produced by Arena: (a) Case 1, (b) Case 2, (c) Case 3, (d) Case 4.
Electronics 11 00423 g015
Figure 16. Arena vs. GAN’s Station-Car results in last four cases: (a) Case 5, (b) Case 6, (c) Case 7, (d) Case 8.
Electronics 11 00423 g016
Table 1. Computation time of existing algorithms for Dial-a-Ride problems.
AuthorAlgorithmNumber of CarsNumber of RequestsCPU Time (min)
Jih et al. [16]Genetic algorithms17010.00
Cordeau and Laporte [9]Tabu Search1112046.24
Jorgensen et al. [17]Genetic algorithms1112058.23
Parragh et al. [18]Variant Neighborhood Search11120154.47
Parragh and Schmid [19]Column generation + Large Neighborhood Search1112026.70
Masson et al. [20]Adaptive Large Neighborhood Search1112044.00
Ritzinger et al. [21]Large Neighborhood Search + Dynamic Programming1112041.22
Molenbruch et al. [22]Large Neighborhood Search11120107.80
Chassaing [23]Evolutionary Local Search111209.87
Masmoudi et al. [24]Genetic algorithms + Local Search111201.90
Gschwind and Drexl [25]Adaptive Large Neighborhood Search111201.27
Gschwind and Drexl [25]Heuristic Adaptive Large Neighborhood Search111204.46
Table 2. Structure of generator.
Number of NeuronsActivation Function
Input layer11-
Fully connected layer 1256tanh
Fully connected layer 2128tanh
Fully connected layer 364tanh
Fully connected layer 432tanh
Output layer11-
Table 3. Structure of discriminator.
Number of NeuronsNormalizationActivation Function
Input layer22--
Convolutional layer 1128-LeakyReLU
Convolutional layer 2128BatchNormalizationLeakyReLU
Convolutional layer 264BatchNormalizationLeakyReLU
Output layer1--
Table 4. Calculation results of similarity between the administrative region for which the sub-region cannot be judged and the central administrative region of other sub-regions.
Target Administrative RegionCentral Administrative Region of the Sub-RegionSimilarityFinal Division Result
DounanDabei
Gukeng
0.9671
0.9605
Dabei
CitongLinnei
Xiluo
0.9730
0.9359
Linnei
DongshiSihu
Taixi
Baozhong
0.8334
0.7905
0.8333
Baozhong
LunbeiTaixi
Baozhong
0.9391
0.9601
Baozhong
Table 5. Time distribution of request generation for each region of input analyzer.
Sub-RegionTime Distribution
1−0.001 + 7 ∗ BETA (0.316, 1.06)
2−0.001 + LOGN (1.47, 2.54)
3LOGN (0.609, 0.575)
4−0.001 + LOGN (1.41, 2.49)
5EXPO (1.35)
6−0.001 + LOGN (1.51, 3.05)
77.88 ∗ BETA (0.687, 2.64)
8LOGN (1.34, 2.19)
9−0.001 + LOGN (1.22, 1.67)
10−0.001 + 7 ∗ BETA (0.588, 1.81)
11−0.001 + 7 ∗ BETA (0.345, 1.04)
Table 6. Parameter setting of vehicle’s task execution time.
Sub-RegionDelay TypeMinimumValueMaximum
1Triangular465266
2Triangular5880100
3Triangular61836
4Triangular202856
5Triangular2032120
6Triangular7296114
7Triangular425486
8Triangular284264
9Triangular324262
10Triangular728098
11Triangular586888
Table 7. Setting of vehicle configuration number for each station in OptQuest kit.
Sub-RegionLow BoundHigh Bound
119
219
3819
4211
5110
619
7110
8111
9211
1016
11111
Table 8. Req-Reg cases to verify performance of GAN estimations.
TypeCaseR1R2R3R4R5R6R7R8R9R10R11
Real11910321499171161319
2175421581018610817
3121537308109612814
47101314171114138916
Assuming532732242243
63025824324273834332341
731733851821116101313
830258243242726034332341
Table 9. Results of Arena and GAN’s Station-Car were used in first four Req-Reg cases.
CaseMethodR1R2R3R4R5R6R7R8R9R10R11No. of Persons Not Served
1Arena-Upper bound9610797101111511Min: 3
Arena-Lower bound74856683645
GAN7611767978493
2Arena-Upper bound7914777971069Min: 0
Arena-Lower bound55954576748
GAN7612857888490
3Arena-Upper bound9716106697957Min: 0
Arena-Lower bound661183565646
GAN7611867968490
4Arena-Upper bound891966910810510Min: 4
Arena-Lower bound56934673437
GAN7712767677494
Table 10. Results of Arena and GAN’s Station-Car sets used in last four Req-Reg cases.
CaseMethodR1R2R3R4R5R6R7R8R9R10R11No. of Persons Not Served
5Arena-Upper bound771911878101167Min: 0
Arena-Lower bound55832453444
GAN78111168556390
6Arena-Upper bound68107781079511Min:4
Arena-Lower bound56955594749
GAN4810869122641226
7Arena-Upper bound22117531181821Min:56
Arena-Lower bound22115526121421
GAN3311542721131056
8Arena-Upper bound4410764335865Min: 122
Arena-Lower bound138544323411
GAN22544625181025210
Publisher’s Note: MDPI stays neutral with regard to jurisdictional claims in published maps and institutional affiliations.

