Communication

Autonomous Technology for 2.1 Channel Audio Systems

Department of Electrical Engineering, National Taipei University, New Taipei 23741, Taiwan
*
Author to whom correspondence should be addressed.
Electronics 2022, 11(3), 339; https://doi.org/10.3390/electronics11030339
Submission received: 9 December 2021 / Revised: 8 January 2022 / Accepted: 20 January 2022 / Published: 23 January 2022
(This article belongs to the Section Artificial Intelligence)

Abstract

:
During the COVID-19 pandemic, smart home requirements have shifted toward entertainment at home. The purpose of this research project was therefore to develop a robotic audio system for home automation. High-end audio systems normally refer to multichannel home theaters. Although multichannel audio systems enable people to enjoy surround sound as they do at the cinema, stereo audio systems have been popularly used since the 1980s. The major shortcoming of a stereo audio system is its narrow listening area. If listeners are out of the area, the system has difficulty providing a stable sound field. This is because of the head-shadow effect blocking the high-frequency sound. The proposed system, by integrating computer vision and robotics, can track the head movement of a user and adjust the directions of loudspeakers, thereby helping the sound wave travel through the air. Unlike previous studies, in which only a diminutive scenario was built, in this work, the idea was applied to a commercial 2.1 audio system, and listening tests were conducted. The theory and the simulation coincide with the experimental results. The approximate rate of audio quality improvement is 31%. The experimental results are encouraging, especially for high-pitched music.

1. Introduction

Artificial intelligence (AI) enables electronic devices to perform tasks that typically require human intelligence. Nowadays, 5G is driving change in the Internet of Things (IoT) and is a great benefit to intelligent devices that require highly reliable, high-bandwidth communications, as well as the rapid spread of available computing power throughout the network. AI, together with the IoT, has made autonomous home systems widespread. Smart home technology tends to focus on lighting, energy usage, and security; however, the concept of a fully integrated, semiautonomous entertainment system is appealing. This is because the coronavirus crisis has led digital entertainment to a strong growth in consumption [1,2]. The COVID-19 pandemic also accelerates automation in the industrial world. Because of sending employees home in droves to minimize person-to-person interaction, the demand for robots used in manufacturing has been ramping up [3]. This paper thus investigates the possibility of combining home entertainment and industrial robotics.
Although multichannel home theater systems have the potential to provide an excellent listening experience, stereophonic systems are still widely used today. Because of limited living space, it is difficult to mount a multichannel system in an ordinary house. The shortcoming of the stereophonic system is the narrow listening space. Audio quality distortion occurs when electrodynamic speaker drivers do not direct sound to the listener. Kona et al. [4] used infrared (IR) sensors to detect the listener and servo motors to rotate the loudspeaker in the direction of the listener. Kona et al. [4] implemented the system in an 80 × 80 cm testbed room. In a small-scale demonstration of the scenario, a robot toy was used to represent the listener in the room. Therefore, there is no subjective evidence that automation systems can improve the sound quality. A headphone-based system is one of the popular methods for solving the problem of narrow listening space [5], especially since portable multimedia devices, such as smart phones and tablets, have grown in popularity. When people put on headphones, one ear only gets one of the stereo information, the left or right audio channel sound. No matter how people move their heads, the perceived sound field can remain the same. Several papers [5,6,7] aim to create a three-dimensional audio listening experience using headphones; however, headphones inject the music exactly as it is output into people’s ears without any physical modification. The lack of room reflection and mixing of audio channels can make the perceived music seem less realistic. Moreover, the binaural digital filters have to meet the requirement of the real-time signal processing. The modification of the Butterworth filter was therefore proposed in [8], and the applications of the Chebyshev filter were presented in [9,10]. Instead of using bilinear transformation, Yao et al. [11] investigated the positions of the poles in the s-plane and zeros in the z-plane. The pole-zero placement techniques for system optimization were illustrated in [11,12]. Even if several filter design methods have been developed, there are still some parameters with uncertainties [13], such as the anthropometric parameters of listeners’ heads and pinnae. If using a pair of loudspeakers, unwanted crosstalk from each loudspeaker to the opposite ear occurs. Crosstalk cancellation is necessary to invert the transfer function of transmission paths [14,15,16].
The major novelty of the proposed system is the integration of audio signal processing and robotics. The proposed system provides a dynamic listening area for users. The use of a robotic mechanism enables the system to change the positions and directions of loudspeakers automatically, thereby generating the best listening area where the head of the listener is located. The servo motor was also compared with a stepper motor, and its advantages and disadvantages are illustrated. Because IR sensors can only detect large human movements, a camera was used to monitor slight head movements. Unlike in the work of Kona et al. [4], who used a replica monophonic speaker, robot toy, and mini smart house model, in this study, the stereophonic system was implemented in a real acoustic environment, and human participants were invited to take listening tests. The proposed autonomous audio system cooperating with a crosstalk cancellation should show more merits, because most crosstalk cancellation systems were developed for a fixed listening location. The proposed sound system can provide dynamic localization cues during head motion. However, the digital filters for a crosstalk cancellation are not yet ready for real-time processing due to the limitations of the low-cost hardware.

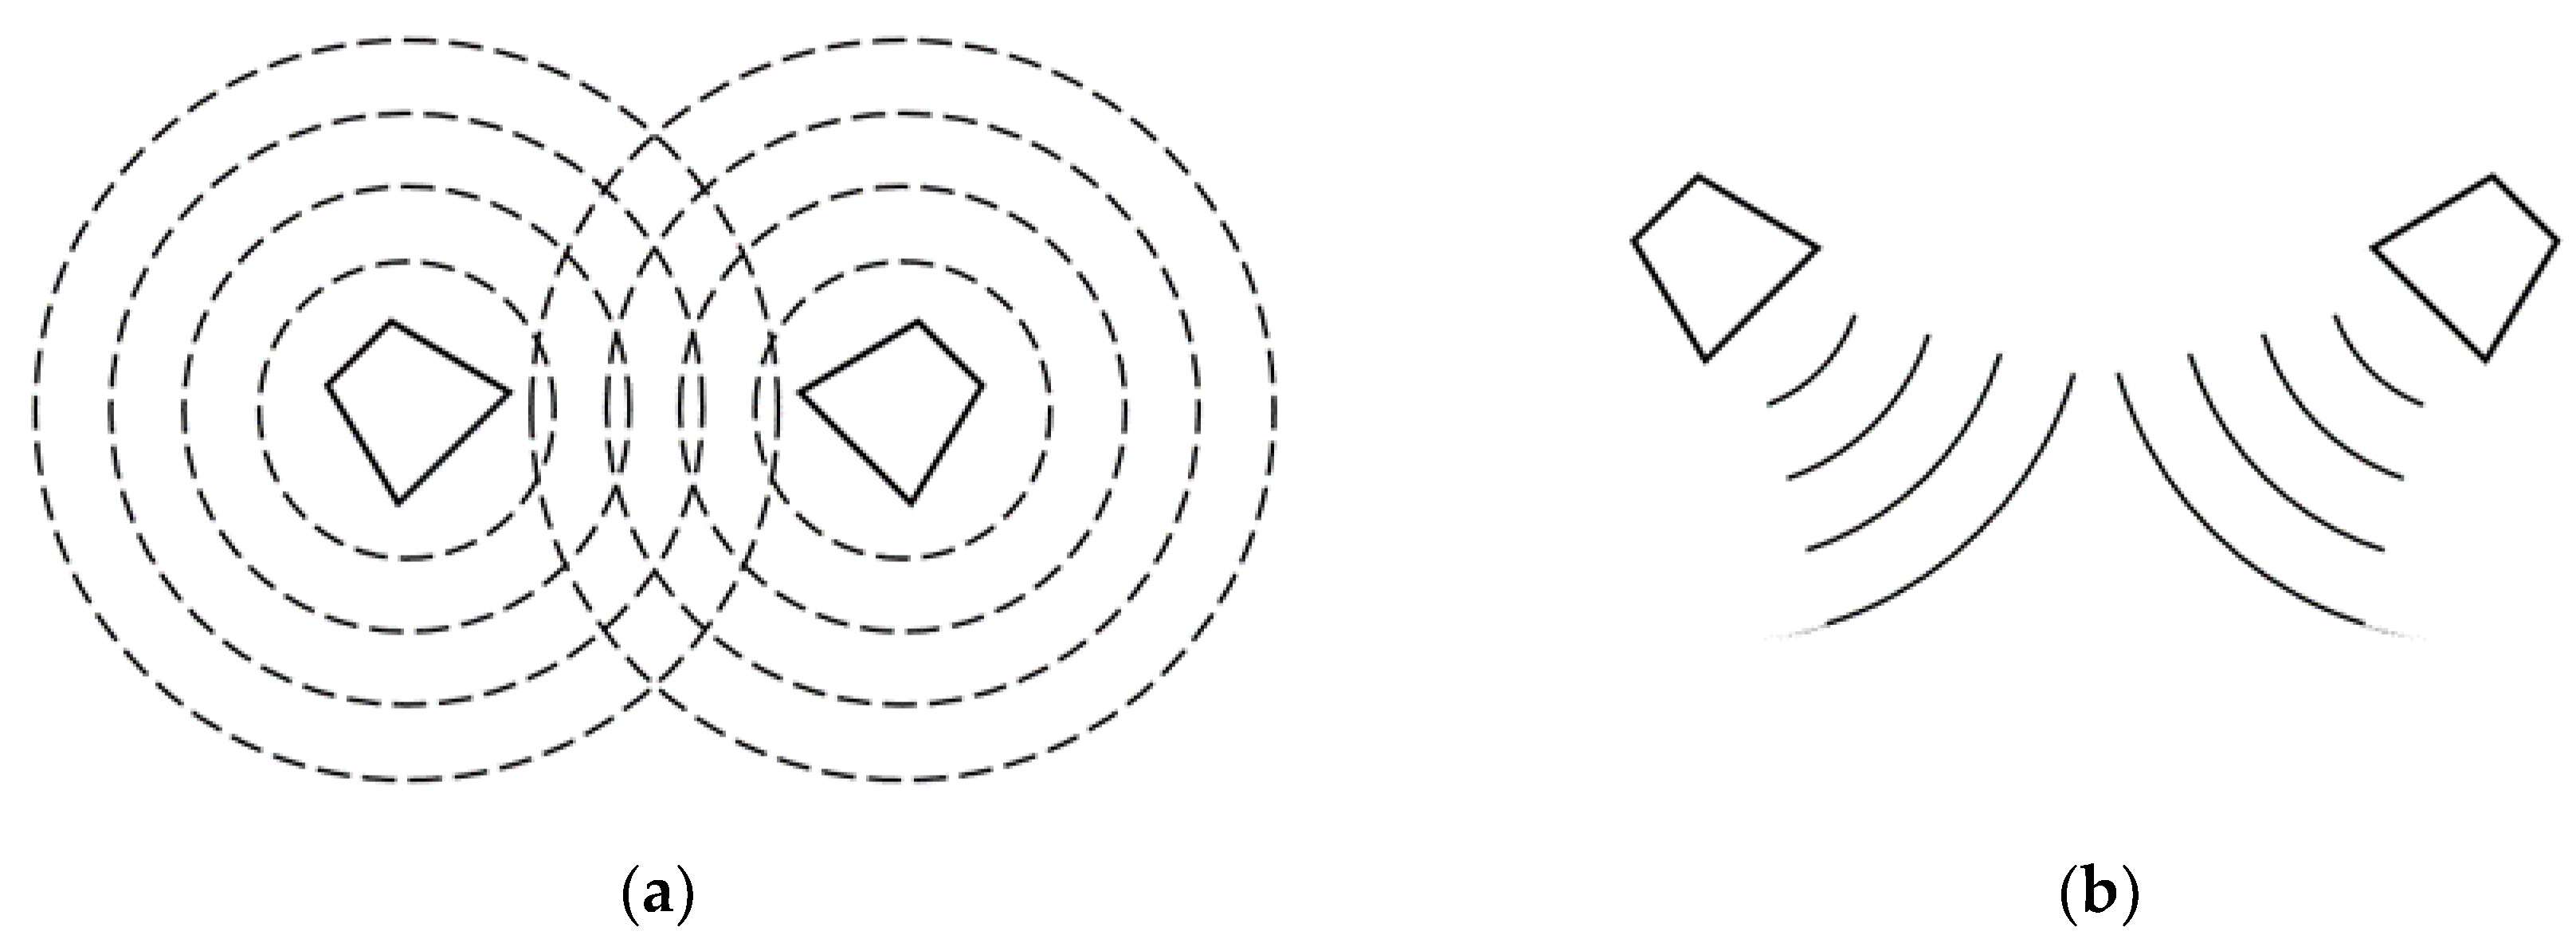
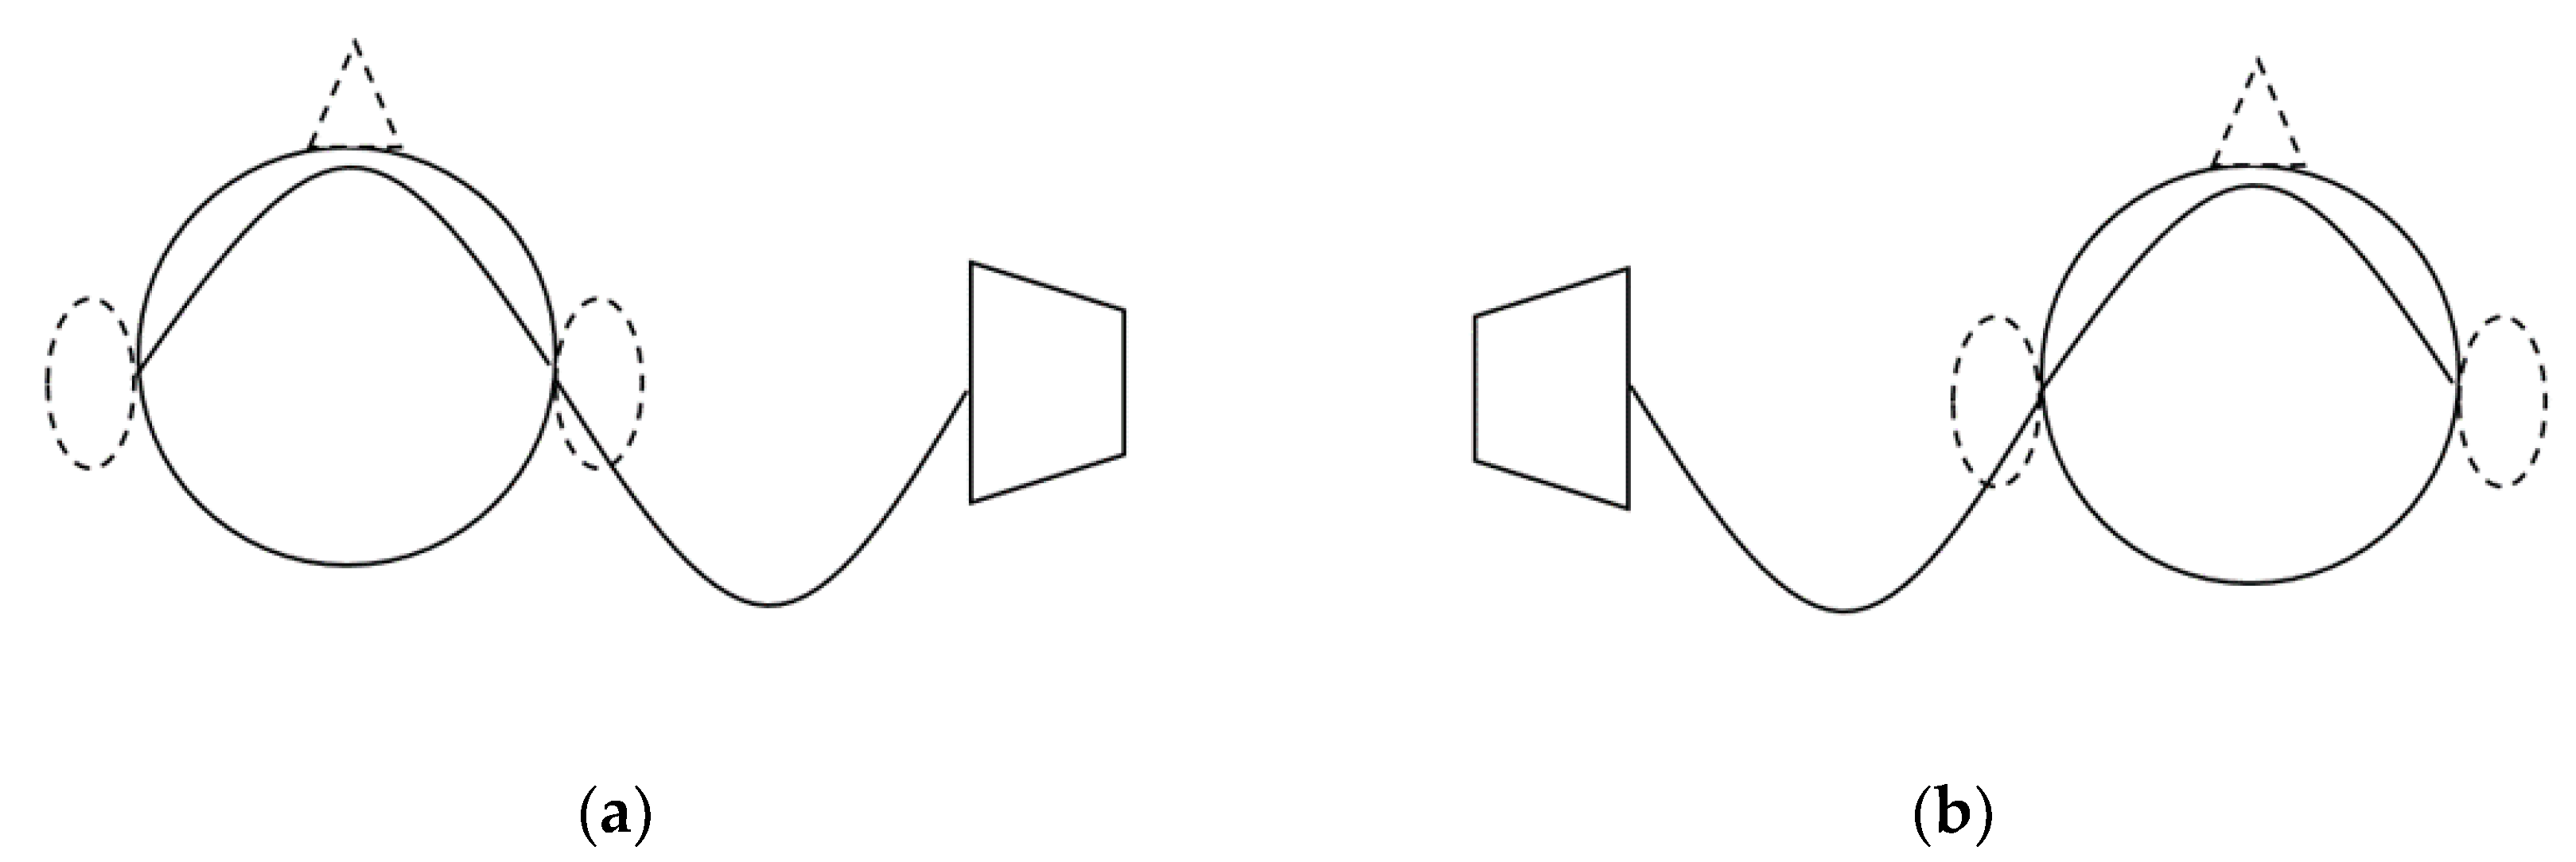
2. Sound Wave Theory

Most audio systems have a rigid listening area, the so-called “sweet spot.” The sweet spot of the stereo audio system is shown in Figure 1. The left and right loudspeakers are placed in the 30° and 30 ° directions. There is a spot where the two sound traveling paths converge. Only when the listener is at the sweet spot can one obtain the best listening experience. However, the listener is normally out of this spot because of unconscious head movements. When the listener is not at the sweet spot, high-frequency sound can be distorted.
There are physical differences between low- and high-frequency sound waves. When the loudspeaker emits a low-frequency sound wave, the transmission pattern is omnidirectional, as shown in Figure 2a. When the loudspeaker emits a high-frequency sound wave, the transmission pattern is more directional than that of low-frequency sound, as shown in Figure 2b. This is because low-frequency sound has a long wavelength and diffracts around a corner more efficiently. The duplex theory introduced by Rayleigh [17] provides a model describing how listeners distinguish the positions of sound sources by discriminating interaural time differences (ITDs) and interaural intensity differences (IIDs). An ITD is the time difference between a sound wave reaching one ear and the other. The listener feels that the sound source is closer to the side where the ear receives a sound wave earlier than the other. Taking Figure 3 as an example, first, a low-frequency sound source is assumed whose wavelength is longer than the head diameter emitted by a loudspeaker. The signals arriving at the right and left ears of the listener are illustrated in Figure 3a. When a sinusoid wave is considered, the timing difference between the two received signals can be expressed as a phase difference, as shown in Figure 3b. The two received signals are out of phase with one another.
However, when one considers the sound source as a high-frequency sinusoidal wave, the ITD perception becomes confusing because of the phase ambiguity [18]. The listener cannot unambiguously perceive the true ITD because a given phase difference can occur at multiple ITDs. For illustration, it is assumed that the speed of sound is 340 m/s, and the diameter of the head of a typical human being is 22.5 cm. In Figure 4a, the sound source is located at the listener’s direct right, and its wavelength is twice the diameter of the head of the listener; hence, the phase difference between the left and right ears is π. If one considers the situation shown in Figure 4b, the sound source is located at the direct right of the listener. The phase difference between the left and right ears is π. At this and higher frequencies, phase ambiguity occurs when the half wavelength is less than the head diameter. The critical frequency when phase ambiguity begins can be computed using Equation (1), where c = 340 m/s and λ = 0.45 m. As a result, the aliasing problem occurs when the sound frequency is more than 750 Hz [19].
f = c λ
Although human beings have problems in localizing a high-frequency sound source by ITDs, IIDs serve to provide localization information of high-frequency components. As Figure 4a shows, high-frequency components are attenuated because of the shadowing effect of the head of the listener when transmitting to the left ear. The head becomes a barrier to short-wavelength sound, whereas long-wavelength sound can travel along the diffracted path to the shadowed ear. Therefore, the right ear is expected to receive more sound energy than the left one when the listener hears predominately high-frequency tones. This intensity difference between the ears is the IID. Listeners tend to feel that the high-frequency sound source is closer to the ear that hears the loudest sound.
Because the listener is out of the sweet spot, high-frequency sound can be shadowed by the head, resulting in IID error. Figure 5 shows an example of an ideal and a nonideal listening position. Figure 5a shows the ideal situation in which the listener is exactly at the sweet spot. If the listener is out of the spot, as shown in Figure 5b, the directional high-frequency sounds cannot reach the listener. As shown in Figure 5c, the mechanism of the proposed system is to trace the listener and direct the loudspeaker driver toward the listener so that the directional sound can reach the target.

3. Robotic System for Stereophonics

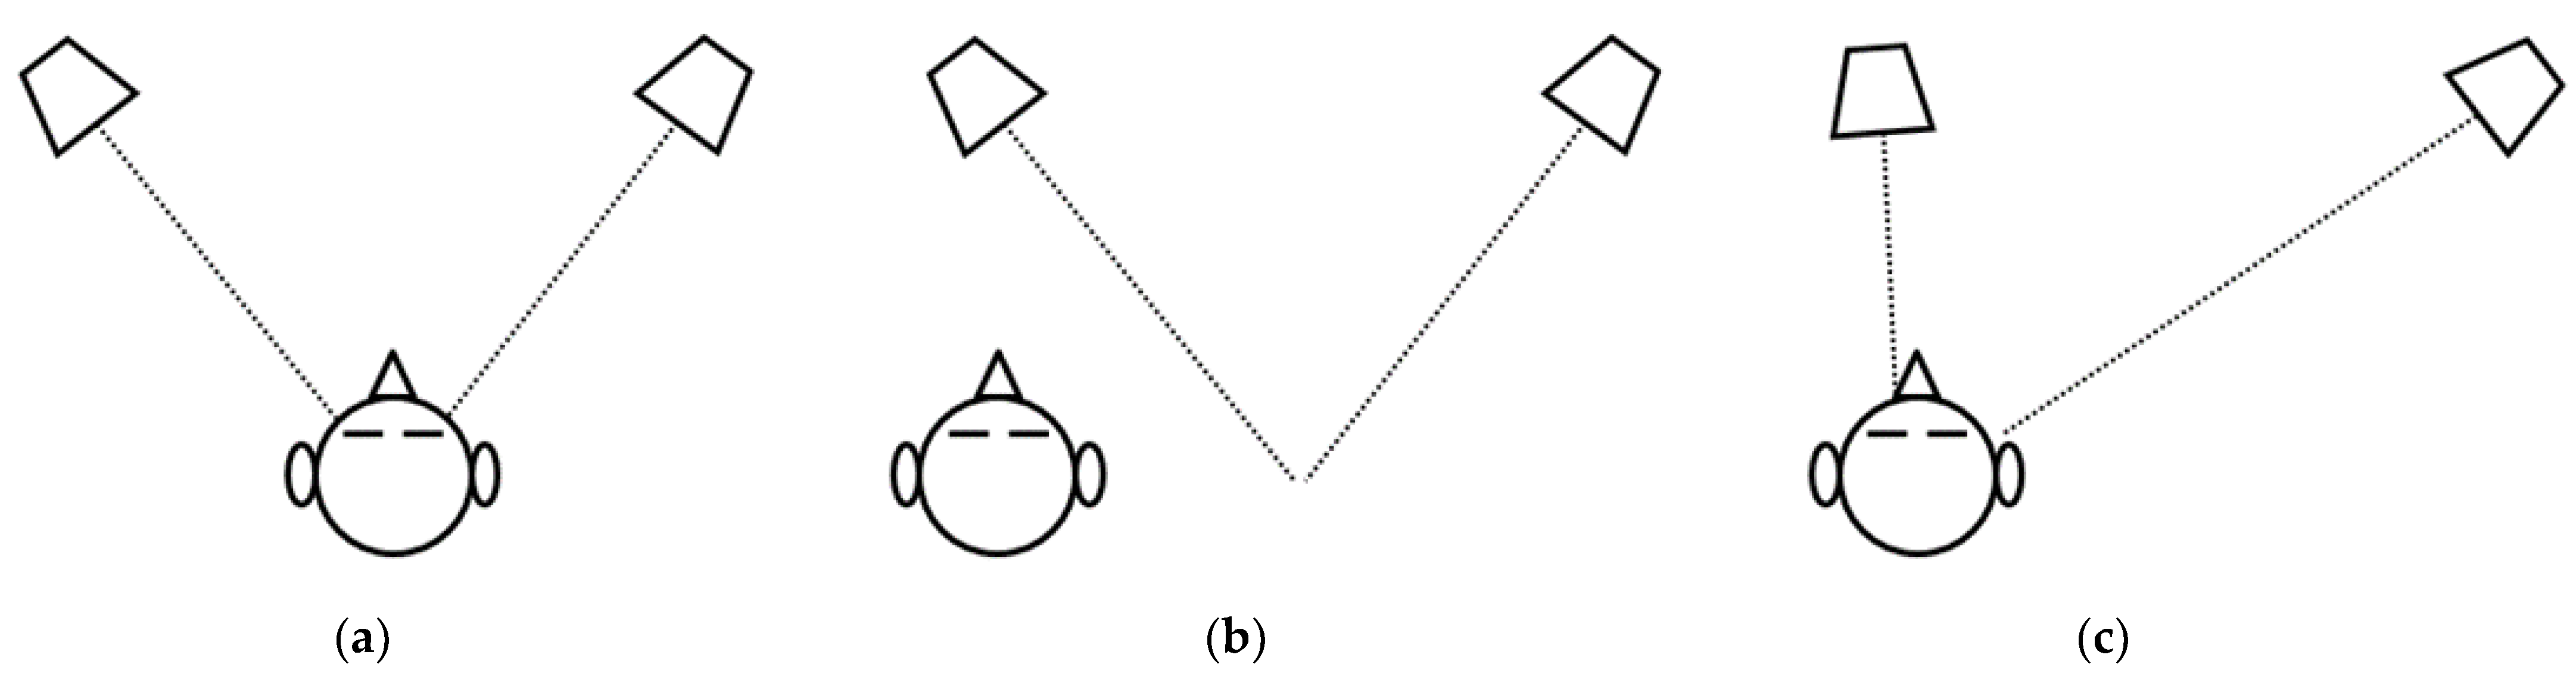
3.1. Computer Vision

To locate the listener, computer vision was used with a general camera and a single-board computer, Raspberry Pi 4. First, a deep-learning neural network for real-time target detection was installed in the embedded system. The object detection used in this project was built based on a single-shot multibox detection network. Although the module can detect a human being, the target had to be specifically the head. After the computer vision recognizes the user, the neural network further captures the face of the user. There is a pretrained deep-learning face detector model conducting accurate face detection. In the prototype of the system, only horizontal movement was considered. Therefore, the screen was divided into five areas, as shown in Figure 6, where the Raspberry Pi locates the target and responds to a number corresponding to the position. Because the robotic system responds to the head movement, the discrete area detection was designed to reduce the continuous noise caused by motors. Moreover, tracing the discrete positions helped developers calibrate the detection system. The proposed system only allows for a single user, so the output state keeps still, when there is more than one person detected.

3.2. Robotic System

Each loudspeaker was mounted on a motor to respond to the head movement of the user. The motors were controlled by a single-board microcontroller (Arduino UNO). The Arduino UNO received instructions from the Raspberry Pi and then adjusted the rotation angle of the motor. Servo motors normally run faster than stepper motors, which is one of the possible reasons why Kona et al. [4] chose servo motors. In this study, servo motor SG90 was also used in the initial stage, allowing a quick response. The rotation angles of servo motors were controlled by the Arduino UNO via pulse-width modulation signal. However, the noise caused by the wheel rotation was very loud. A 28BYJ-48 stepper motor was then tested. The stepper motor needs an additional driver, IC ULN2003, to work; hence, the cost is higher than that incurred when using SG90 in this research project. Although the response is much slower than that of SG90, stepper motors normally have a higher pole count than servo motors. The difference in pole count means that stepper motors move incrementally with a consistent pulse. Servo motors require an encoder to adjust pulses for position control. Whereas servo motors are a better choice for systems requiring high speed and acceleration, stepper motors provide precision drive control for motion control applications. Whereas servo motors are typically used in packaging, metal cutting, and forming machines, stepper motors are widely used in medical, biotech, security and defense, and semiconductor manufacturing applications. Because the robotic system is for an audio system, low-noise stepper motors are more appropriate. The noise level of a moving stepper motor in an experimental environment was about 43.6 dB, and the ambient noise level in the same environment was approximately 42.8 dB. That is, the noise caused by a moving stepper motor was less than 1 dB, whereas the noise level in a servo motor can reach 23 dB. Comparisons in terms of speed, noise, and budget are shown in Table 1.

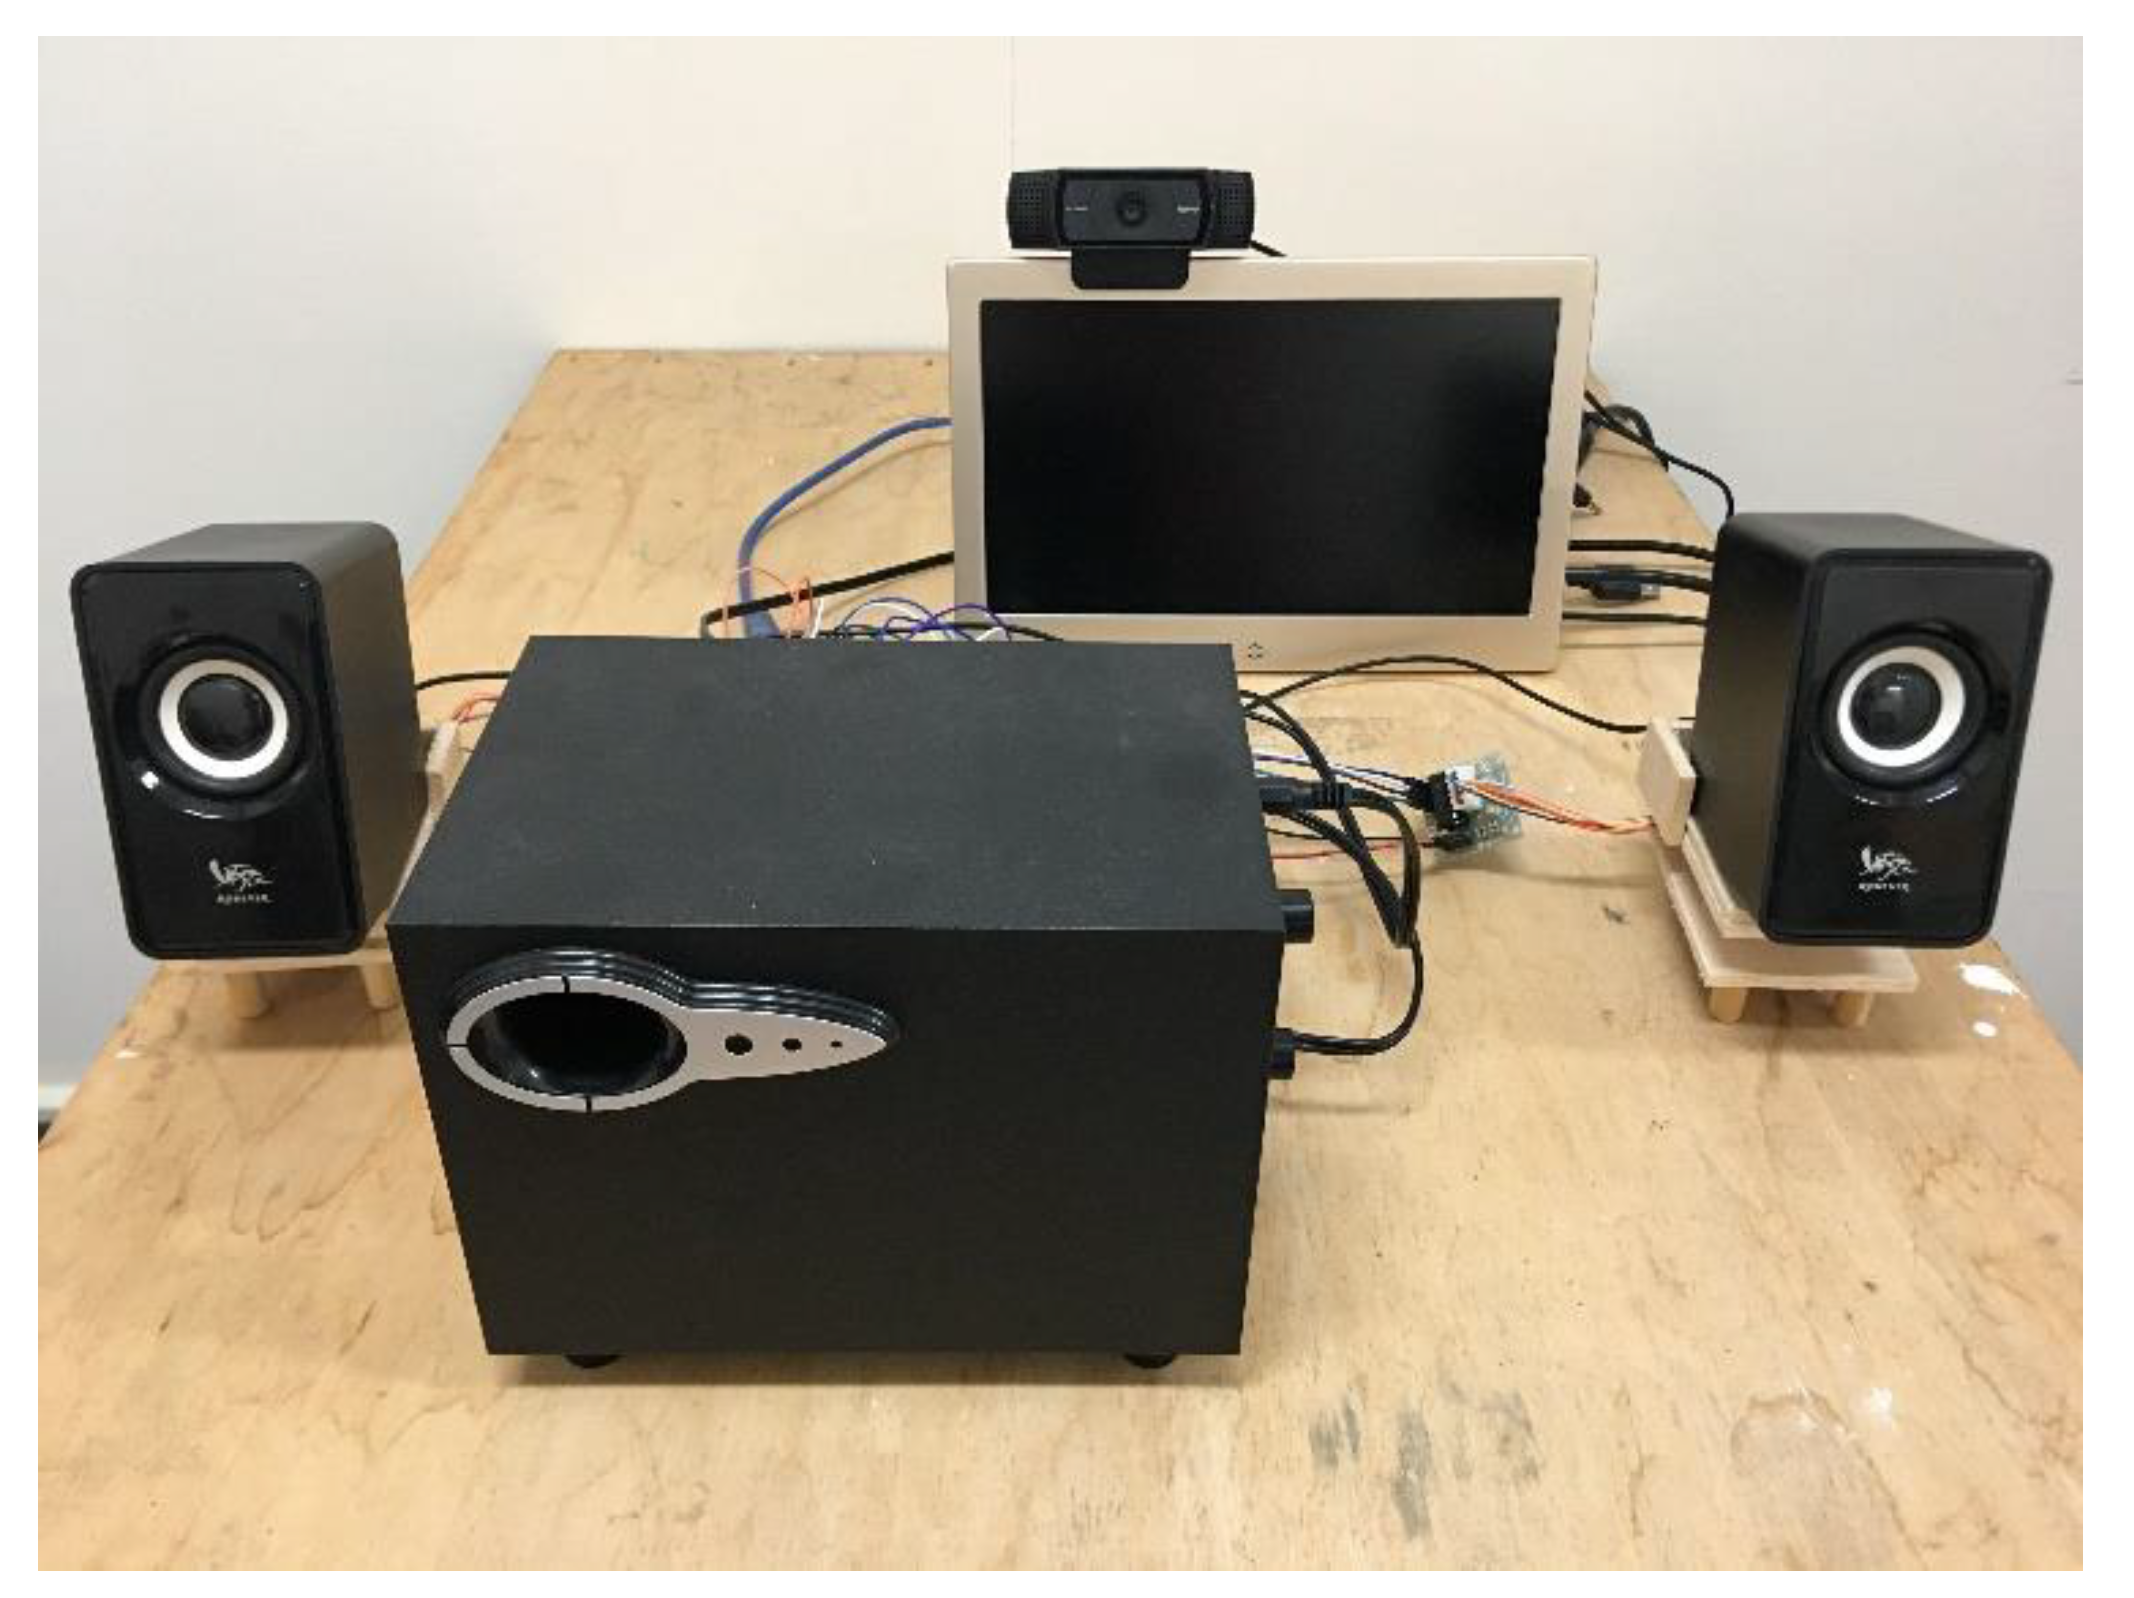
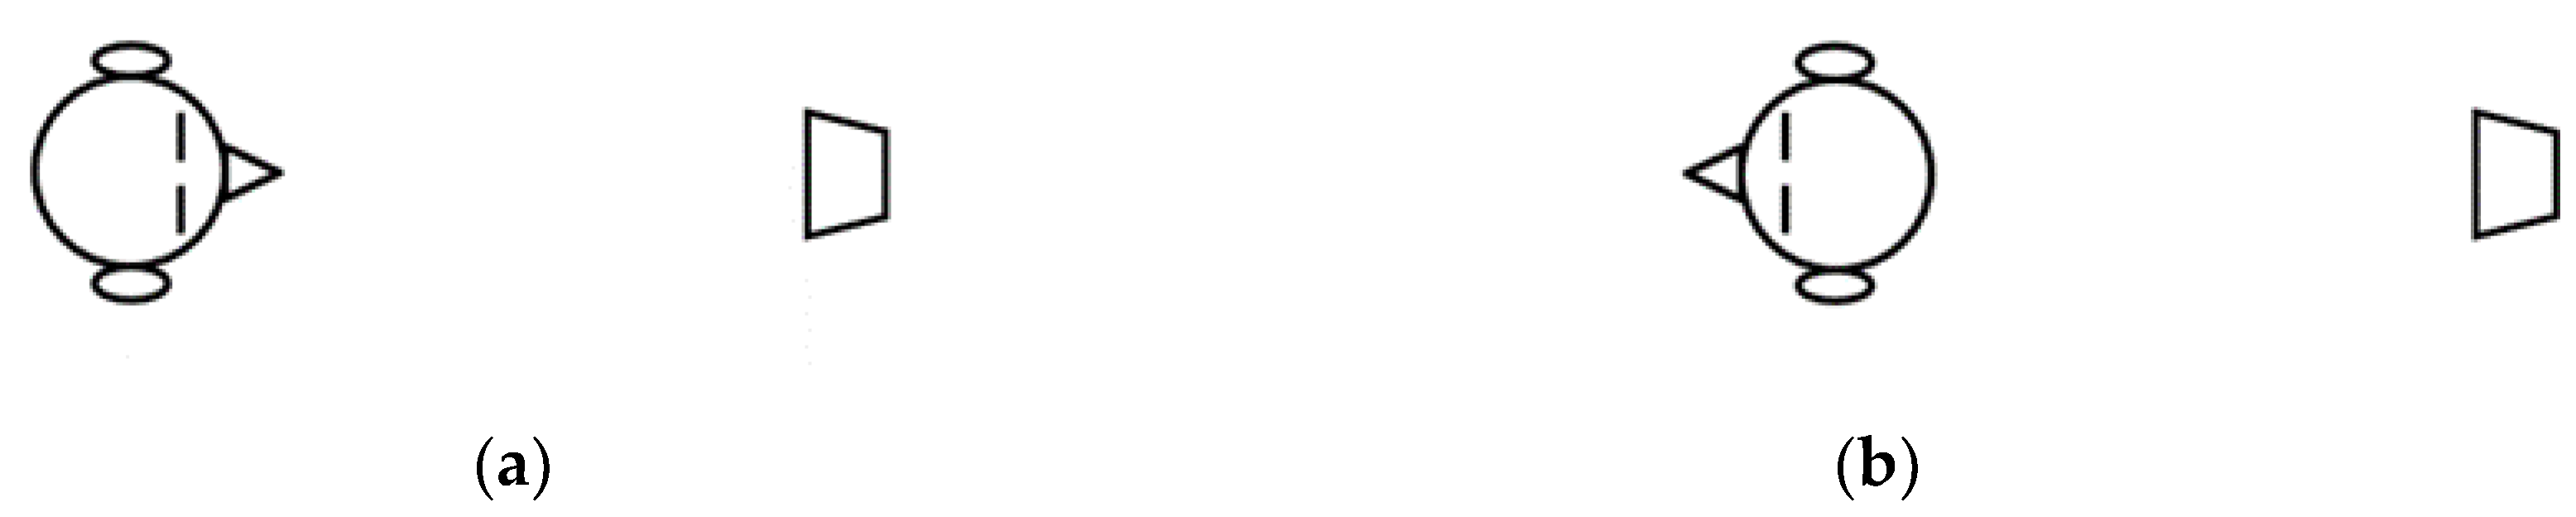
3.3. System Integration

Head tracking is accomplished using a camera and a Raspberry Pi 4. The camera monitors the face of the user and executes the computer vision code OpenCV. The robotic system is composed of stepper motors and an Arduino UNO. The computer vision traces and locates the human face, and then the information is sent to the microcontroller. After receiving the data, the microcontroller directs the loudspeaker drivers toward the user by rotating the stepper motors.
As mentioned in Section 2, the directional sound is a high-frequency sound and is more likely to be shadowed. The omnidirectional sound, on the other hand, is a low-frequency sound with a long wavelength. The user can listen to low-frequency sounds via diffraction. Therefore, the concept in this work was applied to a 2.1 stereo system, as shown in Figure 7. A subwoofer is placed in the middle, whereas the midrange loudspeakers are on the sides. The bottoms of the midrange loudspeakers are mounted on the proposed autonomous system.

4. Experimental Results and Discussion

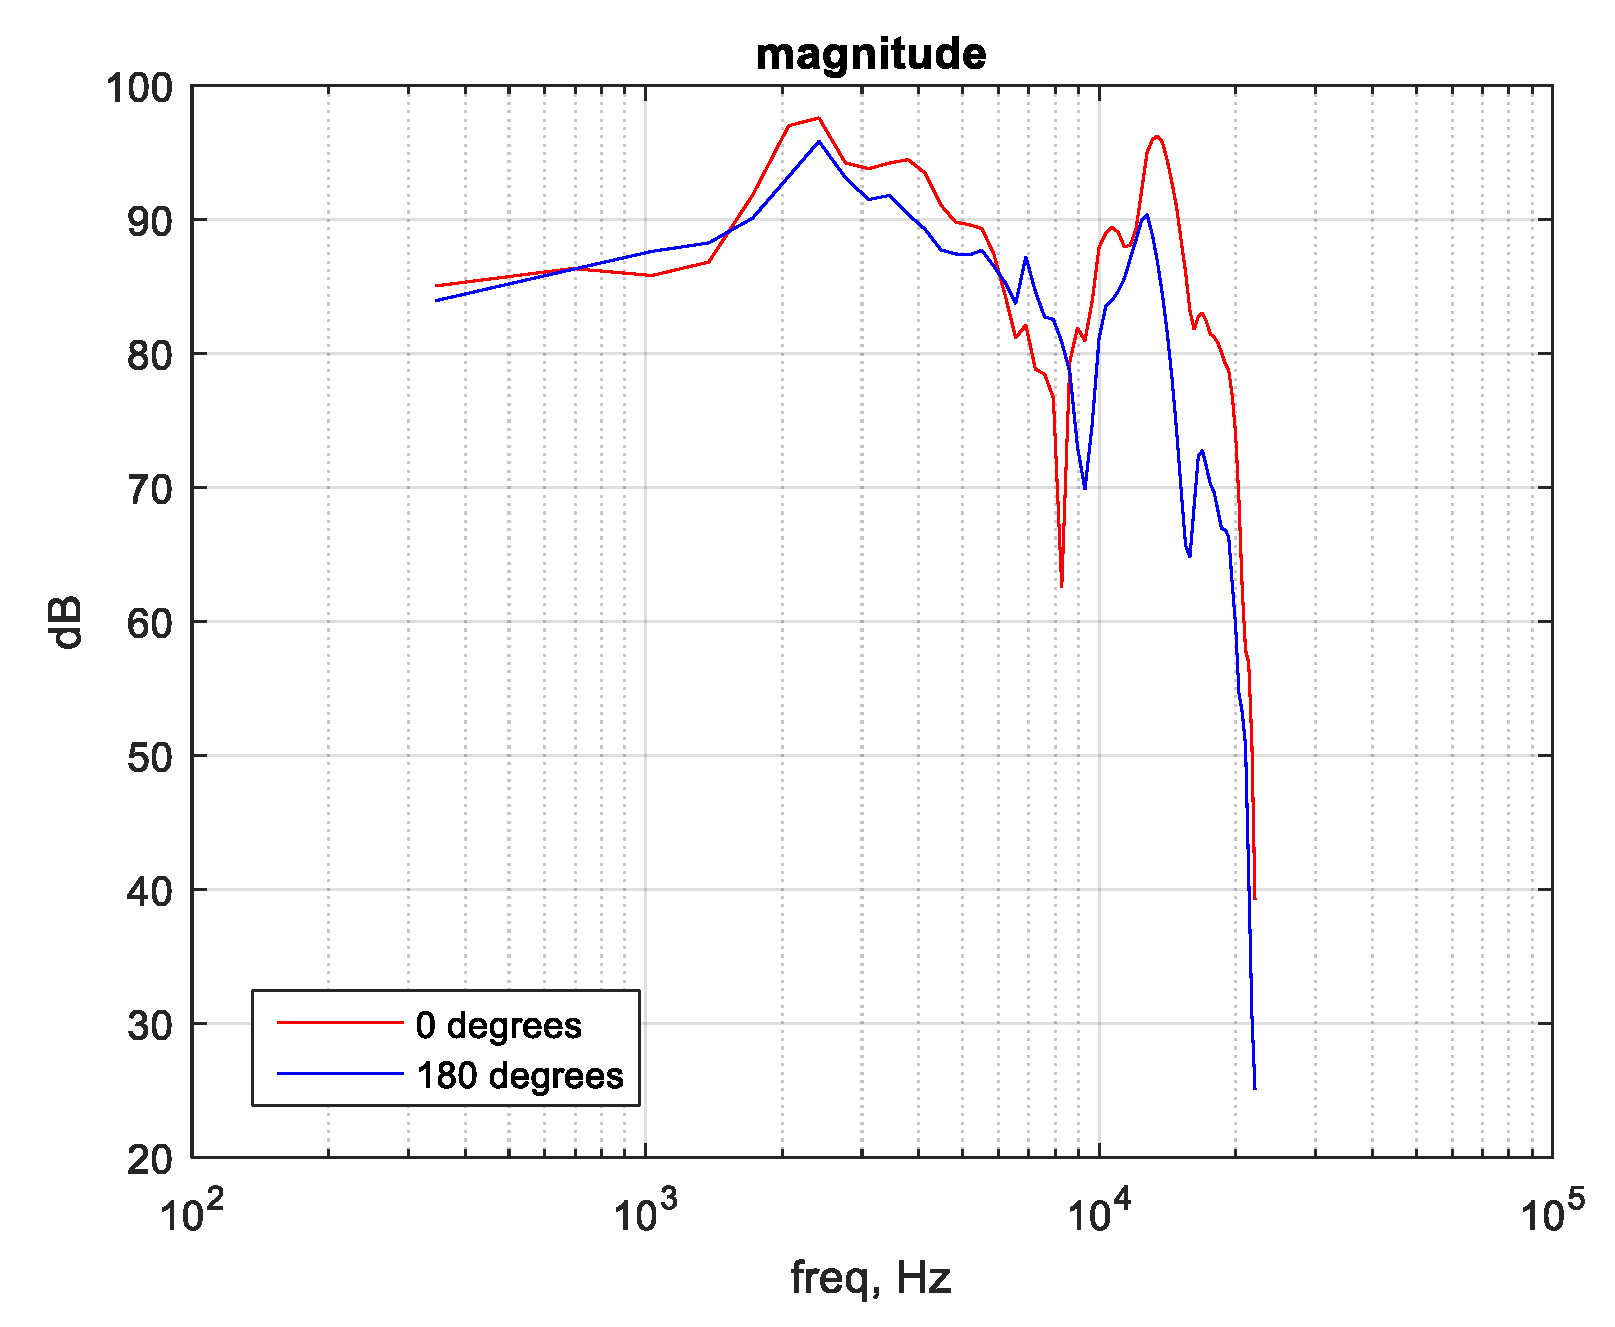
4.1. Objective Listening Test

When hearing a sound, a listener can distinguish the location of the source by considering the differences in magnitude and phase of the sound between the ears. These characteristics are called head-related impulse responses (HRIRs) and can be captured by binaural microphone sensors. Figure 8a shows a loudspeaker and a listener with two small microphones inside the ears. If the loudspeaker emits an impulse signal δ ( t ) , the microphone signals are a pair of HRIRs: h 1 ( t ) and h 2 ( t ) . Using HRIRs, it is possible to construct a binaural auditory space. Taking the stereophonic system in Figure 8b as an example, one can evaluate the stereo sound arriving at the left and right ears using
e Left ( t ) = ( s L h 4 ) ( t ) + ( s R h 1 ) ( t )
e Right ( t ) = ( s L h 3 ) ( t ) + ( s R h 2 ) ( t ) ,
where “ ” is a convolution operator, e ( t ) is the signal reaching the left or right ear, h ( t ) is the left or right HRIR in the direction of the loudspeaker, and s ( t ) is the loudspeaker feeding.
In the first simulation environment, HRIRs were used to show the high-frequency attenuation caused by the incorrect direction of an electrodynamic speaker driver. Figure 9a shows the ideal listening situation of the monophonic system in which the listener directly faces the electrodynamic speaker driver. In Figure 9b, the relative positions of the loudspeaker and listener are similar to those in Figure 9a, but the direction of the head of the listener is reversed. This can illustrate spectrum distortion if a mismatching direction occurs. The frequency spectra of the HRIRs, the so-called “head-related transfer functions” (HRTFs), were examined. Figure 10 shows the HRTF datasets from 0 ° and 180 ° under the assumption that the human ears are symmetric. The comparison revealed that the high-frequency magnitude response is attenuated, which matches the theory that short-wavelength sound is easily shadowed. Because head movement can lead to an incorrect direction of an electrodynamic speaker driver, causing spectrum impairment, the position and direction of the electrodynamic speaker driver should be adjusted.
In the second simulation environment, the sound fields for television (TV) viewing were built. Because of viewing posture, people may sit in front of the TV or off to the side. HRIRs were used to render virtual loudspeakers, and the competitiveness of the audio quality of the autonomous system after it corrected the rotation angle with that of the ideal situation was verified, as shown in Figure 11a. Several HRIR databases are released online by academic institutions, such as the Massachusetts Institute of Technology (MIT) Media Lab [20], CIPIC Interface Laboratory [21], and Institute for Research and Coordination in Acoustics/Music [22]. The MIT database [20] was selected because its HRIR angles match the virtual loudspeaker placement. A Realistic Optimus Pro 7 loudspeaker was mounted 1.4 m from a dummy head. Etymotic ER-11 microphones were placed at the left and right pinnae of the dummy head. The MIT Media Lab measured transform functions with maximum length sequences (MLS) in an anechoic chamber. MLS signals are binary bit sequences having autocorrelation functions equal to a Dirac delta with an offset. If it is assumed that h α L and h α R are a pair of HRIRs from the angle α ° , the mix of a piece of stereo music convolving with an HRIR dataset from α ° and β ° , as shown in Equations (4) and (5), can simulate the scenario in Figure 11. For example, if α = 30 and β = 30 , this can result in the situation shown in Figure 11a. If the listener is out of the center, as shown in Figure 11b, α and β are 0 and 50, respectively. The left channel of the stereo audio files is s L , and the right channel is s R . Because of the symmetric property, only the scenario on the left side is considered.
e Left ( t ) = ( s L h α L ) ( t ) + ( s R h β L ) ( t )
e Right ( t ) = ( s L h α R ) ( t ) + ( s R h β R ) ( t ) ,
From 1994 to 1998, the International Telecommunication Union’s Radio Communication Sector developed a standardized algorithm, perceptual evaluation of audio quality (PEAQ), to measure perceived audio quality objectively. The PEAQ compares the reference signal and the signal under test and gives a score of 1 to 5, corresponding to poor to excellent. The signal differences are analyzed in frequency and time domains by a cognitive model that was validated by the subjective listening test conducted in ITU-R Recommendation BS.1116 [23]. Because PEAQ is based on generally accepted psychoacoustic principles [24], in this study, objective measurements were made using PEAQ to indicate whether the proposed system provides tolerable audio quality even if the listener is out of the listening area. The constructed HRIR virtual environment, as shown in Figure 11a, is the reference, and the situations in Figure 11b,c are under test. Several genres of stereo audio serve as loudspeaker feeds. The signals arriving at the ears of the listener, as shown in Equations (4) and (5), can also be saved as a stereo audio file. The audio files were fed into the PEAQ algorithm, and the score was obtained. Table 2 shows the audio quality scores when the position of the listener is located in the positions shown in Figure 11b,c. The average listening scores in the virtual environment, as shown in Figure 11b,c, are −2.285 and −3.603, respectively. This indicates that the movement of the listener may have a negative impact on the listening experiment. The objective listening scores in Figure 11c indicate that the system produces annoying sounds, even if the loudspeakers can be directed to the listener. The objective listening scores in Figure 11b indicate that the audio qualities are perceptible but not annoying.

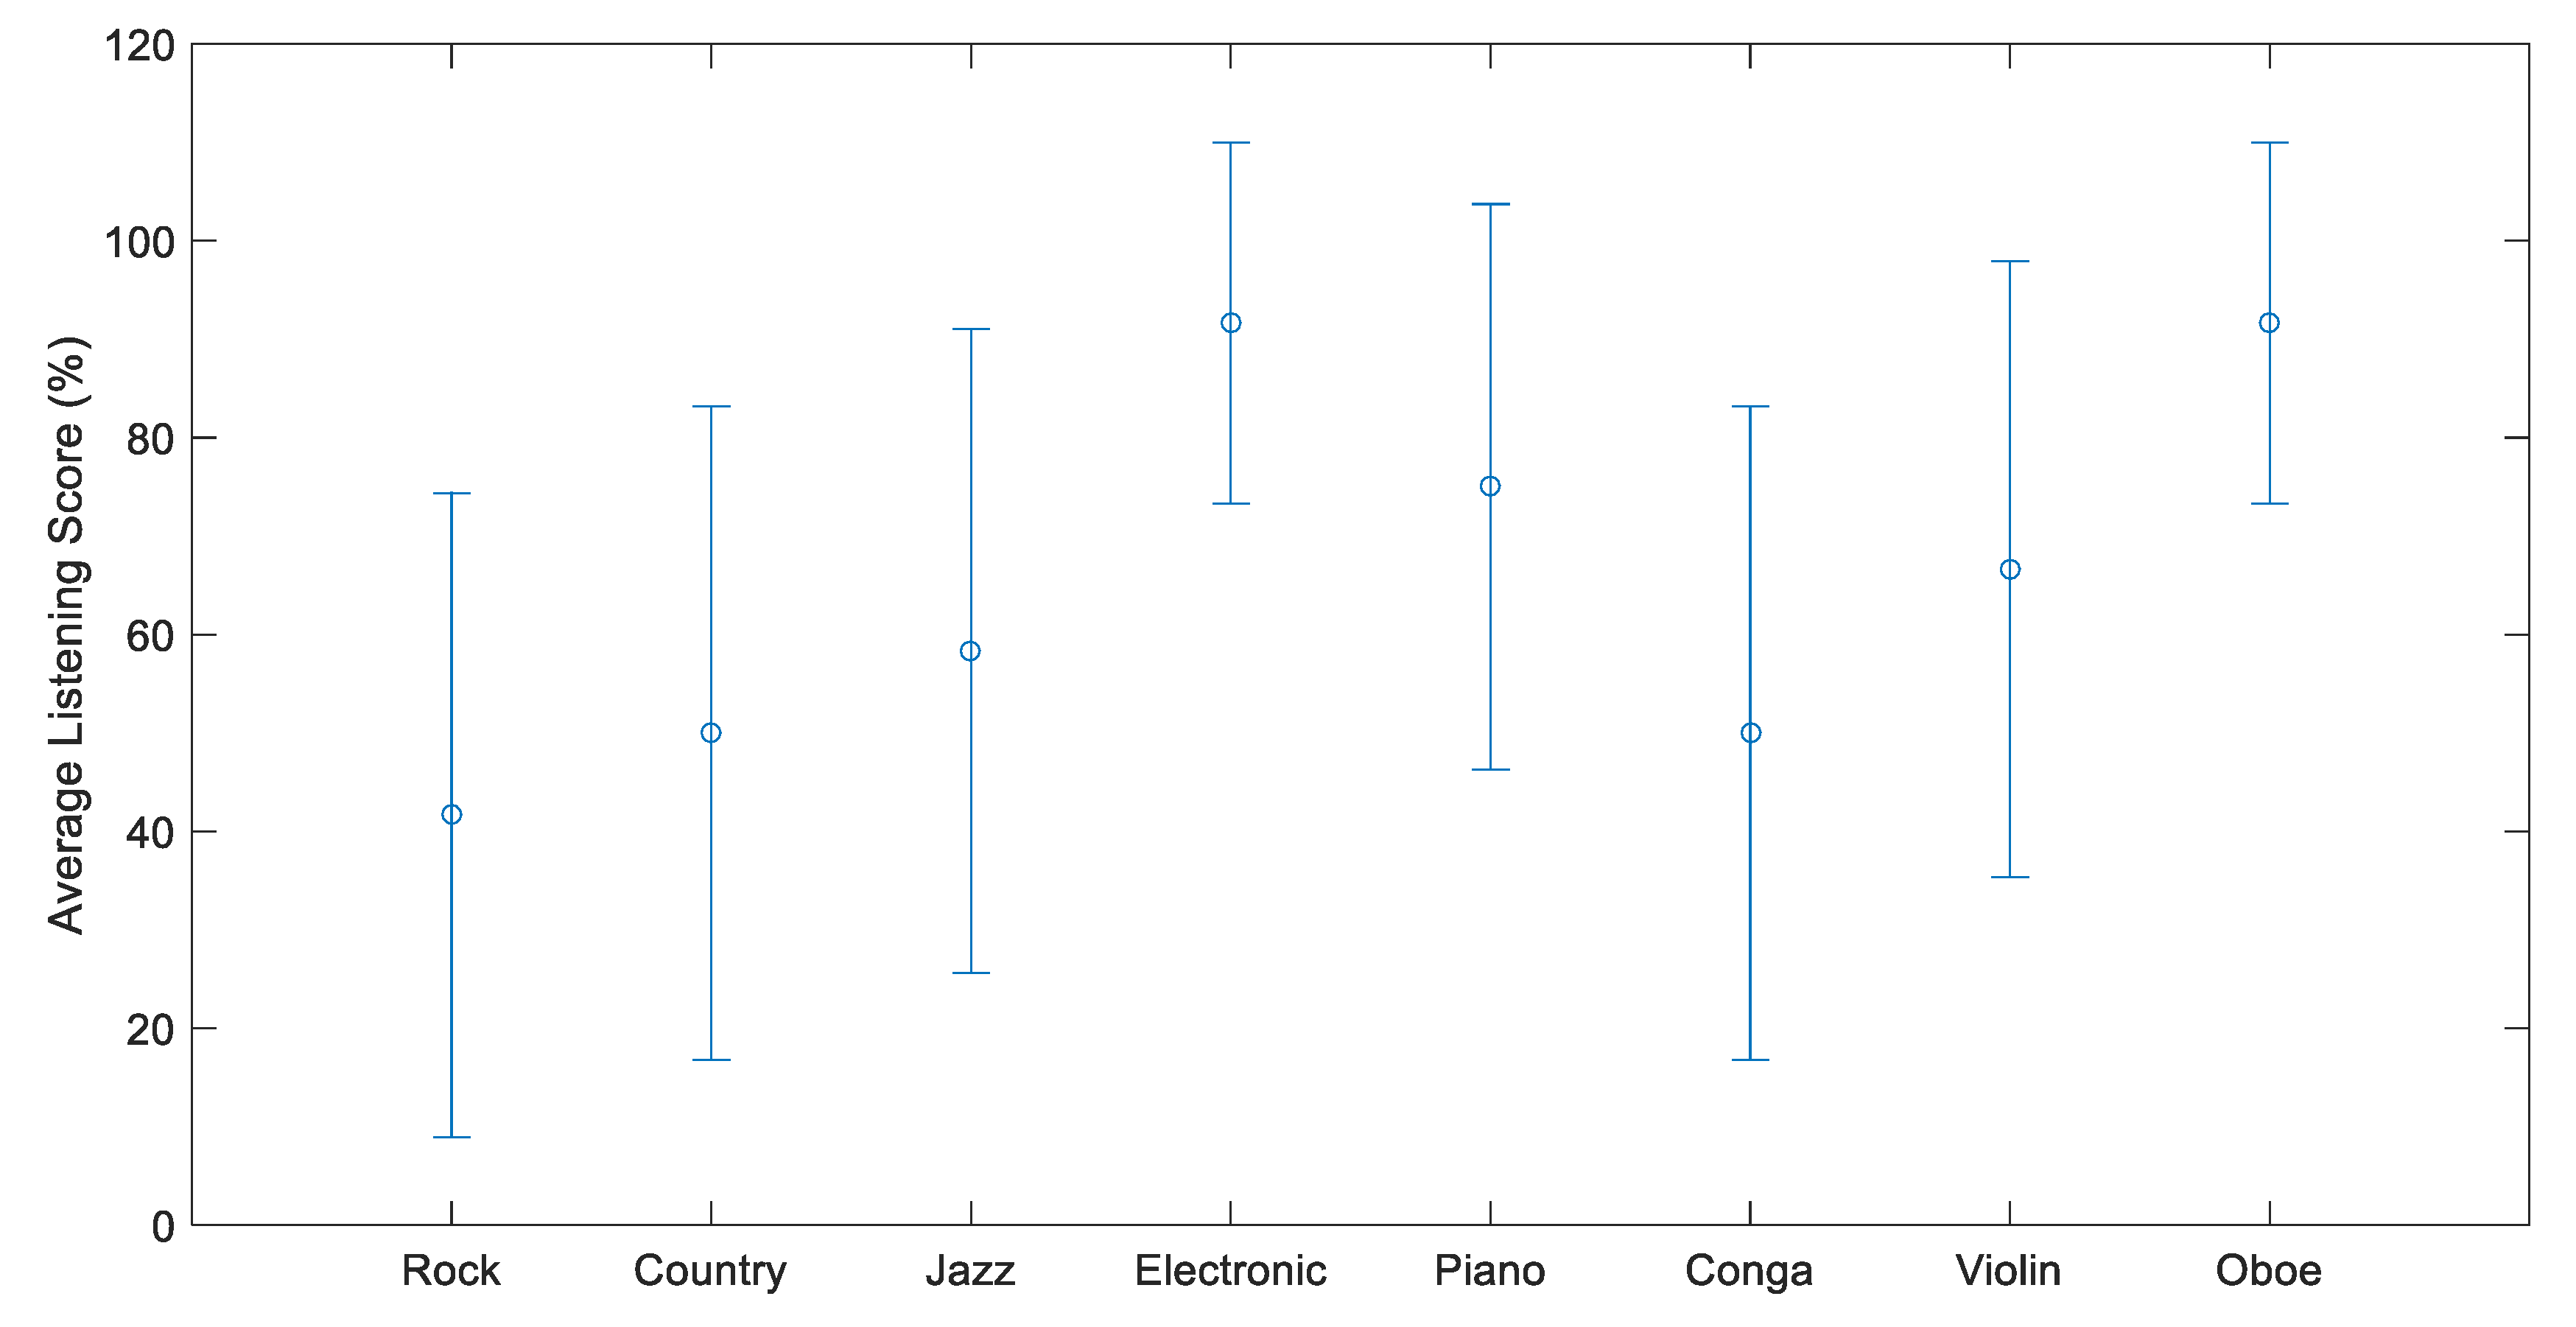
4.2. Subjective Listening Test

There were 12 participants in the subjective test. They sat on a chair with castors. Each participant wore an opaque eye mask. Initially, they were asked to sit at the center position and listen to the music. This is an ideal situation, as shown in Figure 5a. Then, the listener was moved to the left side, as in the situation shown in Figure 5b, whereas the angles of the loudspeakers were unchanged. This is the nonideal situation. If the proposed system is triggered, the angles of the loudspeakers are adjusted, as shown in Figure 5c. This is the modified situation. The participants were asked to listen in the ideal situation and then compare it with the nonideal situation and the modified situation. Only one situation was used in the subjective listening test to avoid listener fatigue and to shorten the time of close contact during the COVID-19 pandemic era.
After listening to the reference signal, the nonideal and modified situations were developed in random order. The participants were asked about their situation preference. They had to choose between two situations. The selected situation was given one point. The number of points indicates the number of participant choices. Like the objective listening test, there were four music genres: rock, country, jazz, and electronic music. The total number of points was summarized as the overall score in Table 3. The values show that the proposed system can improve the out-of-space listening position to some extent. The proposed system was not always effective. However, it was found that the proposed system significantly upgraded the listening experience when electronic music was played. This could be because electronic music contains many high-frequency components that might be shadowed by the chambers of loudspeakers. The power spectral density of each music piece is presented in Figure 12. The electronic music piece possesses stable sound energy above 10 kHz, whereas the other music pieces suffer decay. The experimental result can also be explained by the phenomenon that IID effects are frequency dependent and can be most easily represented by a head-shadow filter in the frequency domain. We consider the listening environment as presented in Figure 13. A first-order head-shadow transfer function for the right ear is presented in Equation (6) [25,26]:
H R ( ω ) = 1 + i α ω 2 ω 0 1 + i ω 2 ω 0
where
ω 0 = c r
c is the sound speed, r is the head radius, and α in Equation (6) controls the zero positions. To match the head-shadow responses, α depends on θ , the angle from the center front axis to the sound source:
α ( θ ) = 3 2 + 1 2 c o s ( 0.5 π θ 5 π 6 π ) .
To obtain the head-shadow transfer function for a left ear, θ has to be replaced by θ π . The magnitude frequency responses with θ changing from 0 to π 2 are shown in Figure 14, where we can find that the high-frequency magnitudes of the shadowed ear, the left ear in this example, are attenuated.
The experimental result in the first listening test indicates that the improvement of the listening experiment is subtle. The second listening test was therefore conducted to validate the upgradation of the audio system. Classical music was mainly used, and each music piece was played by a single instrumentalist. The participants were asked to sit to the left of the audio system. The initial state of the audio system could be like either Figure 5b or 5c, thus, in random order. The investigators continuously played the sample music and randomly switched between two states. The participants were asked to select the situation that could provide the more balanced sound pressure levels between ears. The more participants chose the situation in Figure 5c, the more effective the proposed system can be. Like the first listening test, the participants were asked to cover their eyes, so they did not see the state of the audio system. The listening scores estimated by the 12 participants are shown in Table 4. The proposed system provides enhanced listening experience except for conga drums. The possible reason could be that the percussion instrument has difficulty producing continues sound. When the switch happens during silences in music, listeners hardly discriminate the treated and untreated sounds.
The mean values and 95% confidence intervals of the listening scores are shown in Figure 15. Overall, 34.4% of all trials belonged to the nonideal situation without modification, and 65.6% believed the proposed modification. It was found that the mean scores are the highest in the electronic music and oboe solo. This supports the hypothesis that the proposed system avoids the shadowing effect at high frequencies. It was also found that the proposed system is an effective treatment for solo performance.

5. Conclusions

The COVID-19 pandemic has limited the opportunities for people to travel. They have transferred their budgets to upgrade their living spaces. Smart home upgrading is a case in point. The purpose of this study was to integrate an autonomous entertainment system into a smart home ecosystem. The proposed system can trace the head movement of a user and provide a dynamic listening area. To locate the listener, computer vision is used with a general camera and a single-board computer, Raspberry Pi 4. The Arduino UNO microcontroller directs the loudspeaker drivers by means of motors. In this article, the advantages and disadvantages of the different motors were described. In the literature, only a diminutive scenario of home automation with a monophonic audio system has been reported, and a listening test has not been described. In this study, the proposed idea was applied to a real 2.1 audio system, and listening tests supported the possibility of audio quality enhancement. Over a large number of trials, the probability that the proposed system is preferred is about equal to twice the probability of choosing the unmodified system.
The integration of head pose estimation and crosstalk cancellation is planned for future work. According to the orientation of the head, the binaural filters and robotic system can be dynamically modified, thereby providing a more accurate sound field reconstruction. The crosstalk cancellation system is expected to predict the crosstalk signals that happen when playing immersive audio with a pair of loudspeakers, and then to eliminate their effects, so listeners can perceive nearly perfect reconstruction audio.

Author Contributions

Conceptualization, S.-N.Y.; methodology, C.-W.H.; software, C.-W.H.; validation, S.-N.Y.; formal analysis, S.-N.Y.; investigation, S.-N.Y.; resources, C.-W.H.; data curation, S.-N.Y.; writing—original draft preparation, S.-N.Y.; writing—review and editing, S.-N.Y.; visualization, S.-N.Y. and C.-W.H.; supervision, S.-N.Y.; project administration, S.-N.Y.; funding acquisition, S.-N.Y. All authors have read and agreed to the published version of the manuscript.

Funding

This research was funded by the Ministry of Science and Technology (MOST), Taiwan, grant number 109-2221-E-305-011-MY2.

Institutional Review Board Statement

The study was reviewed and approved by the research ethics committee of National Taiwan University. The approval number is 201711EM016.

Acknowledgments

The authors would like to thank all the participants of this study. They volunteered to join the experiments and spent about 20 min to complete the listening tests.

Conflicts of Interest

The authors declare no conflict of interest.

References

  1. King, D.L.; Delfabbro, P.H.; Billieux, J.; Potenza, M.N. Problematic online gaming and the COVID-19 pandemic. J. Behav. Addict. 2020, 9, 184–186. [Google Scholar] [CrossRef] [PubMed]
  2. Seetharaman, P. Business models shifts: Impact of Covid-19. Int. J. Inf. Manag. 2020, 54, 1–4. [Google Scholar] [CrossRef] [PubMed]
  3. Razmjooy, N.; Ramezani, M.; Namadchian, A. A new LQR optimal control for a single-link flexible joint robot manipulator based on grey wolf optimizer. Majlesi J. Electr. Eng. 2016, 10, 53–60. [Google Scholar]
  4. Kona, S.; Butler, N.; Vijayasekar, R.; Adzimah, W.; Kim, J.-H. Design of an intelligent robotic audio system for smart home environment. In Proceedings of the Conference on Recent Advances in Robotics, Miami, FL, USA, 8–9 May 2014. [Google Scholar]
  5. Yao, S.-N. Headphone-based immersive audio for virtual reality headsets. IEEE Trans. Consum. Electron. 2017, 63, 300–308. [Google Scholar] [CrossRef]
  6. Yao, S.-N.; Chen, L.J. HRTF adjustments with audio quality assessments. Arch. Acoust. 2013, 38, 55–62. [Google Scholar] [CrossRef]
  7. Lu, J.; Qi, X. Pre-trained-based individualization model for real-time spatial audio rendering system. IEEE Access 2021, 9, 128722–128733. [Google Scholar] [CrossRef]
  8. Yao, S.-N. Driver filter design for software-implemented loudspeaker crossovers. Arch. Acoust. 2014, 39, 591–597. [Google Scholar]
  9. Razmjooy, N.; Ramezani, M. Analytical solution for optimal control by the second kind Chebyshev polynomials expansion. Iran. J. Sci. Technol. Trans. A: Sci. 2016, 41, 1017–1026. [Google Scholar] [CrossRef]
  10. Razmjooy, N.; Ramezani, M. Uncertain method for optimal control problems with uncertainties using Chebyshev inclusion functions. Asian J. Control. 2018, 21, 824–831. [Google Scholar] [CrossRef]
  11. Yao, S.N.; Collins, T.; Jančovič, P. Hybrid method for designing digital Butterworth filters. Comput. Electr. Eng. 2012, 38, 811–818. [Google Scholar] [CrossRef]
  12. Razmjooy, N.; Ramezani, M.; Nazari, E. Using LQG/LTR optimal control method for car suspension system. SCRO Res. Annu. Rep. 2015, 3, 1–8. [Google Scholar]
  13. Razmjooy, N.; Ramezani, M. Interval structure of Runge-Kutta methods for solving optimal control problems with uncertainties. Comput. Methods Differ. Equ. 2019, 7, 235–251. [Google Scholar]
  14. Kabzinski, T.; Jax, P. A causality-constrained frequency-domain least-squares filter design method for crosstalk cancellation. IEEE/ACM Trans. Audio Speech Lang. Process. 2021, 29, 2942–2956. [Google Scholar] [CrossRef]
  15. Hamdan, E.C.; Fazi, F.M. Weighted orthogonal vector rejection method for loudspeaker-based binaural audio reproduction. IEEE/ACM Trans. Audio Speech Lang. Process. 2021, 29, 1844–1852. [Google Scholar] [CrossRef]
  16. Mertins, A.; Maass, M.; Katzberg, F. Room impulse response reshaping and crosstalk cancellation using convex optimization. IEEE/ACM Trans. Audio Speech Lang. Process. 2021, 29, 489–502. [Google Scholar] [CrossRef]
  17. Rayleigh, L. On our perception of sound direction. Philosoph. Mag. 1907, 13, 214–232. [Google Scholar] [CrossRef] [Green Version]
  18. Cheng, C.I.; Wakefield, G.H. Introduction to head-related transfer functions (HRTFs): Representations of HRTFs in time, frequency, and space. J. Audio Eng. Soc. 2001, 49, 231–249. [Google Scholar]
  19. Popper, A.N.; Fay, R.R. Sound Source Localization; Springer: New York, NY, USA, 2005; Chapter 2.2; pp. 131–132. [Google Scholar]
  20. Gardner, B.; Martin, K. HRTF Measurements of a KEMAR Dummy-Head Microphone; MIT Media Lab: Cambridge, MA, USA, 1994. [Google Scholar]
  21. Algazi, V.R.; Duda, R.O.; Thompson, D.P.; Avendano, C. The CIPIC HRTF database. In Proceedings of the IEEE WASPAA01, New Paltz, NY, USA, 21–24 October 2001; pp. 99–102. [Google Scholar]
  22. IRCAM LISTEN HRTF Database. Available online: http://recherche.ircam.fr/equipes/salles/listen/ (accessed on 2 January 2022).
  23. ITU-R Rec. BS.1116. Methods for the Subjective Assessment of Small Impairments in Audio Systems including Multichannel Sound Systems; International Telecommunication Union Radiocommunication: Geneva, Switzerland, 1997. [Google Scholar]
  24. Thiede, T.; Treurniet, W.C.; Bitto, R.; Schmidmer, C.; Sporer, T.; Beerends, J.G.; Colomes, C. PEAQ-The ITU standard for objective measurement of perceived audio quality. J. Audio Eng. Society. 2000, 48, 3–29. [Google Scholar]
  25. Brown, C.P.; Duda, R.O. A structural model for binaural sound synthesis. IEEE Trans. Speech Audio Process. 1998, 6, 476–488. [Google Scholar] [CrossRef] [Green Version]
  26. Zolzer, U. DAFX Digital Audio Effects; John Wiley and Sons Publishing: West Sussex, UK, 2003; Chapter 6.3.4; 155p. [Google Scholar]
Figure 1. Sweet spot of the stereophonic system.
Electronics 11 00339 g001
Figure 2. Transmission pattern of (a) low-frequency and (b) high-frequency sound.
Electronics 11 00339 g002
Figure 3. Low-frequency sound propagation path: (a) The listener uses the ITD to estimate the location of a low-frequency sound source. (b) The listener’s right ear receives the signal first, and the timing difference is the cause of the phase difference between two channels.
Electronics 11 00339 g003
Figure 4. The maximum ITD: (a) The sound source is placed on the right-hand side. (b) The sound source is placed on the left-hand side.
Electronics 11 00339 g004
Figure 5. Listening positions: (a) ideal situation, (b) nonideal situation, and (c) modified situation.
Electronics 11 00339 g005
Figure 6. Screen divided into five sections to represent the coordinates by means of which the position of the listener head is detected.
Electronics 11 00339 g006
Figure 7. Prototype of autonomous 2.1 audio system.
Electronics 11 00339 g007
Figure 8. Using head-related impulse responses (HRIRs) to render (a) a monophonic system and (b) a stereophonic system.
Electronics 11 00339 g008
Figure 9. Effects on listening experience when the listener is (a) facing or (b) turning her or his back to the loudspeaker.
Electronics 11 00339 g009
Figure 10. Head-related transfer functions (HRTFs) from angles 0 ° and 180 ° .
Electronics 11 00339 g010
Figure 11. Loudspeakers track the head of the listener: (a) ideal situation and modified situation when the listener moves to the (b) immediate left and (c) left.
Electronics 11 00339 g011
Figure 12. Power spectral density of: (a) rock, (b) country, (c) jazz, and (d) electronic music.
Electronics 11 00339 g012
Figure 13. Geometry and spherical model with an angle θ of incidence for IID calculation.
Electronics 11 00339 g013
Figure 14. Frequency responses of the left ear and right ear taken from the simple head model presented in [25] when (a) θ = 0 , (b) θ = π 6 , (c) θ = π 3 , (d) θ = π 2 .
Electronics 11 00339 g014
Figure 15. System efficiency and effectiveness evaluated in terms of means and 95% confidence intervals of listening scores.
Electronics 11 00339 g015
Table 1. Advantages and disadvantages of motor types.
Motor TypeServo Motor SG90Stepper Motor 28BYJ-48
ActionQuickSlow
NoiseHighLow
Driver BoardNoneULN2003 Driver
Table 2. Objective listening scores.
Music GenresLeaning a Little to the LeftLeaning to the Left
Rock−1.618−3.555
Country−2.599−3.708
Jazz−2.590−3.69
Electronic−2.334−3.459
Table 3. Subjective listening scores of different music genres.
Music GenresNonideal SituationNonideal Situation with Modification
Rock75
Country66
Jazz57
Electronic111
Overall1929
Table 4. Subjective listening scores of different musical instruments.
Music InstrumentsNonideal SituationNonideal Situation with Modification
Piano39
Conga Drums66
Violin48
Oboe111
Overall1434
Publisher’s Note: MDPI stays neutral with regard to jurisdictional claims in published maps and institutional affiliations.

