You are currently viewing a new version of our website. To view the old version click .
Electronics
  • Article
  • Open Access

16 December 2022

Suspicious Actions Detection System Using Enhanced CNN and Surveillance Video

,
,
,
,
,
,
and
1
Department of Computer Science, Asan Memorial College of Arts and Science, Chennai 600100, India
2
Department of Computer Science and Engineering, Aarupadai Veedu Institute of Technology, Vinayaka Missions Research Foundation, Paiyanoor, Chennai 603104, India
3
Department of Artificial Intelligence and Data Science, Saveetha Engineering College, Chennai 602117, India
4
Department of Computer Science and Engineering, Saveetha School of Engineering, Saveetha Institute of Medical and Technical Sciences, Thandalam, Chennai 602117, India
This article belongs to the Section Computer Science & Engineering

Abstract

Suspicious pre- and post-activity detection in crowded places is essential as many suspicious activities may be carried out by culprits. Usually, there will be installations of surveillance cameras. These surveillance cameras capture videos or images later investigated by authorities and post-event such suspicious activity would be detected. This leads to high human intervention to detect suspicious activity. However, there are no systems available to protect valuable things from such suspicious incidents. Nowadays machine learning (ML)- and deep learning (DL)-based pre-incident warning alarm systems could be adapted to monitor suspicious activity. Suspicious activity prediction would be based on human gestures and unusual activity detection. Even though some methods based on ML or DL have been proposed, the need for a highly accurate, highly precise, low-false-positive and low-false-negative prediction system can be enhanced by hybrid or enhanced ML- or DL-based systems. This proposed research work has introduced an enhanced convolutional neural network (ECNN)-based suspicious activity detection system. The experiment was carried out and the results were claimed. The results are analyzed with the Statistical Package for the Social Sciences (SPSS) tool. The results showed that the mean accuracy, mean precision, mean false-positive rate, and mean false-negative rate of suspicious activity detections were 97.050%, 96.743%, 2.957%, and 2.927% respectively. This result was also compared with the convolutional neural network (CNN) algorithm. This research work can be applied to enhance the pre-suspicious activity alert security system to avoid risky situations.

1. Introduction

Suspicious-events or human-beings’-behavior detection is part of a video or image surveillance system and this will have potential and added advantage for surveillance and forensic identification systems. In addition, it helps the manual power investigation time in the detection of criminal activity incidents and makes it an automated one [1]. Systems have been introduced for pickpocket event detection as proactive incident detection to reduce the cost of security claims. This has been experimented with from a shopping mall dataset with steps like tracking pedestrians, computation of features, and recognition of pickpockets. In today’s world pre-suspicious and pre-criminal activity has to be identified as the impact of such incidents leads to damage of assets and threat to the safety of humans [2]. In this work, the authors required the detection of proactive incidents to decrease the cost of security incidents. A method was imposed to carry out pickpocket behavior identification with track-based features for a crowded shopping mall. A dataset of more than 20 pickpocket incident cases was validated with an experiment by using a top-down approach for transferring features-based knowledge into rules. The results were gathered with the help of the false alarm rate. This concept is applied in many research-based applications related to suspicious-activity detection, pickpocket detection, chain-snatch-event detection, and other social-security detection including criminal-activity detection. Work was carried out to deploy a mechanism using deep learning for real-time suspicious activities like assaults, snatching of chains, and burglaries on video surveillance datasets [3]. This would be applied in real-world suspicious activity detection. Work was carried out with a multi-camera dataset to recognize the activities of humans from a dataset with labeled behavior. Three methods are used for suspicious-human-activity detection: human detection by background subtraction, feature extraction by CNN, and activity detection by discriminative deep belief network (DDBN) [4].
Nearly 50 research papers were published in various journals and conferences on the concept of suspicious-activity detection in video surveillance systems for different applications. Research work was discussed on the detection of handguns in luggage bags [5]. This work identified a solution for detecting gun-based crimes with surveillance footage by frame-by-frame checking. In this work, a deep neural network (DNN) model was introduced. Some authors described a suspicious-activity detection system for video surveillance using the CNN algorithm [6]. This work discussed a better solution than a manual closed-circuit television (CCTV) camera accident-monitoring system. A fully automated system for human-suspicious-action monitoring was developed with the ML technique. An experiment was carried out with normal and abnormal activity. The best finding of this work is that of work for a suspicious-activity detection network using ML for video surveillance [7]. A neural network (NN) based image and computer vision solution was introduced to penetrate video or image-based human suspicious activity. This work provides a solution to monitoring suspicious activities in airports, banks, shopping malls, schools, etc. Suspicious monitoring of human activities is essential since there may be damage to things and assaults on human beings. Works related to suspicious activities are discussed in references [3,5,6].
Even though there is a considerable quantity of suspicious-activity detections in different fields throughout the world, still there is a lacuna. Since no sophisticated solution with automation of suspicious-activity detection is available, there is a need to introduce efficient suspicious-activity detection with automation systems in video surveillance. A considerable number of works by the authors have been carried out with DL and ML algorithms. The core objective of this work is to introduce an enhanced-CNN-based suspicious-human-activity detection technique and compare its performance measures, such as mean accuracy, mean precision, mean false-positive rate, and mean-false-negative rate, with existing machine learning (ML) and deep learning (DL) algorithms to warrant the novelty of the proposed approach.
The research work has identified novel suspicious-action detection from the video surveillance dataset. In this work, the ECNN algorithm has been coined to support suspicious-action detection with a surveillance video dataset. The ECNN is an improved CNN algorithm and the LeakyReLU layer has been inserted to predict suspicious action effectively. The experiment was conducted with the ECNN algorithm for a considerable count of time and performances were noted. Later analysis has been set with the SPSS tool and graph builder alongside independent t-sample tests with their parameters inferred. The performance measures such as accuracy, precision, false positive, and false negative have been noted.
The outline of this work is as follows. Section 2 is a survey of various methods and techniques used for suspicious-action detection. Section 3 discusses the developed proposed method, its working mechanism, and performance-parameter evaluation with the SPSS analysis tool. Further results of this work are discussed in Section 4. The discussion explains and compares with existing work under Section 5. Finally, the conclusion is given in Section 6 with future work.

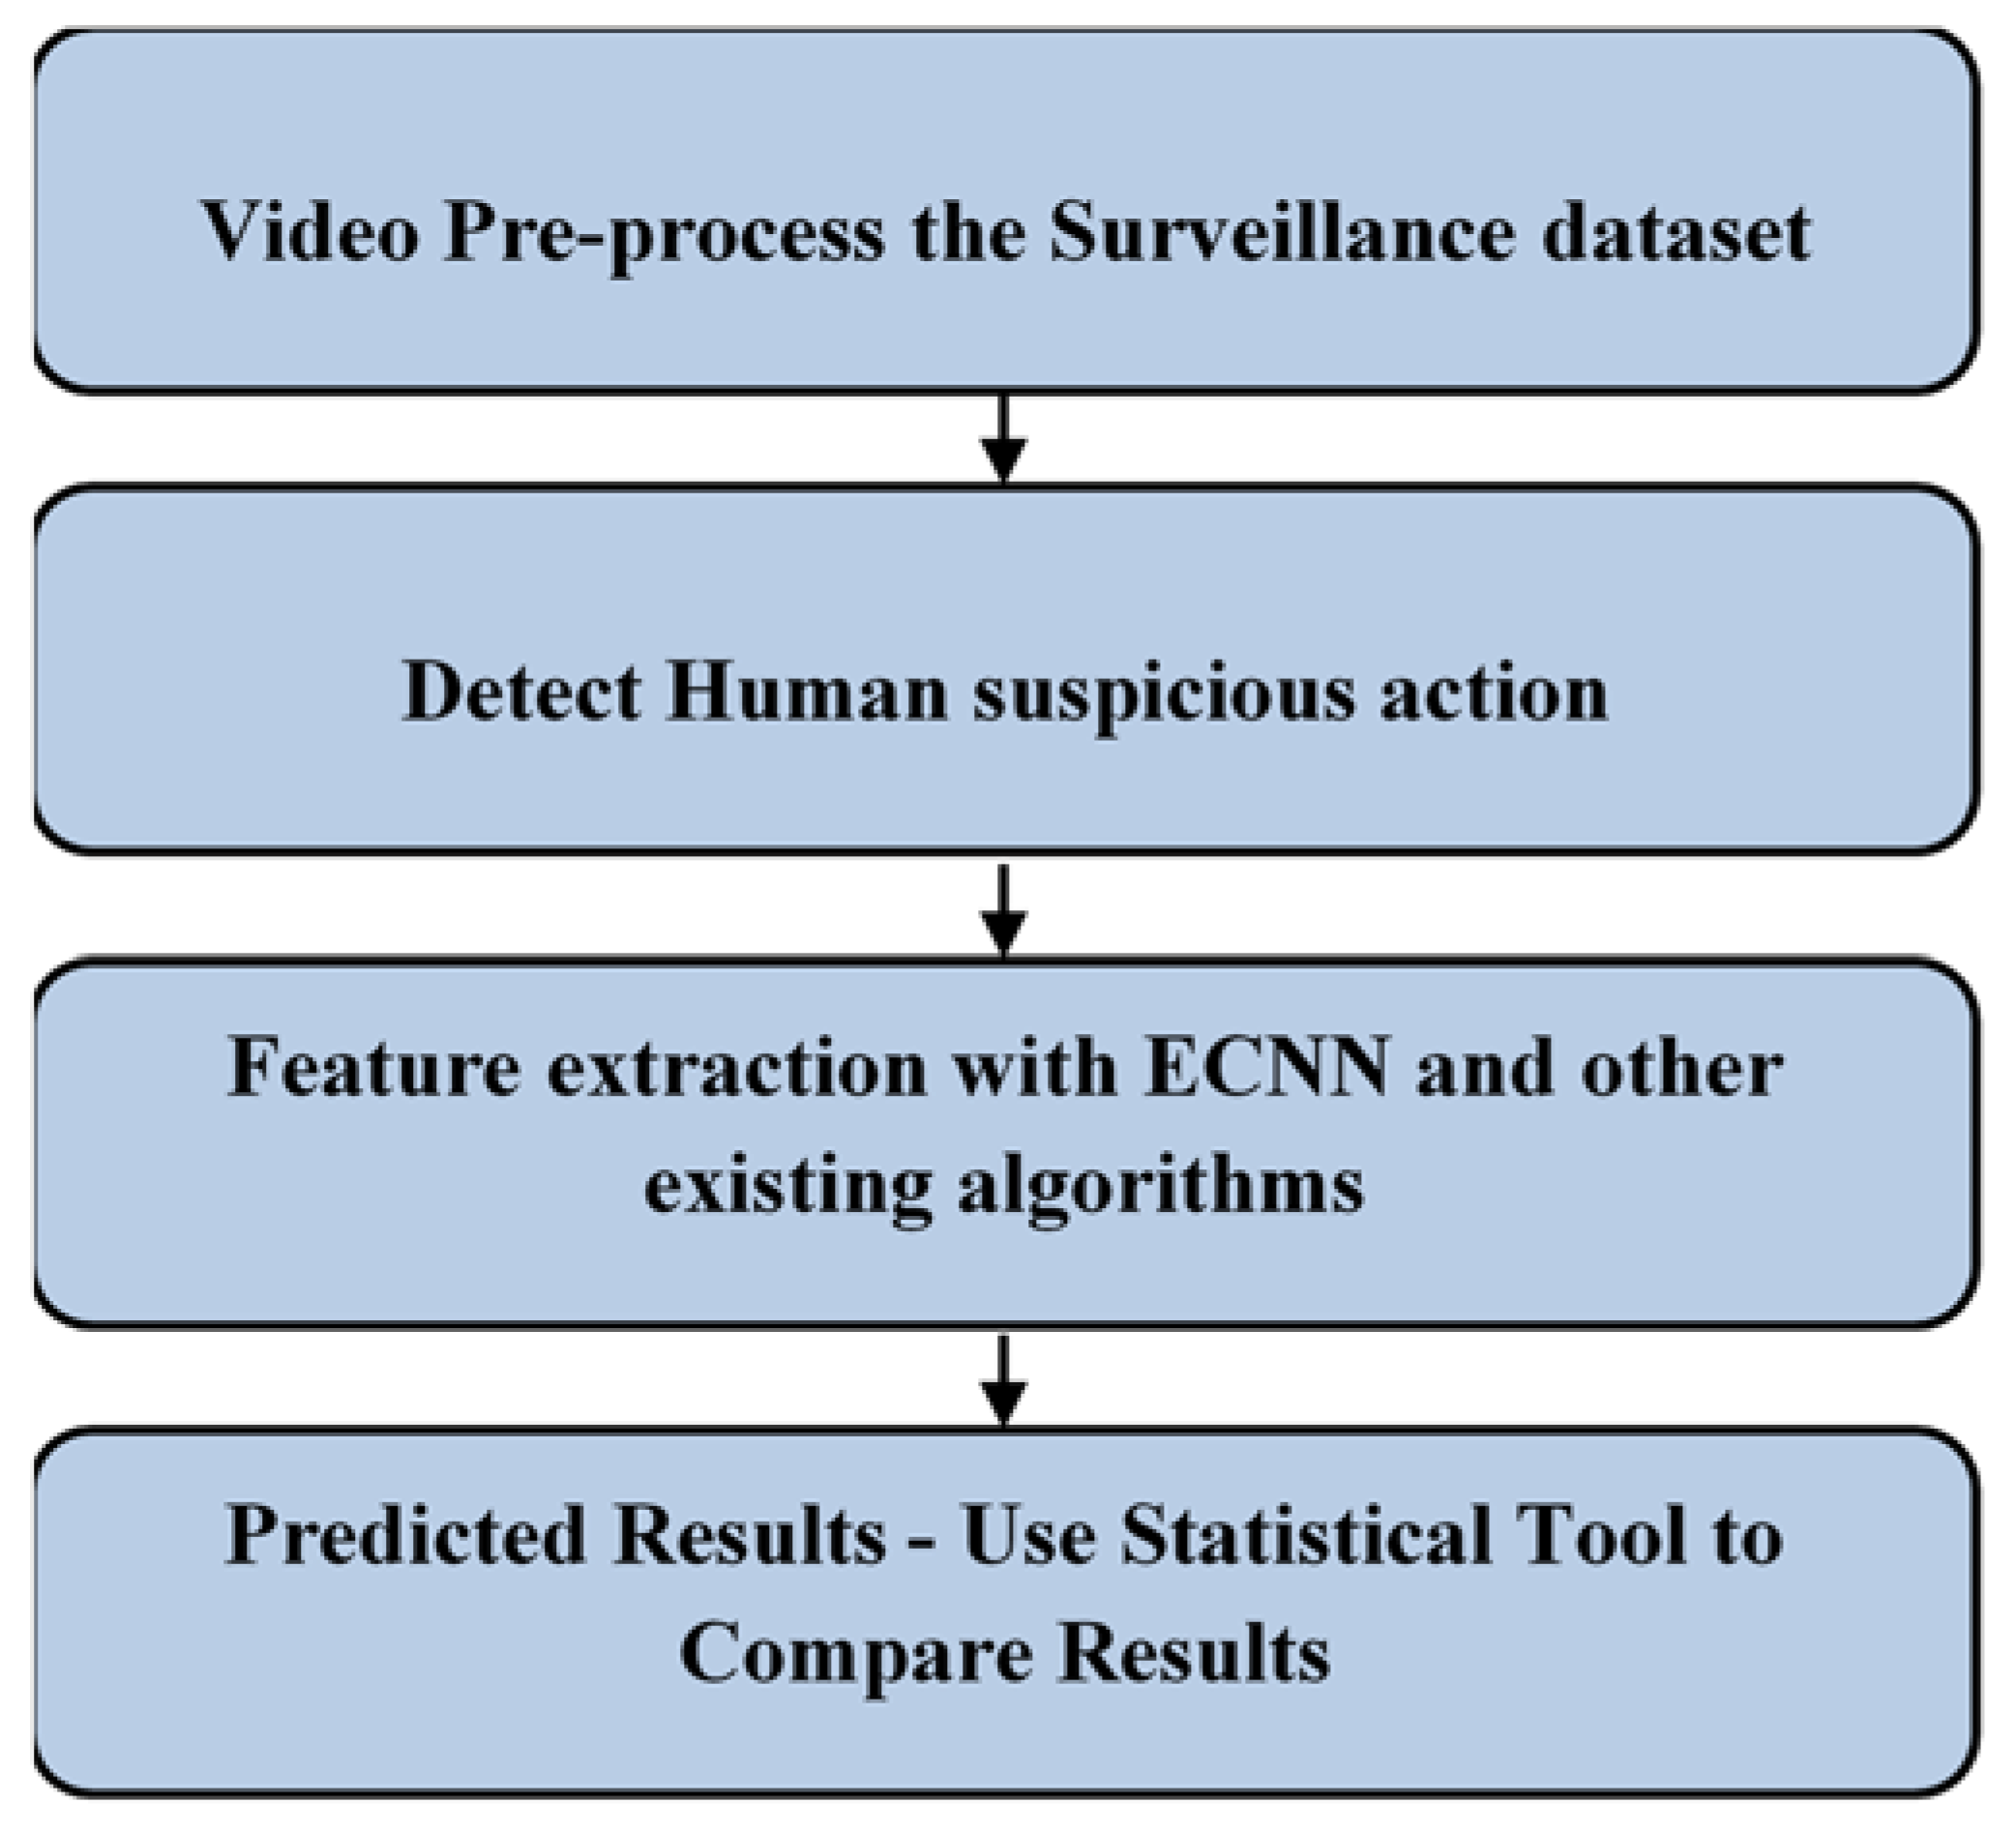
3. Materials and Methods

This work was carried out at the Aarupadai Veedu Institute of Technology, India. The CNN algorithm has been taken along with proposed ECNN methods for suspicious activity detection.
The CNN layers:
In this work, it is decided to introduce the ECNN algorithm which is a modification of the CNN algorithm. In general, CNN has an input layer, convolution layer, pooling layer, hidden layer, and output layer. The input layer will be pre-processed input as required. The convolution layer will extract the feature vector value. The pooling layer will maximize, minimize or average the vector value extracted from the convolution layer. Hidden layers will be added as required for specific applications additionally. Finally, the output layer will be introduced to produce output. The ECNN is modified and explained in a further section.

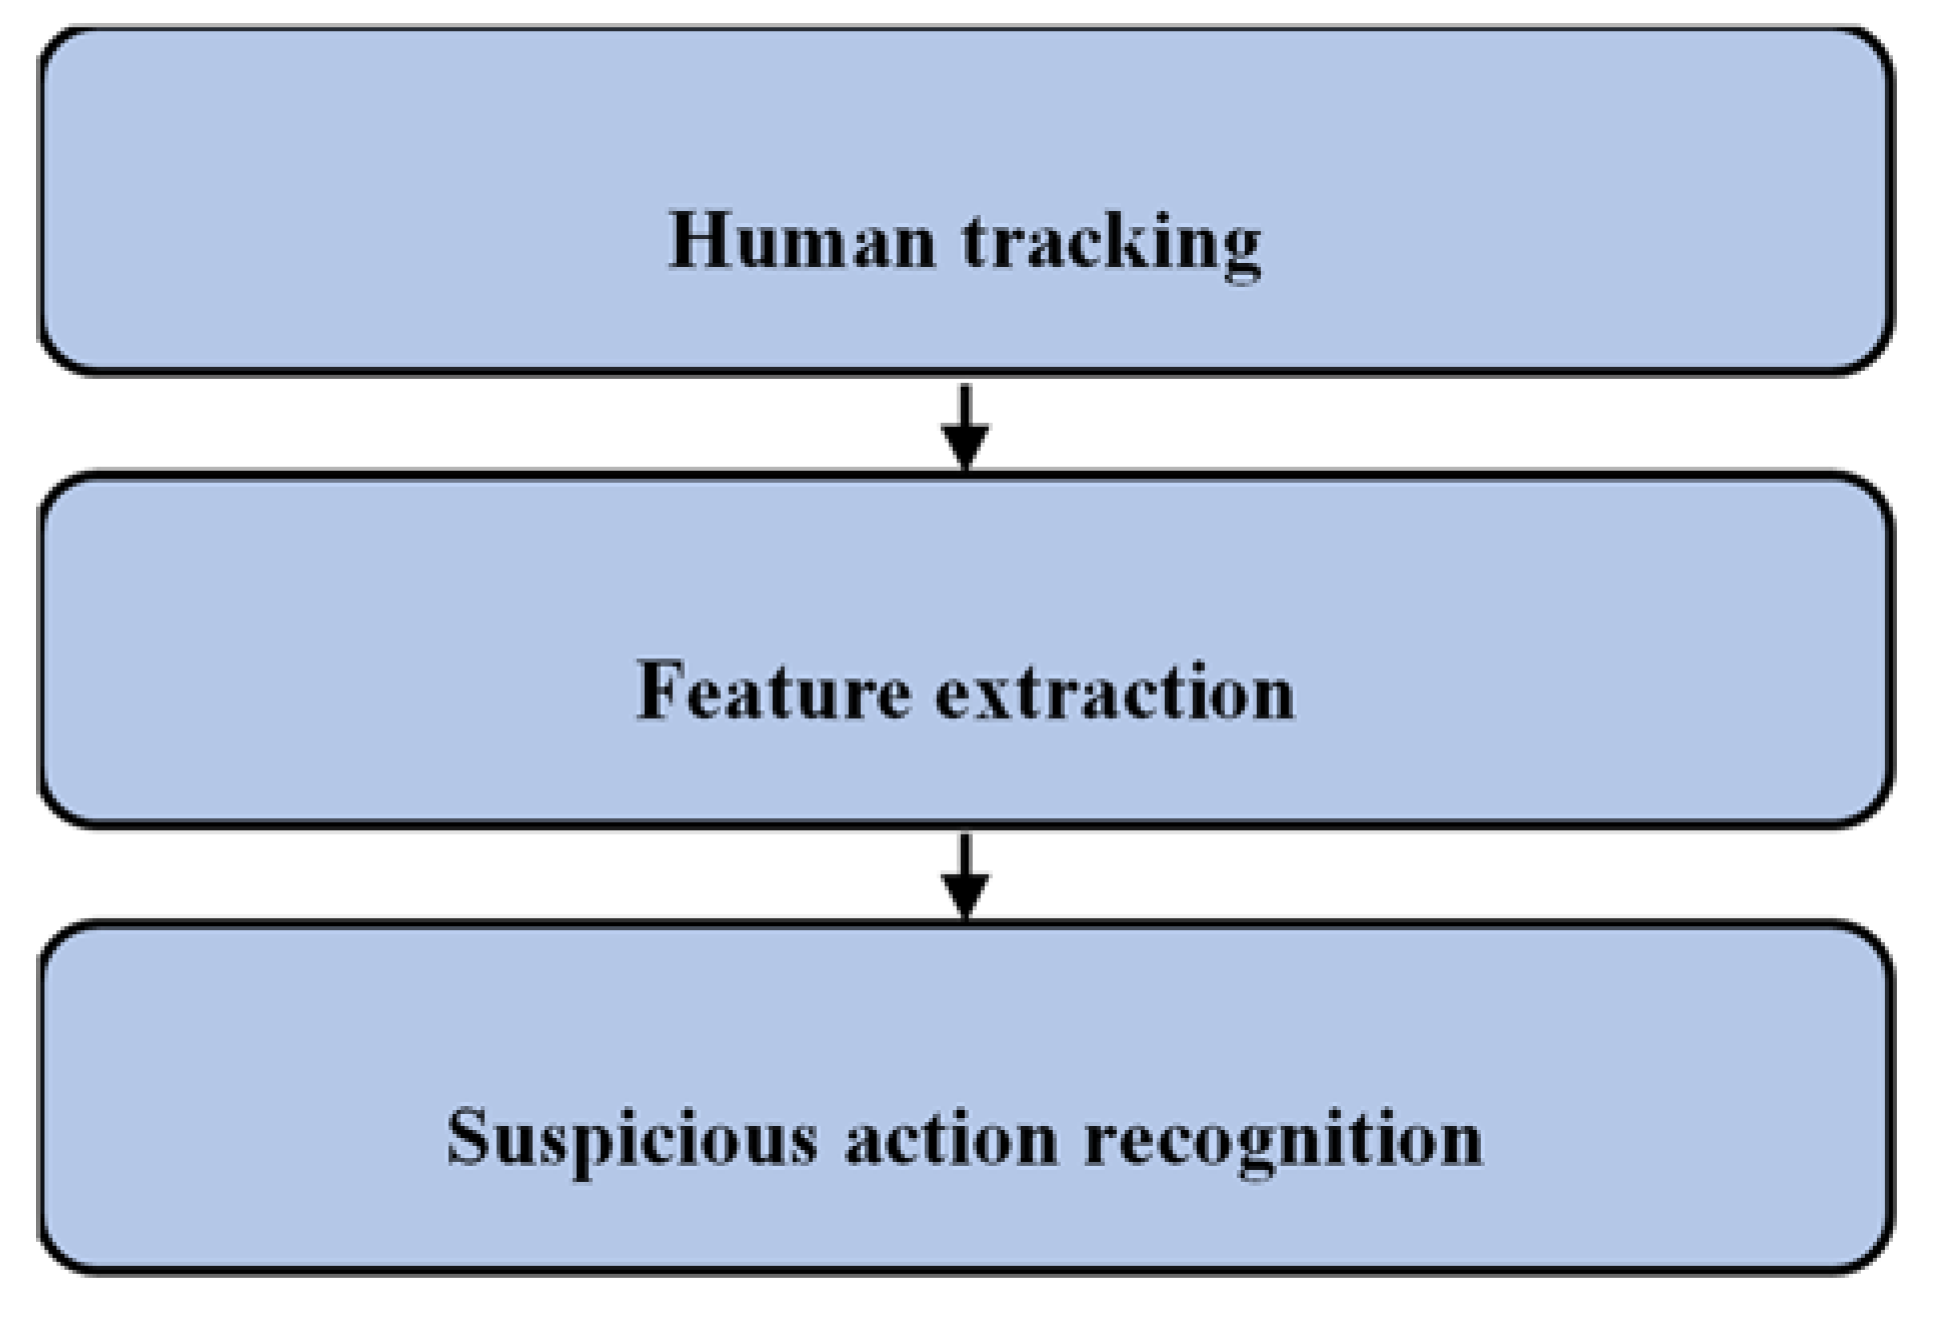
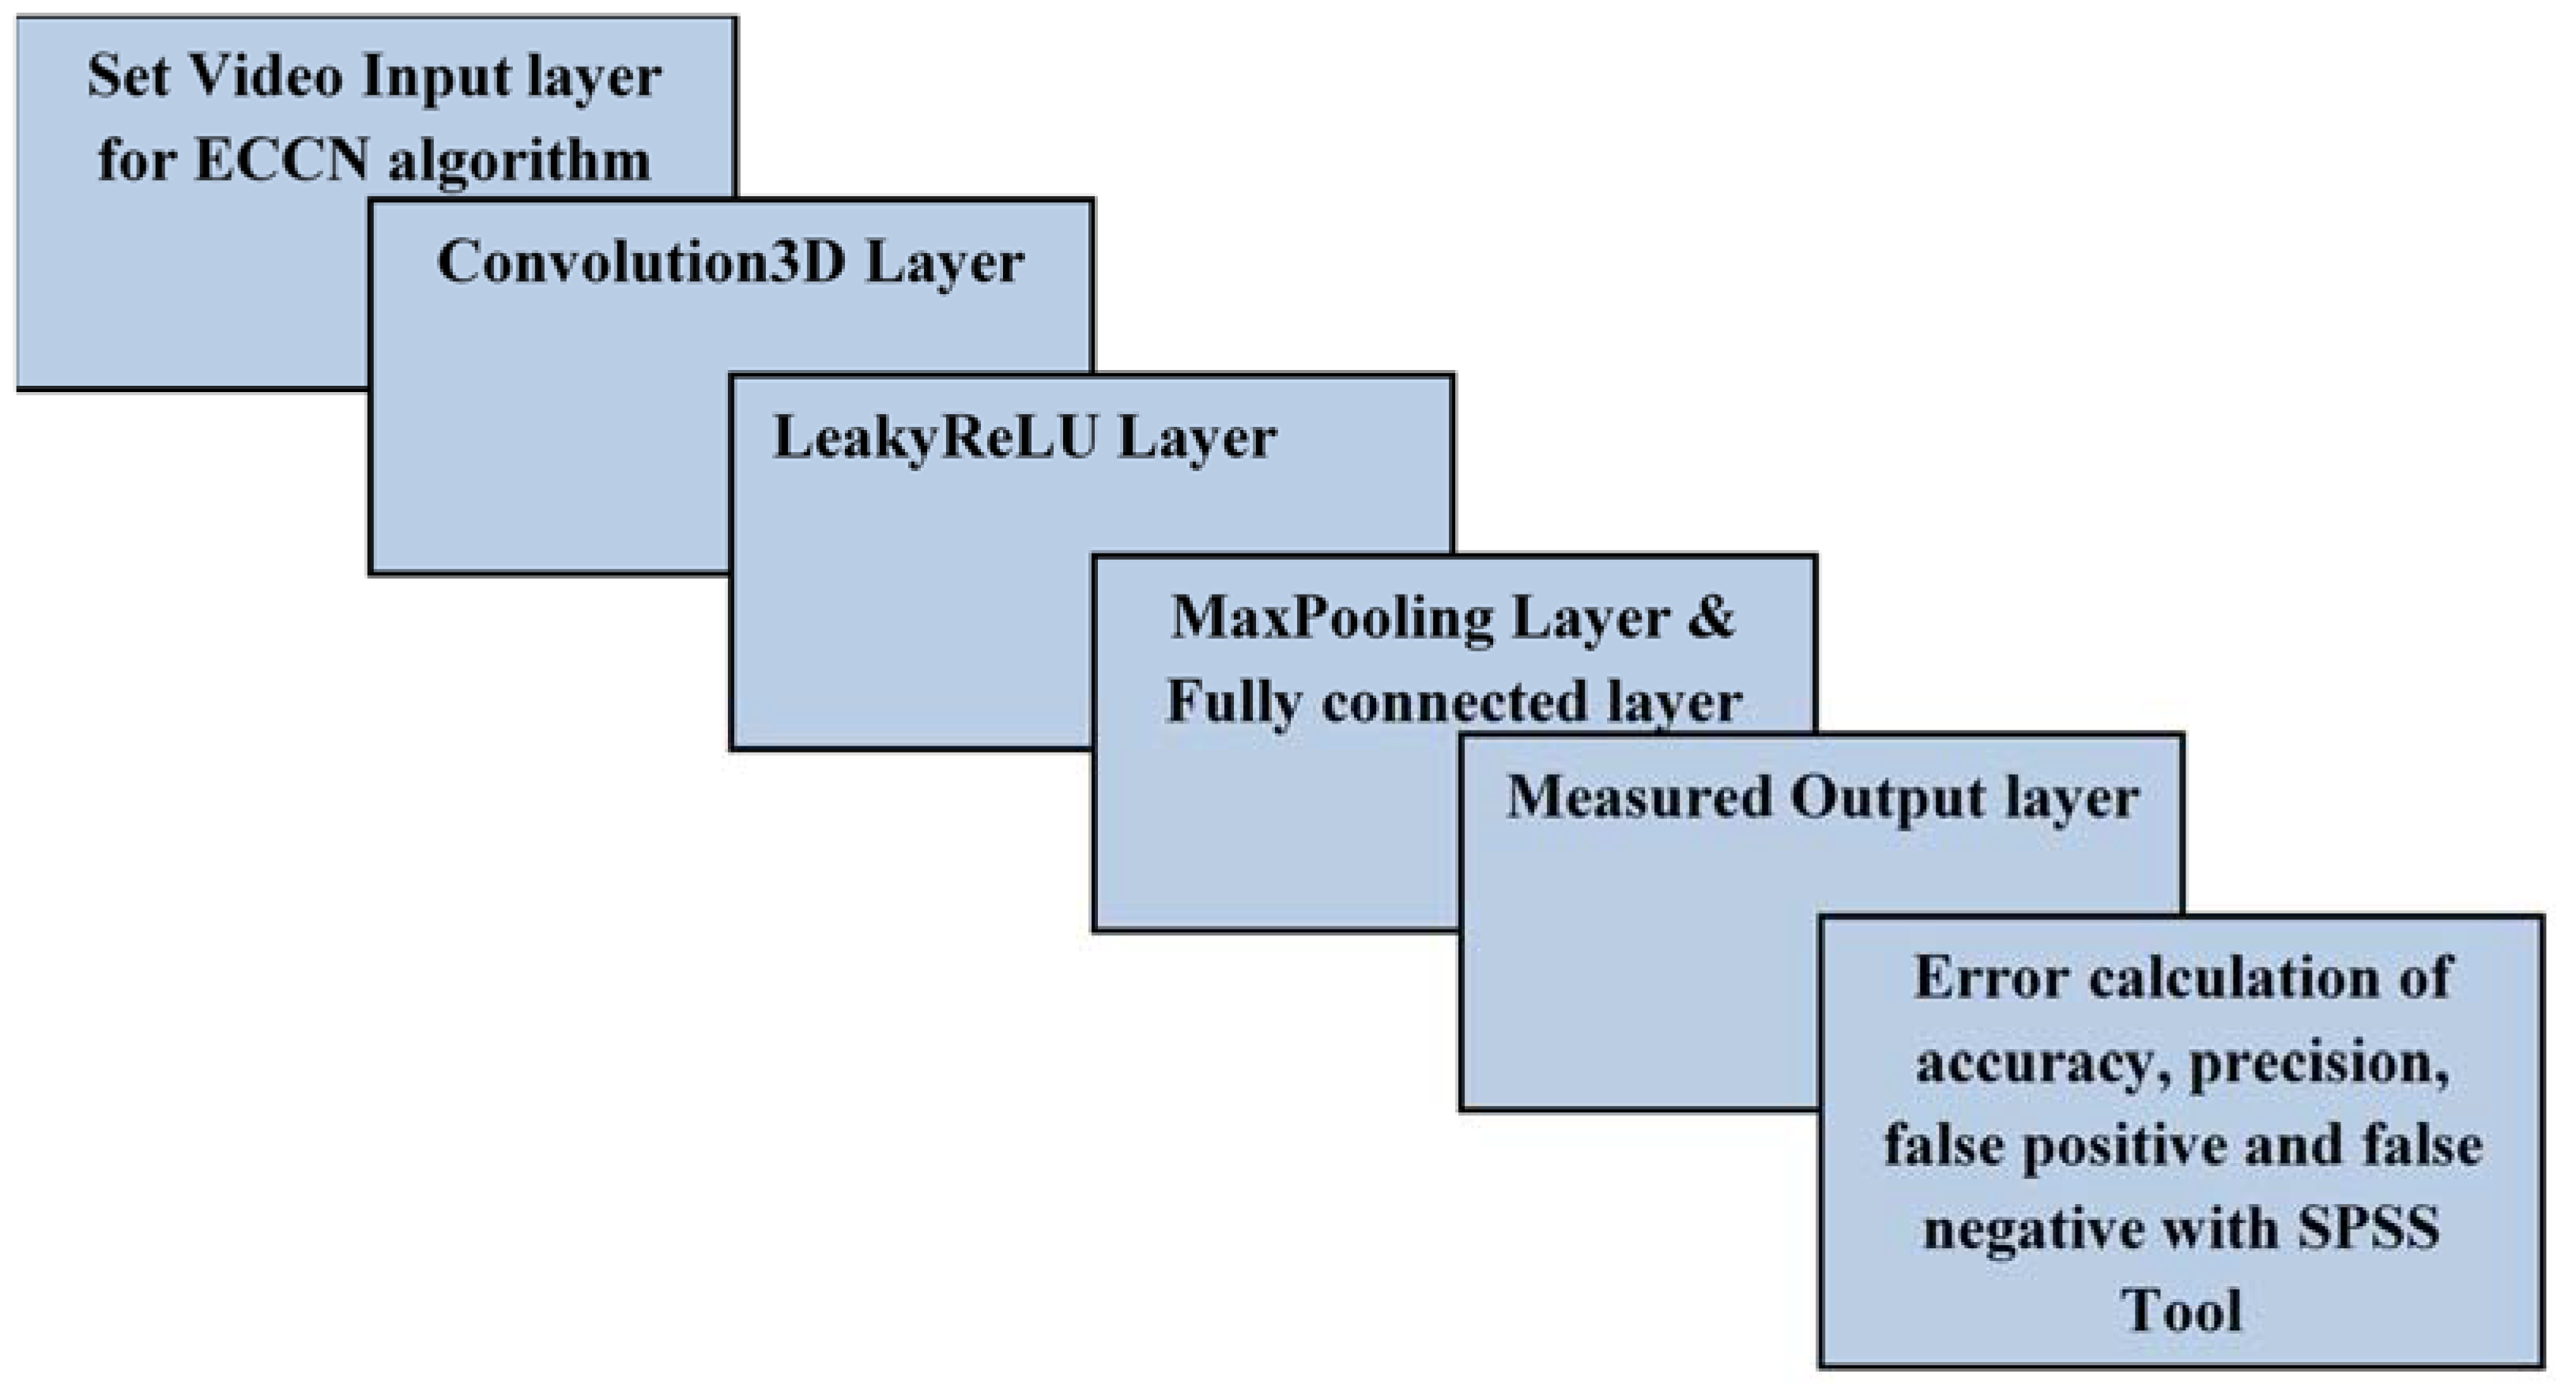
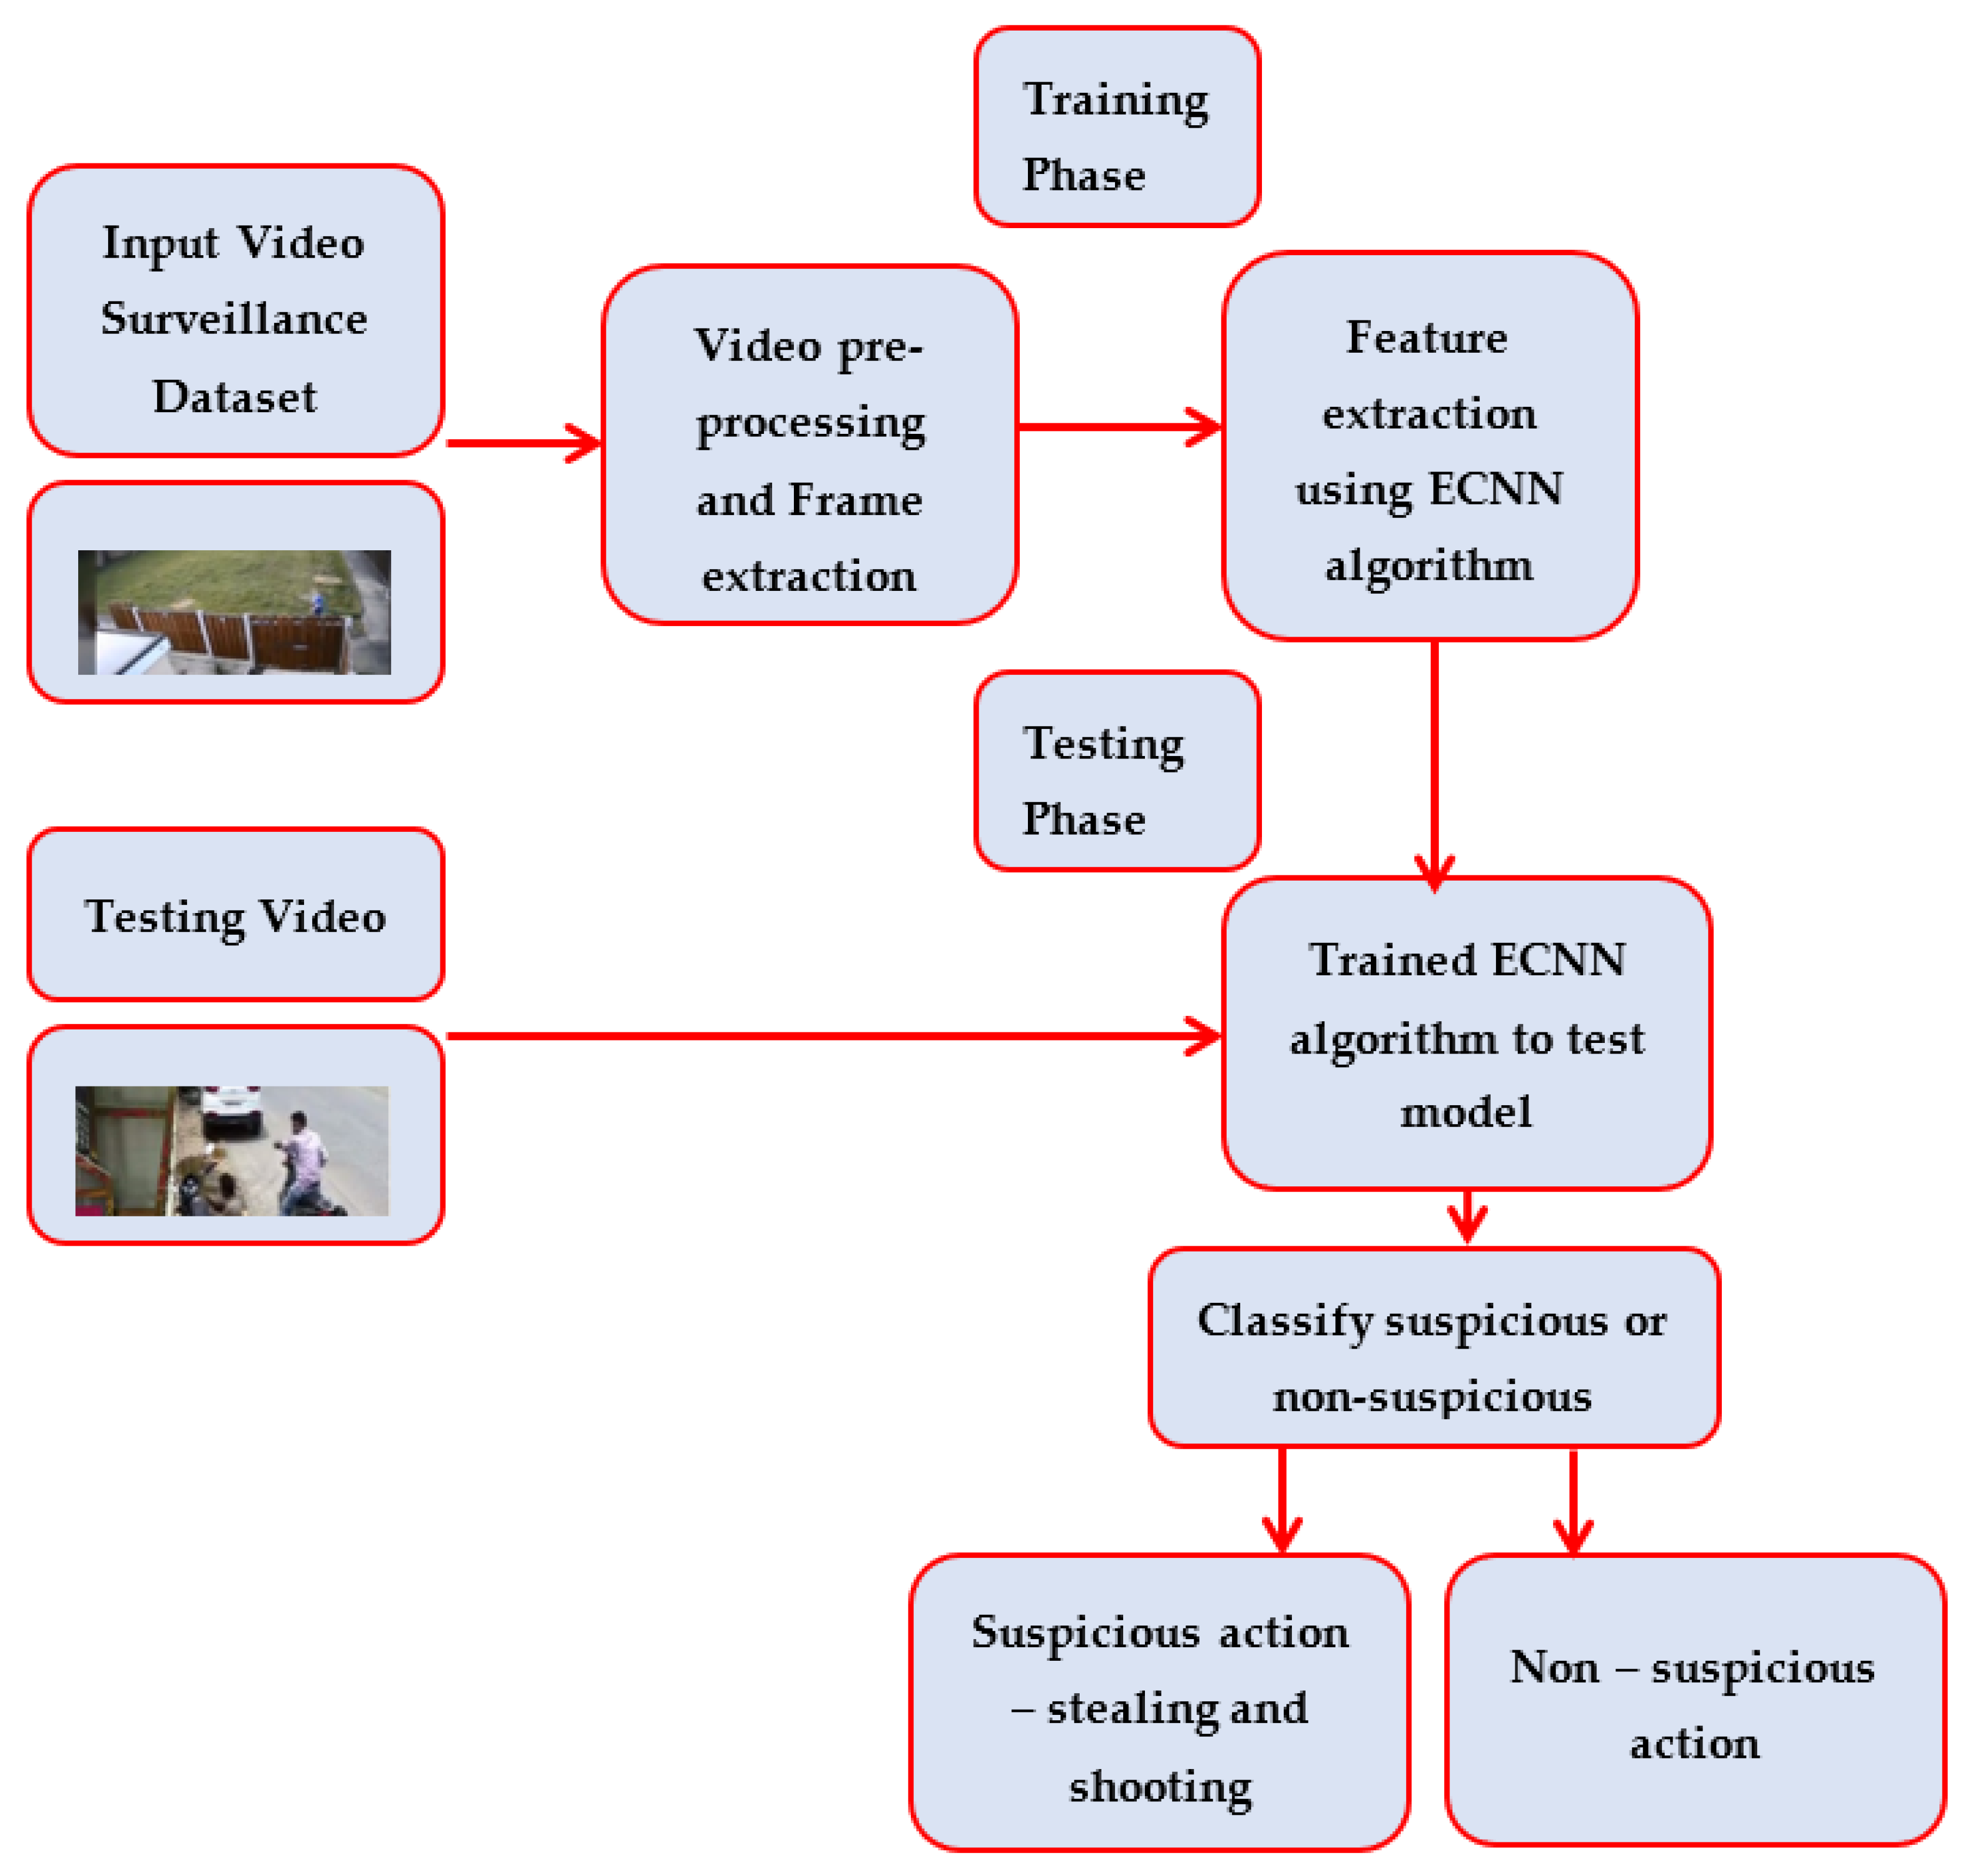
3.1. Proposed Algorithm: ECNN

Detection steps:
The detection steps using the ECNN algorithm are a mechanism of serial functions starting from video pre-process and ending with predicted results. Figure 2 shows the mechanism to detect suspicious actions such as shooting-and-stealing human actions with a trained video dataset as indicated in step 1. Based on the dataset from the pre-processor, suspicious action can be assessed and detected as illustrated in step 2. Further, feature extraction is carried out with the proposed ECNN model and it predicts the results, i.e., suspicious action if any. Finally, the observed results are compared with the statistical tool.
Figure 2. Suspicious-action (shooting-and-stealing) detection steps.
Figure 2 shows the general steps of suspicious-action detection by accepting input as video and output as a normal or suspicious action. Initially, surveillance video is framed continuously and stored in pre-processing initial steps. This initial step will be performed with the video capture read module in OpenCV. Further, this result is converted into a grayscale image with the cvtcolour module. Noise removal was achieved with the GaussianBlur module. Then, as per feature extraction with a max-pooling module of ECNN, the suspect action will be determined by setting the threshold value as per ReLU function. Finally, ECNN determines the suspicious action accurately, precisely alongside false positives and false negatives. This final step is repeated for N iterations and these iterated results are analyzed with SPSS for statistical report generation.
Figure 3 shows the actual steps of the proposed ECNN method. Here the layers of ECNN have an input layer that can set video input followed by conversion of grayscale images. Further, this grayscale image is fed to the convolution3D layer to extract features. Additionally, the inserted LeakyReLU layer sets the threshold to decide suspect or normal action. This image will be reduced to a small size with max-pooling layer functionality. Finally, the accuracy, precision, false positive, and false negative are measured at the output layer of ECNN followed by SPSS statistical analysis.
Figure 3. ECNN algorithm’s layered working mechanism with video data input and output.
Pre-processing of input image: Initially, trained dataset video would be undergone for frame extraction and followed by frame pre-processing. As the first step of frame extraction, the video was captured with a video capture read. This read was stored and checked for the next frame with Boolean set to either 0 or 1 to check the next frame accordingly. Still, the Boolean value was set to 0, and frames were stored sequentially. Further, the frame pre-processing had been initiated. Here it has converted the image to a grayscale image with a module named cv.2.cvtColor(). The result of this image is stored as a grayscale image. There would be noise, which could be removed with the Gaussian blur technique. This was done with the cv.GaussianBlur() method. Here the width and height of the kernel have to be set. Also, the standard deviation in the axis of X and Y would be set, which were X, Y, SigmaX, and SigmaY. The Gaussian blur was effective here when setting 0 as the value after calculating kernel size. This Gaussian blur was effective in removing frame-imaged noise. The cv.getGaussianKernel() module was also used. This would be represented as Equation (1) as follows.
fimg   =   cv 2 . imread ( framed   image )
where fimg is framed image captured from a video dataset. In a general blur, a function is utilized to convert the original image into a blur for smoothening and it is represented as Equation (2).
blurImg   =   cv 2 . blur ( fimg , ( 10 , 10 ) )
where blurring is a blurred image. Then actual Gaussian Blur can be applied with Equation (3).
gausBlur   =   cv 2 . GaussianBlur ( blurimg ,   ( 5 , 5 ) , 0 )
where blurring is the source image from framed image converted, (5,5) is the size of the kernel, and 0 is the value of sigmaX set to 0.
Feature extraction with ECNN:
The working mechanism of the proposed ECNN algorithm is described in Figure 3. This mechanism generates a video dataset from a database, i.e., the input layer, and reads images of frames once pre-processed video is ready. The Convolution3D layer is a layer that takes the ‘l’ feature map as input and the ‘k’ feature map as output with filter size n x m. With the help of this working procedure, it calculates bias for the feature map with the total number of parameters and it is expressed as Equation (4).
  ( n m l + 1 ) k
The Leaky Rectified Linear Unit (leakyReLU) layer is enhanced for CNN, and it is an activation function. Usually, it measures the slat slope in the activation function during a negative value with a small slope. The MaxPooling layer is used to reduce image size dimension. The number input weight is ‘p’ and the number output weight is ‘q’; then the bias for each output is expressed as in Equation (5).
( p + 1 ) q
Finally, the output layer becomes a fully connected layer based on Equation (5).

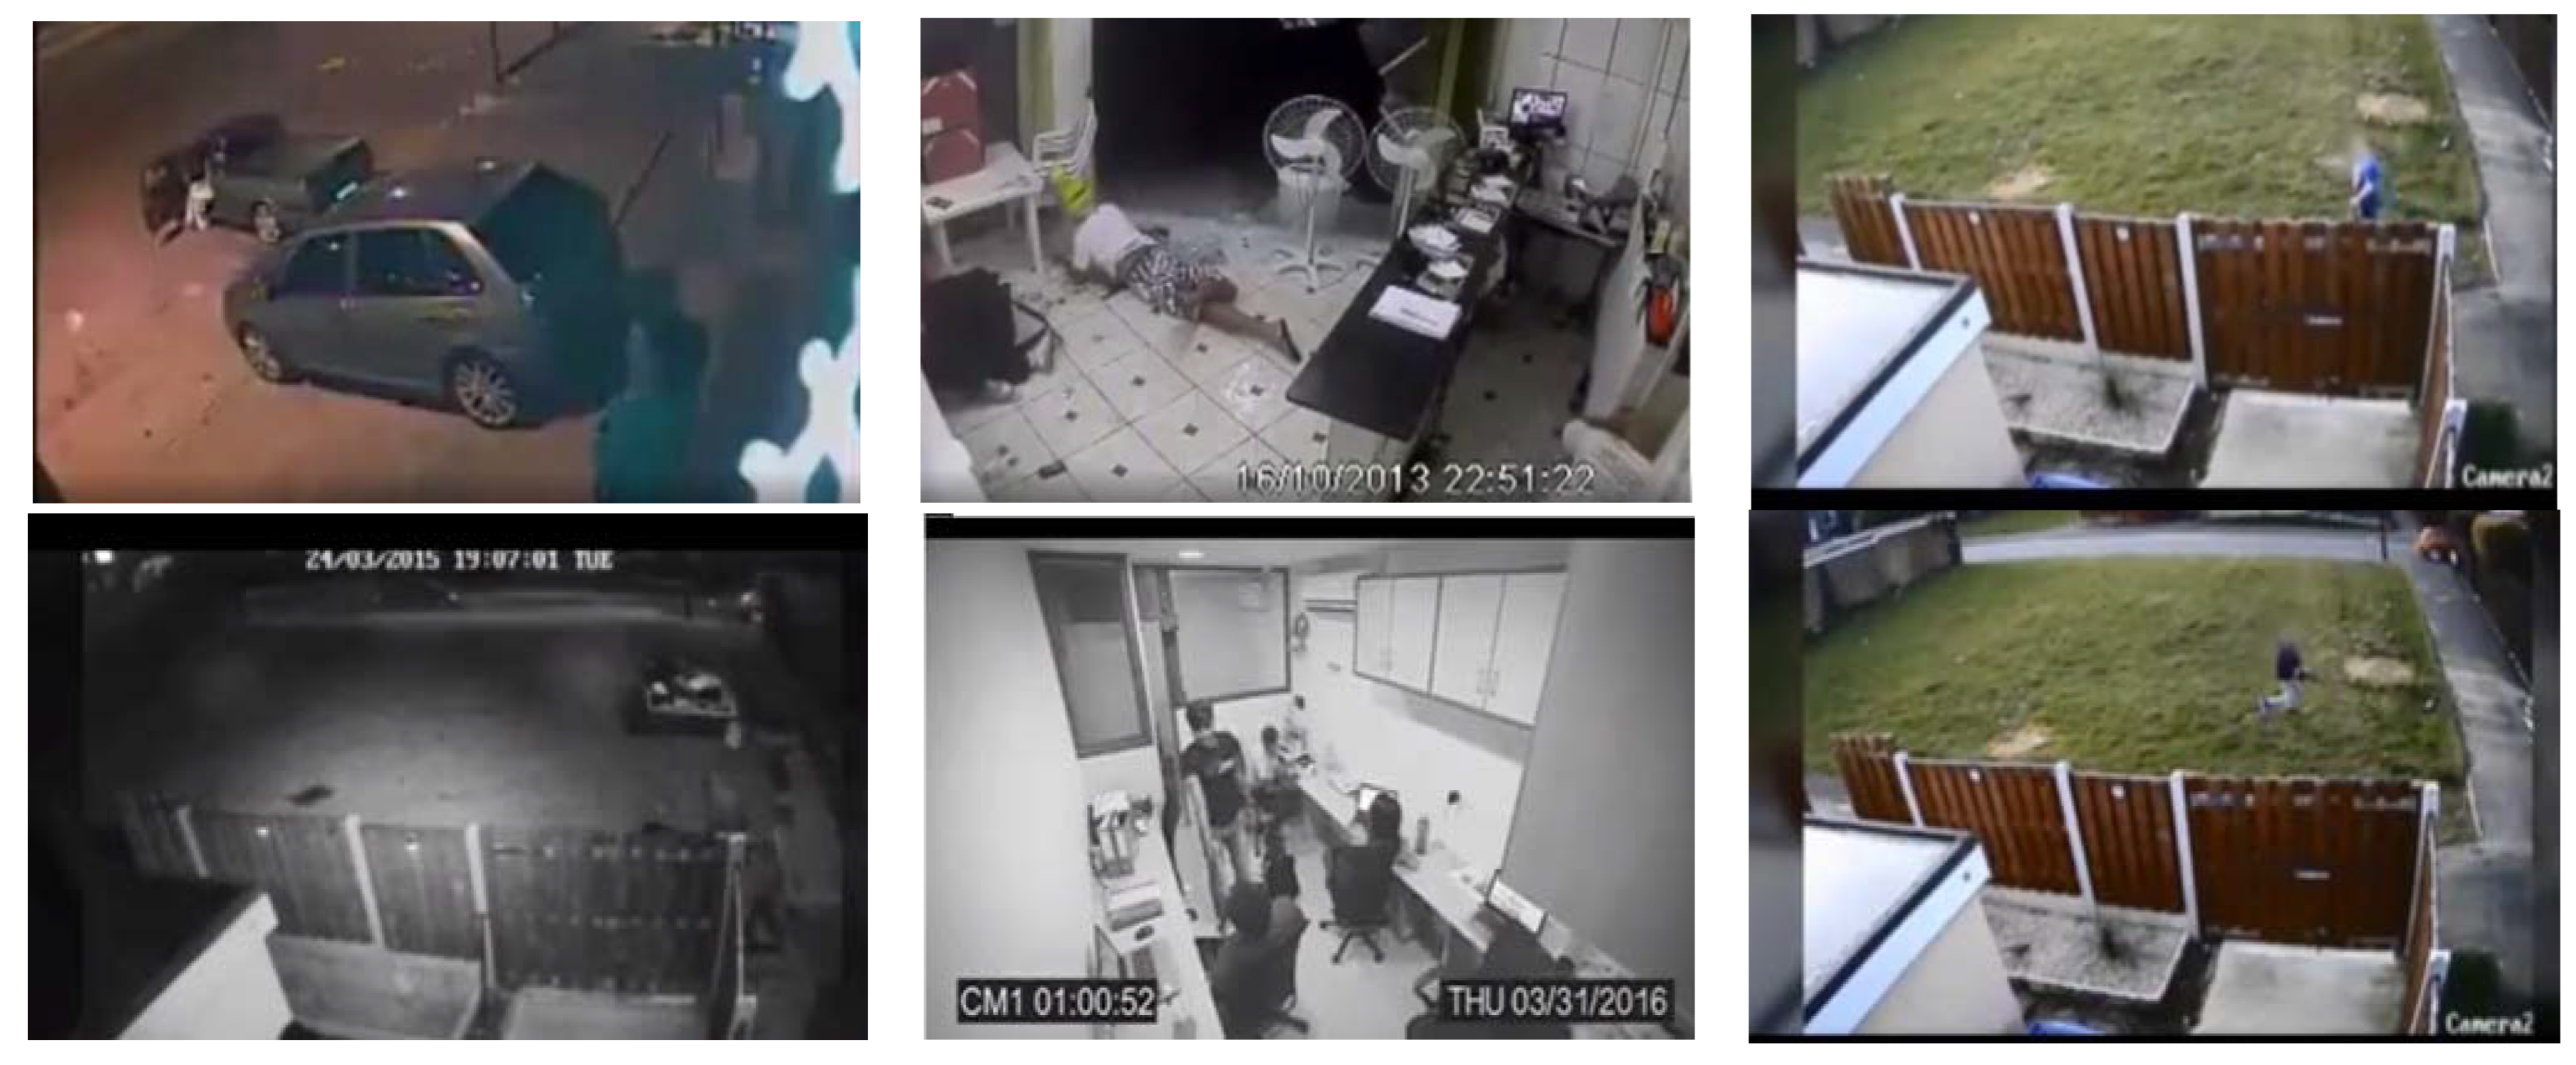
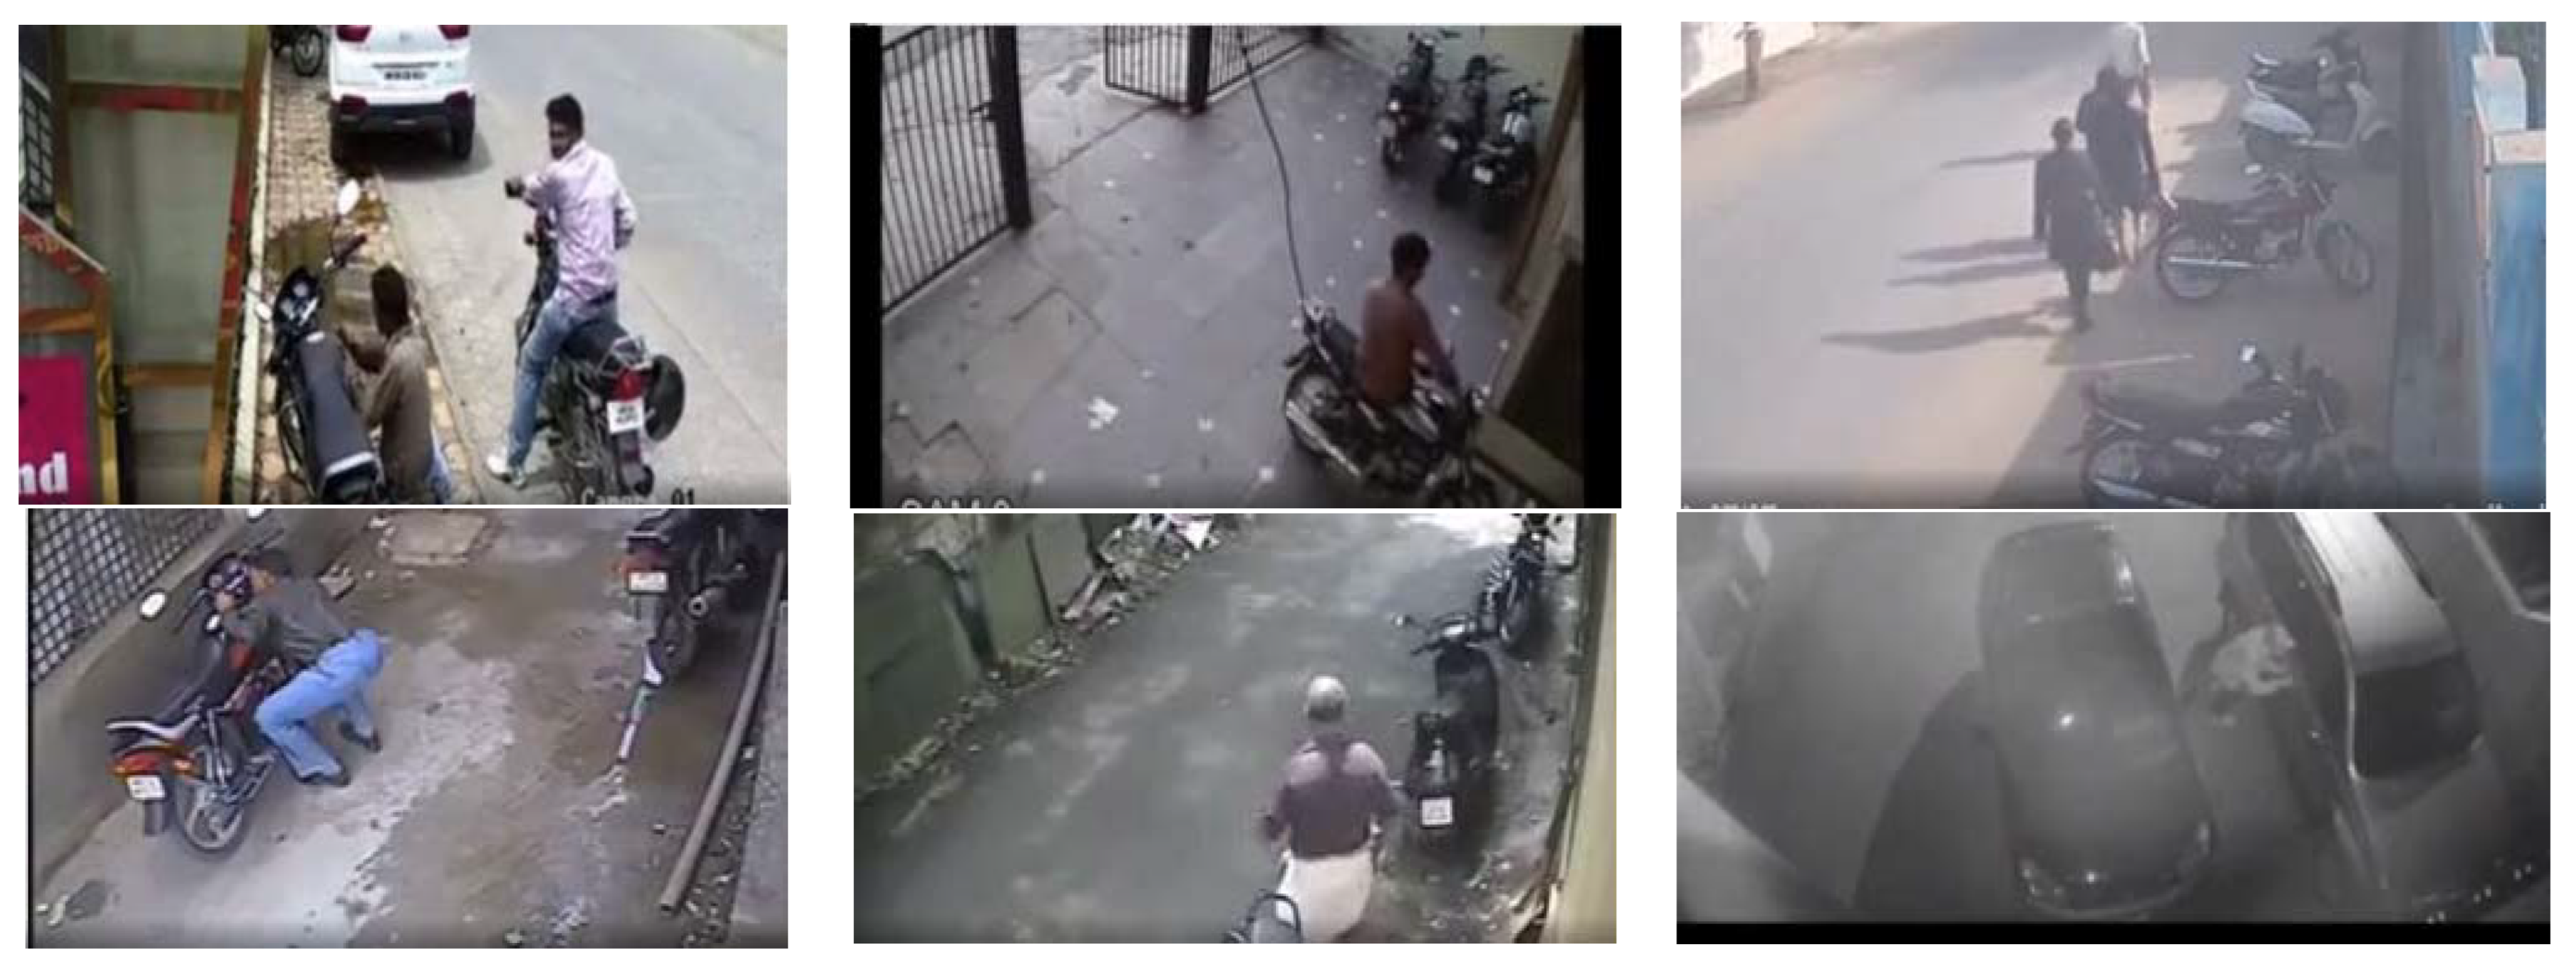
3.2. Experiment Setup and System Specification

This experiment was carried out with COLAB of Google using python3, Keras (layers, models, optimizers, utils, callbacks), and for video processing Opencv3 [21] (with ffmpeg). The ffmpeg function is a video and audio processing package available in Opencv3 of python. Data pre-processing: the dataset is set with a repository. Training: train model is used with running cells and adjacent parameters. Testing: using Algorithm 1 with trained video to predict suspicious actions. As per the data set specification, the shooting and stealing actions are recognized. This Algorithm 1 has imported numpy, activation, conv3D, dense, dropout, flatten, max-pooling of 3D and 2D, leakyReLU, categorical_crossentry, sequential, adam, np_utils, model checkpoints, model, and input from Keras. Algorithm 1 has defined an enhanced CNN function with sub-functions video input(), conv3D(), and leakyReLU() repeated twice. This is followed by conv3D (function is called three times to train video data layer-wise). For each video, 10 frames per second are used with the number of epoch 10. In this research experiment, ECNN architecture was used as the ECNN algorithm. This ECNN algorithm is the step-by-step layers’ functionality of ECNN architecture.
Algorithm 1: Proposed ECNN algorithm
//call all package
import numpy, Activation, Conv3D, Dense, Dropout, Flatten, MaxPooling3D
import MaxPooling2D, LeakyReLU, categorical_crossentropy
import Sequential, Adam, np_utils, ModelCheckpoint, Model, Input,
define ecnn() // define Enhanced CNN model
{
set Input(video to framed image) // preprocess done
apply Conv3D() function // feature map input is feed to kernel 3 × 3 size as filter
apply LeakyReLU() function // convert negative value to positive value as activation function for set of vector values for threshold
apply Conv3D() // feature map input is feed to kernel 3 × 3 size as filter
execute LeakyReLU() // convert negative value to positive value as activation function for set of vector values
}
// parallel compute and train video data
For i = 1 to 3)
{
   apply Conv3D() // feature map input is feed to kernel 3 × 3 size as filter
   execute LeakyReLU() // convert negative value to positive value as activation
   function for set of vector values threshold
   apply MaxPooling3D() // extract the maximum value from 3 × 3 vector
   apply Conv3D() // feature map input is feed to kernel 3 × 3 size as filter
   apply LeakyReLU() // convert negative value to positive value as activation
   function for set of vector values threshold
   apply MaxPooling3D() // extract the maximum value from 3 × 3 vector
   apply Conv3D() // feature map input is feed to kernel 3 × 3 size as filter
   execute LeakyReLU() // convert negative value to positive value as activation
   function for set of vector values threshold
   apply MaxPooling3D() // extract the maximum value from 3 × 3 vector
}
apply conv3D(i) // feature map input is feed to kernel 3 × 3 size as filter
apply MaxPooling3D() // extract the maximum value from 3 × 3 vector
apply Flatten() // from fully convolution of matrix value to vector row
apply Dense() // for each neuron set input, weight and bias and find a output
The working mechanism proposed for the ECNN algorithm is as follows. In this method, abnormal/suspicious action is detected with Opencv3 (with ffmpeg). This suspicious detection is undergoing the below modules internally and computation of suspicious activity detection like shooting and stealing. The enhanced CNN works as per the below explanation [22]. Here residual neural network (ResNet) CNN architecture is followed to detect suspicious action and it creates classes for the block of CNN. For this suspicious action detection, the input must be the number of blocks internally.
Data input and video pre-processing: This video dataset is taken as input (file) to the system subject to pre-processing. This video dataset is treated as an image sequence and referred to as frames. Internally RGB frames are converted into grayscale, since this pre-processing has to get the intensity of information of frames instead of apparent color. Here 3DConvolution takes RGB as 3D. This RGB image has been undergoing optical flow with pattern identification with objects, surfaces, and edges to retain visual sense. This RGB image scene is converted into frames with row and column specifications. Finally, the movement direction has to find the suspicious object of a video sequence with obstacles and this procedure will be repeated to detect the next suspicious-action detection.
Optical flow: This pre-processed image of video has to have optical flow computed for each pixel. This is a pattern to identify the motion of edges, surface, and objects as the proposed algorithm analyzes visual scenes. This shows the relative motion. This can be expressed as Equation (6).
OptFlo   ( r , θ )
where r is the magnitude of the pixel and θ is the direction related to the pixel of the previous frame. Further OpenCV package dense optical flow is called with a function called calcOpticalFlowFarneback() with Gunnar Farneback’s algorithm [23,24].
Optical flow of blocks: Once the optical flow is computed for every pixel of a frame, the frame has to be partitioned M row by N column. Partition is expressed as Equation (7).
P ( M x N )
where P is partition. Blocks have to be indexed as M and N in dimensions. This block has been expressed as Equation (8).
Block   ( ( B 1 ,   1 ) ,     ( B 1 ,   2 ) ,     .   ( B M ,   N ) )  
Usually, a frame size of 240 × 320 will be divided into 48 blocks; internally each block size is 20 × 20.
Motion influence map: This module finds the movement direction of a suspicious object in a video sequence with factors such as obstacles nearby and moving objects. This above-listed pre-processing, optical flow, optical flow of blocks, and motion influence may have to be repeated for each suspicious-action recognition.
ECNN feature extraction: ECNN feature extraction has to be carried out. Since the activity has to be captured with consecutive frames, it is further represented by feature vector which is expressed as Equation (9).
fv ( r x s )
where rxs is blocked over the most recent frame.
Mega block frames: This is a non-overlapping mega block with motion influence blocks.
Clustering mega block: The suspicious action is concerned with the spatiotemporal features. It is essential to use code words and it is expressed as Equation (10).
w ( i , j ) k ( 7 )
where k is the number of code words, i, j are indexed for mega blocks.
Testing phase: Code-word terms for normal activity and suspicious action are identified. Now, this has to be tested for suspicious or non-suspicious action for the entire dataset.
Minimum distance matrix: This is a small phase that constructs matrices for each mega block. This is a minimum Euclidean distance between each feature vector between current testing frames with the code word of mega block.
Frame level detection: It is also possible to detect unusual activity with a minimum distance matrix, if the value of the minimum distance matrix is small; the chance of unusual activity is less with respective mega blocks. If there is a higher value of the minimum distance matrix then there is a higher chance of unusual activity.
Pixel level detection: Unusual action is also detected at the pixel level. The initial threshold value is set. Further, the minimum distance value is compared with the threshold. If the value is larger, then the prediction of unusual action chance is greater.
The dataset was collected by the Kaggle DCSASS which is prepared by Sultani et al. [20] and it consists of 13 classes. In this proposed work, 2 classes are taken and they are the stealing and shooting classes. This dataset has 16,853 videos or records (9676 videos were labeled as normal and 7177 videos were labeled as abnormal or anomaly). For the shooting class, a total of 960 video datasets are trained and tested. Among this count of the dataset, the shooting class has 960 videos with 304 abnormal videos, and stealing has a 2048 video dataset with 965 abnormal videos. Notably, a total of 10 iterations have been iterated for each algorithm including the proposed method. For the experiment setup, 80% G power is calculated with an error (alpha) value of 0.05 and a confidence interval of 0.95. This dataset comprises 3008 video records and is divided into two sets, training and testing. The training set contains 2406 video records and the testing set contains 602 video records. Below, Figure 4 illustrates the suspicious and non-suspicious ECNN algorithm. Initially, for training the DCSASS video dataset was taken and trained with ECNN. Before training, input video was converted into frame extraction and pre-processed with ECNN algorithm. Then 80% of video dataset records were used for the training phase. Later 20% of dataset records were used for testing. Tested dataset further classified into suspicious or non-suspicious actions. Later its accuracy, precision, false positive and false negative were analyzed with SPSS too.
Figure 4. Suspicious and non-suspicious action with training and testing procedure.
The above-modularized actions are carried out with Algorithm 1. This algorithm is performed with the Convolutional 3D layer, LeakyReLU layer, and MaxPooling layer actions. It detects suspicious activity like shooting and stealing actions from the dataset [16]. Here, LeakyReLU was applied to protect the exponential growth in the computation in identifying the sequence of suspicious actions and further operated in all suffixed layers with the neural network. Hence CNN has been enhanced. If the CNN scales in size, the computational cost of adding extra ReLUs increases linearly. The epochs trained for this work at 100 and it will be set as the hyperparameter. Adding LeakyReLU() procedure limit, this epoch is set to 100. Hence this hyperparameter concerning LeakyReLU () has set novelty for detecting suspicious action over video surveillance. Figure 5 shows shooting action in front of a car, inside a living place, in front of a living place, and inside some commercial or office places. Usually, CNN may set hyperparameters as the number of hidden layer count and activation function. Here LeakyReLU will be set as an activation function.
Figure 5. Identification of shooting action from the dataset with different places and different objects.
Figure 6 shows a set of stealing suspicious actions and these stealing suspicious actions are detected with Algorithm 1 based on a dataset of stealing actions presented in videos. The suspicious actions are those such as bike stealing, car stealing, and pickpocket events.
Figure 6. Identification of stealing action from the dataset with different places and different objects.

3.3. Performance Parameters for Suspicious-Action Detection

Accuracy is the identification of suspicious activity and it rests on the specific value of closeness. Usually, it can be measured as follows. True positive (TP)—the actual suspicious action video detects a suspicious action. True negative (TN)—the actual video input does not have suspicious action and the proposed algorithm detects no suspicious action. False positive (FP)—actual input is not suspicious action but output claims suspicious action. False negative (FN)—actual input has suspicious action but output claimed as not suspicious. Accuracy is the ratio between the sum of TP and TN with the addition of TP, TN, FP, and FN. The descriptions of TP, TN, FP, and FN are illustrated in Table 2.
Table 2. Suspicious-action detection confusion matrix.
The measuring accuracy is shown in Equation (11).
A c c u r a c y = T P + T N T P + T N + F P + F N
Further, the precision of suspicious-action detection is the proximity measurement of action and it is the ratio between TP and the sum of TP and FP. Equation (12) is expressed for measuring precision.
P r e c i s i o n = T P T P + F P
Also, the false positive rate (FPR) is the ratio between FP and the sum of FP and TN and it is represented as Equation (13).
F P R = F P F P + T N
Furthermore, the false negative rate (FNR) is the ratio between FN and the sum of FN and TP, and it is expressed in Equation (14).
N R = F N F N + T P ( 11 )
Furthermore, the loss is the function that is supposed to compare the target suspicious action to the predicted suspicious-action values. In general, it is how exactly ECNN trains the data. The average loss is expressed as Equation (15).
AL ( w , b ) = 1 m i = i n L ( a i , c i ) ( 12 )
where AL is the average loss, L is loss, w is weight, b is the bias value, n is the maximum number of actions trained, a is the target, and c is predicted suspicious actions.

4. Results and Experiment

The suspicious action detection experiment was initiated for the ECNN algorithm along with the CNN algorithm. Further results generated through algorithms were analyzed with the SPSS tool. Here four performance parameters are used, which are accuracy, precision, false positive, and false negative. All these four performance parameters’ values are listed in Table 3 for 10 iterations.
Table 3. Iterated performance-value list for accuracy, precision, false positive, and false negative between ECNN and CNN algorithms.

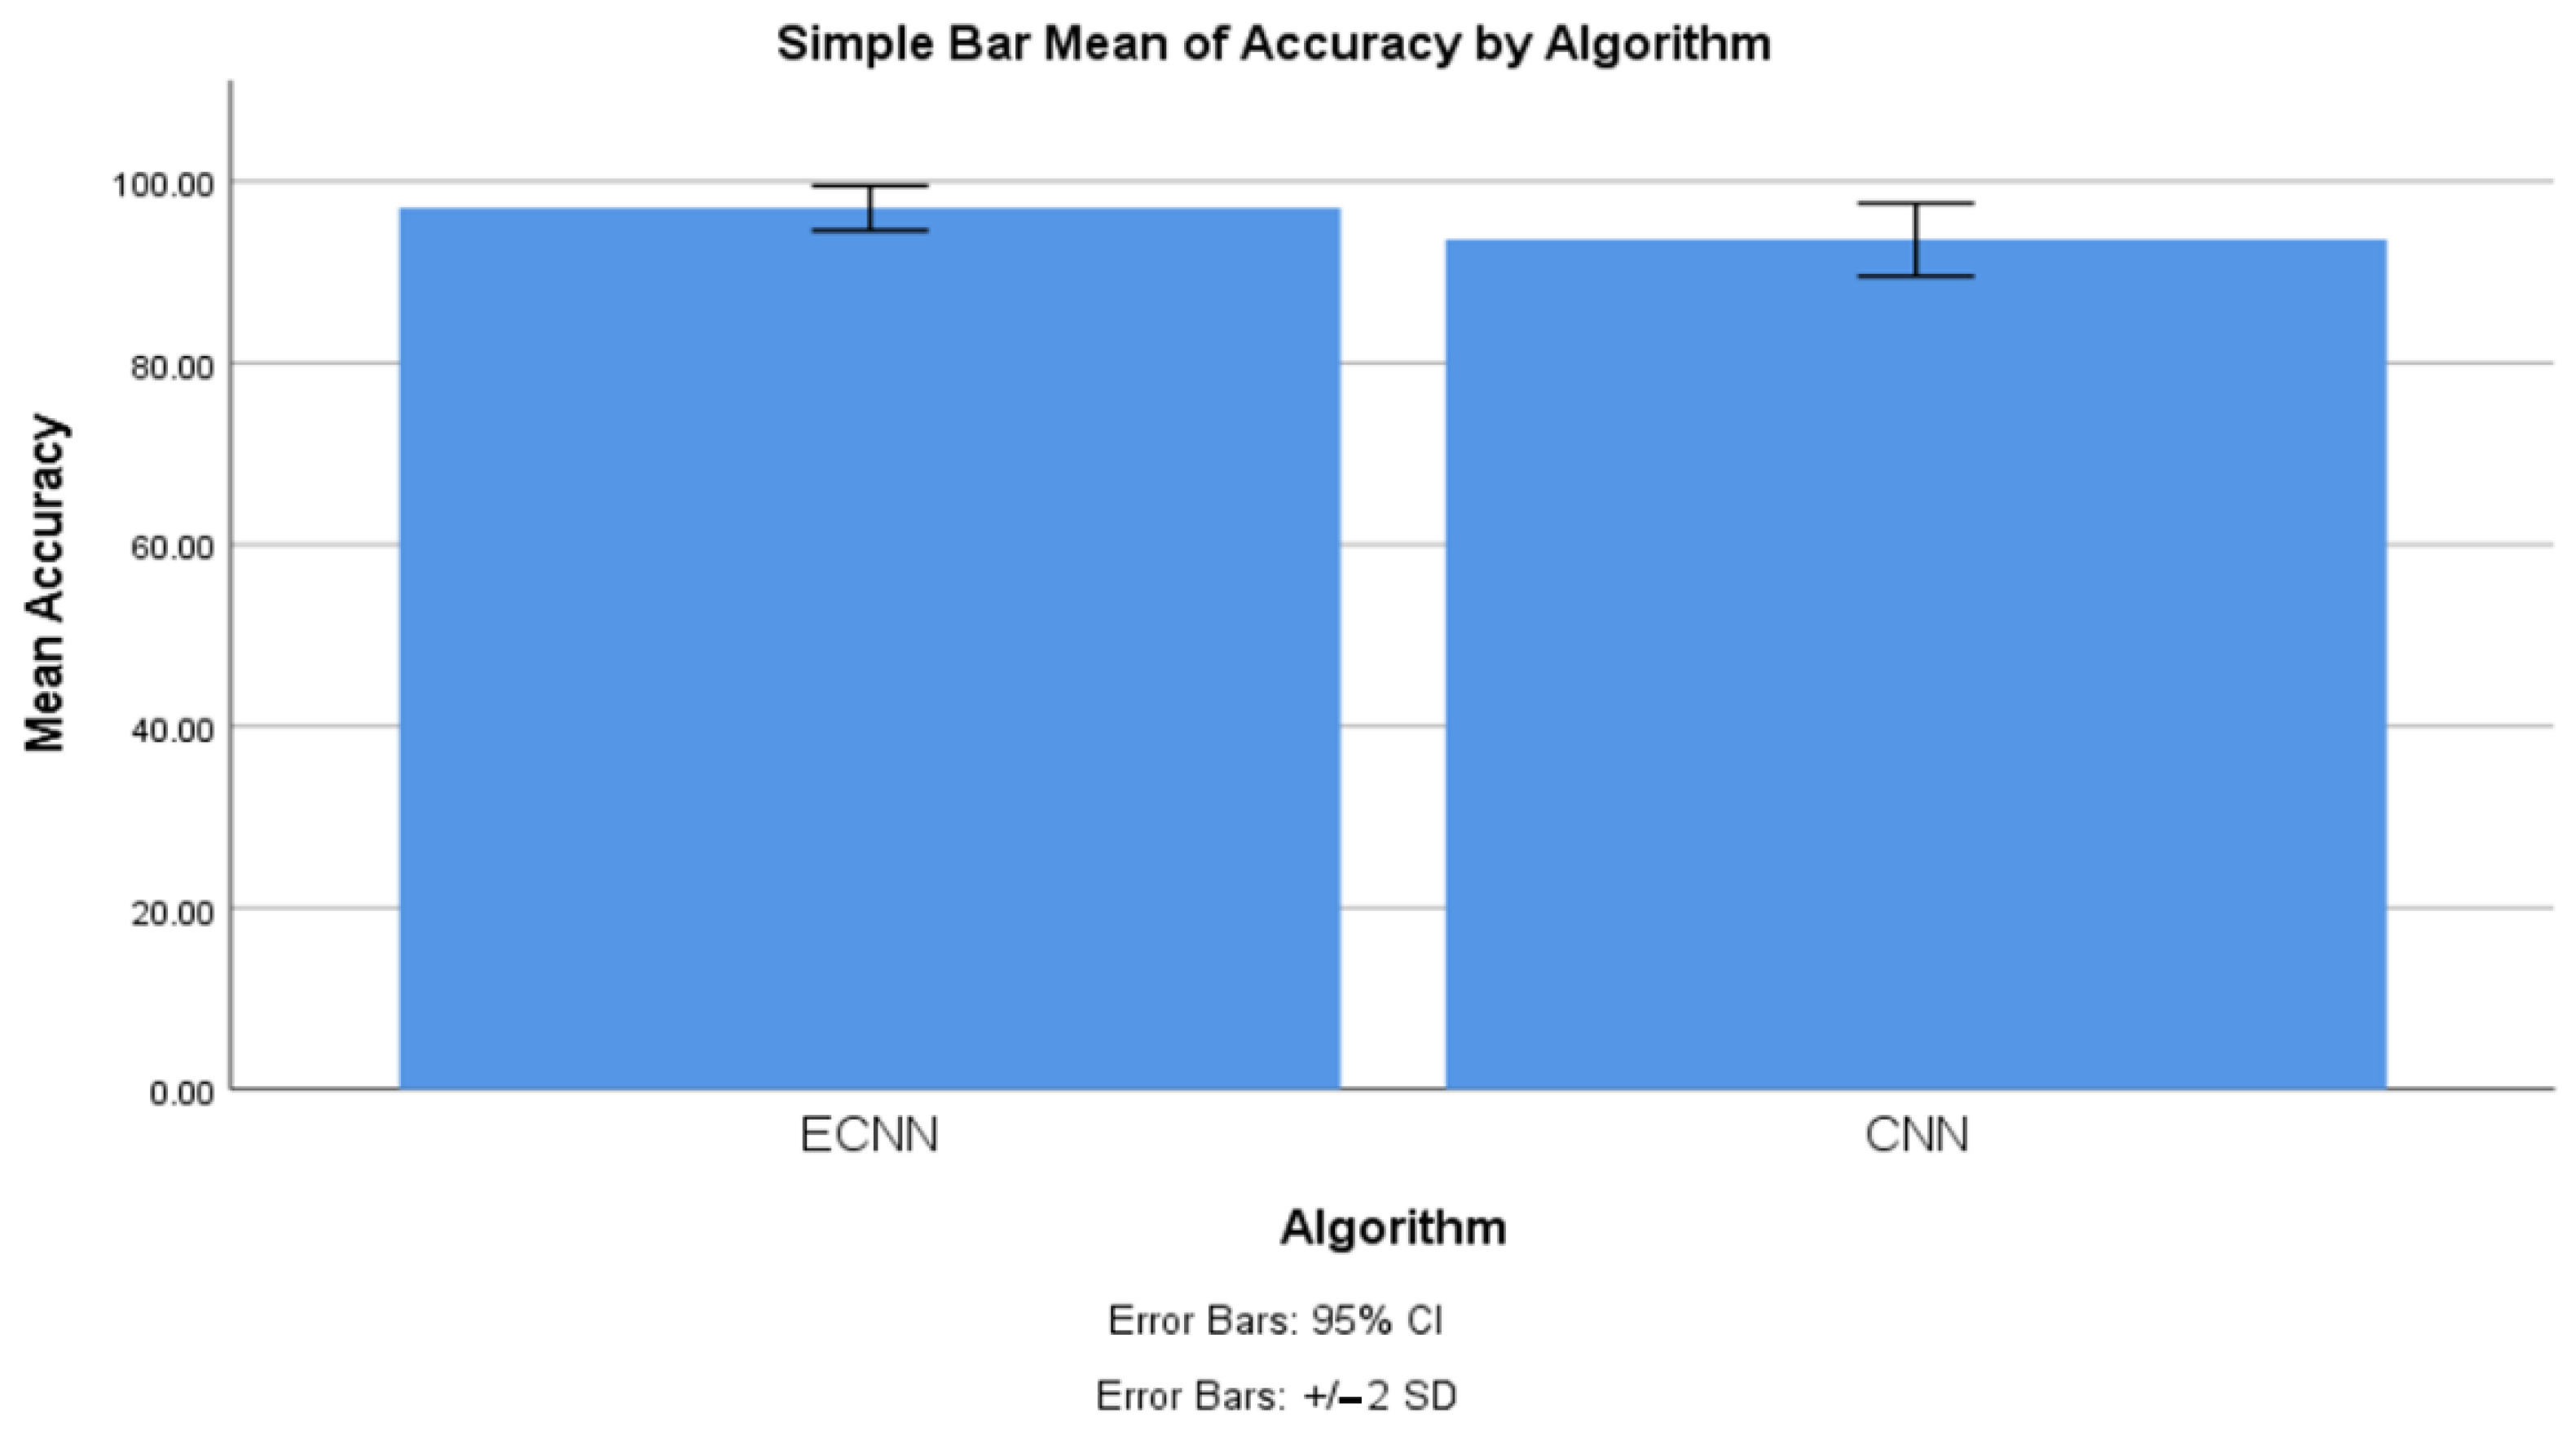
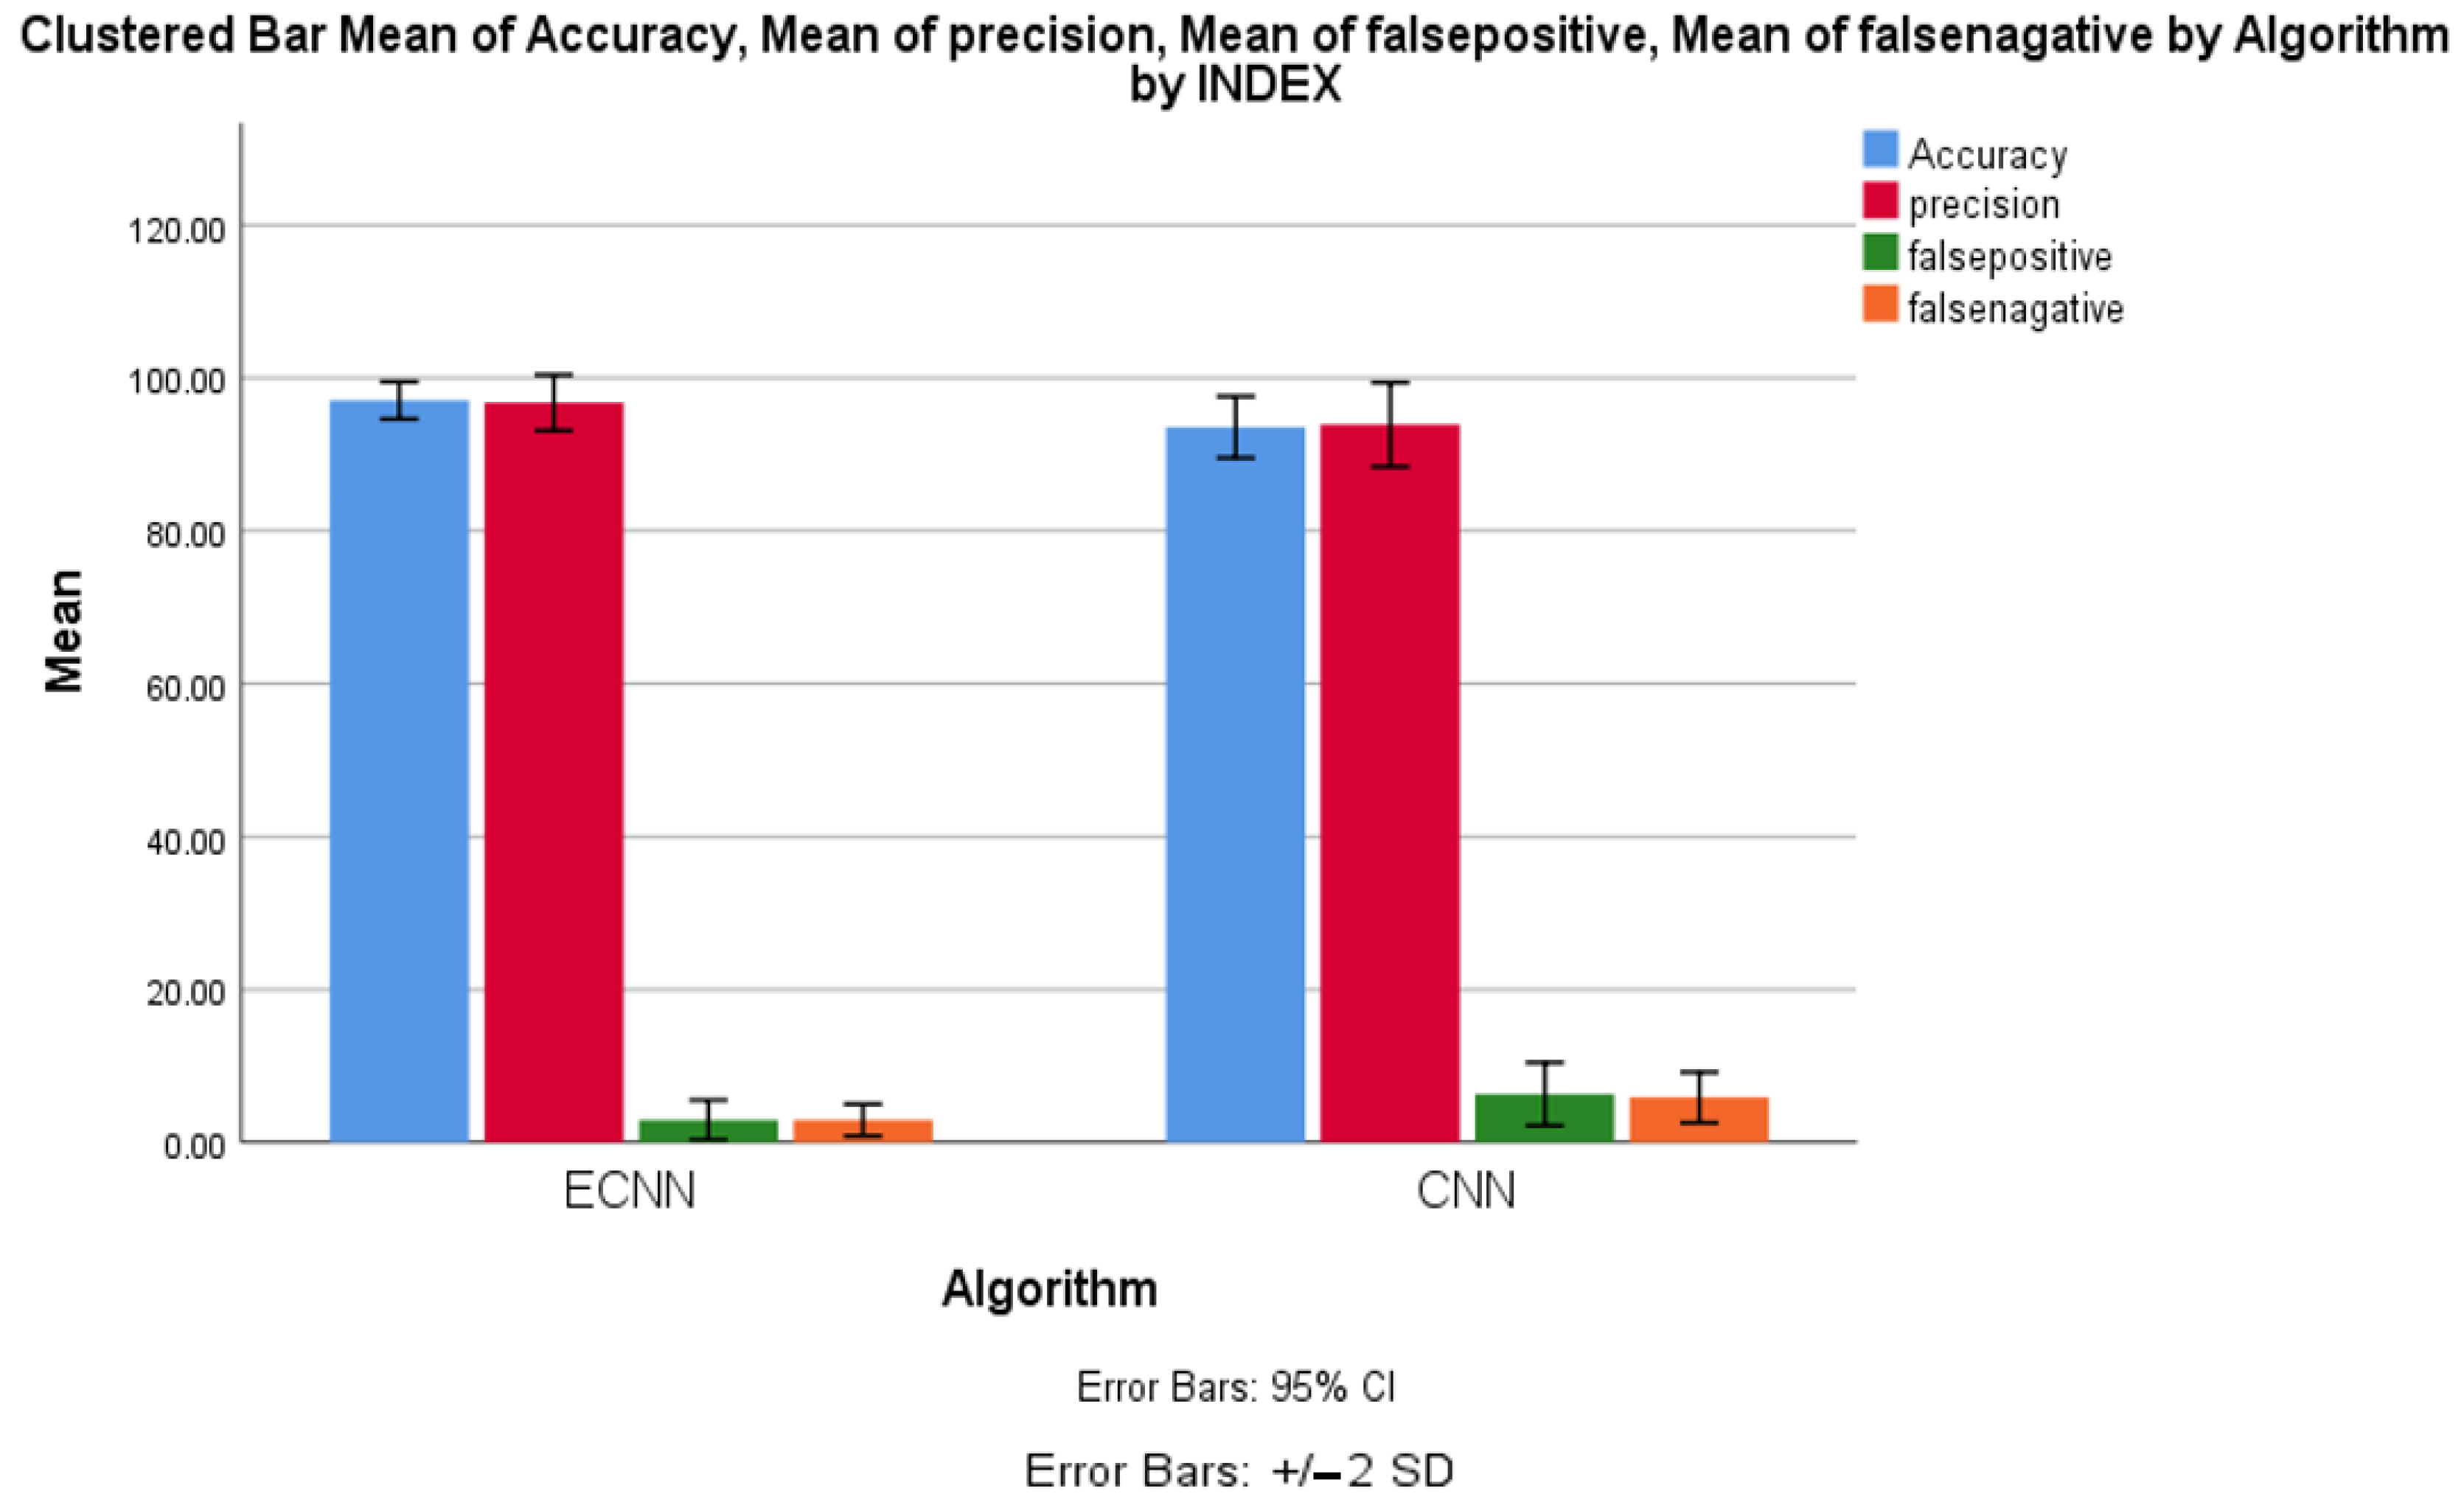
4.1. Accuracy between ECNN and CNN

The statistical analysis was carried out to measure the group statistics ECNN and CNN. Table 4 lists the group statistics information, such as several rounds (N), mean, standard deviation, and standard error mean, of accuracy parameters for the ECNN and CNN algorithms. From this table, it is observed that the mean accuracy of ECNN was 97.050% which is higher than the CNN algorithm. Also, the standard deviation of ECNN is less than CNN. Likewise, the standard error mean of ECNN is also comparatively less than CNN.
Table 4. Group statistics parameter comparison with accuracy for ECNN and CNN algorithms.
Table 5 lists the independent-sample test values for F, significance, t, df, two-tailed significance, mean difference, standard error difference, and confidence interval of difference for ECNN and CNN with equal variance assumed and not assumed for accuracy comparison. Here the significance value gained was 0.237. This significance value shows that the accuracy of ECNN appears to be better than CNN as this work has said alpha value as 0.05.
Table 5. Independent-sample test significance computation between ECNN and CNN algorithms for accuracy.
Figure 7 shows the accuracy comparison with error bars for standard deviation (±2) and confidence interval (95%). This graph claims that the mean accuracy of ECNN is 97.050% and CNN accuracy is 93.555%. The observation clearly shows that the error rate is less with ECNN compared with the CNN error rate.
Figure 7. Mean accuracy comparison between ECNN and CNN with confidence interval 95% and standard deviation ±2.

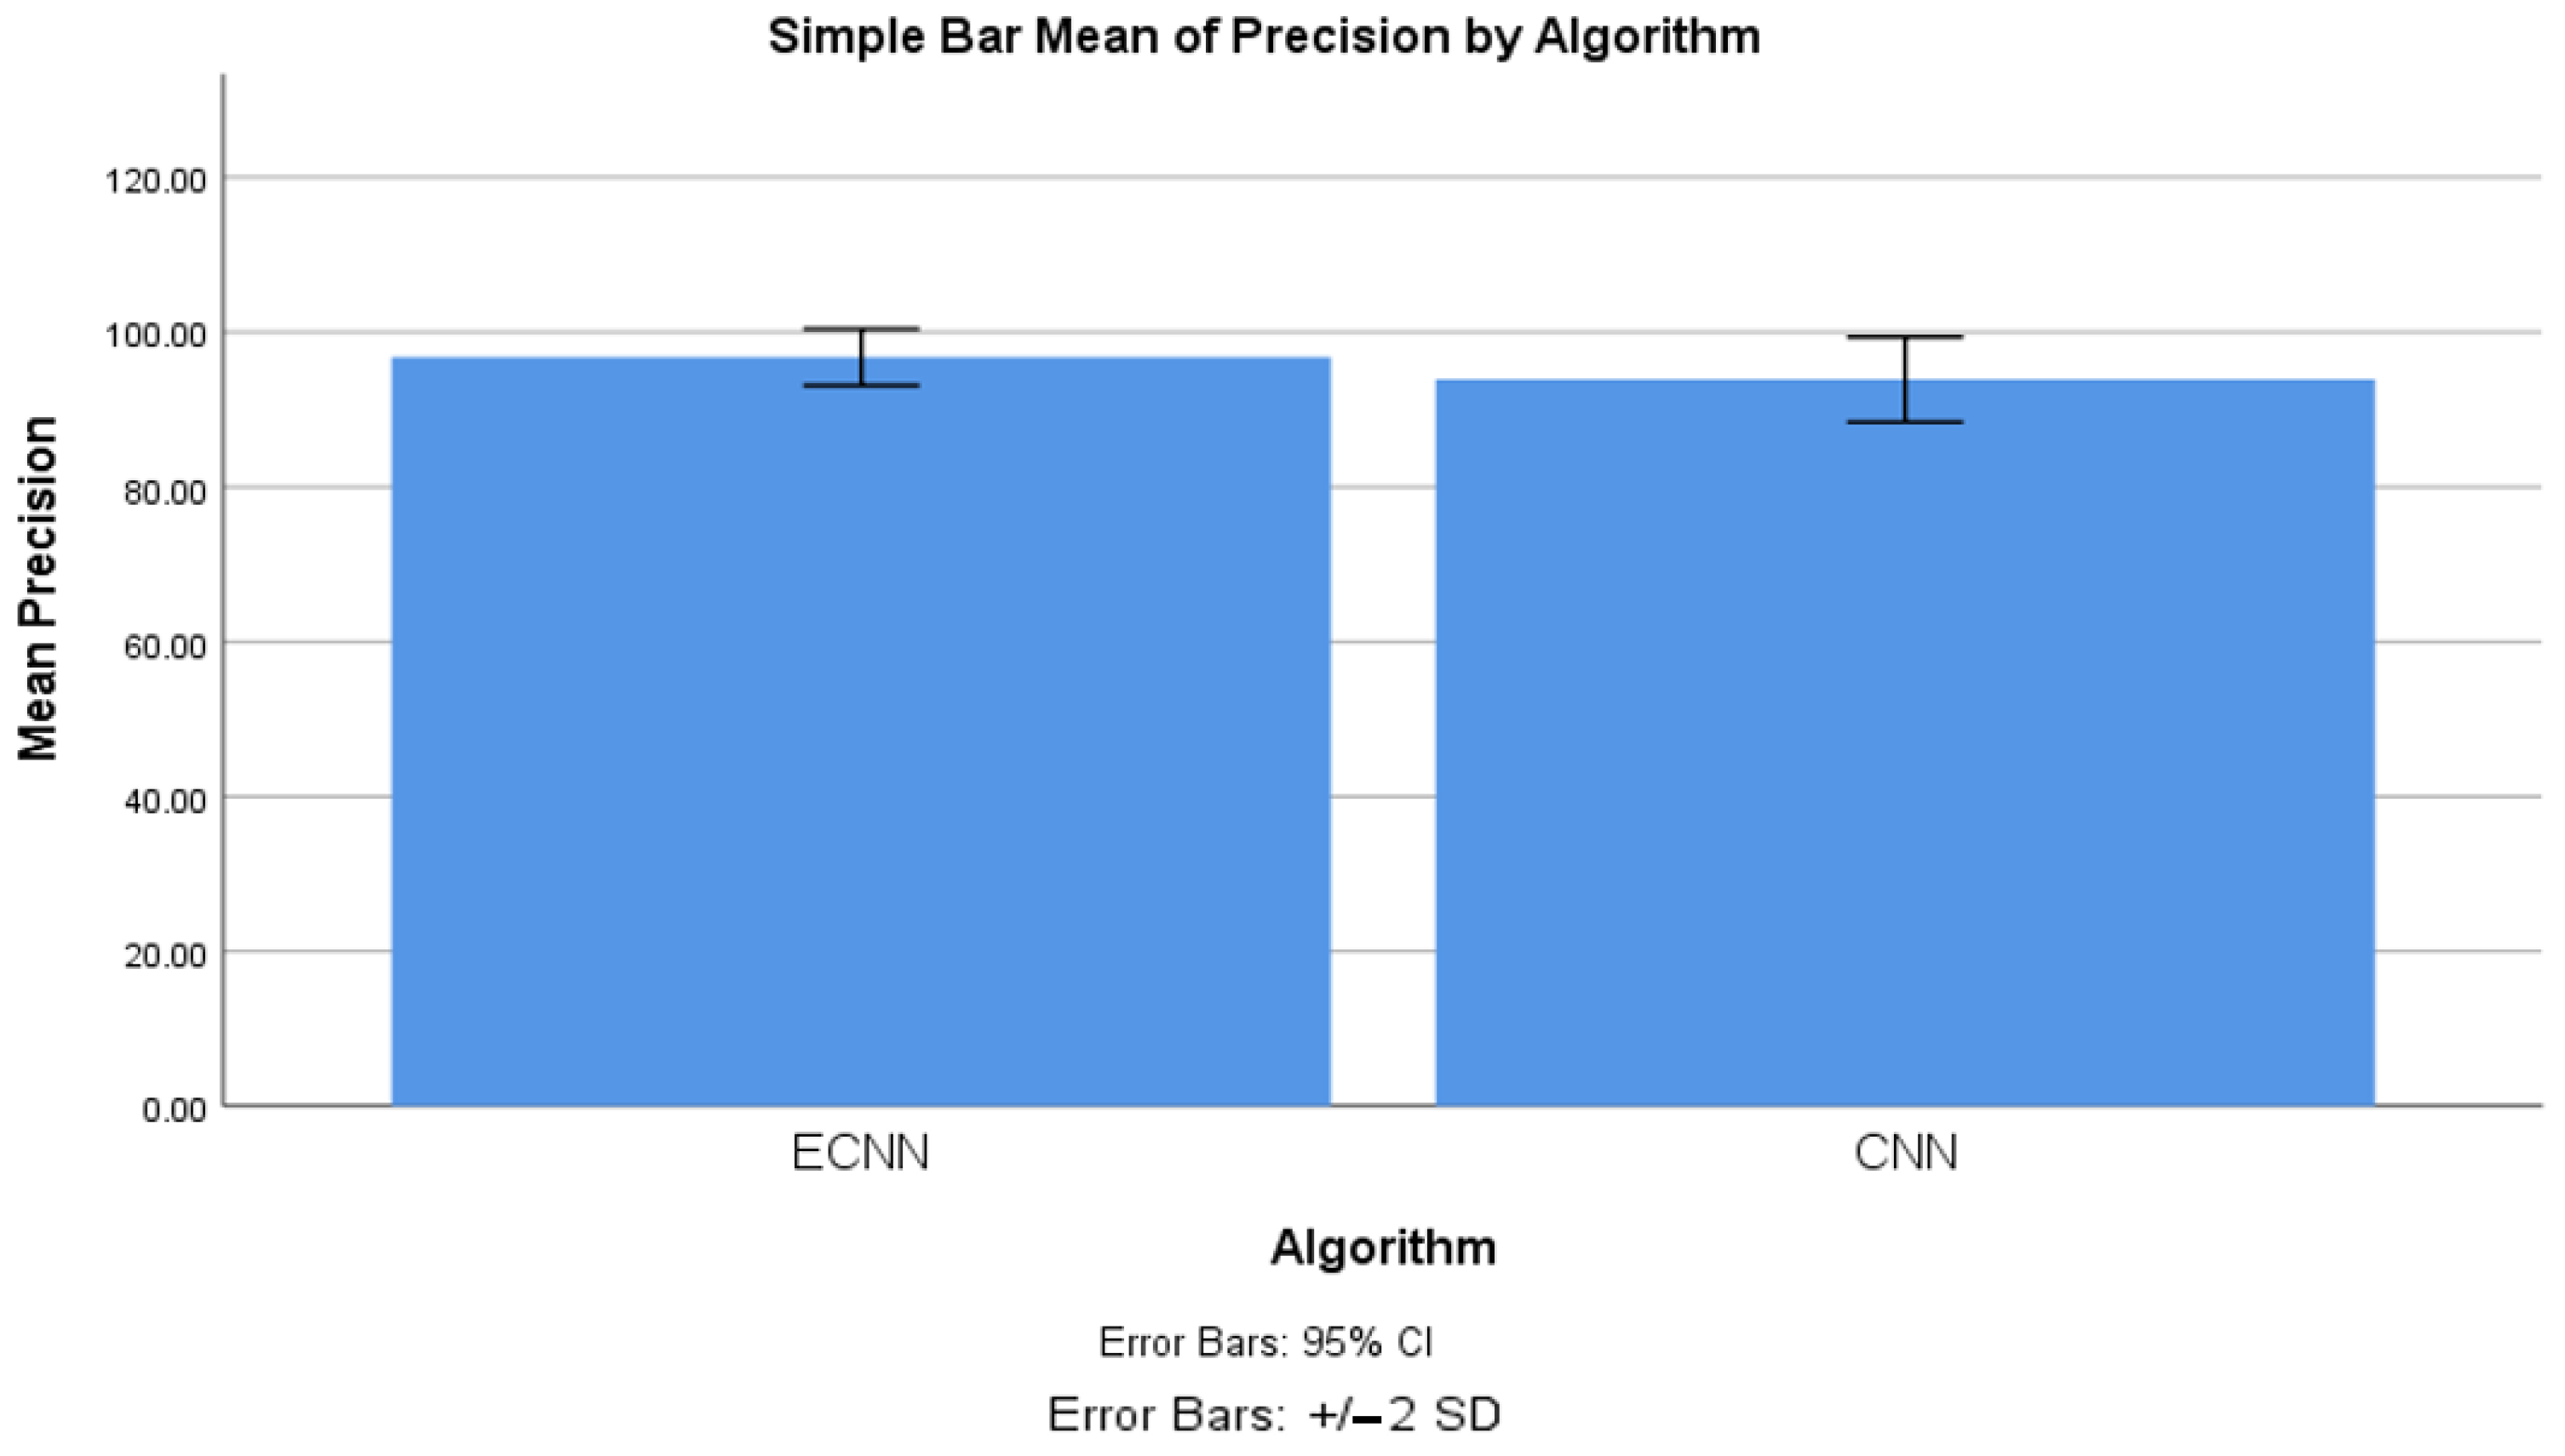
4.2. Precision between ECNN and CNN

Table 6 lists the group statistics information for precision comparison of ECNN and CNN. This table also clearly shows that mean precision (96.743%), standard deviation (1.825), and standard error mean (0.577) are better than the CNN group statistics values.
Table 6. Group statistics parameter comparison with precision for ECNN and CNN algorithms.
Table 7 lists the precision of ECNN and CNN values processed using an independent-sample test for equal variances assumed and not assumed. Here the claim concludes that the significance value of the precision comparison is 0.345 and it appears to be significantly better. This table also lists the independent-sample test parameters. Figure 8 illustrates the mean comparison of precision between ECNN and CNN. The mean precision of ECNN is 96.743% which is comparatively better than CNN. Inference claims that a standard error value for ECNN is less than the CNN standard error value.
Table 7. Independent-sample test significance computation between ECNN and CNN algorithms for precision.
Figure 8. Mean precision comparison between ECNN and CNN with confidence interval 95% and standard deviation ±2.

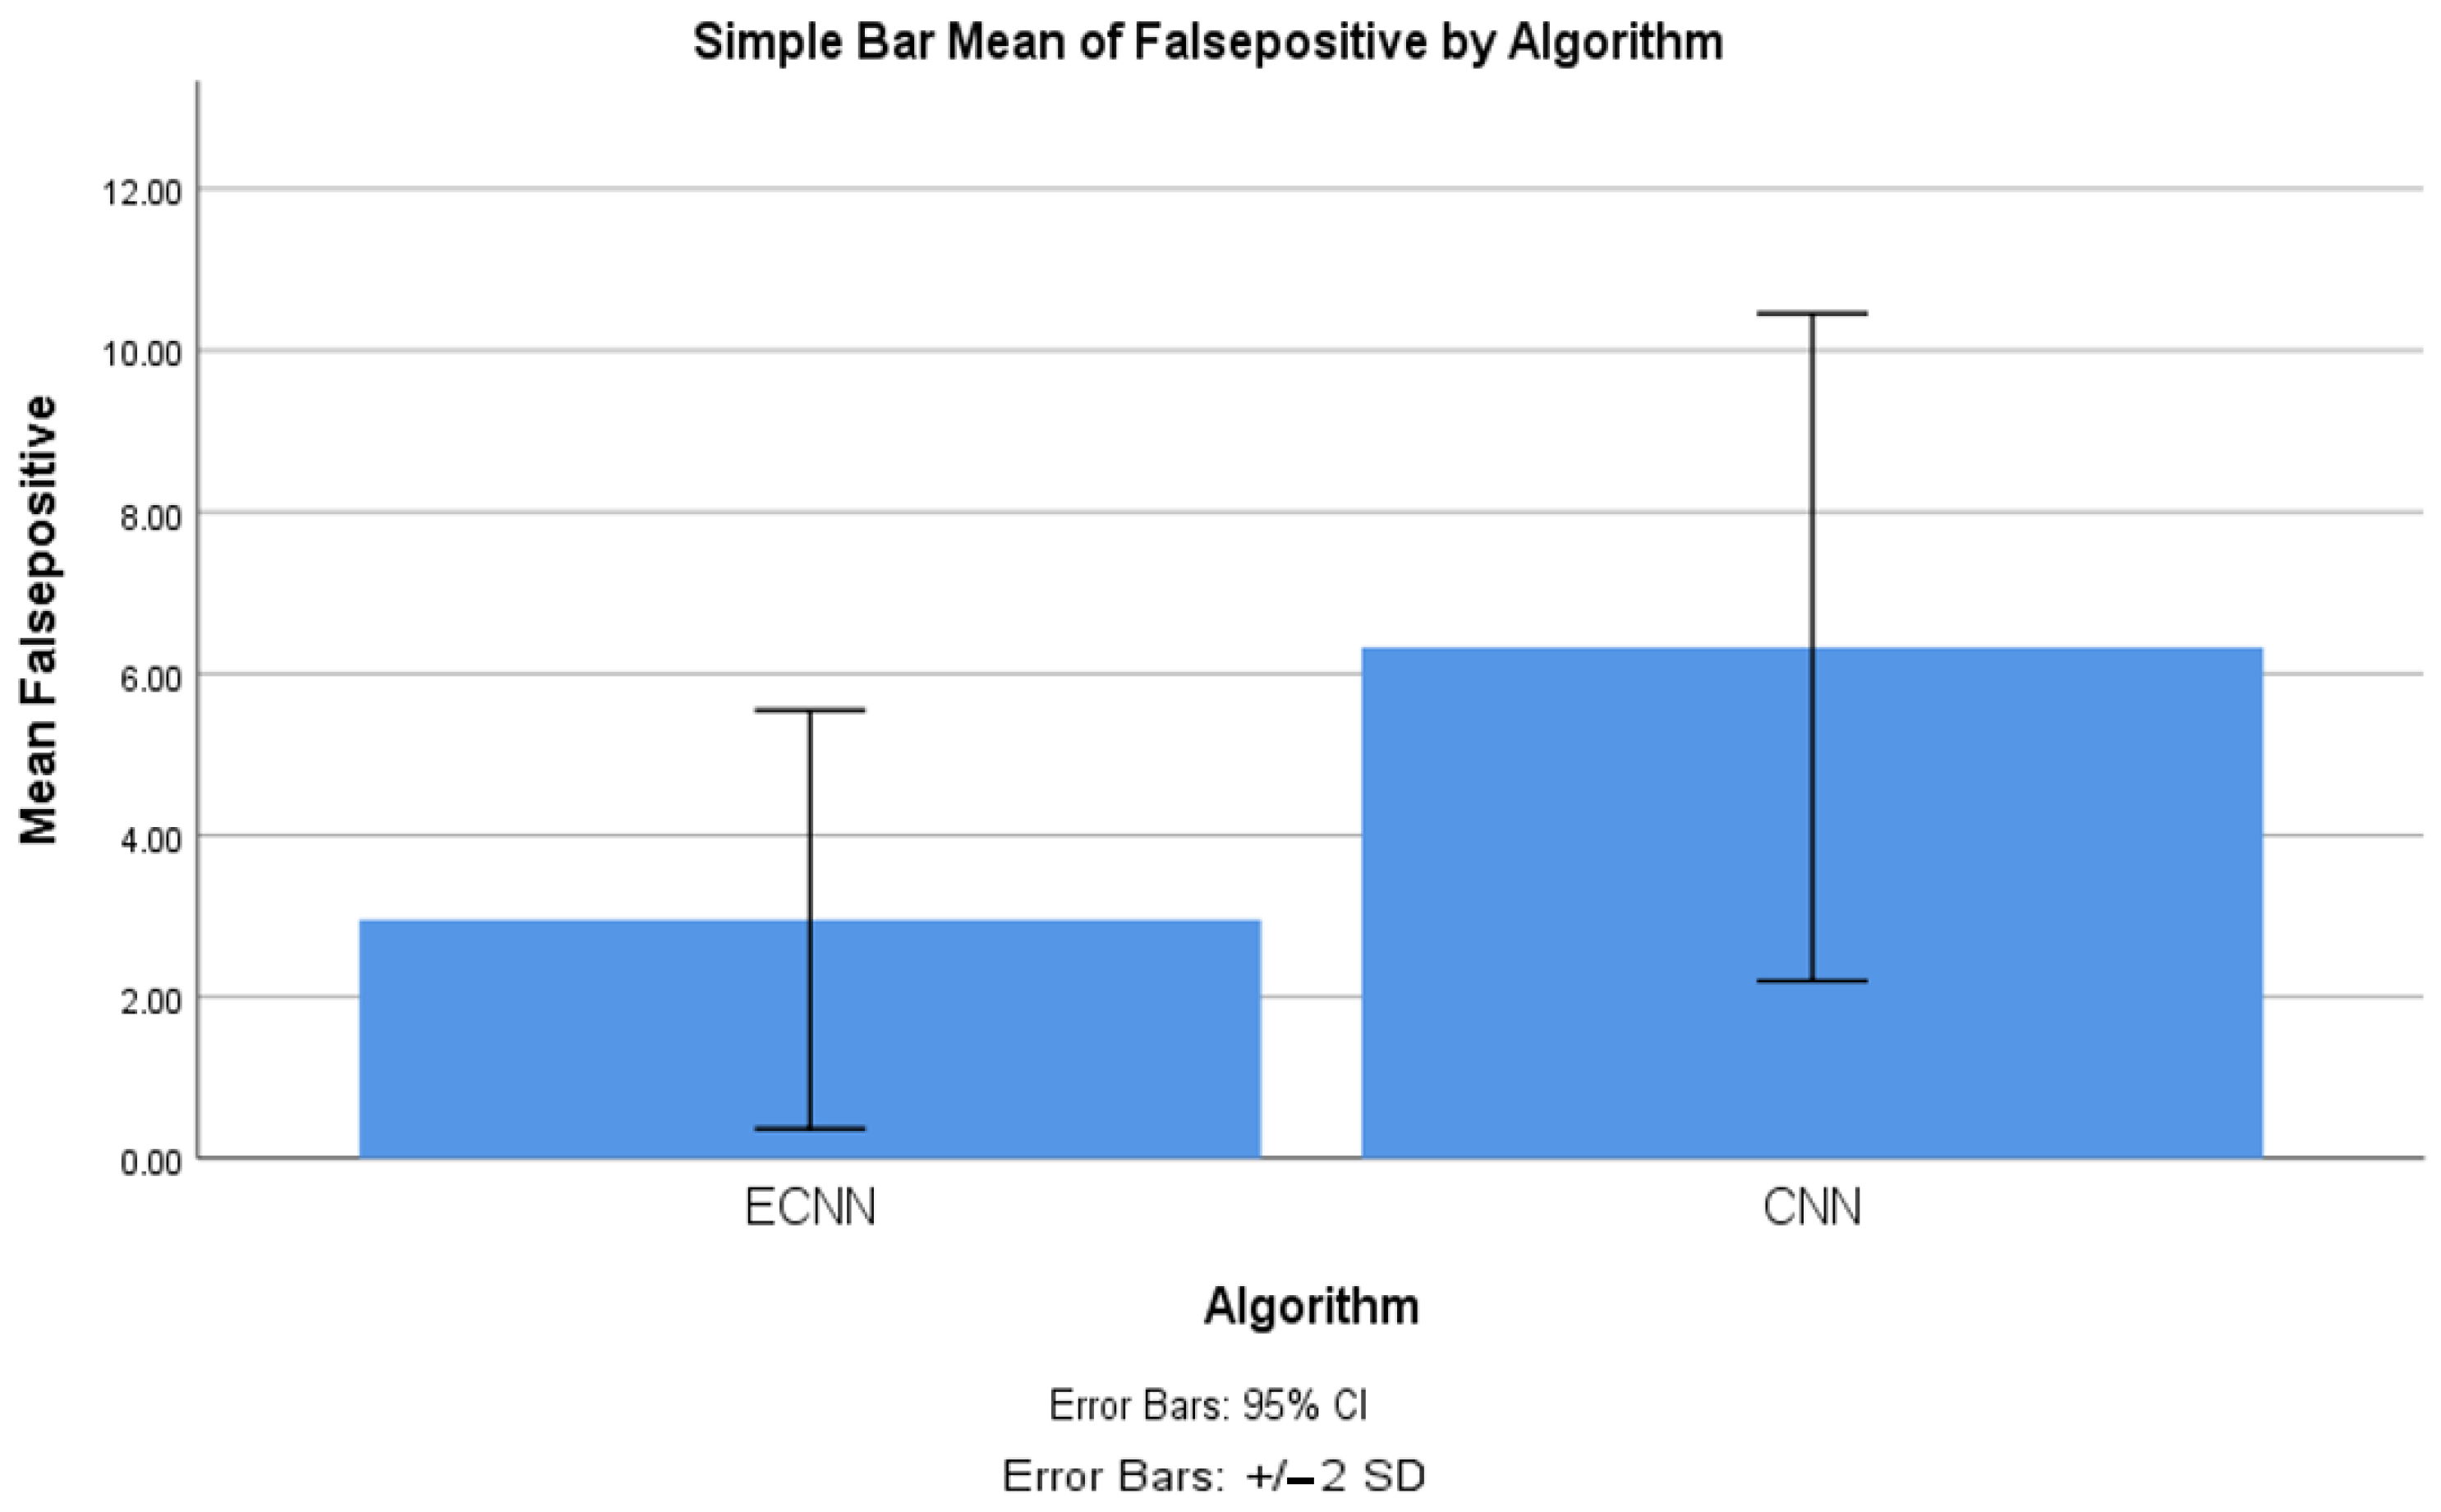
4.3. False Positive between ECNN and CNN

Table 8 shows the group statistics parameters’ values. The observation is claimed that the false positive mean, standard deviation, and standard error mean are 1.294, 2.957, and 0.409 for ECNN, which are less than for the CNN algorithm. Table 9 lists the parameter values of an independent-sample test of comparison between ECNN and CNN. The inference is claimed that the significance value of this comparison is 0.116 which concludes that ECNN performance appears to be slightly better than CNN. This table also represents the performance parameters such as F, significance, t, df, two-tailed significance, mean difference, standard error difference, and confidence interval lower and upper range values.
Table 8. Group statistics parameter comparison for false positive between ECNN and CNN.
Table 9. Independent-sample test significance computation between ECNN and CNN algorithms for false positive.
Figure 9 illustrates the comparison difference of mean false positive between ECNN and CNN. The mean false positive of ECNN is 2.957 whereas the mean false positive of CNN is 6.325. Hence the performance of ECNN employing false positives is high compared to CNN.
Figure 9. Mean false-positive comparison between ECNN and CNN with confidence interval 95% and standard deviation ±2.

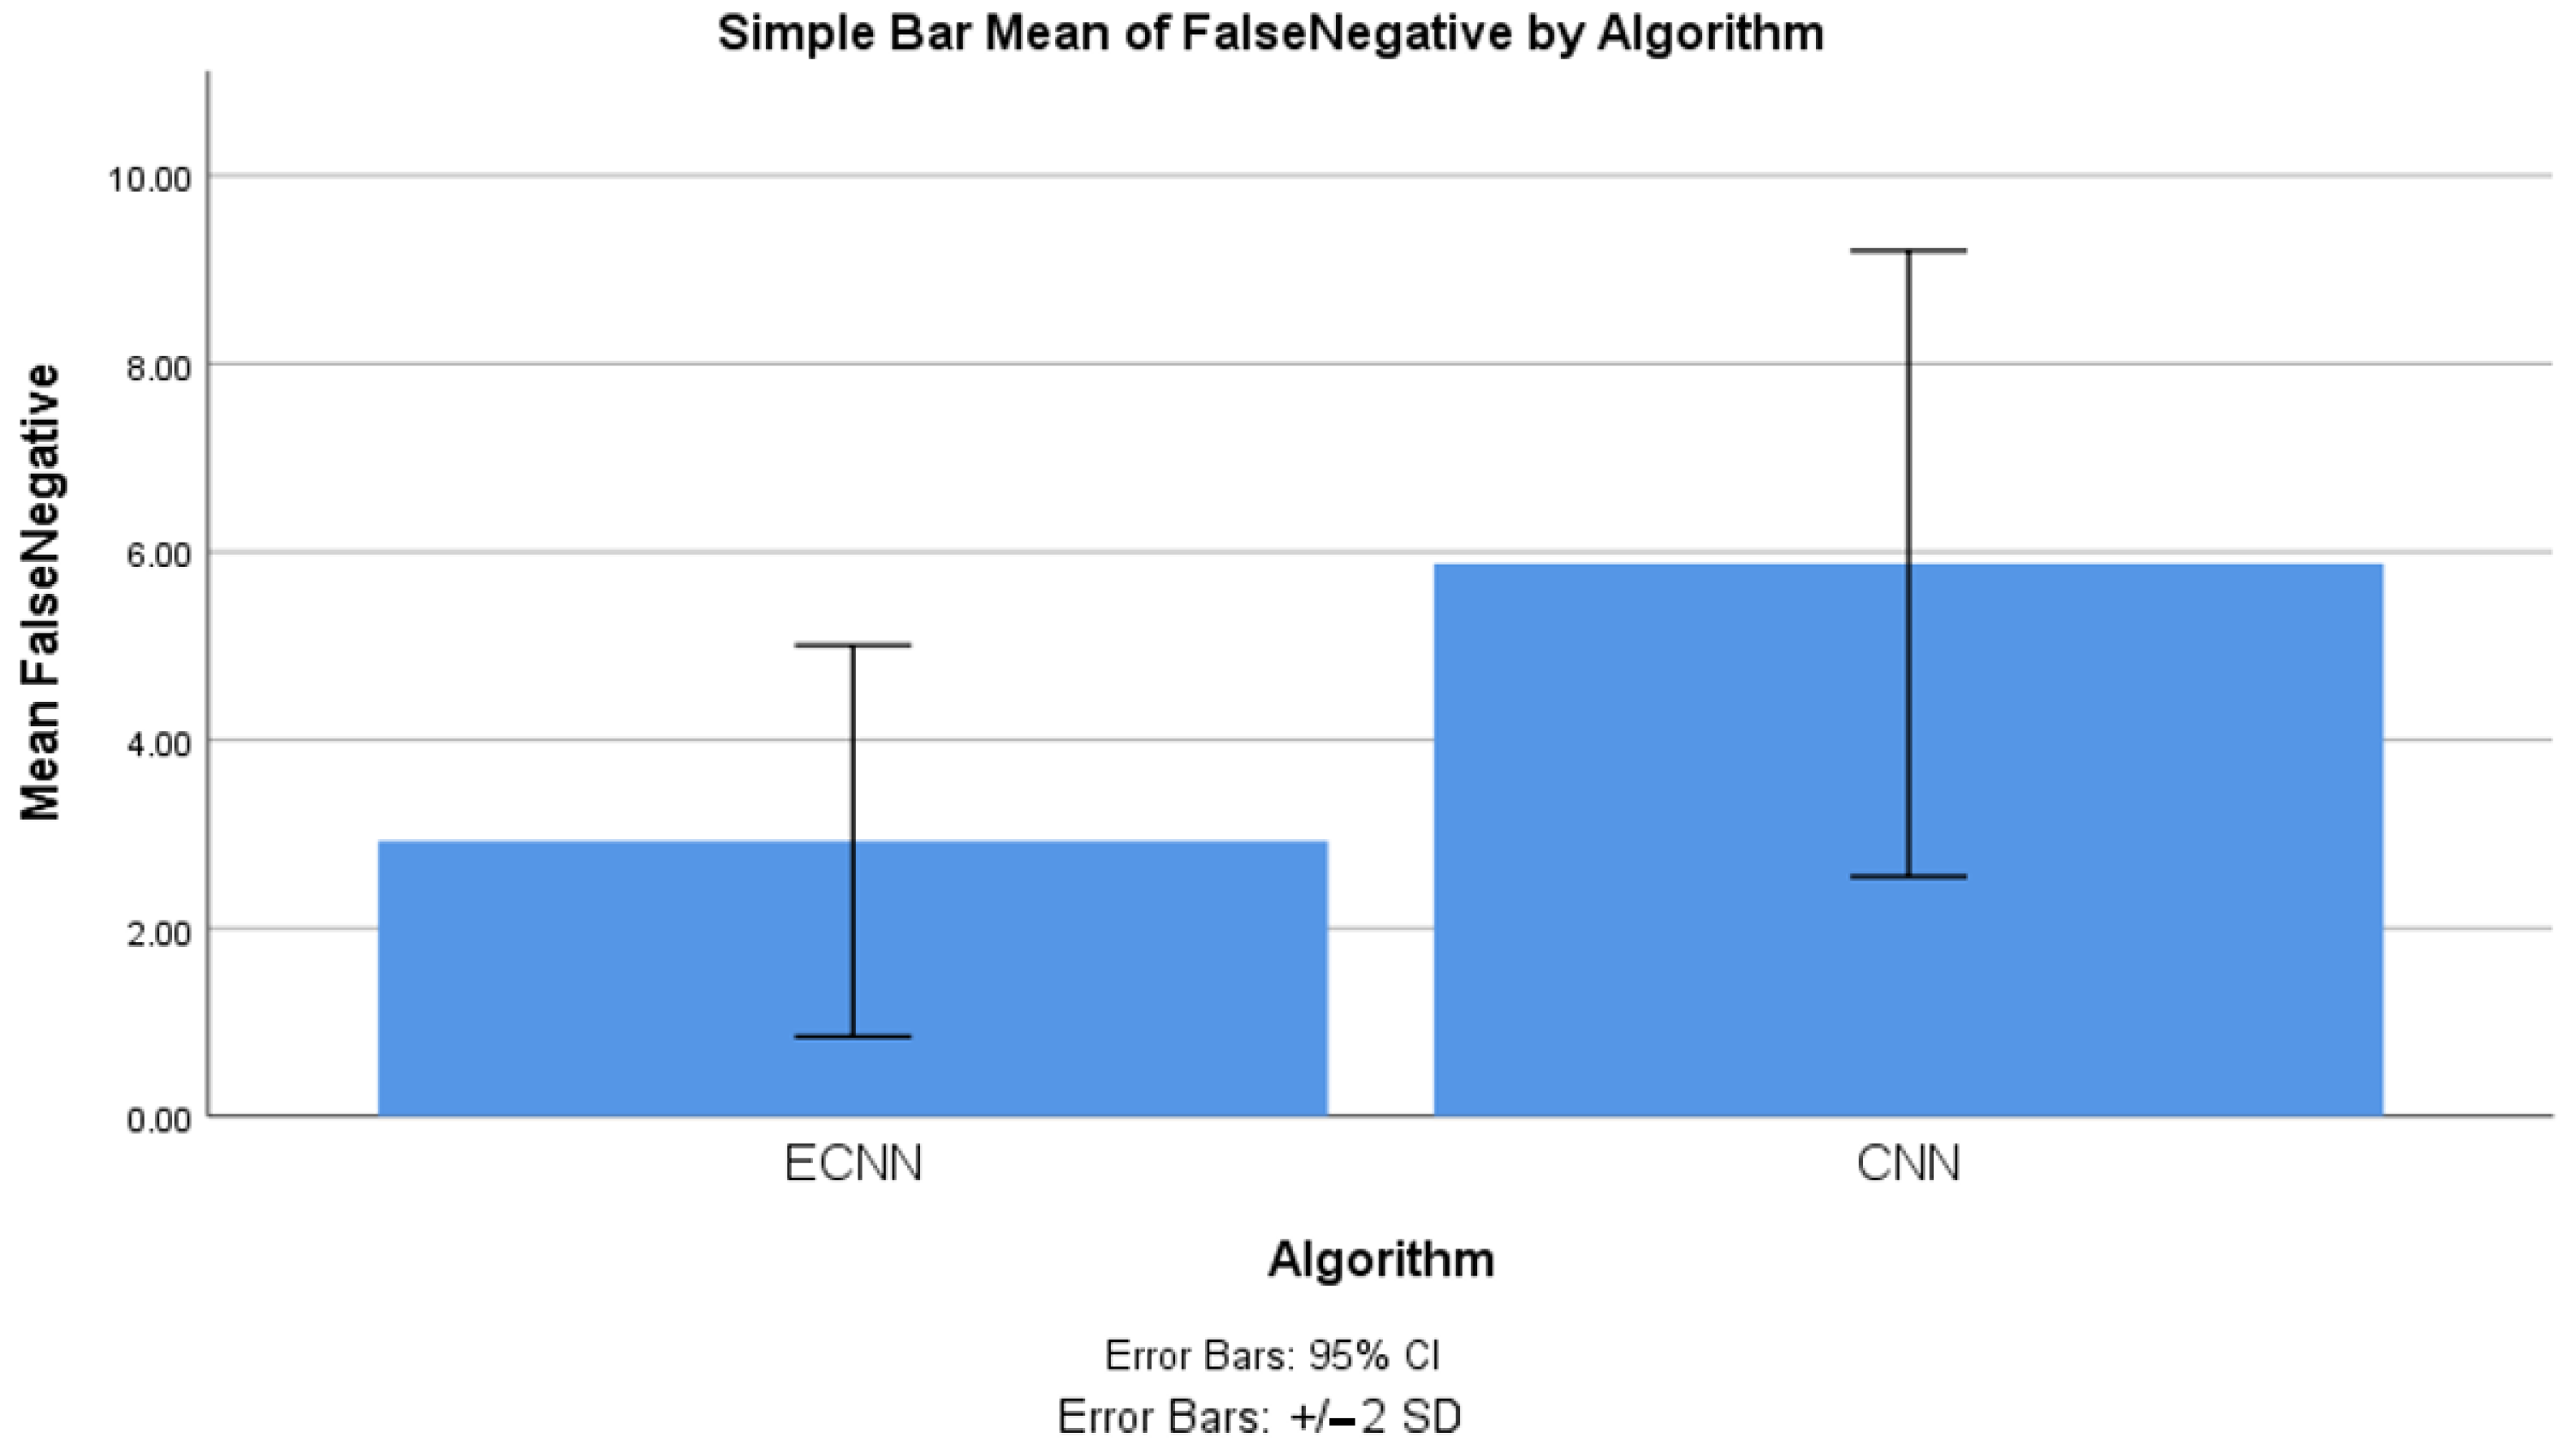
4.4. False Negative between ECNN and CNN

Table 10 represents the group statistics information for a false-negative comparison between ECNN and CNN algorithms. The mean false negative for the ECNN algorithm is 2.927% whereas it is 5.875% for the CNN algorithm. Likewise, the standard deviation and standard error mean are also comparatively less with ECNN than with the CNN algorithm.
Table 10. Group statistics parameter comparison for false negative between ECNN and CNN.
Table 11 lists the independent-sample test performance information for false negatives about ECNN and CNN. Here the significance value for comparison is 0.082 which is slightly higher than 0.05. Hence it has been concluded that ECNN appears to be better than CNN. From this table, it is observed that the value for equal variance assumed and not assumed is better for ECNN than for the CNN algorithm.
Table 11. Independent-sample test significance computation between ECNN and CNN for false negative.
Figure 10 shows a mean false-negative comparison between ECNN and CNN with confidence interval 95% and standard deviation ±2, and Figure 11 illustrates the comparative results of all four performance parameters’ values.
Figure 10. Mean false-negative comparison.
Figure 11. Performance comparisons between ECNN and CNN.

5. Discussion

Experiment-generated performance values for accuracy, precision, false positives and false negatives are noted. These noted values are used to conduct statistical analysis. This test has generated group statistics tables, independent-sample test tables, graphs of accuracy, precision, and false-positive and false-negative performance measures. The video dataset of 3008 videos was iterated 10 times. From this dataset [20] 80% were trained and 20% were tested. The observation was made as follows from 10 iterations and cross-validation. The ECNN algorithm mean accuracy, mean precision, mean false-positive, and mean false-negative rates are observed as 97.050%, 96.743%, 2.957%, and 2.927%, respectively, and these performance values are comparatively greater than the CNN algorithm mean accuracy, mean precision, mean false-positive, and mean false-negative rates, and their values are 93.555%, 93.875%, 6.325%, and 5.875%, respectively. The significant difference between ECNN and CNN for accuracy, precision, false positive, and false negative is 0.237, 0.345, 0.116, and 0.082, respectively. With this significance value when compared with the alpha value of 0.05, it is very clear that the ECNN algorithm appears to be better than the CNN algorithm.
If the accuracy is compared with the DNN algorithm [5] 91.3% on the CCTV dataset, it is very clear that the proposed ECNN accuracy is better. A study on suspicious activity by humans [9] measured an accuracy of only 90.00%; hence, almost 8% is more than the proposed work. Another work with 2D CNN was applied to the CAVIAR dataset in educational institution surveillance systems and it produced 87.15% accuracy, again almost 11% more than the proposed ECNN. Table 12 lists various suspicious-activity detection algorithms’ accuracy, including the proposed ECNN algorithm.
Table 12. Accuracy comparison of proposed ECNN with various existing methods.
In fact, in this work, dataset [20] has been used. For different methods of suspicious-action detection, the dataset is different. In the future, it has been decided to use a different variety of datasets to get performance measures. The factors affecting the performance of this proposed algorithm are more untrained human-action detection due to crowded objects. This enhanced CNN algorithm would take slightly more complex data when compared to the CNN algorithm. If the number of iterations is increasing then the performance parameters’ values are also increasing. Even though various ML algorithms like SVM, DT, and KNN are used for suspicious-action detection, to gain more performance, DL and unsupervised algorithms are used nowadays.

6. Conclusions

The need for this proposed ECNN is to measure the performance of suspicious-action detection like shooting and stealing from surveillance video datasets. The performance parameters used to measure the conducted experiment were accuracy, precision, false-positive rate, and false-negative rate. The proposed method’s accuracy, precision, false-positive rate, and false-negative rate were 98.38%, 98.54%, 1.25%, and 1.66%. The mean performance measures were also calculated with the SPSS tool. The ECNN algorithm’s mean accuracy, mean precision, mean false-positive rate, and mean false-negative rate were observed as 97.050%, 96.743%, 2.957%, and 2.927%, respectively. Hence this experiment concludes that ECNN performance measures are comparatively better than the CNN performance measures and this proposed method of ECNN achieved novelty.
This work in the future can be extended to implement in the real world a fully autonomous system for suspicious-action detection by establishing surveillance cameras in suspected places. When the video data is captured in reality, this mechanism will be detected immediately and in consequence action can be taken immediately.

Author Contributions

Conceptualization, E.S. and M.A.; methodology, E.S. and G.K.; software, N.M.B. and R.K.; validation, R.K., C.W. and A.A.K.; formal analysis, C.W.; investigation, E.S. and M.A.; resources, G.K.; data curation, K.T.; writing—original draft preparation, E.S., M.A. and G.K.; writing—review and editing, N.M.B. and R.K.; supervision, C.W. and A.A.K.; project administration, R.K.; funding acquisition, C.W. and A.A.K. All authors have read and agreed to the published version of the manuscript.

Funding

This research is supported by the Department of Computer Science, College of Computing, Khon Kaen University, Khon Kaen, Thailand.

Acknowledgments

We are deeply grateful to the Department of Computer Science, College of Computing, Khon Kaen University, Khon Kaen, Thailand for helping us to conduct this study.

Conflicts of Interest

The authors declare no conflict of interest.

References

  1. Bouma, H.; Baan, J.; Burghouts, G.J.; Eendebak, P.; Van Huis, J.R.; Dijk, J.; Van Rest, J.H.C. Rest Automatic detection of suspicious behavior of pickpockets with track-based features in a shopping mall. In Optics and Photonics for Counterterrorism, Crime Fighting, and Defence X; and Optical Materials and Biomaterials in Security and Defence Systems Technology XI; SPIE: Washington, DC, USA, 2014; Volume 9253. [Google Scholar] [CrossRef]
  2. Bouma, H.; Schutte, K.; Hove, J.-M.T.; Burghouts, G.J.; Baan, J. Flexible human-definable automatic behavior analysis for suspicious activity detection in surveillance cameras to protect critical infrastructures. In Counterterrorism, Crime Fighting, Forensics, and Surveillance Technologies II; SPIE: Washington, DC, USA, 2018; Volume 108020N. [Google Scholar] [CrossRef]
  3. Kadam, P.; Gawande, S.; Thorat, A.; Mule, R. Suspicious Activity Detection using Image Processing. J. Sci. Technol. 2021, 6, 114–119. [Google Scholar] [CrossRef]
  4. Scaria, E.; Aby Abahai, T.; Isaac, E. Suspicious Activity Detection in Surveillance Video using Discriminative Deep Belief Network. Int. J. Control Theory Appl. 2016, 9, 1–7. [Google Scholar]
  5. Loganathan, S.; Kariyawasam, G.; Sumathipala, P. Suspicious Activity Detection in Surveillance Footage. In Proceedings of the 2019 International Conference on Electrical and Computing Technologies and Applications (ICECTA), Ras Al Khaimah, United Arab Emirates, 19–21 November 2019; pp. 1–4. [Google Scholar] [CrossRef]
  6. Bora, T.S.; Rokade, M.D. Human suspicious activity detection system using CNN model for video surveillance. Int. J. Adv. Res. Innov. Ideas Educ. 2021, 7, 688–694. [Google Scholar]
  7. Shivthare, K.V.; Bhujbal, P.D.; Darekar, A.P. Suspicious activity detection network for video surveillance using machine learning. Int. J. Adv. Sci. Res. Eng. Trends 2021, 6, 88–90. [Google Scholar]
  8. Elhamod, M.; Levine, M.D. Automated Real-Time Detection of Potentially Suspicious Behavior in Public Transport Areas. IEEE Trans. Intell. Transp. Syst. 2013, 14, 688–699. [Google Scholar] [CrossRef]
  9. Alavudeen Basha, A.; Parthasarathy, P.; Vivekanandan, S. Detection of Suspicious Human Activity based on CNN-DBNN Algorithm for Video Surveillance Applications. In Innovations in Power and Advanced Computing Technologies (i-PACT); IEEE: Toulouse, France, 2019; pp. 1–7. [Google Scholar] [CrossRef]
  10. Amrutha, C.; Jyotsna, C.; Amudha, J. Deep Learning Approach for Suspicious Activity Detection from Surveillance Video. In Proceedings of the 2nd International Conference on Innovative Mechanisms for Industry Applications (ICIMIA), Bangalore, India, 5–7 March 2020; pp. 335–339. [Google Scholar] [CrossRef]
  11. Singh, V.; Singh, S.; Gupta, P. Real-Time Anomaly Recognition Through CCTV Using Neural Networks. Procedia Comput. Sci. 2020, 173, 254–263. [Google Scholar] [CrossRef]
  12. Saba, T.; Rehman, A.; Latif, R.; Fati, S.M.; Raza, M.; Sharif, M. Suspicious Activity Recognition Using Proposed Deep L4-Branched-Actionnet with Entropy Coded Ant Colony System Optimization. In IEEE Access; IEEE: Toulouse, France, 2021; Volume 9, pp. 89181–89197. [Google Scholar] [CrossRef]
  13. Mehmood, A. LightAnomalyNet: A Lightweight Framework for Efficient Abnormal Behavior Detection. Sensors 2021, 21, 8501. [Google Scholar] [CrossRef] [PubMed]
  14. Martínez-Mascorro, G.A.; Abreu-Pederzini, J.R.; Ortiz-Bayliss, J.C.; Garcia-Collantes, A.; Terashima-Marín, H. Criminal Intention Detection at Early Stages of Shoplifting Cases by Using 3D Convolutional Neural Networks. Computation 2021, 9, 24. [Google Scholar] [CrossRef]
  15. Phyo, C.N.; Zin, T.T.; Tin, P. Deep Learning for Recognizing Human Activities Using Motions of Skeletal Joints. IEEE Trans. Consum. Electron. 2019, 65, 243–252. [Google Scholar] [CrossRef]
  16. Ramzan, M.; Abid, A.; Khan, H.U.; Awan, S.M.; Ismail, A.; Ahmed, M.; Ilyas, M.; Mahmood, A. A Review on State-of-the-Art Violence Detection Techniques. In IEEE Access; IEEE: Toulouse, France, 2019; Volume 7, pp. 107560–107575. [Google Scholar] [CrossRef]
  17. Ullah, F.U.M.; Muhammad, K.; Haq, I.U.; Khan, N.; Heidari, A.A.; Baik, S.W.; de Albuquerque, V. AI-Assisted Edge Vision for Violence Detection in IoT-Based Industrial Surveillance Networks. IEEE Trans. Ind. Inform. 2022, 18, 5359–5370. [Google Scholar] [CrossRef]
  18. Zhang, T.; Aftab, W.; Mihaylova, L.; Langran-Wheeler, C.; Rigby, S.; Fletcher, D.; Maddock, S.; Bosworth, G. Recent Advances in Video Analytics for Rail Network Surveillance for Security, Trespass and Suicide Prevention—A Survey. Sensors 2022, 22, 4324. [Google Scholar] [CrossRef]
  19. Sharma, V.; Gupta, M.; Pandey, A.K.; Mishra, D.; Kumar, A. A Review of Deep Learning-based Human Activity Recognition on Benchmark Video Datasets. Appl. Artif. Intell. 2022, 36, 2093705. [Google Scholar] [CrossRef]
  20. Sultani, W.; Chen, C.; Shah, M. Real-world anomaly detection in surveillance videos. In Proceedings of the IEEE Conference on Computer Vision and Pattern Recognition; Center for Research in Computer Vision (CRCV); IEEE: Toulouse, France, 2018; pp. 1–10. [Google Scholar]
  21. Available online: https://docs.opencv.org/3.4/d0/da7/videoio_overview.html (accessed on 6 September 2022).
  22. Lee, D.-G.; Suk, H.-I.; Park, S.-K.; Lee, S.-W. Motion Influence Map for Unusual Human Activity Detection and Localization in Crowded Scenes. In IEEE Transactions on Circuits and Systems for Video Technology; IEEE: Toulouse, France, 2015; Volume 25, pp. 1612–1623. [Google Scholar] [CrossRef]
  23. Rolando Jesus Cardenas, T.; César, A. Beltrán Castañón and Juan Carlos Gutiérrez Cáceres. Face Detection on real Low Resolution Surveillance Videos. In Proceedings of the 2nd International Conference on Compute and Data Analysis (ICCDA 2018), DeKalb, IL, USA, 23–25 March 2018; Association for Computing Machinery ACM: New York, NY, USA, 2018; pp. 52–59. [Google Scholar] [CrossRef]
  24. Ayuni, M.N.; Asyraf, Z.M. Moving object detection via TV-L1 optical flow in fall-down videos. Bull. Electr. Eng. Inform. 2019, 8, 839–846. [Google Scholar] [CrossRef]
Publisher’s Note: MDPI stays neutral with regard to jurisdictional claims in published maps and institutional affiliations.

Article Metrics

Citations

Article Access Statistics

Multiple requests from the same IP address are counted as one view.