


A Novel Approach for Emotion Detection and Sentiment Analysis for Low Resource Urdu Language Based on CNN-LSTM

 , , and
Abstract
1. Introduction
- Labelled sentences for ED and SA were collected from the different sites, with additional labels added manually.
- Finally, the five most common emotions in Urdu, which we call Urdu emotion detection (UED), are the focus of our contribution (happiness, sadness, fear, anger, and love). Furthermore, for sentiment analysis, our contribution is to focus on positive and negative sentences.
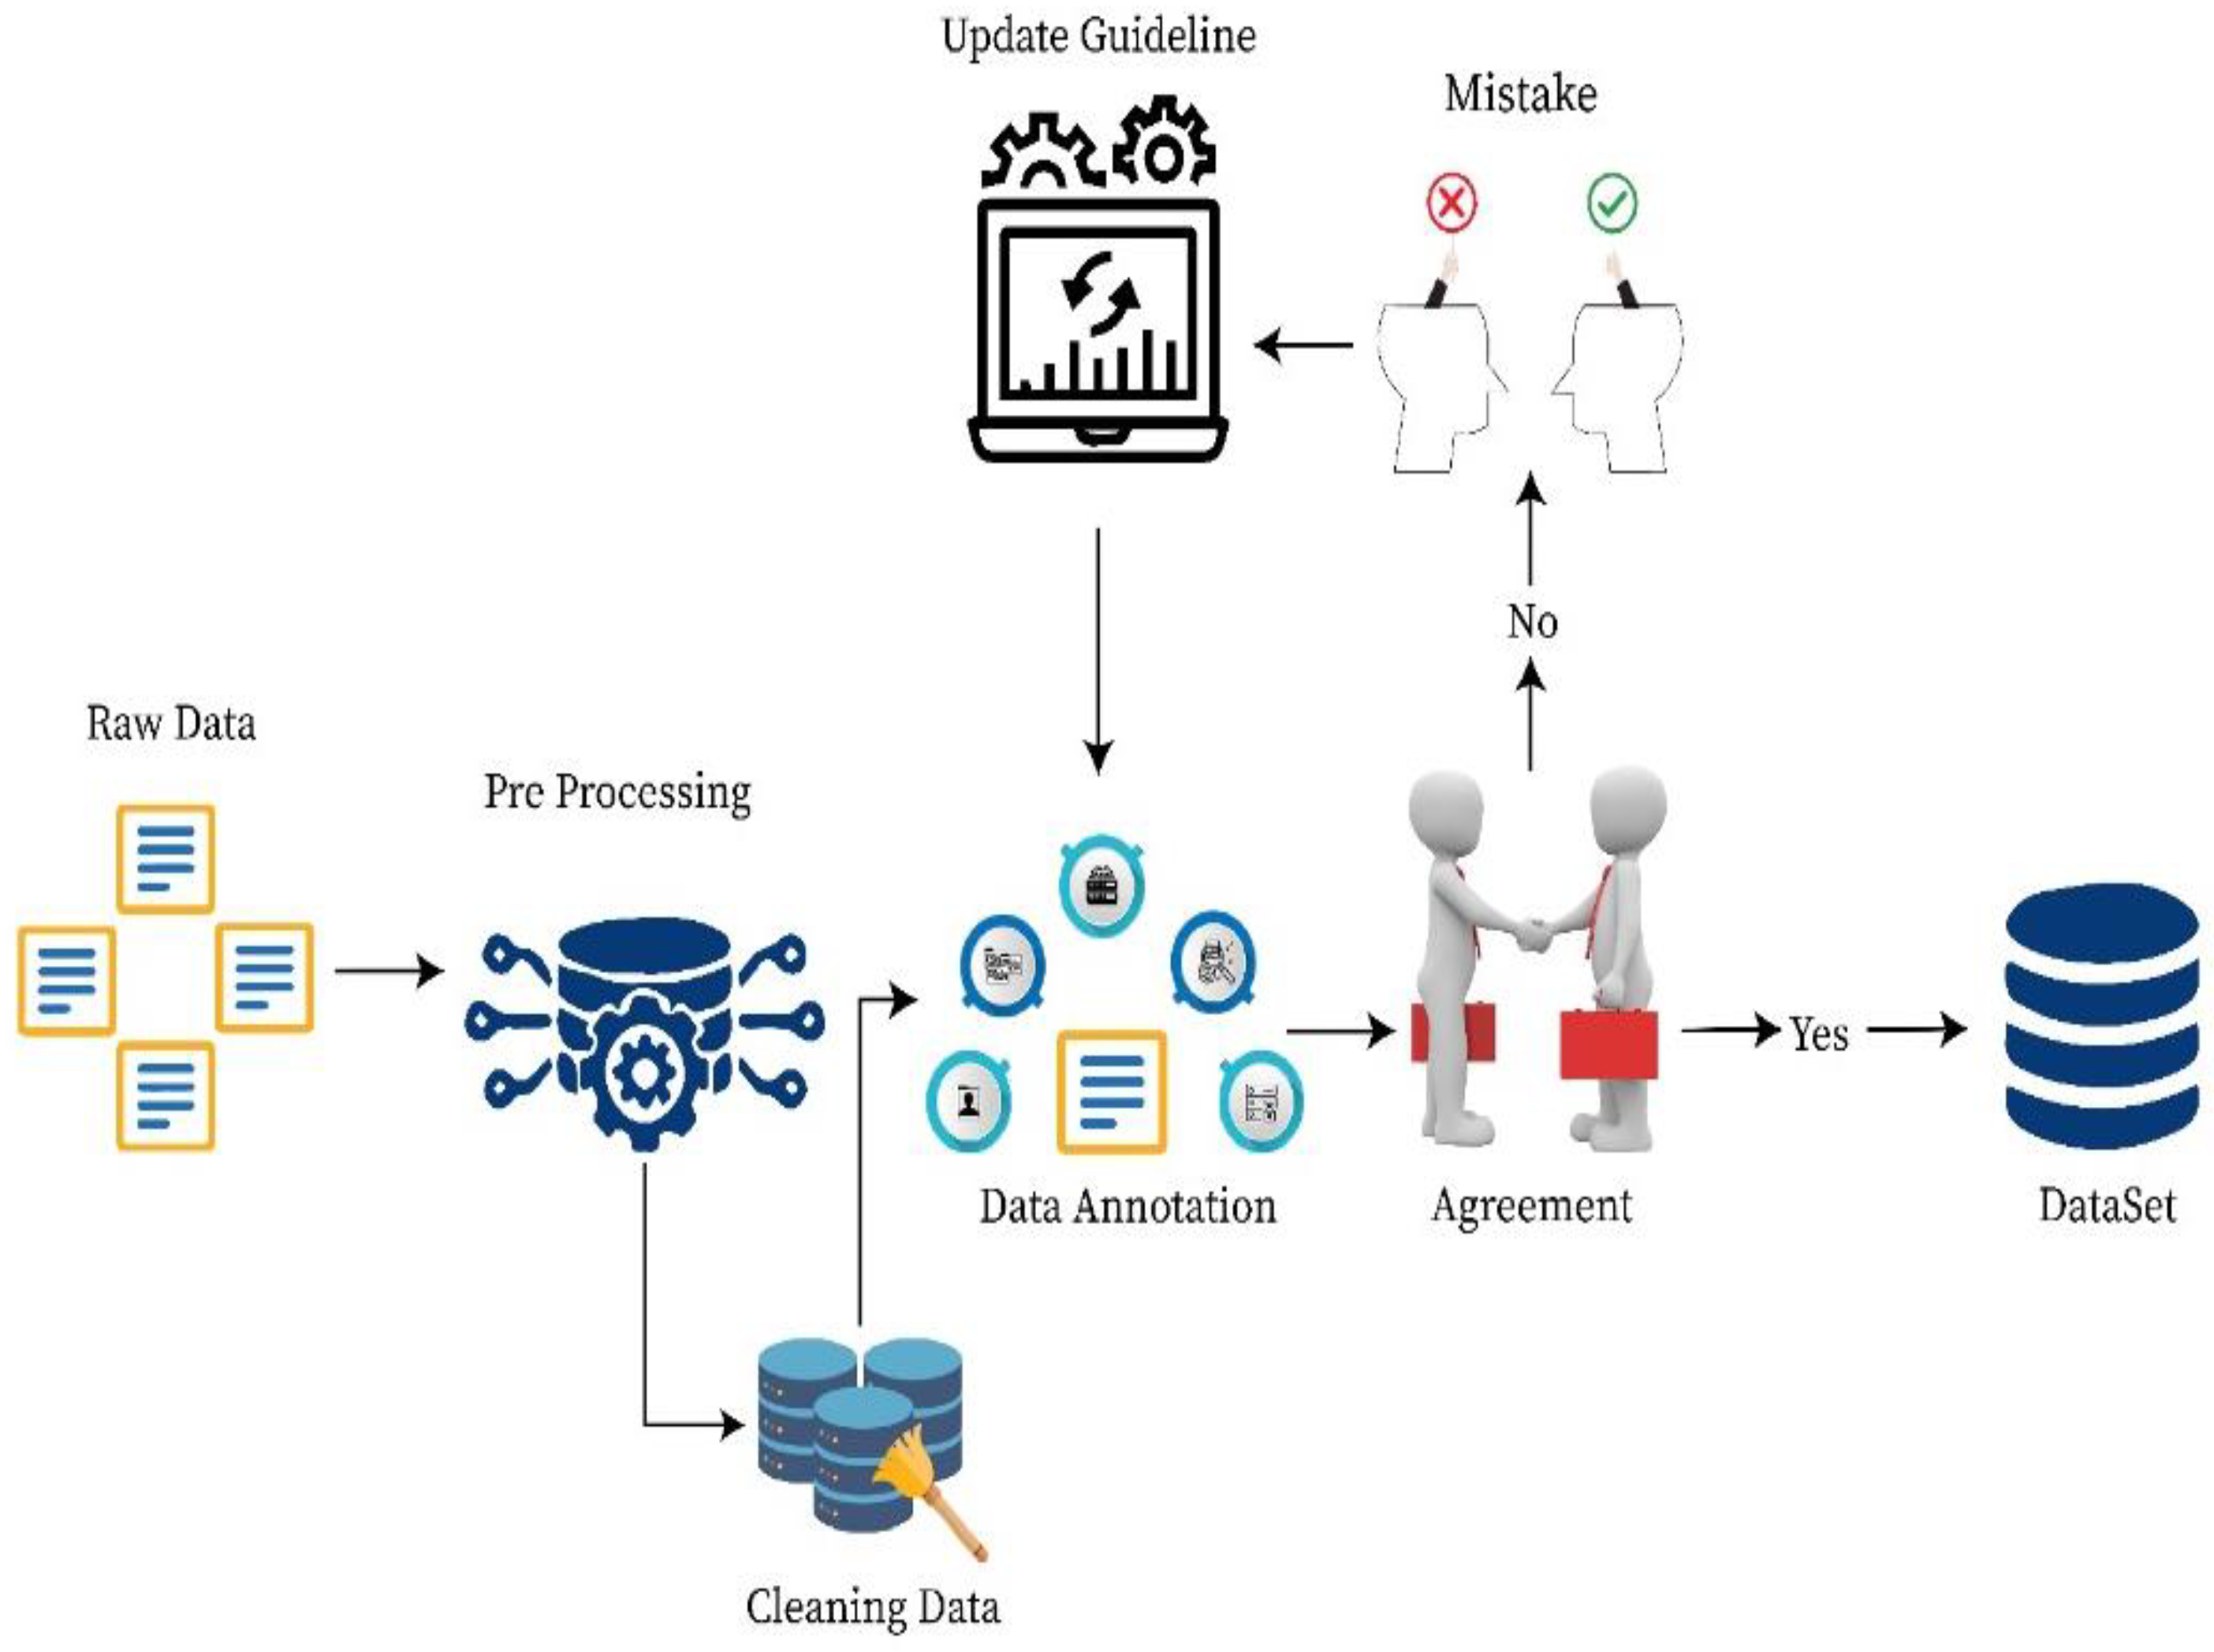
- Quality control of a corpus can be achieved by using an inter-annotator agreement to validate the accuracy of the annotated data.
- A DL-based model for identifying ED and SA in corpora is proposed, as well as a word-embedding method for the corpus.
2. Literature Review
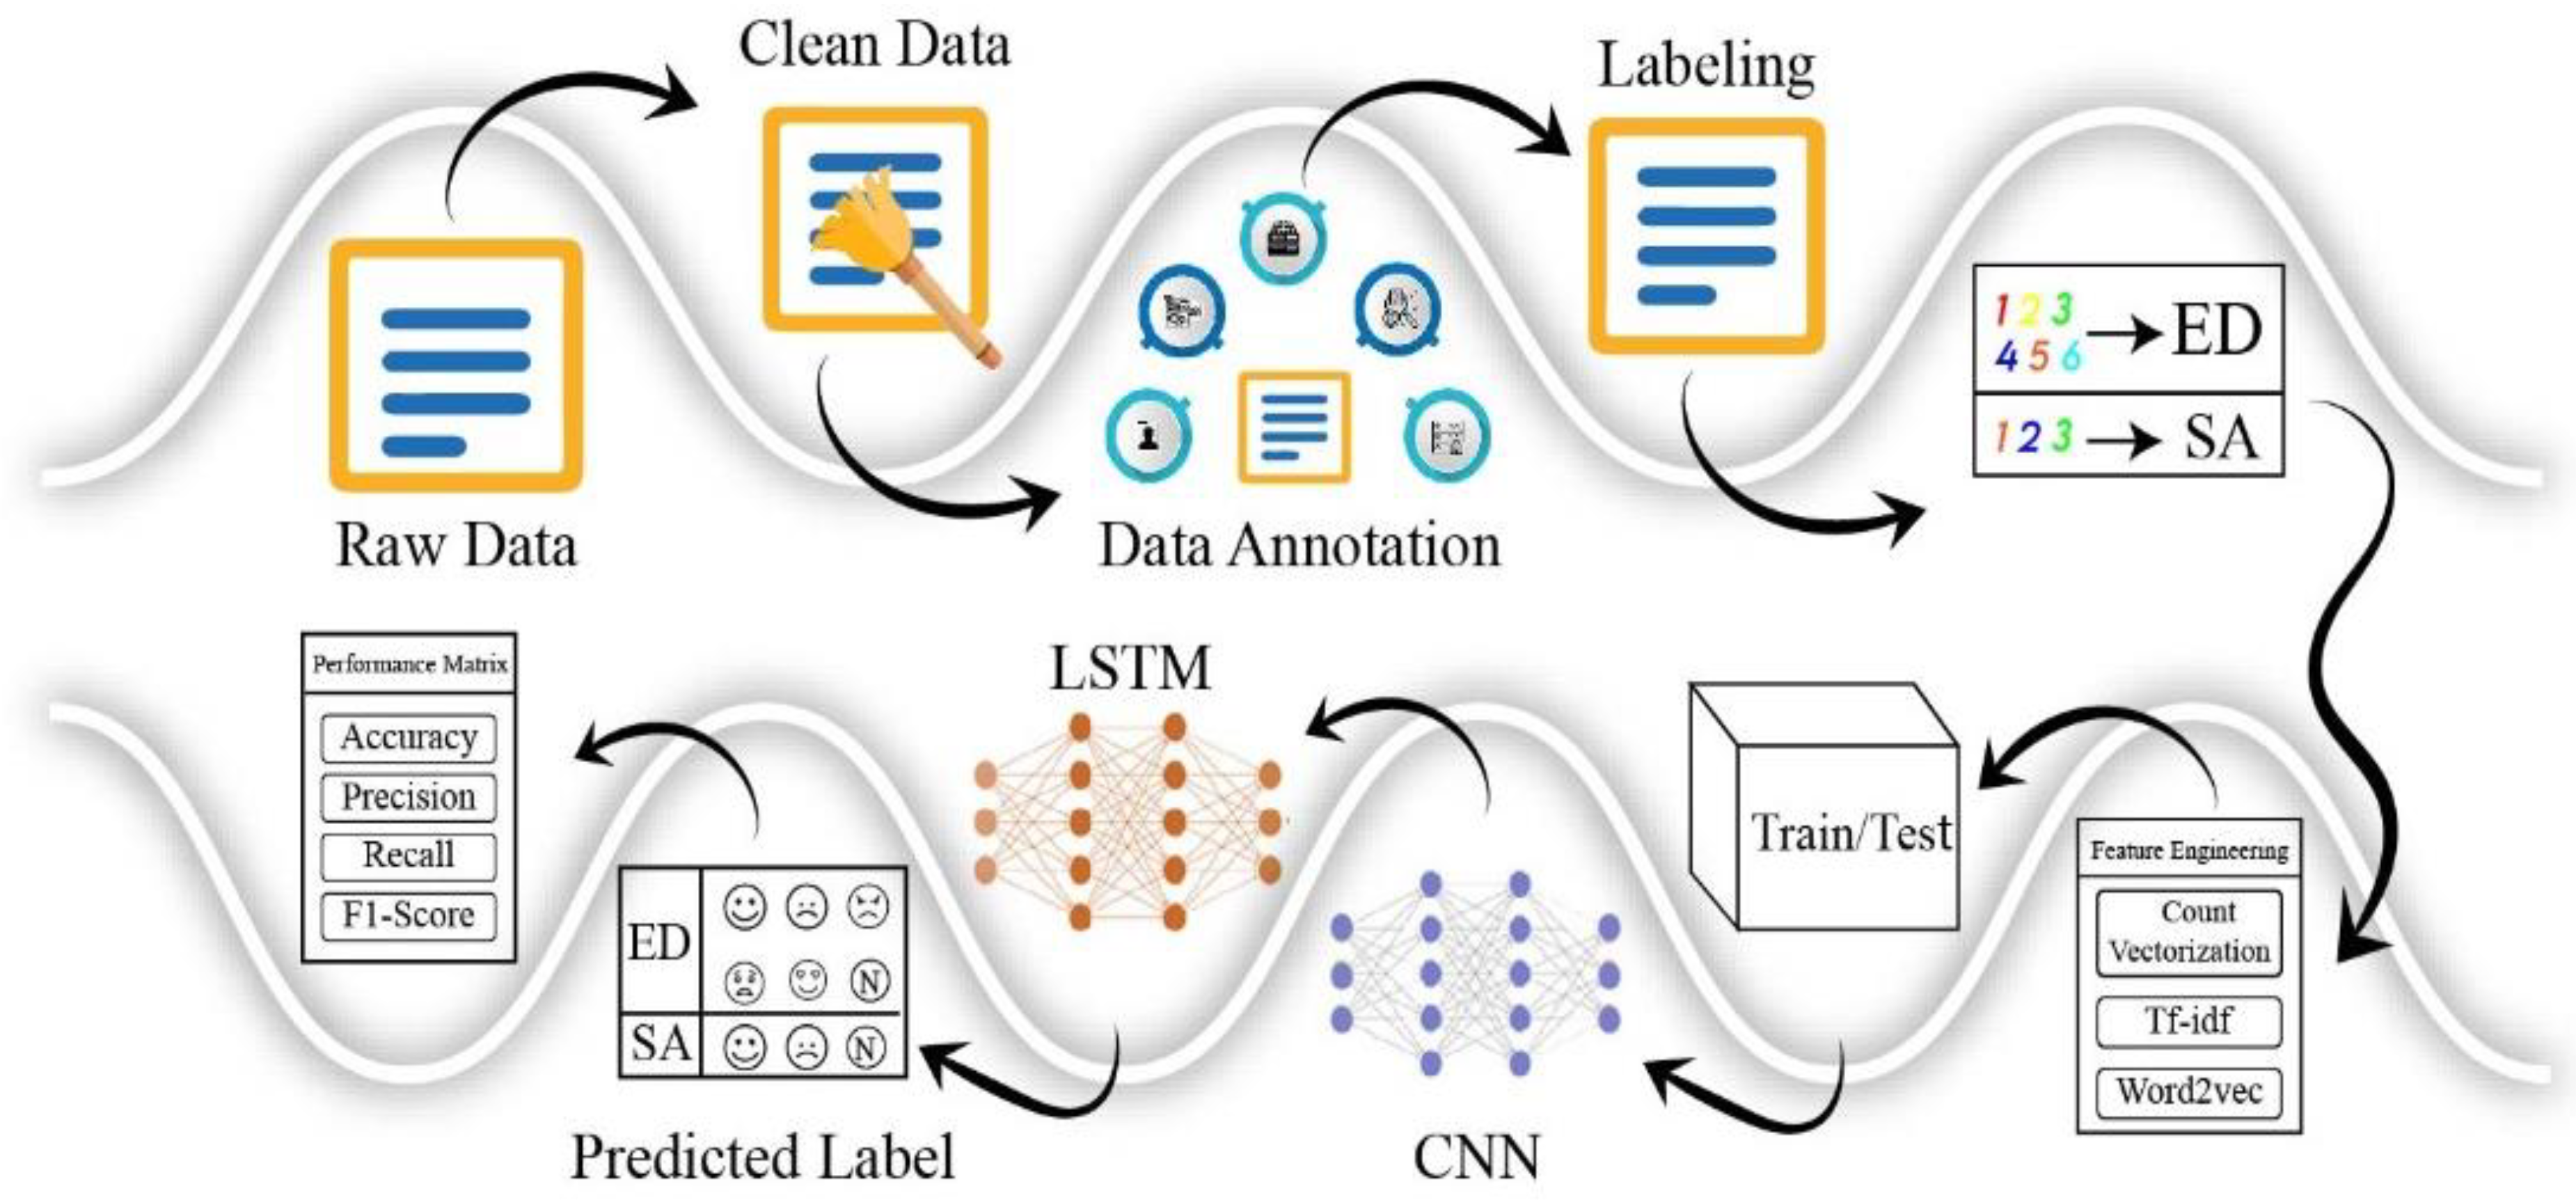
3. Proposed Methodology
3.1. Pre-Processing
3.1.1. Noise Removal
3.1.2. Spelling Uniformity
3.1.3. Space Problem
3.2. Data Annotation
- Assign a class to a given sentence from one of the six categories of emotion described above.
- If the given sentence has no instances of the emotion class, it should be marked as neutral.
- If a sentence is linked to several emotions, then the context determines which emotions are closest.
- Assign a class to a given sentence from one of the three categories of sentiment described above.
- If the given sentence has no instances in the positive or negative class, it should be annotated as neutral.
- The context determines the closest feelings if an example belongs to both defined classes.
3.3. Validation of Corpus
3.4. Feature Extraction
3.5. Convolution Neural Network (CNN)
| Algorithm 1: Proposed Methodology |
| Input: Dataset Frames (DF) |
| Output: Emotion and Sentiment Analysis |
| Begin |
| Procedure Data_Gen (Multiple sources) |
| data ←scrap_data (Sources) |
| if (dataset ≠ empty) |
| if (data == space) |
| then text ←split(data) |
| if ((text == limit-length |
| then sentence ←text |
| Else |
| drop(text) |
| Return |
| Procedure process annotation () |
| url ←website_url |
| ED or SA ←labels Assign |
| Return sentence |
| Procedure (Df)using in Sequence CNN |
| for each T ∈ sentence do |
| Df ←Nt (sentence) |
| Ut ← DR(Df) |
| ED or SA ← CNN (word2vec or Tfidf or CV(T)) |
| Return Feature |
| Procedure classification LSTM |
| for each T ∈ sentence do |
| Feature ← Classification |
| Return Emotion |
| End |
3.6. Long Short-Term Memory
3.7. Optimization Algorithm
| Algorithm 2: Optimization Process |
| Input |
| Step length α; |
| Erate ← β1, β2 ∈ [0, 1); |
| Rf ← μ(τ); |
| Ip ← τ0 |
| Begin |
| t equal of 0 While t0 not meet |
| t = t + 1; |
| Calculatetime ← t: gt = ∇τμt(τt+1) |
| Udeviation ← λt = β1 · λt− 1 + (1 − β1) |
| renovate: τt = τt− 1 − (α/(1 − βt1) ∗ λt/ut |
| Return τt |
| Output parameters τt |
| End |
4. Results and Discussion
4.1. Evaluation Criteria
4.2. Corpus Statistics
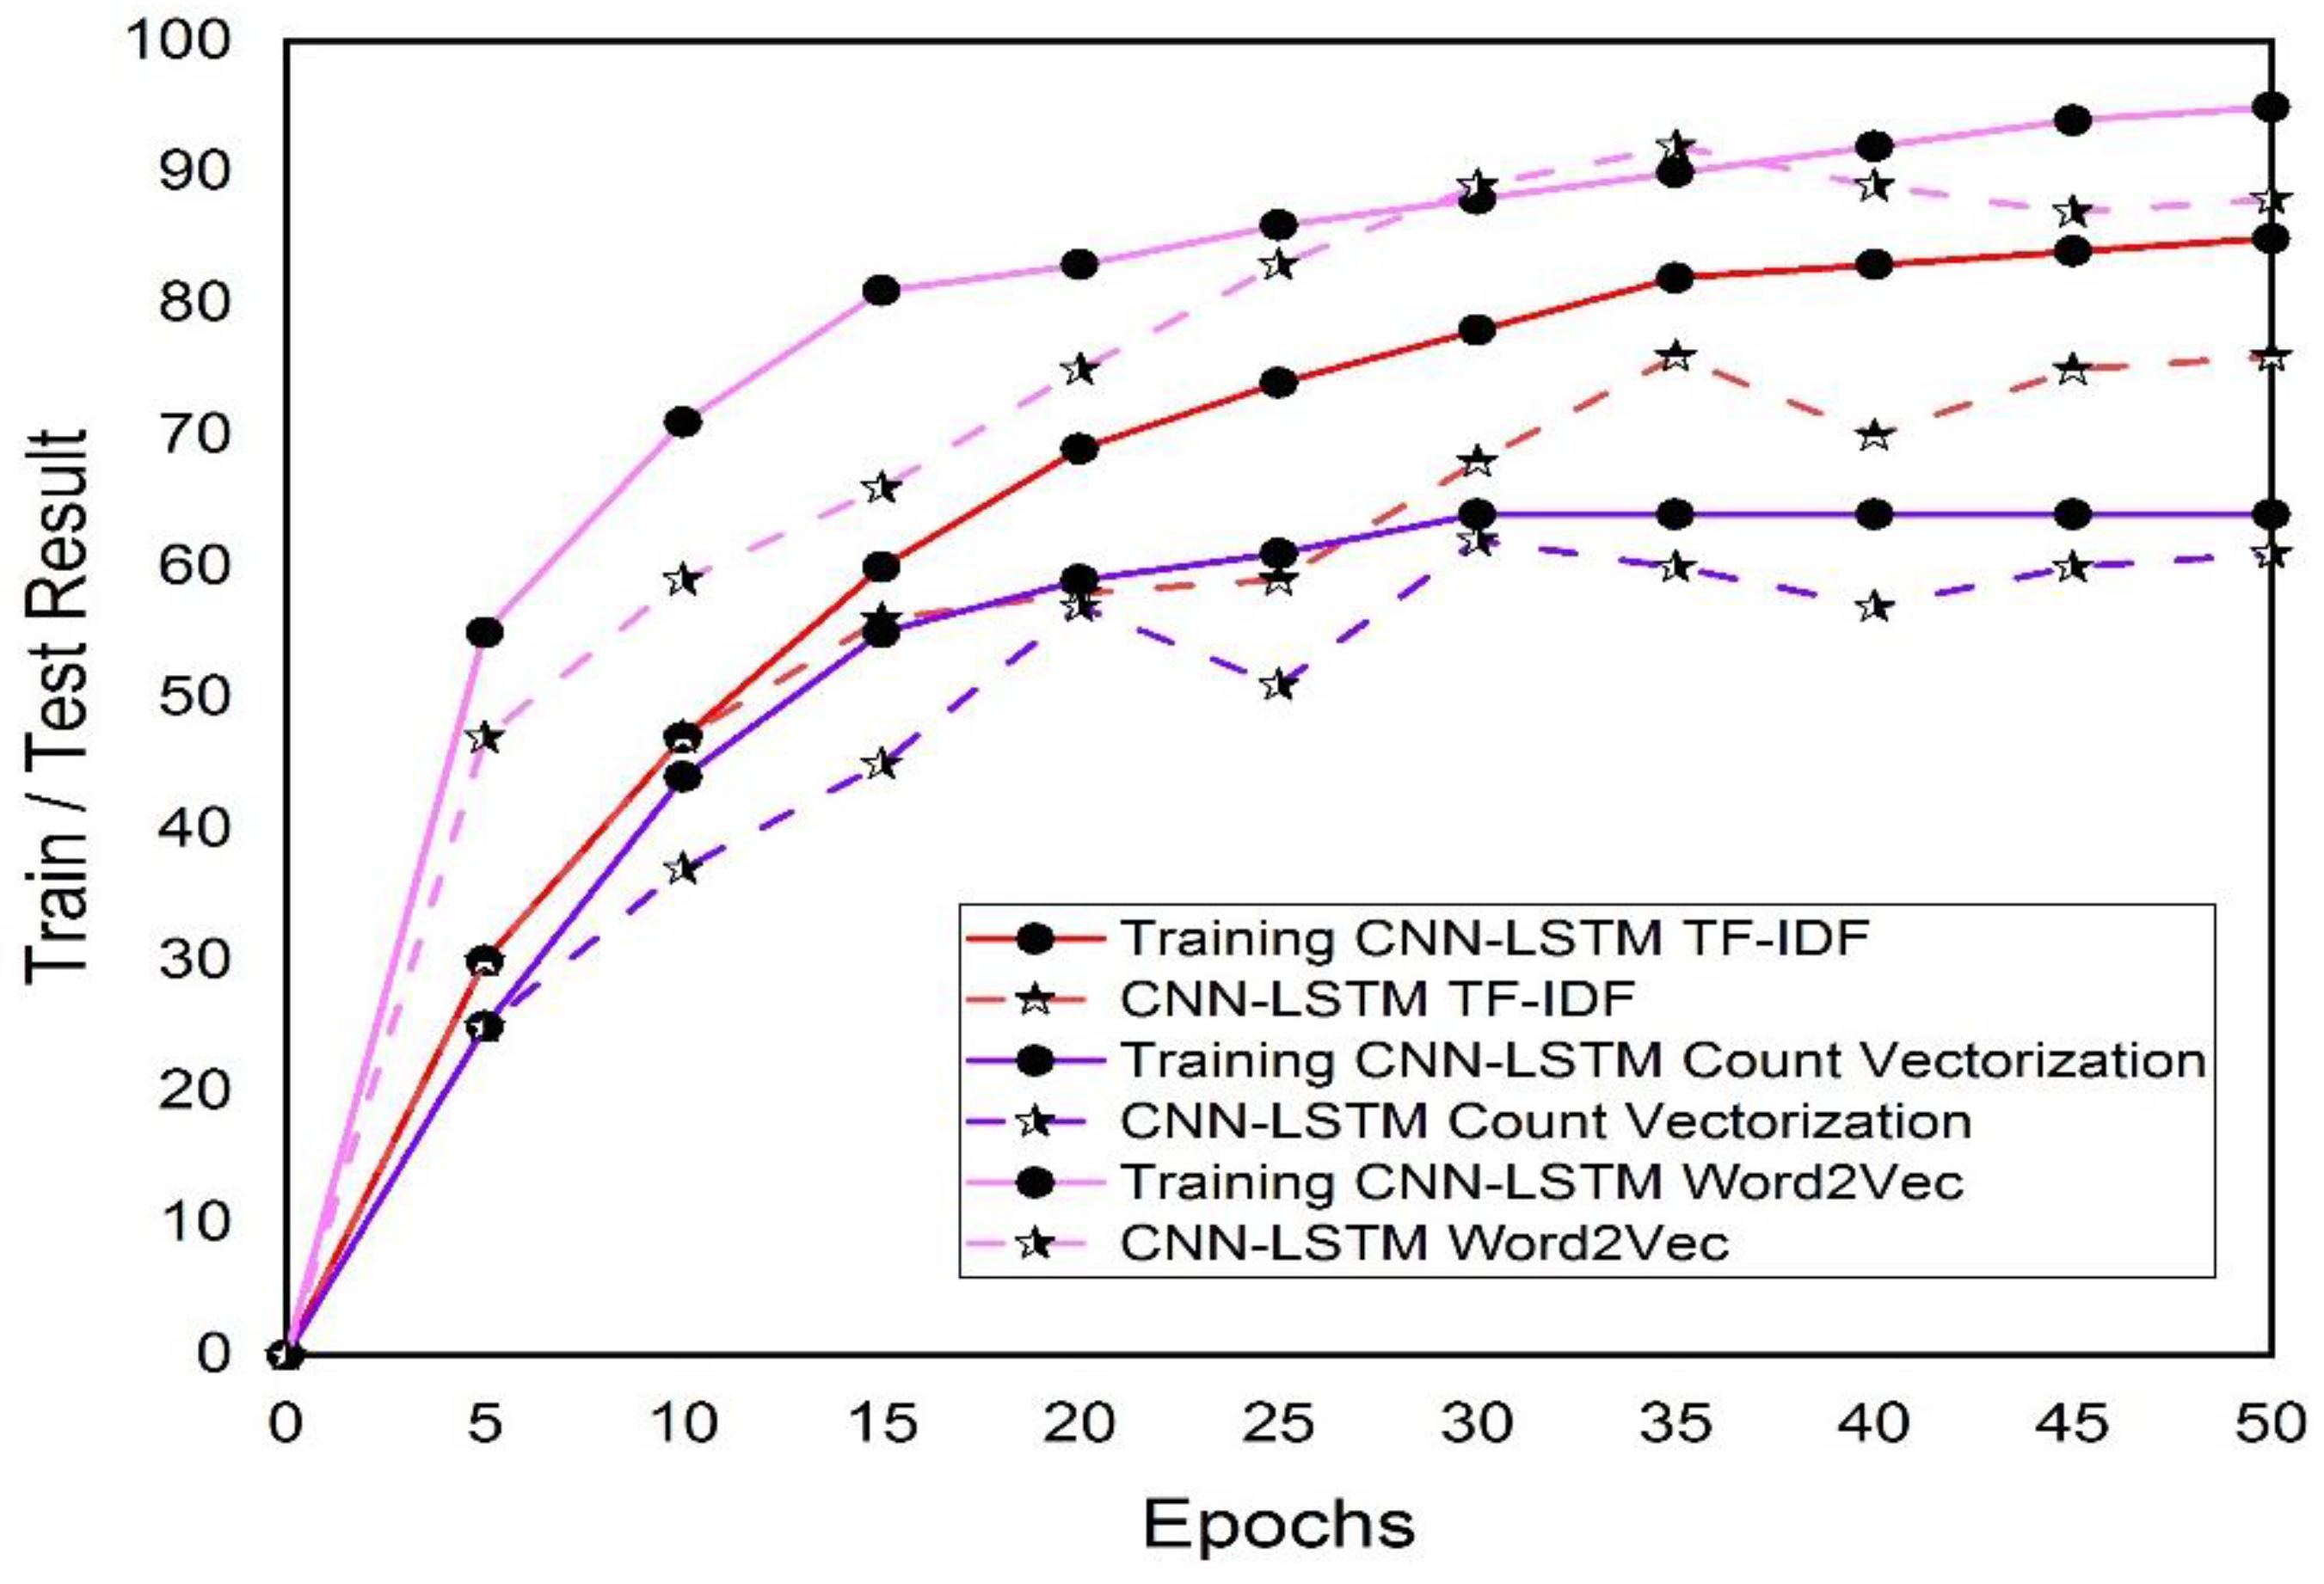
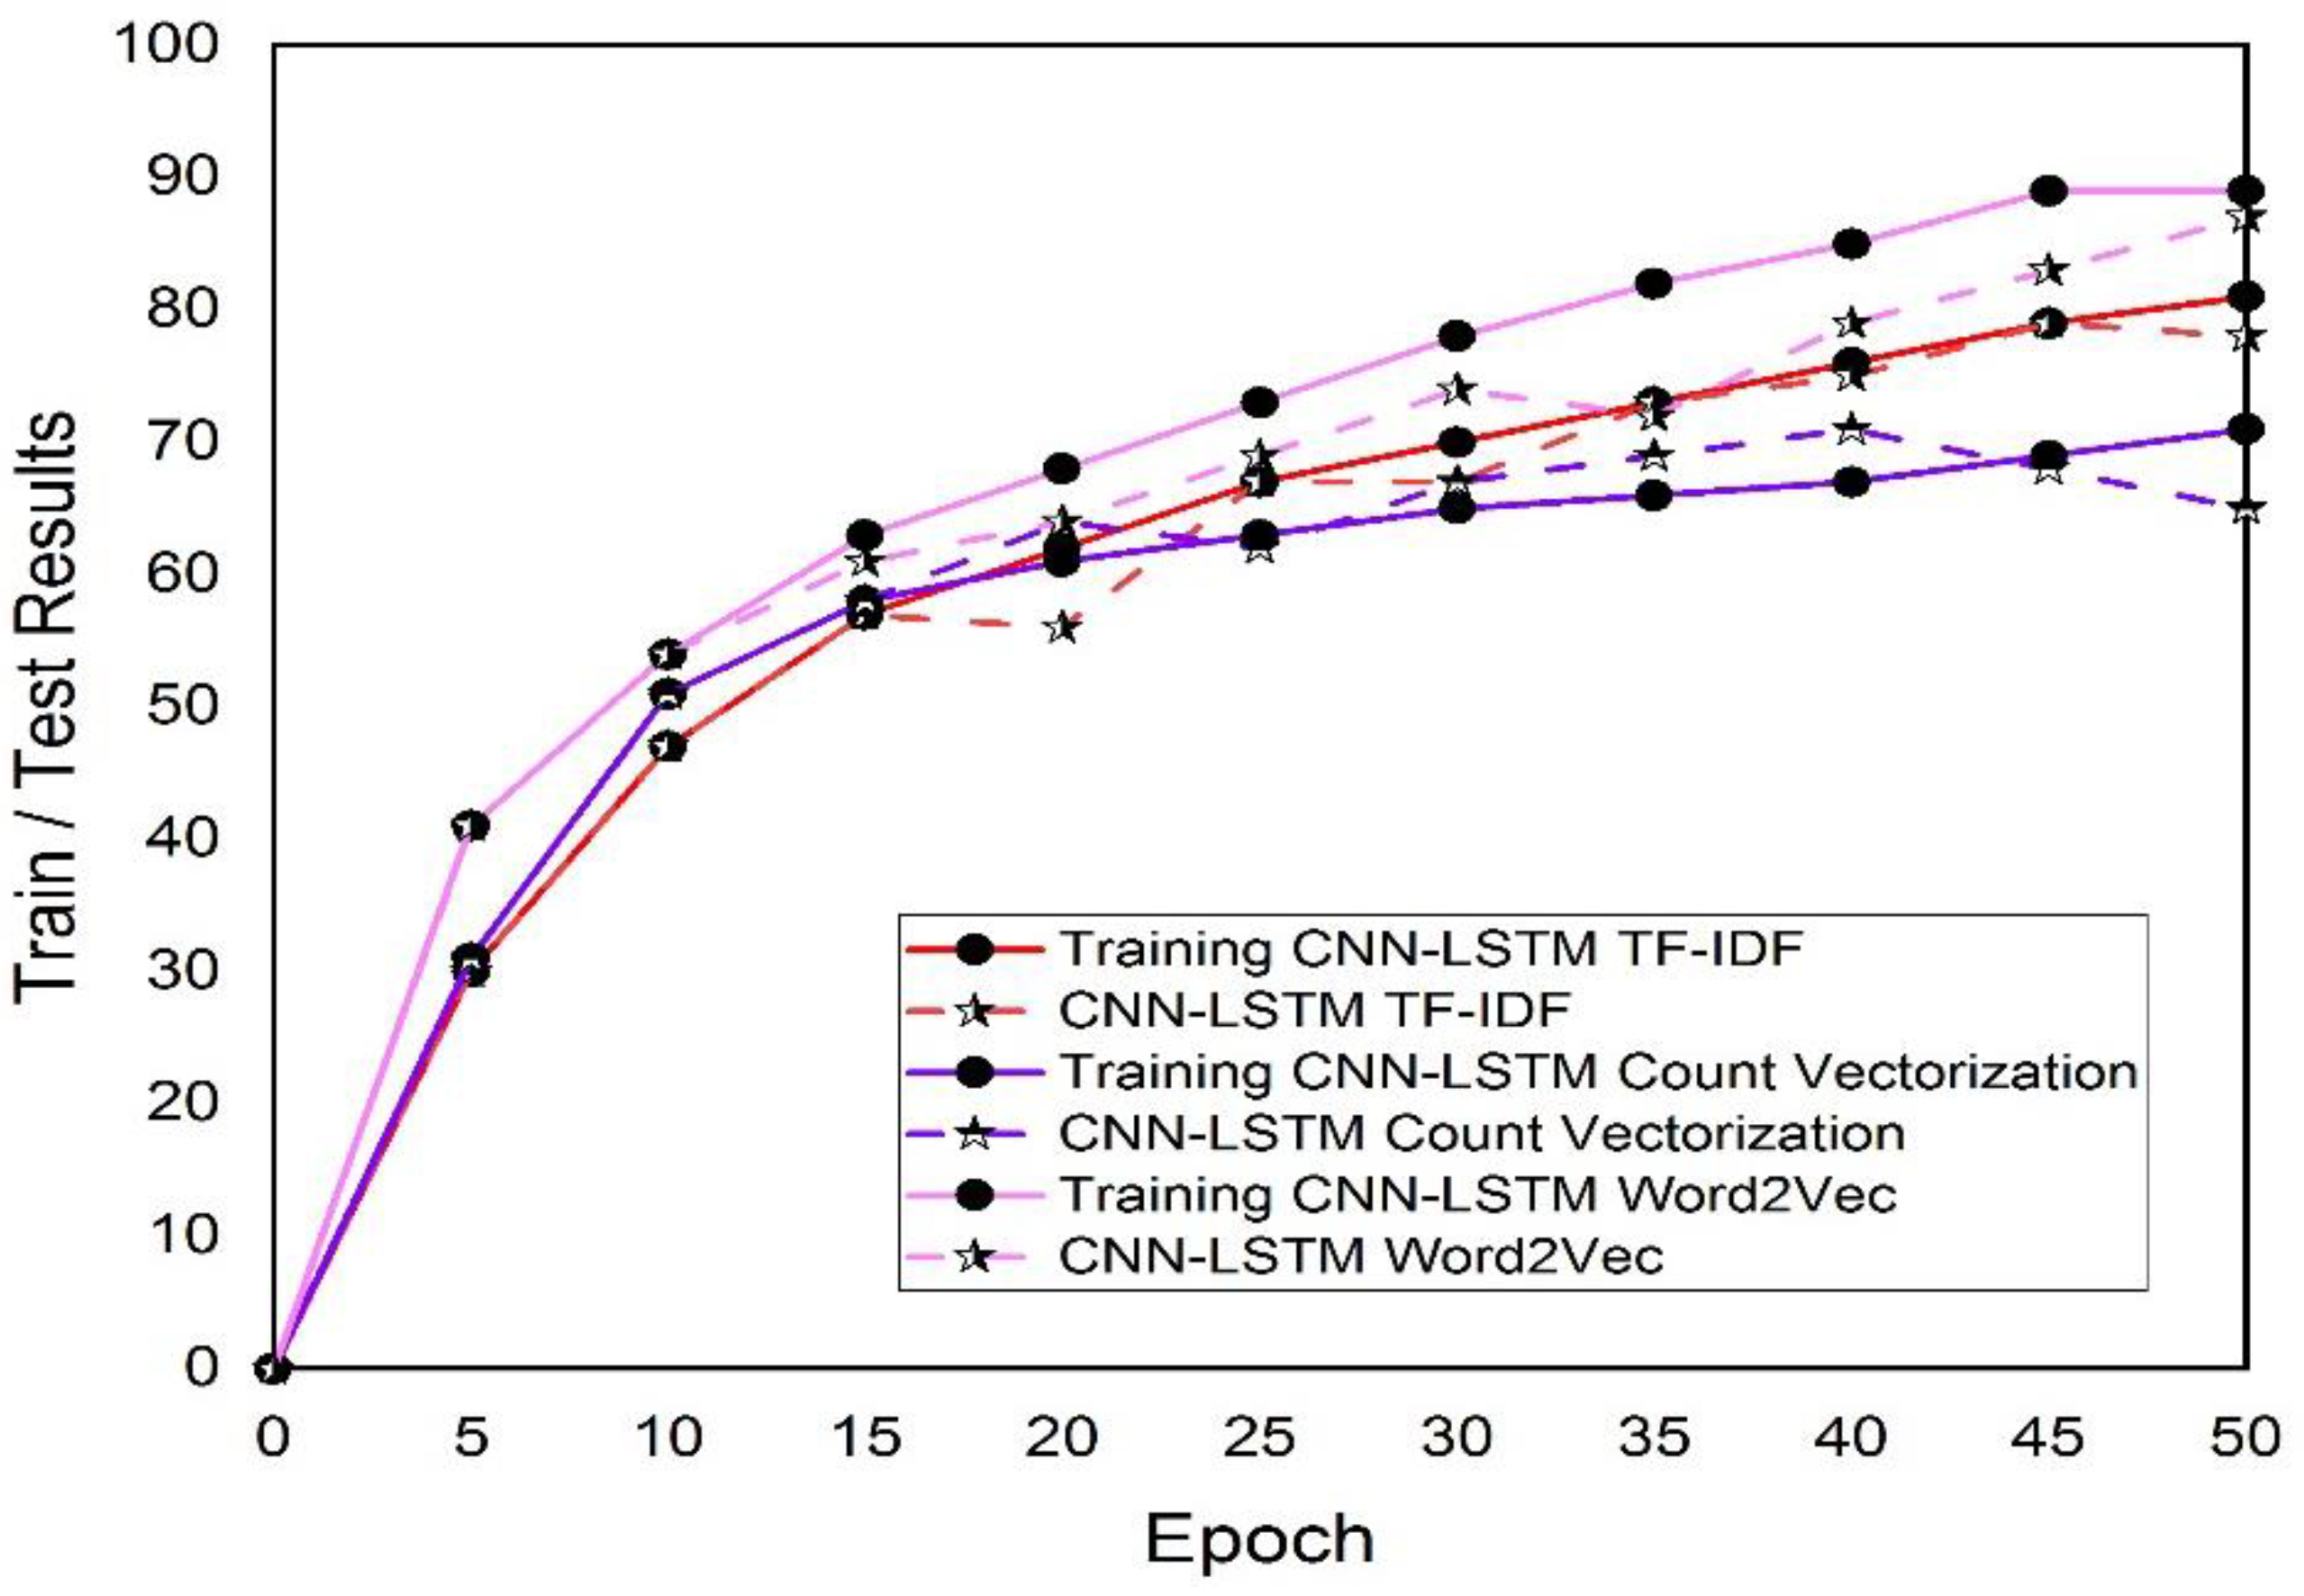
4.3. Model Results on Epoch
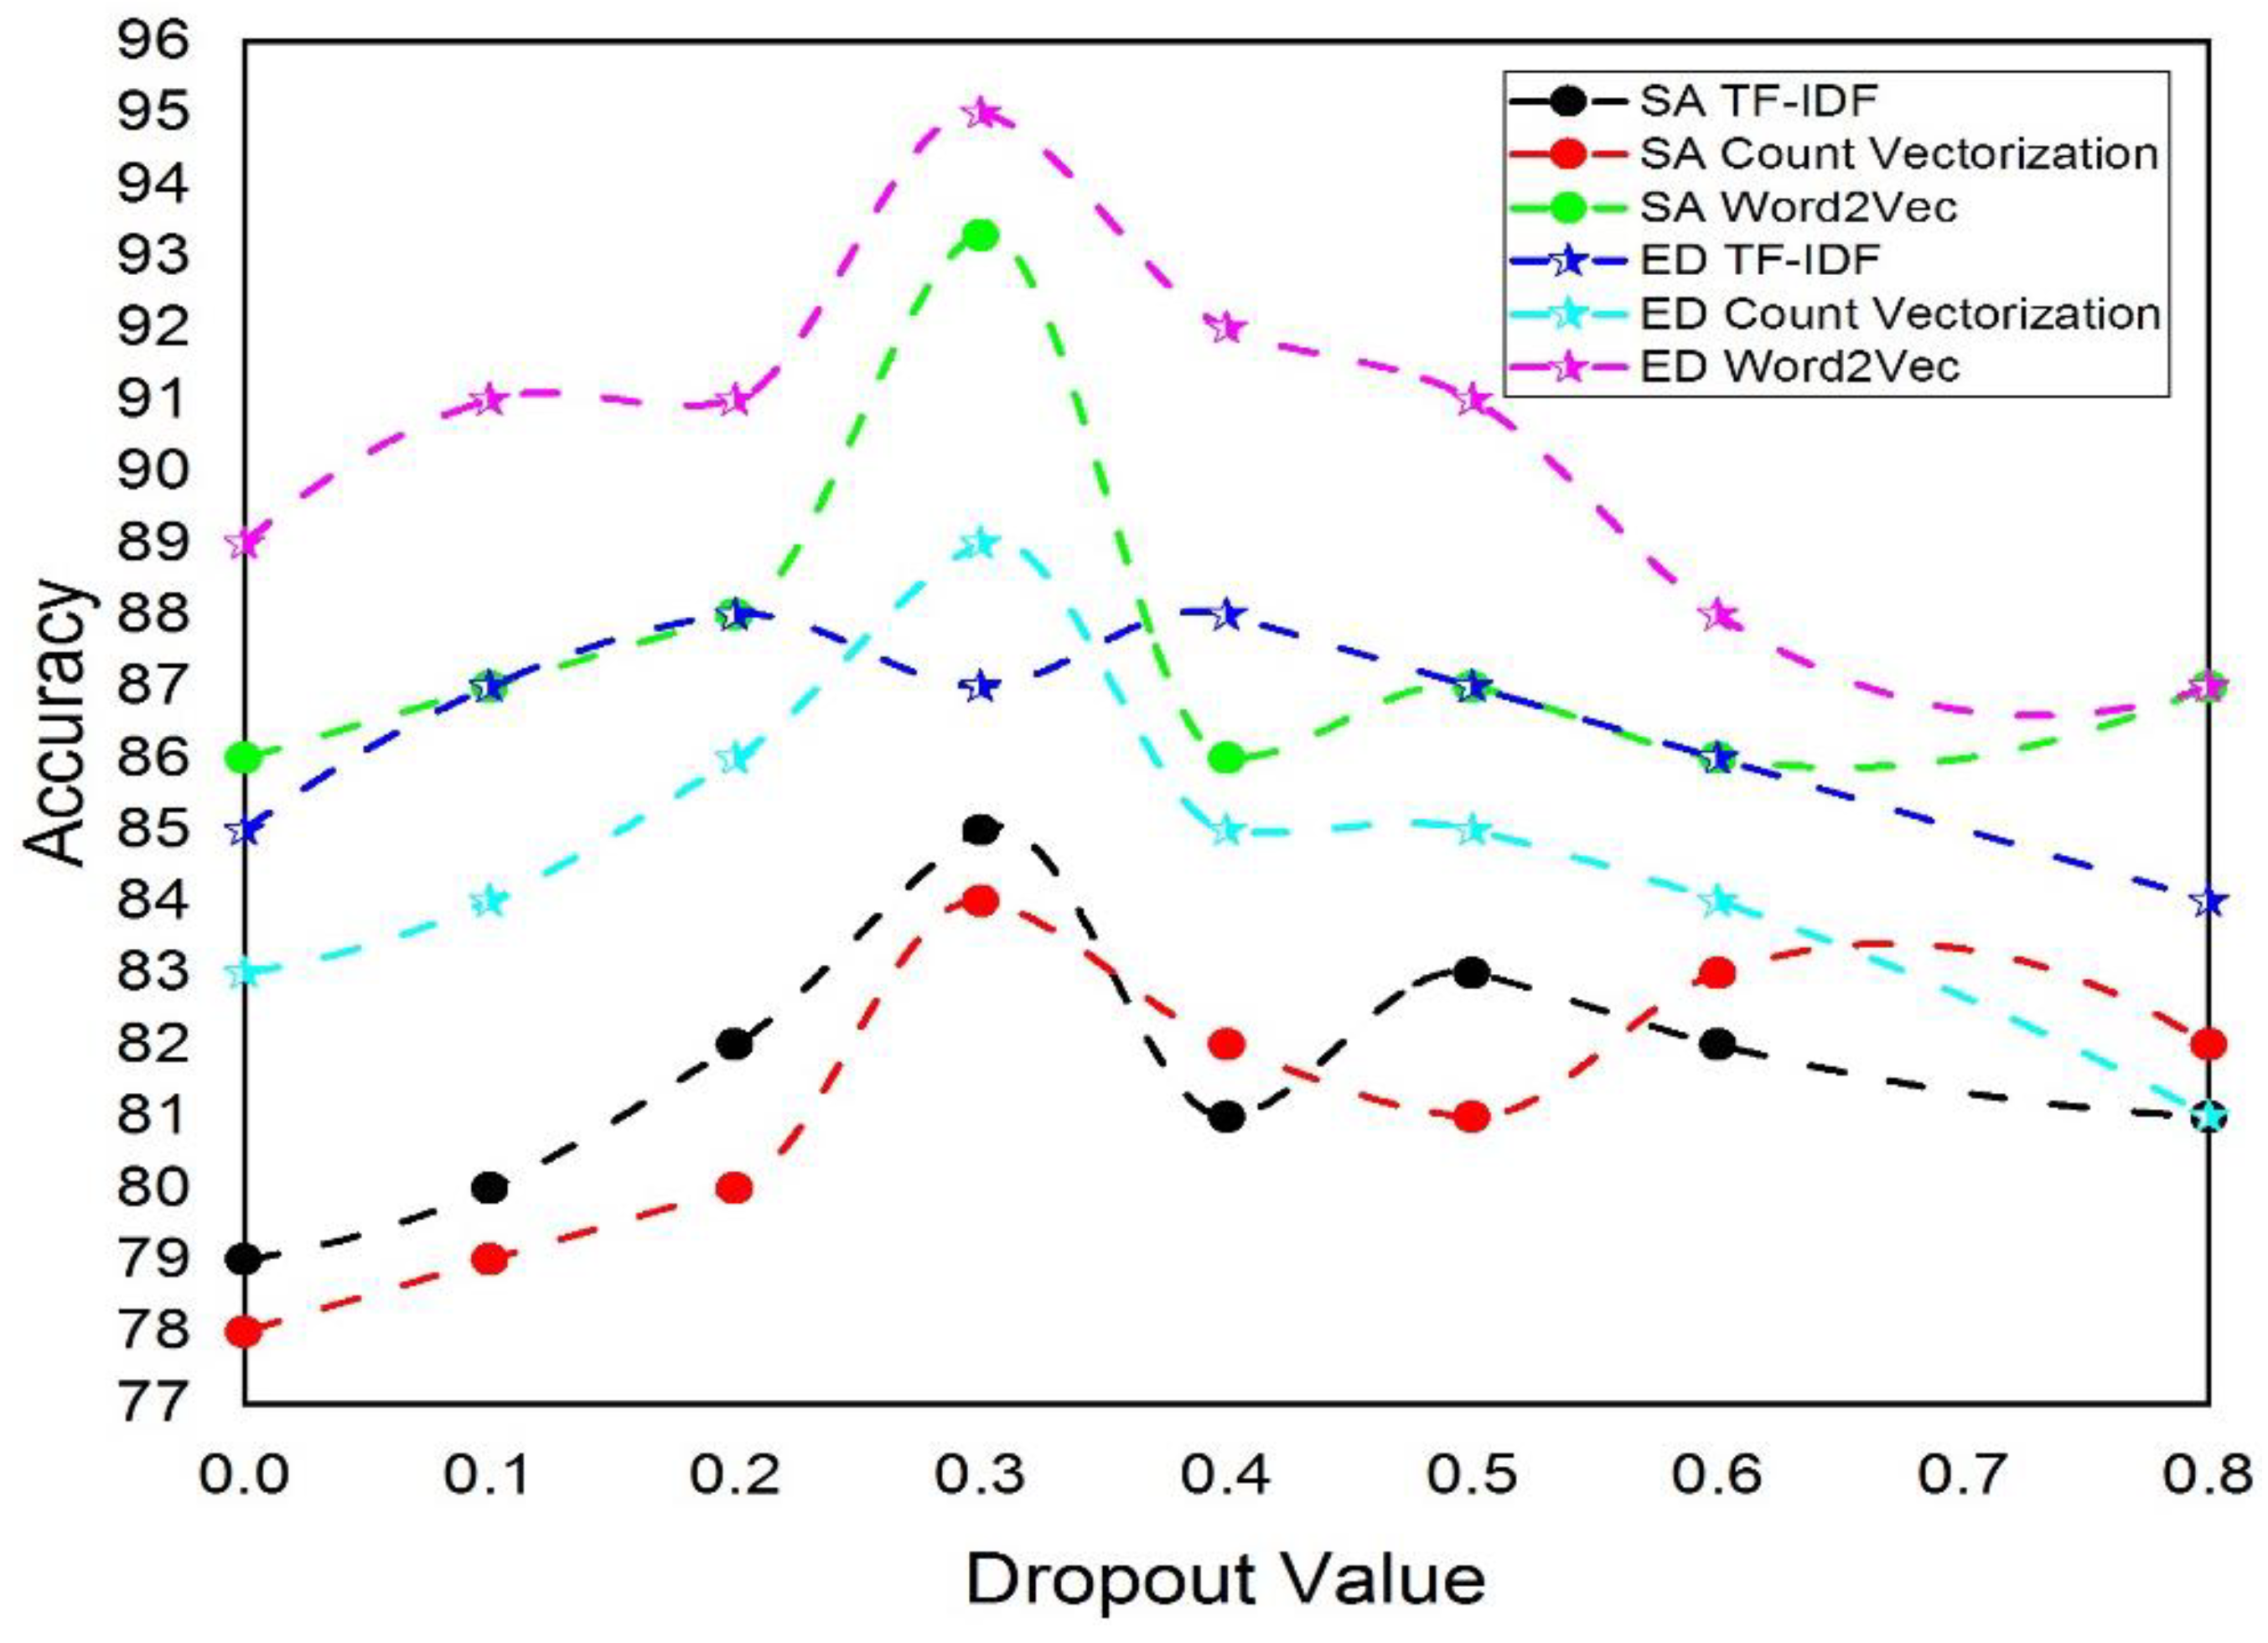
4.4. Experimental Results Dropout Value
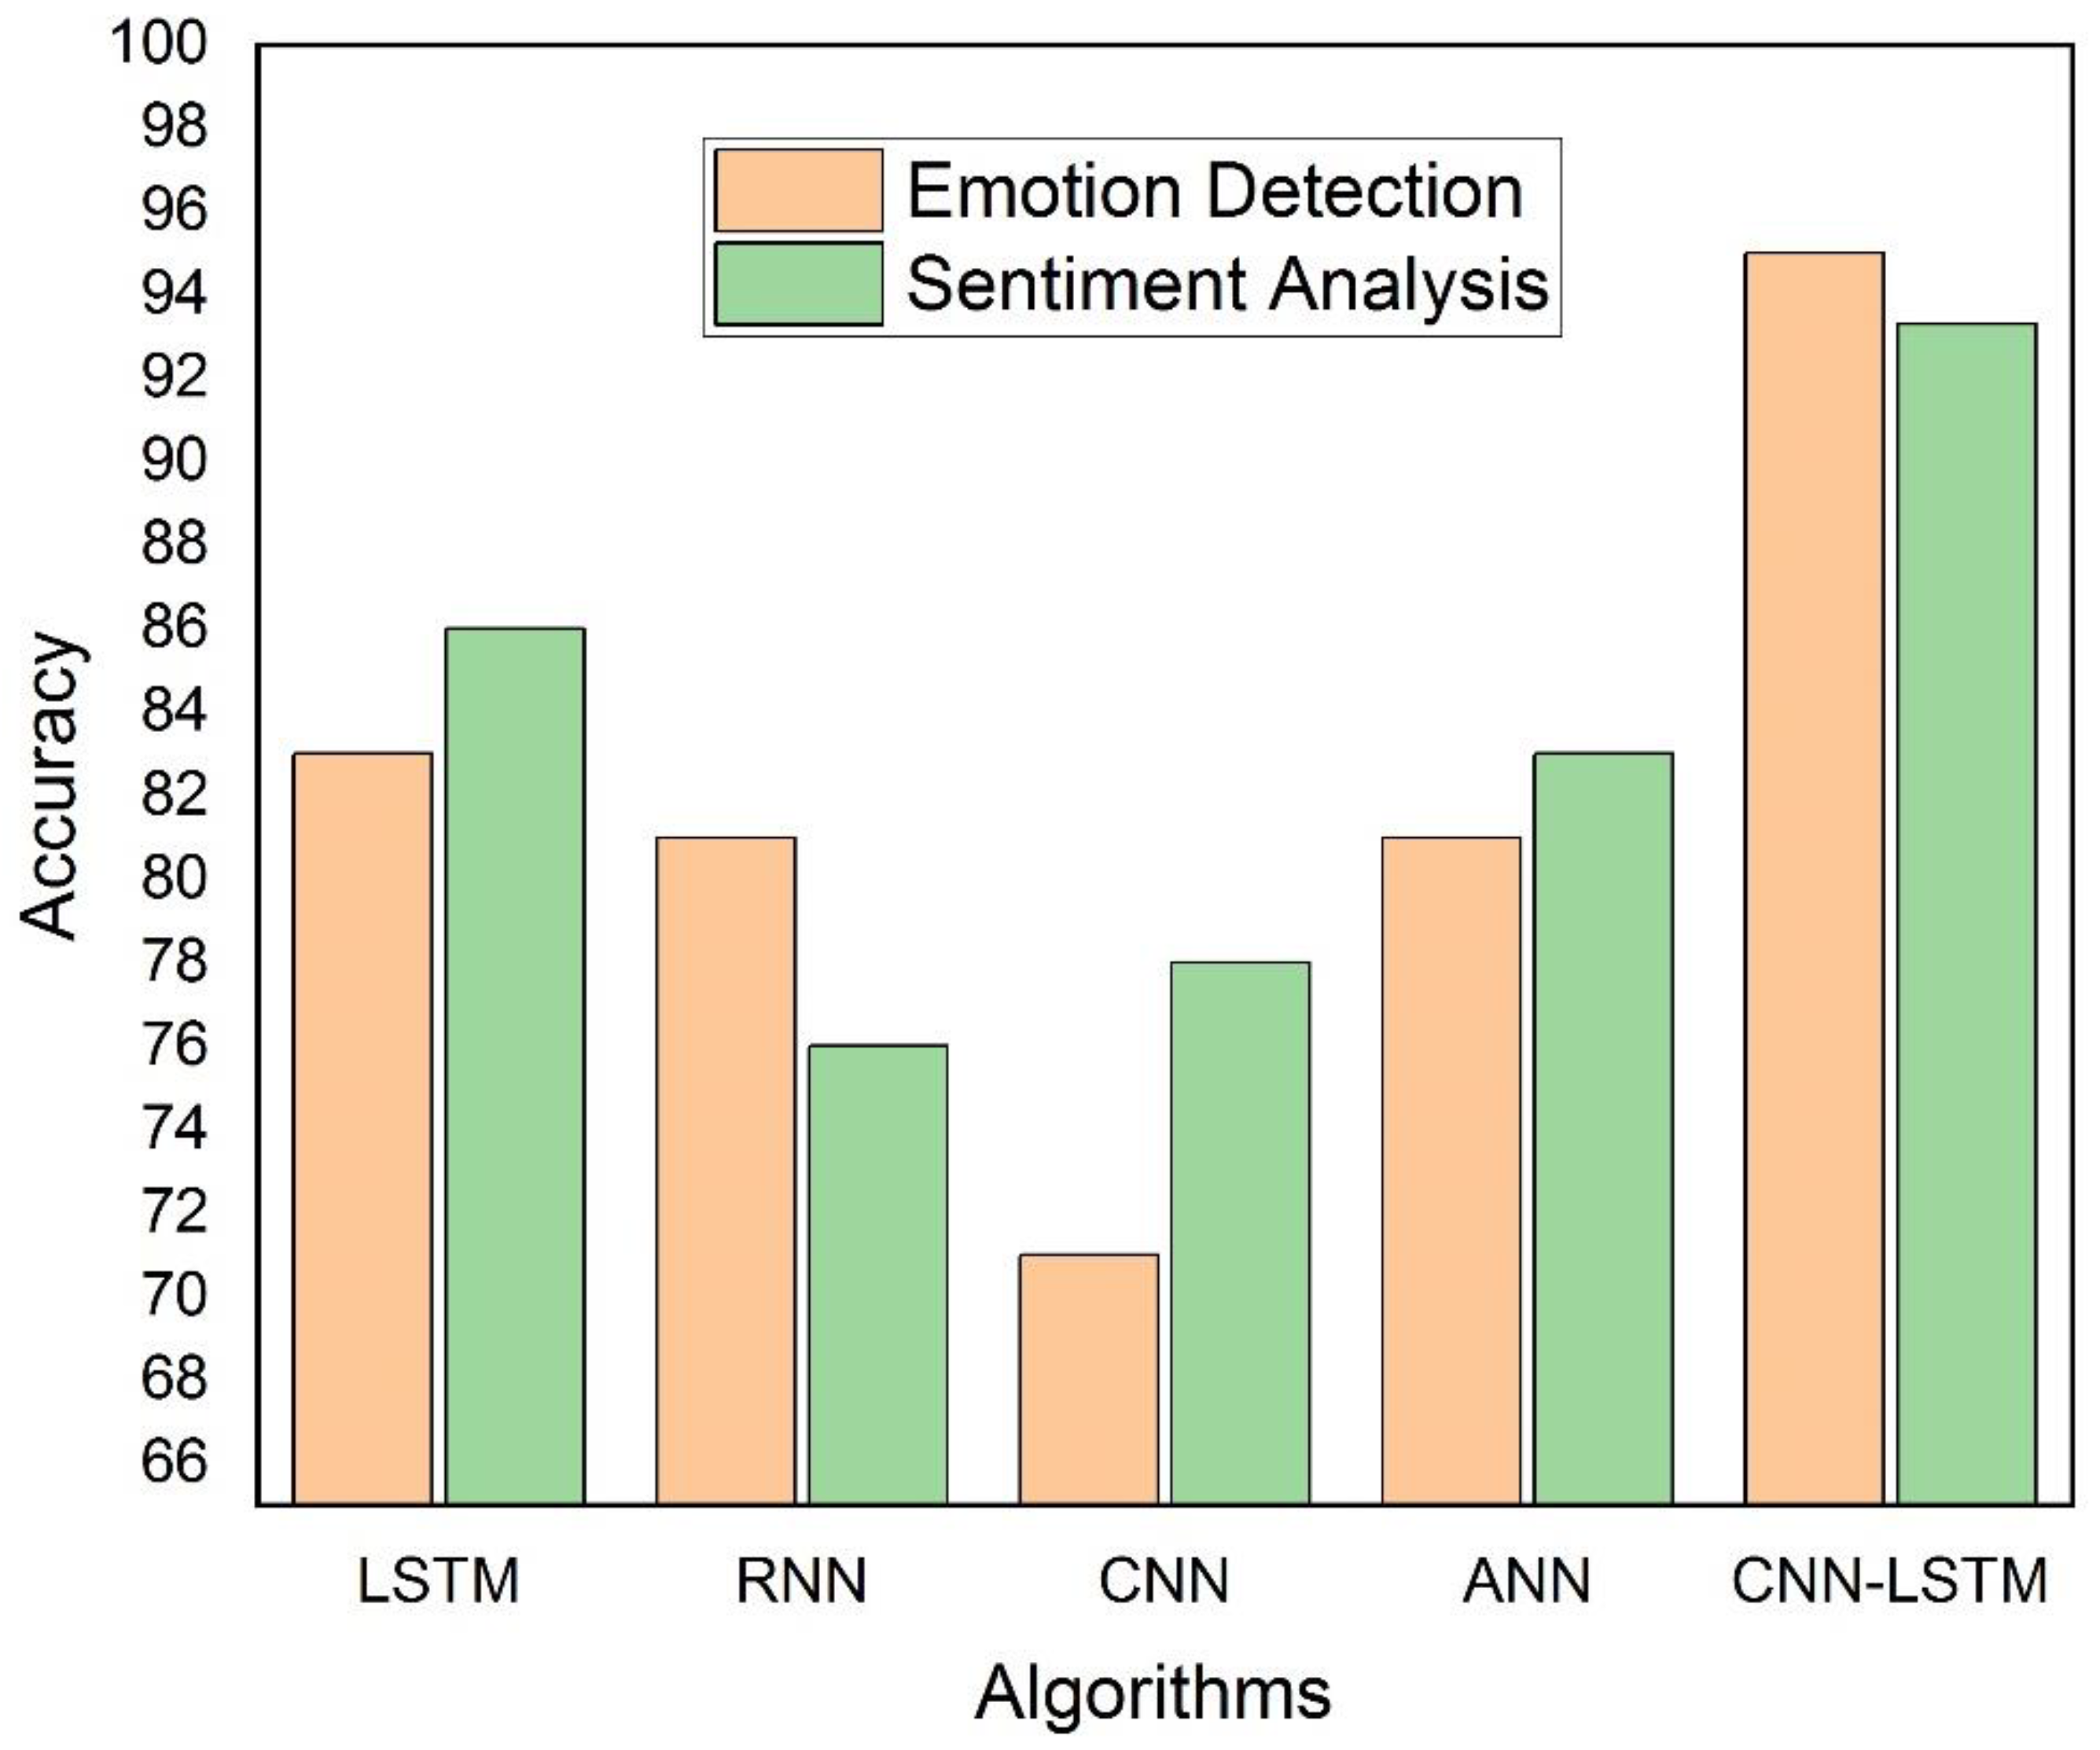
4.5. Comparison of Training Results with Other Algorithms
4.6. Comparative Analysis
5. Conclusions
Author Contributions
Funding
Data Availability Statement
Conflicts of Interest
References
- Bozkurt, E.; Yemez, Y.; Erzin, E. Multimodal analysis of speech and arm motion for prosody-driven synthesis of beat gestures. Speech Commun. 2016, 85, 29–42. [Google Scholar] [CrossRef]
- Smetanin, S. EmoSense at SemEval-2019 Task 3: Bidirectional LSTM Network for Contextual Emotion Detection in Textual Conversations. In Proceedings of the 13th International Workshop on Semantic Evaluation, Minneapolis, MN, USA, 6–7 June 2019. [Google Scholar] [CrossRef]
- Costantini, G.; Iaderola, I.; Paoloni, A.; Todisco, M. EMOVO Corpus: An Italian Emotional Speech Database—ACL Anthology. In Proceedings of the Ninth International Conference on Language Resources and Evaluation (LREC’14), Reykjavik, Iceland, 26–31 May 2014. [Google Scholar]
- Bestgen, Y. CECL at SemEval-2019 Task 3: Using Surface Learning for Detecting Emotion in Textual Conversations. In Proceedings of the 13th International Workshop on Semantic Evaluation, Minneapolis, MN, USA, 6–7 June 2019. [Google Scholar] [CrossRef]
- Dougnon, R.; Fournier-Viger, P.; Lin, J.; Nkambou, R. Accurate Online Social Network User Profiling. In KI 2015: Advances in Artificial Intelligence; Joint German/Austrian Conference on Artificial Intelligence (Künstliche Intelligenz), Lecture Notes in Computer Science; Springer: Cham, Switzerland, 2015; pp. 264–270. [Google Scholar] [CrossRef]
- Raj, E.; Manogaran, G.; Srivastava, G.; Wu, Y. Information Granulation-Based Community Detection for Social Networks. IEEE Trans. Comput. Soc. Syst. 2021, 8, 122–133. [Google Scholar] [CrossRef]
- Keltner, D. Ekman, emotional expression, and the art of empirical epiphany. J. Res. Personal. 2004, 38, 37–44. [Google Scholar] [CrossRef]
- Plutchik, R. A General Psychoevolutionary Theory of Emotion. Theor. Emot. 1980, 3–33. [Google Scholar] [CrossRef]
- Yadollahi, A.; Shahraki, A.; Zaiane, O. Current State of Text Sentiment Analysis from Opinion to Emotion Mining. ACM Comput. Surv. 2018, 50, 1–33. [Google Scholar] [CrossRef]
- Zahid, R.; Idrees, M.; Mujtaba, H.; Beg, M. Roman Urdu reviews dataset for aspect-based opinion mining. In Proceedings of the 35th IEEE/ACM International Conference on Automated Software Engineering Workshops, Melbourne, Australia, 21–25 September 2020. [Google Scholar] [CrossRef]
- Herzig, J.; Shmueli-Scheuer, M.; Konopnicki, D. Emotion Detection from Text via Ensemble Classification Using Word Embeddings. In Proceedings of the ACM SIGIR International Conference on Theory of Information Retrieval, Amsterdam, The Netherlands, 1–4 October 2017. [Google Scholar] [CrossRef]
- Majeed, A.; Mujtaba, H.; Beg, M. Emotion detection in Roman Urdu text using machine learning. In Proceedings of the 35th IEEE/ACM International Conference on Automated Software Engineering Workshops, Melbourne, Australia, 21–25 September 2020. [Google Scholar] [CrossRef]
- Ali, R.; Farooq, U.; Arshad, U.; Shahzad, W.; Beg, M. Hate speech detection on Twitter using transfer learning. Comput. Speech Lang. 2022, 74, 101365. [Google Scholar] [CrossRef]
- Crowston, K.; Allen, E.; Heckman, R. Using natural language processing technology for qualitative data analysis. Int. J. Soc. Res. Methodol. 2012, 15, 523–543. [Google Scholar] [CrossRef]
- Bestgen, Y. Recherche d’indices lexicosyntaxiques de segmentation et de liage par une analyse automatique de corpus. Discours 2019, 25. [Google Scholar] [CrossRef]
- Durrani, S.; Arshad, U. Transfer learning from High-Resource to Low-Resource Language Improves Speech Affect Recognition Classification Accuracy. arXiv 2021, arXiv:2103.11764. [Google Scholar]
- Hasan, M.; Rundensteiner, E.; Agu, E. Automatic emotion detection in text streams by analyzing Twitter data. Int. J. Data Sci. Anal. 2018, 7, 35–51. [Google Scholar] [CrossRef]
- Ashraf, N.; Khan, L.; Butt, S.; Chang, H.; Sidorov, G.; Gelbukh, A. Multi-label emotion classification of Urdu tweets. PeerJ Comput. Sci. 2022, 8, e896. [Google Scholar] [CrossRef]
- Bashir, M.; Javed, A.; Arshad, M.; Gadekallu, T.; Shahzad, W.; Beg, M. Context Aware Emotion Detection from Low Resource Urdu Language using Deep Neural Network. ACM Trans. Asian Low-Resour. Lang. Inf. Process. 2022. [Google Scholar] [CrossRef]
- Javed, A.; Beg, M.; Asim, M.; Baker, T.; Al-Bayatti, A. AlphaLogger: Detecting motion-based side-channel attack using smartphone keystrokes. J. Ambient. Intell. Humaniz. Comput. 2020. [Google Scholar] [CrossRef]
- Javed, T.A.; Shahzad, W.; Arshad, U. Hierarchical Text Classification of Urdu News using Deep Neural Network. arXiv 2021, arXiv:2107.03141. [Google Scholar]
- Khalid, U.; Beg, M.O.; Arshad, M.U. Bilingual Language Modeling, A transfer learning technique for Roman Urdu. arXiv 2021, arXiv:2102.10958. [Google Scholar]
- Noor, F.; Bakhtyar, M.; Baber, J. Sentiment Analysis in E-commerce Using SVM on Roman Urdu Text. In Lecture Notes of the Institute for Computer Sciences, Social Informatics and Telecommunications Engineering; Springer: Berlin, Germany, 2019; pp. 213–222. [Google Scholar] [CrossRef]
- Mukhtar, N.; Khan, M. Urdu Sentiment Analysis Using Supervised Machine Learning Approach. Int. J. Pattern Recognit. Artif. Intell. 2017, 32, 1851001. [Google Scholar] [CrossRef]
- Yang, S.; Li, S.; Zheng, L.; Ren, X.; Cheng, X. Emotion mining research on micro-blog. In Proceedings of the 2009 1st IEEE Symposium on Web Society, Lanzhou, China, 23–24 August 2009; pp. 71–75. [Google Scholar]
- Shoaib, M.; Hassan, M. Opinion within opinion: Segmentation approach for sentiment analysis. Int. Arab J. Inf. Technol. 2018, 15, 21–28. [Google Scholar]
- Ghulam, H.; Zeng, F.; Li, W.; Xiao, Y. Deep learning-based sentiment analysis for roman urdu text. Procedia Comput. Sci. 2019, 147, 131–135. [Google Scholar] [CrossRef]
- Arif, H.; Munir, K.; Danyal, A.S.; Salman, A.; Fraz, M.M. Sentiment analysis of roman urdu/hindi using supervised methods. Proc. ICICC 2016, 8, 48–53. [Google Scholar]
- Azam, N.; Tahir, B.; Mehmood, A. Sentiment and emotion analysis of text: A survey on approaches and resources. In Proceedings of the 7th International Conference on Language and Technology Pakistan, UET, Lahore, Pakistan, 19–21 February 2020. [Google Scholar]
- Khan, L.; Amjad, A.; Afaq, K.M.; Chang, H.-T. Deep sentiment analysis using CNN-LSTM architecture of English and Roman Urdu text shared in social media. Appl. Sci. 2022, 12, 2694. [Google Scholar] [CrossRef]
- Truică, C.-O.; Apostol, E.-S.; Șerban, M.-L.; Paschke, A. Topic-based document-level sentiment analysis using contextual cues. Mathematics 2021, 9, 2722. [Google Scholar] [CrossRef]
- Huang, C.; Zhou, X.; Ran, X.; Liu, Y.; Deng, W.; Deng, W. Co-evolutionary competitive swarm optimizer with three-phase for large-scale complex optimization problem. Inf. Sci. 2023, 619, 2–18. [Google Scholar] [CrossRef]
- Chen, H.; Miao, F.; Chen, Y.; Xiong, Y.; Chen, T. A hyperspectral image classification method using multifeature vectors and optimized Kelm. IEEE J. Select. Top. Appl. Earth Obs. Remote Sens. 2021, 14, 2781–2795. [Google Scholar] [CrossRef]
- Yu, Y.; Hao, Z.; Li, G.; Liu, Y.; Yang, R.; Liu, H. Optimal search mapping among sensors in heterogeneous smart homes. Math. Biosci. Eng. 2022, 20, 1960–1980. [Google Scholar] [CrossRef]
- Ren, Z.; Han, X.; Yu, X.; Skjetne, R.; Leira, B.J.; Sævik, S.; Zhu, M. Data-driven simultaneous identification of the 6DOF dynamic model and wave load for a ship in waves. Mech. Syst. Signal Process. 2023, 184, 109422. [Google Scholar] [CrossRef]
- Majeed, A.; Beg, M.; Arshad, U.; Mujtaba, H. Deep-EmoRU: Mining emotions from roman urdu text using deep learning ensemble. Multimedia Tools Appl. 2022, 81, 43163–43188. [Google Scholar] [CrossRef]
- Mukhtar, N.; Khan, M.; Chiragh, N. Lexicon-based approach outperforms Supervised Machine Learning approach for Urdu Sentiment Analysis in multiple domains. Telemat. Inform. 2018, 35, 2173–2183. [Google Scholar] [CrossRef]


| Author Name | Models Applied | Purpose | Contribution | Accuracy | Language | Limitations |
|---|---|---|---|---|---|---|
| Rabail et al. [10] | NB, SVC, LR, RF, KNN, SVCL | Features classification | Provide dataset for other researchers | 55% | Roman Urdu | Low accuracy |
| Jonathan Herzig et al. [11] | SVM | Features classification | Low computational power | 62% | English | Used small data set and achieved less accuracy |
| Adil Majeed et al. [12] | KNN, DT, RF, SVM | Features classification | Compared different classifier models | 69.4%. | Roman Urdu | Achieved 69.4%. accuracy |
| Raza Ali [13] | LSTM, CNN, LR, RF, SVM | Features classification | Improved accuracy | 73% | Roman Urdu | The result can be improved |
| Kevin et al. [14] | Survey | To introduce NLP to social researchers | Demonstrate the limitations of NLP tools | 75%. | English | Not deeply demonstrated |
| Yves Bestgen [15] | SVM | Features classification | Correctly classified emotion | 78% | English | The achieved accuracy is low |
| Sara Durrani [16] | SAVEE, EMOO, IEMOCAP | Features classification | Improved accuracy | 80.34% | English | Need to check in other low languages |
| Maryam et al. [17] | NB, SVM DT | Features classification | Comparative analysis | 90% | English | Still, accuracy needs to improve |
| Noman Ashraf et al. [18] | CNN, LSTM | Features classification | Improved accuracy to some extent | 90% | Urdu | A not good representation of corpus |
| Muhammad et al. [19] | LSTM, MLP, BI-LSTM | Features classification | Improved accuracy | 90.2% | Urdu | Still, accuracy needs to improve |
| Abdul et al. [20] | SMO, DT, SVM | Classification | Improved accuracy | 92% | English | Need to extract more sensitive information |
| Taimoor et al. [21] | LSTM, CNN | Classification | Take the initiative for hierarchal data | 94% | Urdu | Time complexity |
| Usama Khalid et al. [22] | Bilingual models | Classification | Used to defeat multilingual modeling | 95% | English, Roman Urdu | Face complexity in the downstream task |
| Author Name | Models Applied | Purpose | Contribution | Accuracy | Language | Limitations |
|---|---|---|---|---|---|---|
| Faiza et al. [23] | SVM | Feature Classification | Classified eCommerce site | 60% | Roman Urdu | Need to improve accuracy |
| Neelam et al. [24] | SVM, KNN | Feature Classification | Improved accuracy | 80.6% | English | Used small dataset |
| Yang et al. [25] | Survey | Classification | Improved accuracy | 82.5% | English | Need to improve accuracy |
| Md et al. [26] | K-NN, NB, DT | Classification | Suggested social media dataset | 90% | English | Used small dataset |
| Hussain et al. [27] | RNN, LSTM. | Model comparison | An efficient model for SA | 92% | Roman Urdu | Used small dataset |
| Huniya et al. [28] | SVM, kNN, DT, etc. | Classification | Compared classification models | 93% | Roman Urdu/Hindi | Need features selection with large data |
| Nazish et al. [29] | SLR | Compare different models | Explored previous studies | N/A | Urdu | Further analysis is needed |
| L.khan et al. [30] | CNN-LSTM | Classification | Improved accuracy | 90% | English/ Roman Urdu | More research is required to improve the outcome. |
| C.Octavian et al. [31] | CNN-BiLSTM, LSTM, BiGRU | Classification | Improved accuracy | 75.60 | Contextual Cues | Other embeddings methods with the same model must be tested. |
| S.NO | Emotion | Relation | Label |
|---|---|---|---|
| 1. | Happy | Feeling or showing pleasure or contentment | Assigning label 1 |
| 2. | Sad | Feeling or showing sorrow; unhappy | Assigning label 2 |
| 3. | Anger | Something you feel has deliberately done you wrong | Assigning label 3 |
| 4. | Love | Characterized by intimacy, passion, and commitment | Assigning label 4 |
| 5. | Fear | Natural, powerful, and primitive human emotion | Assigning label 5 |
| 6. | Neutral | Other categories | Assigning label 6 |
| S.NO | Emotion | Relation | Label |
|---|---|---|---|
| 1. | Positive | Happy or excited | Positive |
| 2. | Negative | Angry, annoyed, or frustrated | Negative |
| 3. | Natural | Seem satisfied but do not express | Assigning label 3 |
| Emotion | HAPPY | SAD | ||||
|---|---|---|---|---|---|---|
| Roman Urdu | English | Urdu | Roman Urdu | English | Urdu | |
| 1 | Shandar | Glorious | شاندار | Moat | Death | موت |
| 2 | Faida | Benefit | فائدہ | Preshan | Anxiety | بے چینی |
| 3 | itmad | Confidence | اعتماد | Dhamakha | Blast | دھماکہ |
| 4 | Behtreen | Excellent | بہترین | udasi | Sorrow | اداسی |
| 5 | Mazak | Joke | مذاق | Bimar | Sick | بیمار |
| 6 | pur kashish | Attractive | پر کشش | khudkashi | Suicide | خودکشی |
| 7 | fakhr | Pride | فخر | nuqsan | Loss | نقصان |
| 8 | inam | Prize | انعام | burai | Evil | برائی |
| Emotion | Fear | Anger | ||||
| 1 | Khof Zadah | Scared | ڈرا ہوا | Jarhana | Aggressive | جارحانہ |
| 2 | Khoofnaq | Dreadful | خوفناک | tashadud | Violence | تشدد |
| 3 | Bitarteeb | Unsettled | بے ترتیب | Antiqame | Retaliation | انتقامی |
| 4 | Beitimadi | Distrustful | بے اعتمادی | Ghussa | Rage | غصہ |
| 5 | Kanpna | Shudder | کانپنا | Larna | Fight | لڑنا |
| 6 | Darpok | Timid | ڈرپوک | Dushmani | Hostility | دشمنی |
| 7 | Ghermahfooz | Insecure | غیر محفوظ | thaparmarna | Slapped | تھپڑ مارا |
| 8 | Kheran | Shocked | حیران | Nafratangez | Hateful | نفرت انگیز |
| Emotion | Neutral | Love | ||||
| 1 | Muft | Free | مفت | Muhabat | Love | محبت |
| 2 | assan | Easy | آسان | tarif karen | Admire | تعریف کریں |
| 3 | heran | Amazed | حیران | jazbah | Passion | جذبہ |
| 4 | praatmad | Confident | پر اعتماد | hamdardi | Sympathy | ہمدردی |
| 5 | qasam | Kind | قسم | romania | Romantic | رومانوی |
| 6 | Qabool | Receptive | قبول | metha | Sweet | میٹھا |
| 7 | Dilchaspi | Interested | دلچسپی | mukhlis | Sincere | مخلص |
| 8 | samaj | Understanding | سمجھ | khoobsurat | Pretty | خوبصورت |
| Emotion | Positive | Negative | ||||
|---|---|---|---|---|---|---|
| Roman Urdu | English | Urdu | Roman Urdu | English | Urdu | |
| 1 | Itmeenan | Satisfaction | اطمینان | Darna | Afraid | ڈرنا |
| 2 | Benafsi | Altruism | بے نفسی | alarm | Alarm | الارم |
| 3 | Madad | Relief | مدد | Naraz | Annoyed | ناراض |
| 4 | Piyar | Affection | پیار | bor | Bored | بور |
| 5 | Khush mazaji | Cheerfulness | خوش مزاجی | Talah | Bitter | تلخ |
| 6 | Tareef | Admiration | تعریف | Zabardasti | Coercive | زبردستی |
| 7 | Josh | Euphoria | جوش | Aljao | Confusion | الجھاؤ |
| 8 | Qinat | Contentment | قناعت | Tauheen | Contempt | توہین |
| Parameters | Values | Parameter | Value |
|---|---|---|---|
| Batch-size | 128 | Sentence length | 70 |
| Convolution window-size | 3-4-5 | Word vector dimension | 300 |
| LSTM Hidden Number | 256 | Number of convolution kernels | 256 |
| Learning rate | 0.0001 | Activation function | SoftMax |
| Emotion Detection | Categories Statistic | ||
|---|---|---|---|
| Emotion Sentences | 1021 | Emotions Number | 6 |
| Total words in emotion | 6822 | Happy | 227 |
| Sad | 172 | ||
| Unique word count in emotion | 2149 | Anger | 213 |
| Love | 187 | ||
| Average words in a sentence | 18 | Fear | 173 |
| Neutral | 248 | ||
| Sentiment Analysis | Categories statistic | ||
| Count of total sentences for sentiment analysis | 20,251 | Positive | 8928 |
| The average number of words in a sentence for sentiment analysis | 16 | Negative | 6016 |
| Unique word count in sentiment analysis | 42,684 | Neutral | 5290 |
| Total words | 268,819 | ||
| Emotions | Dropout Value | Algorithm | Techniques | Accuracy | Precision | Recall | F1-Score |
|---|---|---|---|---|---|---|---|
| Emotion Detection | 0.3 | CNN-LSTM | BOW | 89% | 90% | 88% | 89% |
| 0.2 | TF-IDF | 87% | 88% | 86% | 87% | ||
| 0.3 | Word2Vec | 95% | 94% | 96% | 95% | ||
| Sentiment Analysis | 0.5 | CNN-LSTM | BOW | 84% | 81% | 84% | 83% |
| 0.6 | TF-IDF | 85% | 81% | 86% | 84% | ||
| 0.3 | Word2Vec | 93.3% | 94% | 93% | 93% |
| Emotion Detection | |||||
|---|---|---|---|---|---|
| Reference | Algorithm | Accuracy | Precision | Recall | F1-Score |
| Ref [19] | Bi-LSTM | 85% | 84% | 87% | 85% |
| Ref [36] | Deep-EmoRU | 82% | 84% | 82% | 83% |
| Proposed | CNN-LSTM | 95% | 94% | 96% | 95% |
| Sentiment Analysis | |||||
| Ref [24] | KNN (IBK) | 67% | 68% | 67% | 67% |
| Ref [37] | Urdu Sentiment | 89% | 86% | 90% | 88% |
| Proposed | LSTM-CNN | 93.3% | 94% | 93% | 93% |
Publisher’s Note: MDPI stays neutral with regard to jurisdictional claims in published maps and institutional affiliations. |
© 2022 by the authors. Licensee MDPI, Basel, Switzerland. This article is an open access article distributed under the terms and conditions of the Creative Commons Attribution (CC BY) license (https://creativecommons.org/licenses/by/4.0/).
Share and Cite
Ullah, F.; Chen, X.; Shah, S.B.H.; Mahfoudh, S.; Hassan, M.A.; Saeed, N. A Novel Approach for Emotion Detection and Sentiment Analysis for Low Resource Urdu Language Based on CNN-LSTM. Electronics 2022, 11, 4096. https://doi.org/10.3390/electronics11244096
Ullah F, Chen X, Shah SBH, Mahfoudh S, Hassan MA, Saeed N. A Novel Approach for Emotion Detection and Sentiment Analysis for Low Resource Urdu Language Based on CNN-LSTM. Electronics. 2022; 11(24):4096. https://doi.org/10.3390/electronics11244096
Chicago/Turabian StyleUllah, Farhat, Xin Chen, Syed Bilal Hussain Shah, Saoucene Mahfoudh, Muhammad Abul Hassan, and Nagham Saeed. 2022. "A Novel Approach for Emotion Detection and Sentiment Analysis for Low Resource Urdu Language Based on CNN-LSTM" Electronics 11, no. 24: 4096. https://doi.org/10.3390/electronics11244096
APA StyleUllah, F., Chen, X., Shah, S. B. H., Mahfoudh, S., Hassan, M. A., & Saeed, N. (2022). A Novel Approach for Emotion Detection and Sentiment Analysis for Low Resource Urdu Language Based on CNN-LSTM. Electronics, 11(24), 4096. https://doi.org/10.3390/electronics11244096