Review

Machine Learning Algorithms Application in COVID-19 Disease: A Systematic Literature Review and Future Directions

1
Department of Computer Science and Electronics, University of the Coast, Barranquilla 080020, Colombia
2
General Director of Research, Autonomous University of Bucaramanga, Bucaramanga 680003, Colombia
3
Faculty of Computer Science, Bialystok University of Technology, 15-333 Białystok, Poland
4
Research Group in Information Technologies Department, Autonomous University of Bucaramanga, Bucaramanga 680003, Colombia
5
Faculty of Engineering, University of Magdalena, Santa Marta 470003, Colombia
*
Author to whom correspondence should be addressed.
Electronics 2022, 11(23), 4015; https://doi.org/10.3390/electronics11234015
Submission received: 16 October 2022 / Revised: 24 November 2022 / Accepted: 2 December 2022 / Published: 3 December 2022
(This article belongs to the Special Issue AI and Smart City Technologies)

Abstract

:
Since November 2019, the COVID-19 Pandemic produced by Severe Acute Respiratory Syndrome Severe Coronavirus 2 (hereafter COVID-19) has caused approximately seven million deaths globally. Several studies have been conducted using technological tools to prevent infection, to prevent spread, to detect, to vaccinate, and to treat patients with COVID-19. This work focuses on identifying and analyzing machine learning (ML) algorithms used for detection (prediction and diagnosis), monitoring (treatment, hospitalization), and control (vaccination, medical prescription) of COVID-19 and its variants. This study is based on PRISMA methodology and combined bibliometric analysis through VOSviewer with a sample of 925 articles between 2019 and 2022 derived in the prioritization of 32 papers for analysis. Finally, this paper discusses the study’s findings, which are directions for applying ML to address COVID-19 and its variants.

1. Introduction

Artificial intelligence (AI) has a sub-area called machine learning (ML), which focuses on studying and developing approaches to computational learning. ML has been successful in various fields, such as fraud detection, computer vision, online advertising, robotics, and automatic drivers, among others [1,2,3].
The success of applying ML in the areas of disease diagnosis, treatment, patient monitoring, drug discovery, and epidemiology, among others, allows for foreseeing the potential and impact of ML in the design and implementation of new and better solutions in the mentioned areas [4,5]. For example, in [6], a review of the importance of using drones, AI, the internet of things (IoT), and block chain, among other emerging technologies, was prepared to address the pandemic; for example, [7] uses blockchain to propose a method that prevents manipulation of information, such as COVID-19 test results. Additionally, in [8], a review of current approaches to automatic image processing of computed tomography (CT) scans is presented. Likewise, papers were introduced that elaborate in a basic way on the various modeling techniques to predict the pandemic, including mathematical and AI approaches. Another paper ([8]) presents a review of modern approaches to COVID-19. Other work ([9]) shows a reflection of different points of view on the approaches used in AI. [10] characterizes and presents deep transfer learning (DTL) in managing aspects related to COVID-19. In [11], a review of machine learning and AI algorithms for pandemic management is conducted. In [12], the limitations, restrictions, and difficulties of the application of AI in the fight against the disease are reviewed. Finally, we highlight works based on artificial intelligence techniques using X-ray images to detect COVID-19 and various lung diseases [13,14].
One of the fields of application of ML is the area of health. ML has led different researchers to approach, from this technique, the study of COVID-19. COVID-19 is a contagious virus that belongs to the coronavirus family. The disease causes flu-like symptoms such as cough, fever, fatigue, and shortness of breath. The primary source of the virus is still under debate. However, studies on the genome sequence of the virus have determined that it belongs to the β-CoV (Corona Virus) genus-group of the coronavirus family that takes bats and rodents as hosts [12,14]. The virus is transmitted through airborne and physical contact and penetrates scraper cells by binding to Angiotensin-Converting Enzyme 2 (ACE2). Consequently, the most common symptoms of the virus are shortness of breath, fever, cough, loss of smell, taste, headache, and muscle pain [14]. COVID-19 was first observed in Wuhan in, China in December 2019 [15]; since then, it has spread worldwide, generating difficulties in different aspects of human life.
The virus has had variants such as Delta and Omicron that have caused different waves (high peaks) of infections and deaths worldwide [16]. The Omicron variant, considered more transmissible but less lethal, was shown to have reached 61.5% of women that reported infections. As of 3 April 2022, more than 491 million confirmed cases, and more than 6.1 million deaths, had been reported under the current COVID-19 pandemic [17,18], and it was reported that the pandemic may end by 2022 and be fully controlled by 2024 [19]. The scientific community is developing vaccines, techniques, and procedures using different technologies that use ICT tools and is investigating problems to improve the characterization of ML algorithms with better performance to perform survival analysis studies. These include appropriate variable selection techniques in studies related to datasets in the health area, among others [20,21].
For several years, mathematical models have been used to predict the behavior of epidemics [22,23], which help politicians and health authorities to adopt appropriate measures to curb pandemics. Much research has focused on modeling pandemic behavior, as seen in [24,25,26]. Some examples are the use of ML techniques for timely decision-making to send patients with COVID-19 to the intensive care unit (ICU) and to prevent deaths [27,28] and to predict the level of mortality risk based on the ratio of patients with COVID-19 and comorbidities [29,30].
In the literature review, we found many papers that address the systematic literature reviews related to the subject matter of this work; however, we introduce a summary of the essential works below. In [31], the authors limited themselves to presenting general aspects on four aspects (such as limitations, surveillance, pitfalls, and priorities). However, they still need to show details of algorithms, methodologies, datasets, or other tools to develop AI-based solutions for reliable disease diagnosis.
Ref. [32] presents a relationship between IA and clinical decision support (CDS) review, highlighting the able and reliable datasets which access relevance for achieving better solutions to address COVID-19. However, it needs to present details of the technical characteristics of the composition of the available datasets or essential aspects that allow for determining the quality of a dataset.
Likewise, in [33], there is an extensive study on the works that use blockchain and AI to develop solutions against COVID-19, but it does not show the performance of the solutions that perform “coronavirus detection”, where they include six works, and it only shows the performance of the “ResNet50 model. In [34], ML algorithms for disease-related medicine using image processing are presented, concentrating on a review of the available literature on computer vision efforts against the COVID-19 pandemic. However, it only presents some of the algorithms used in the papers included in the review. In [35], a review of imaging modalities and artificial intelligence approaches was applied to managing COVID-19. AI approaches are applied for the management of COVID-19, although they do not specify the data processing tools and image databases that are available for future studies.
Additionally, a review presents data-driven pandemic surveillance, modeling, and forecasting methods used for methodologies, algorithms, and applications in past or current epidemics. It also highlights effective data-driven methodologies that have proven successful in other contexts. This paper does not delve into the detailed characterization of methodologies, algorithms, and applications to combat COVID-19 [36,37]. Instead, it introduces a paper that addresses forecasting models based on machine learning methods for COVID-19 prediction, details forecasting techniques, and highlights the features most used in the studies and the databases used in the reviewed articles. However, this paper does not present the performance of the studies included in the review.
Ref. [38], a summary of the papers that have used machine learning methods to predict the number of confirmed COVID-19 cases is presented, organized into four categories: traditional machine learning regression, deep learning regression, network analysis, and social media and search queries data-based methods. In contrast, this paper does not present information on the algorithms, techniques, datasets, tools, or platforms used in reviewed works.
A review shows a comprehensive application of AI in drug discovery for COVID-19 treatment [39]. A review covers research on the application of AI in the management of critically ill patients with COVID-19 in [40]. In [41], a review paper presents a summary of research on deep learning applications for medical image processing in COVID-19 patients. It looks at deep learning and its applications in healthcare based on three use cases in countries such as China, Korea, and Canada. Additionally, in [42], a recent work used neural networks (NN) and GHSOM training techniques to predict the risk of cardiovascular disease (CVD) accidents. Finally, we summarize literature review papers analyzing the relationship of COVID-19 with underlying disease (comorbidity) in Table 1.
In contrast to the above, this paper stands out mainly because it concentrates on compiling and analyzing the works that predict mortality based on patients with COVID-19 and underlying disease (comorbidity).
(1)
It presents the relationship of the importance of feature selection techniques to the performance of the algorithm used in prediction.
(2)
It presents an analysis of the behavior of the algorithms related to the metric that obtained the best performance.
(3)
It presents a summary of the AI tools used to implement the prediction methods from each study reviewed.
(4)
It presents a brief bibliometric analysis of AI applications’ state-of-art research to predict mortality based on patients with COVID-19 with a baseline disease (comorbidity) area.
In the study, we analyzed research articles based on ML in the treatment of the pandemic; the study is based on PRISMA methodology to perform this systematic review and used VOSviewer, a bibliometric analysis software; 912 articles were identified from the primary collection in the SCOPUS bibliographic database during a period between 2020 and 2022, and 32 were used for the analysis of this work. The results of this review will contribute to policy directions, practice, and further research on pandemics, such as COVID-19, mainly on mortality risk.
The rest of the document is as follows. In Section 2, the materials and methods used to perform the systematic review are introduced, as well as a summary of the search results. Section 3 reviews the literature on the most used supervised machine learning for diagnosing and treating patients with COVID-19. Section 4 presents a bibliometric analysis of the literature-reviewed characterization. Section 5 summarizes the main findings and reflections found in the reviewed studies regarding ML algorithms to predict mortality risk in COVID-19 patients and comorbidities and a summary of the gaps, challenges, and research opportunities in the presented work area. Finally, we present conclusions in Section 6.

2. Literature Review Method

This systematic review adopted the Preferred Reporting Items for Systematic Reviews and Meta-Analyses (PRISMA) statement. PRISMA is a collection of elements used for reporting systematic reviews and meta-analyses [54,55]; it is intended to assist in the randomized reporting of research papers; PRISMA can be used as a basis for reporting systematic reviews [56]. Therefore, taking the tenets of the PRISMA approach, this study considered the research questions that guided the review, the literature search, and the selection criteria.

2.1. Search Strategy

We searched the SCOPUS bibliographic database in May 2022 to identify studies published in the last four years that included AI in the context of the “Pandemic COVID-19”.

2.2. Selection Criteria

The study used peer-reviewed articles published in scientific journals. Table 2 lists the exclusion and inclusion criteria used in this study. These peer-reviewed articles focused on applying machine learning techniques to “Pandemic COVID-19” research.
Finally, the study excludes case reports, letters to the editors, preprinted documents, qualitative studies, surveys or reviews, simulation studies, and studies describing review protocols.

2.3. Search Equation

The following string—(Covid* AND (comorbidity* OR mortal*) AND algorithm)—was used to search within the title, abstract, and keywords of studies, such as comorbidity, mortality, cardiovascular, diabetes, cancer, machine learning algorithm, machine learning techniques, data mining, and artificial intelligence in the context of COVID-19. Thus, the records retrieved from SCOPUS were imported into the bibliographic management software Mendeley (Mendeley Ltd., London, UK) to identify duplicates. The selection procedure was carried out in four stages. In the first stage, authors reviewed paper titles. Secondly, the abstracts were reviewed. In the third stage, the authors read the full manuscripts of the eligible articles identified in the first and second stages. Then the final articles were selected for inclusion, all according to the defined inclusion and exclusion criteria (see Figure 1).

3. Literature-Reviewed Analysis

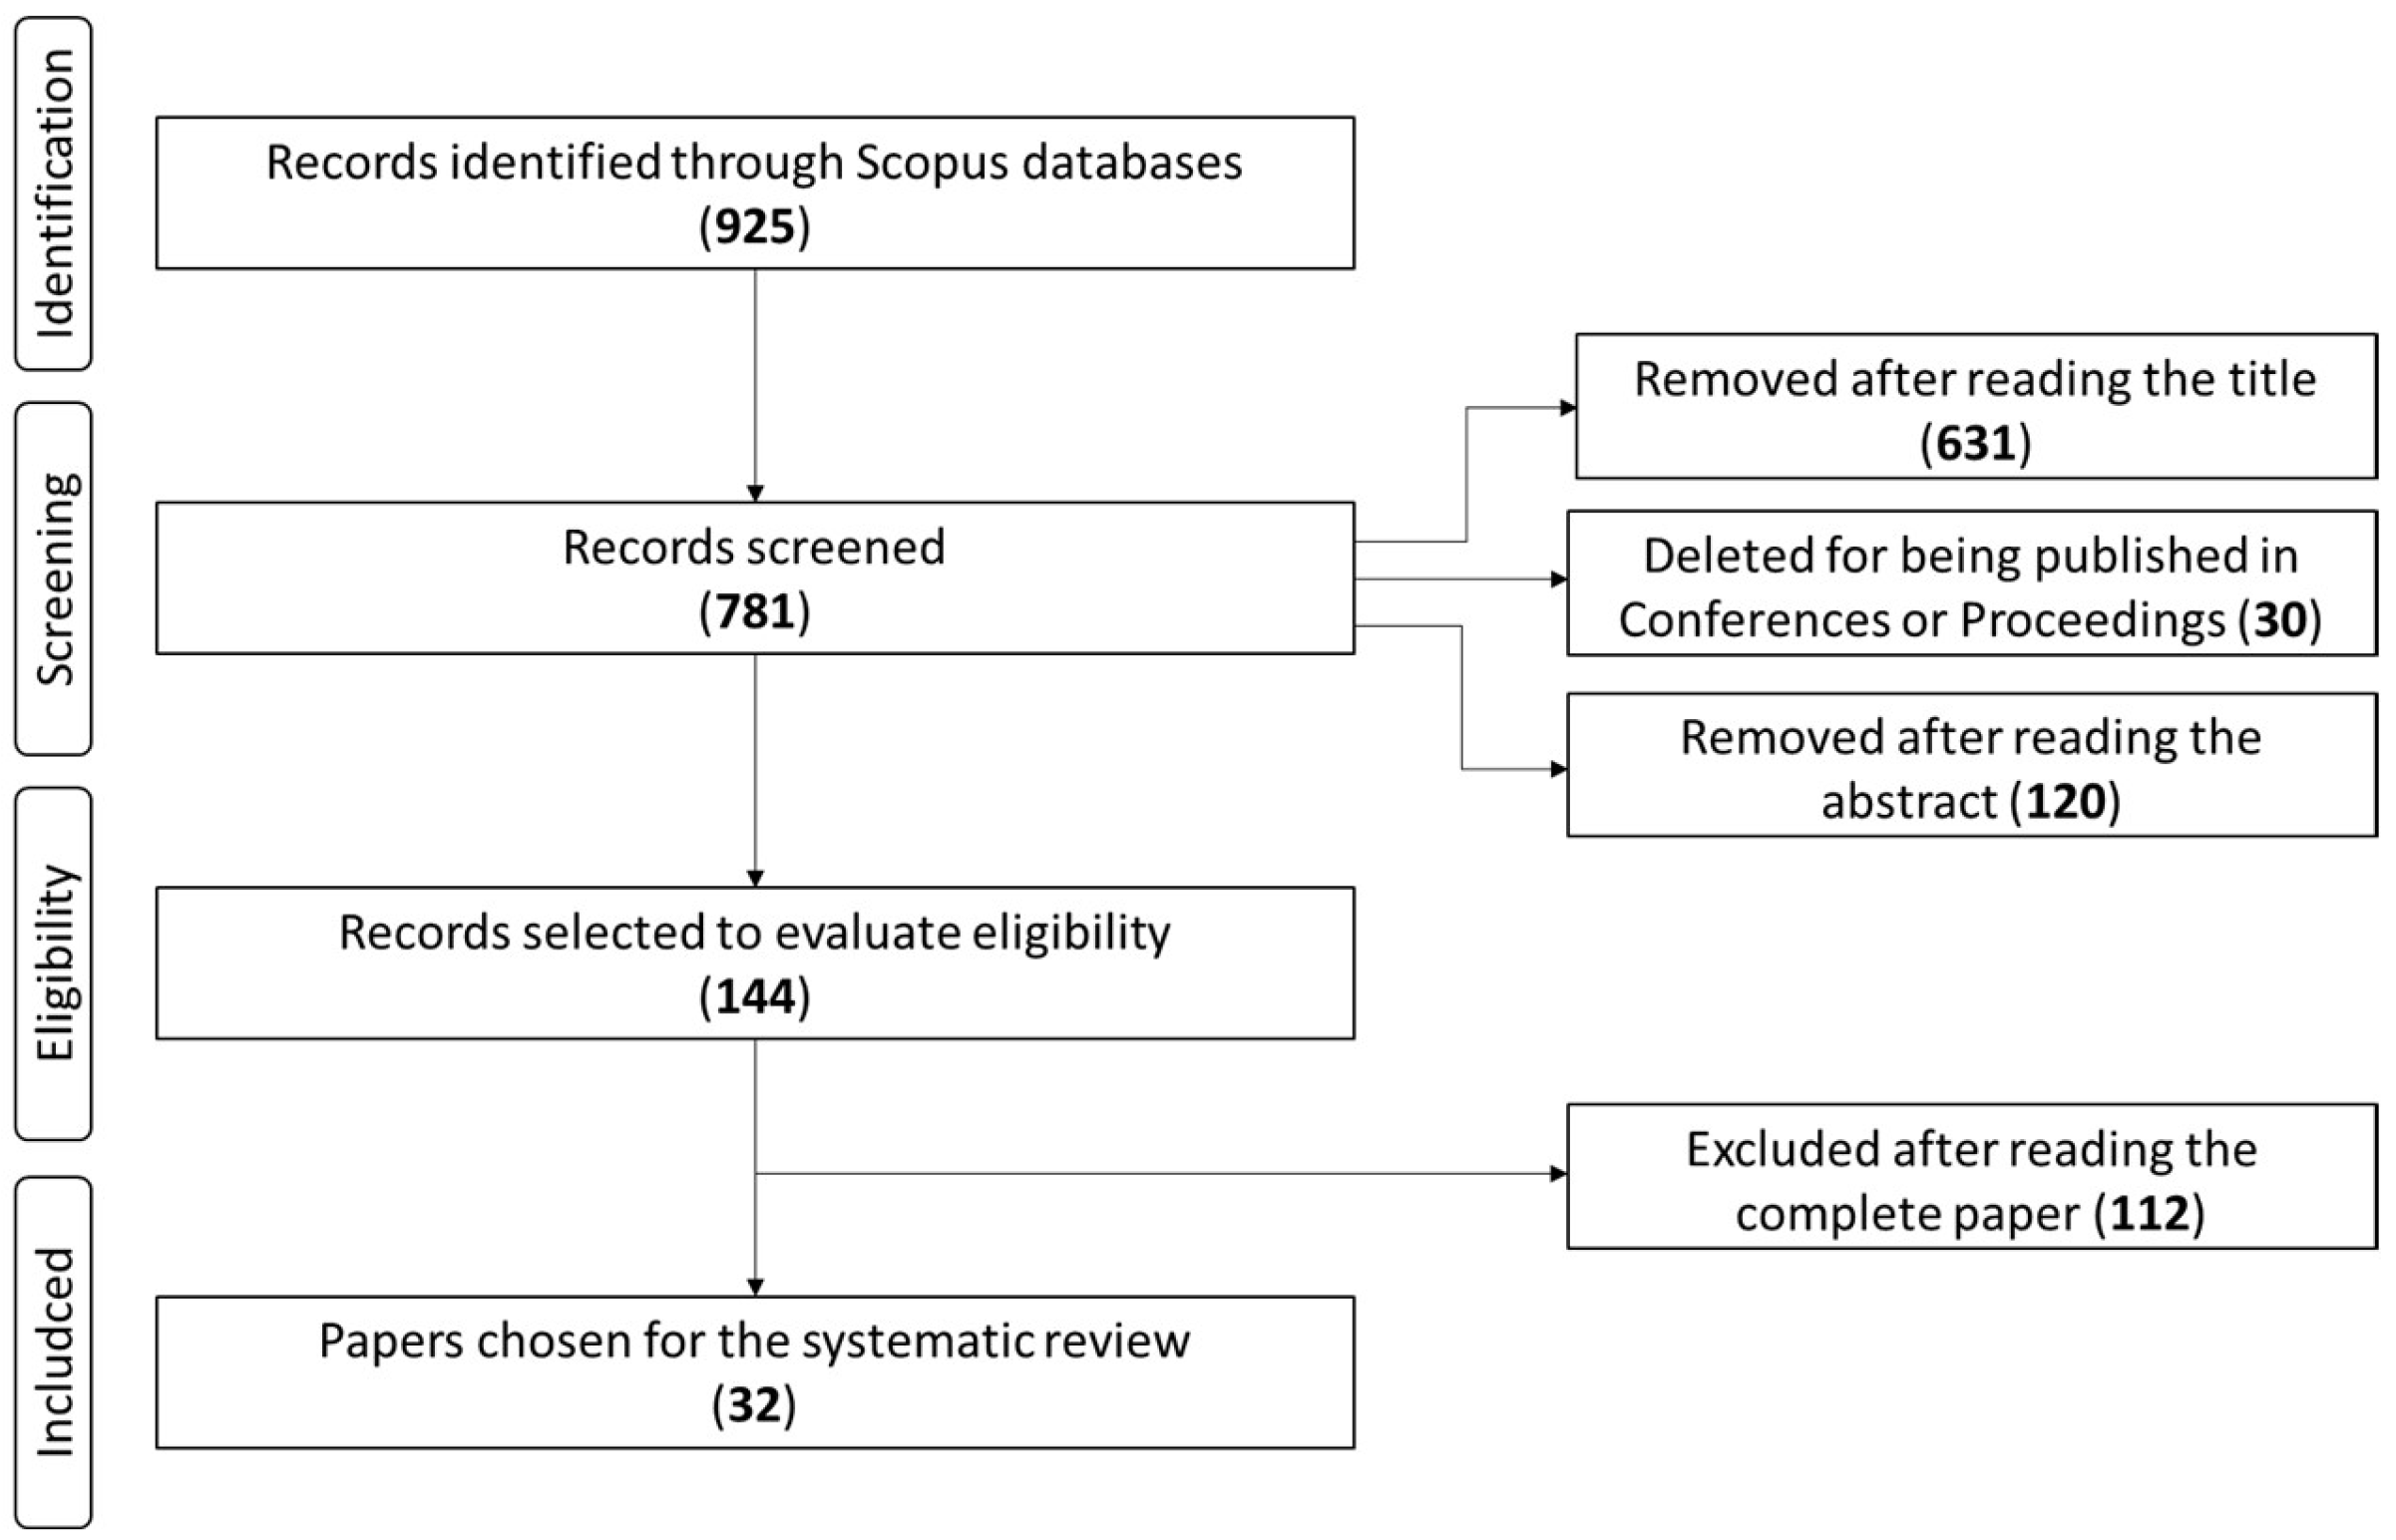
Because of the bibliographic search in the Scopus database and the PRISMA methodology, 925 articles were identified. Then, the first screening by title indicated that 631 articles did not meet the selection criteria for this review, resulting in 265 articles. Then, we applied the following screening for work published in conferences or proceedings, which allowed the elimination of 30 articles. Afterward, screening by abstract revealed that 120 studies did not meet the review’s objectives. Thus, the final screening by the full-text reading of the remaining papers revealed that 112 articles were related and did not apply to machine learning techniques concerning the keywords under study. Therefore, the final list excluded these articles. Finally, this work includes 32 articles regarding the application of ML algorithms to predict mortality risk in COVID-19 patients and comorbidities.

3.1. General Analysis

The study was able to provide evidence from the reference list of the 32 studies used in this review in Table 3. The literature review shows 32 articles focused on four main areas: (1) detection of COVID-19 using ML techniques, (2) prediction of risk of dying based on COVID-19 comorbidity using ML techniques, (3) prediction of COVID-19 using ML techniques, and (4) improvement of COVID-19 prediction using ML techniques. The highest proportion 47.6% of the studies focus on “Predicting the risk of dying in COVID-19 patients and with comorbidity using ML techniques”. Additionally, 33.33% of the reviewed papers are oriented towards “Predicting COVID-19 using ML techniques”. With less relevance appear the studies related to “Detection of COVID-19 using ML techniques” and “Improvement of COVID-19 prediction using ML techniques”, with 9.5% respectively.

3.2. Algorithms

Table 4 shows the group of 22 algorithms applied in the 32 papers and the number of papers that adopted the methods. The review revealed that the most used ML algorithm was random forest (RF) (n = 11, 24%), followed by eXtreme Gradient Boosting (XGBoost) (n = 6, 13%), logistic regression (LR), and K-nearest neighbor (KNN), with (n = 3, 7%). Other algorithms, such as convolutional neural network (CNN), decision tree (DT), CatBoost, and artificial neural network (ANN), were implemented twice (n = 2, 4%) within the 32 studies reviewed. We found that 13 algorithms were implemented once within the reviewed papers (n = 1, 2%). Finally, we found that all the studies employed multiple algorithms; however, they highlighted that all are supervised ML algorithms, and it is possible to assume that, in mortality risk prediction in COVID-19 and comorbidity patients and related areas, the tendency is not to use only “Unsupervised” ML algorithms.
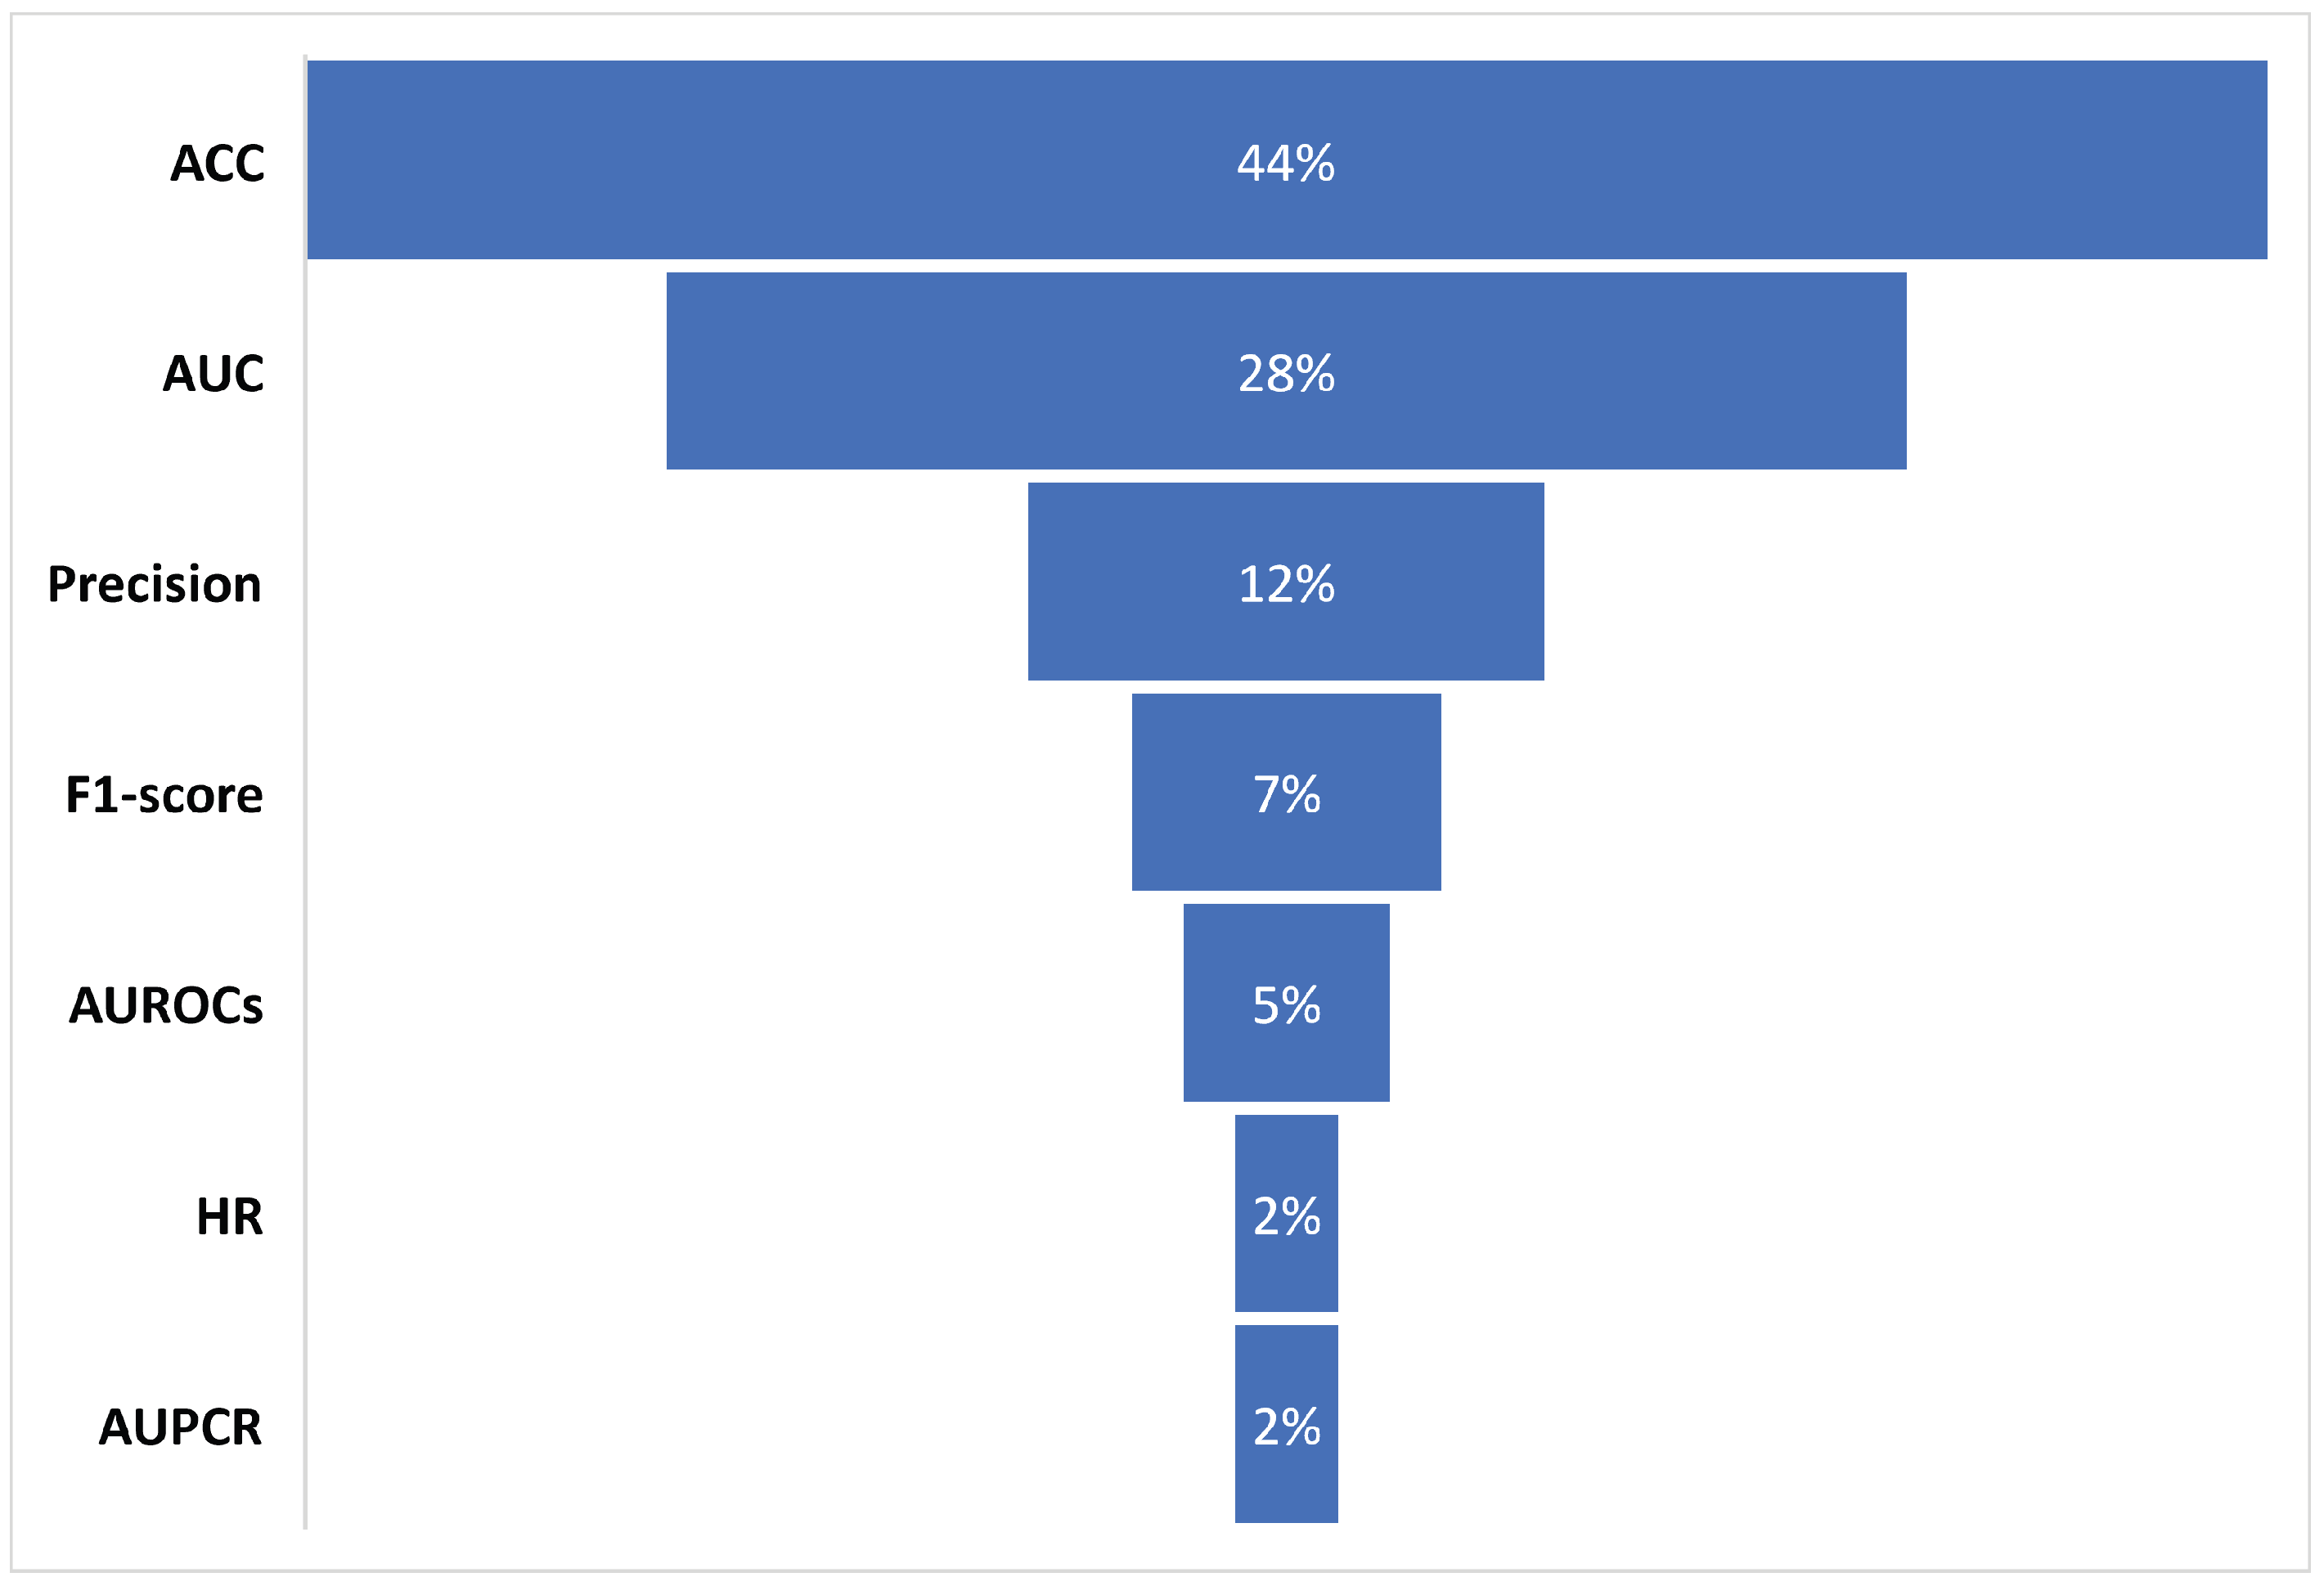
This review considered all reported algorithms from reviewed studies. Concerning the performance of the prediction models, the essential process is the evaluation of the ML algorithms used in the model, which is based on a series of performance metrics. The most used metrics for the 32 included studies were HR, ACC, AUC, F1-score, precision, AUPCR, and AUROCs. As a result, Table 5 shows that the most used metrics by the 32 studies to evaluate the performance of the algorithms used in the prediction models were ACC and AUC, with 19 and 12 times, respectively. Finally, Figure 2 shows the percentages of use of the metrics in the articles reviewed in this work.
Regarding the performance of the algorithms used in the prediction models, many studies evaluate and compare two or more metrics (we found in the study papers that they evaluated at least five algorithms [59,60,67,76,77,86]), and to facilitate the understanding of the results, this analysis selected the metrics that reported the best performance within each study. Consequently, Table 6 contains the average of the best values presented by the metric in each study. The research found that ACC and AUC were the most used metrics to evaluate performance within the 32 reviewed studies.

3.3. Algorithm Metrics Performance

Every prediction method uses different algorithms to evaluate its performance, depending on the type of prediction, the use of clinical data, and the scope of the study; the results between one metric and another may differ depending on the algorithm used in the model. The study found that the ACC and AUC metrics have the worst record, with RF algorithms at 65% and 78%. In addition, RF obtains better performance with the ACC metric of 97%, while with AUC, it only reached 89%. The XGBoost algorithm, which is of greater use to ACC, obtains a maximum 98% performance, superior to the best performance of ACC with RF. The LR algorithm received its best performance with the ACC metric (94%), the lowest with AUC (78%), and the FM algorithm evaluates using ACC, F1-S, PREC, and AUC metrics at a performance higher than 90%. Finally, metrics such as HR and AUPCR, which presented a performance below 83%, and F1-S with AUROCs, were evaluated by two algorithms and showed a maximum performance of 92% and 97%, respectively.
Additionally, it is known a priori that “the higher the accuracy of an algorithm, the greater the possibility of making an accurate prediction.” 
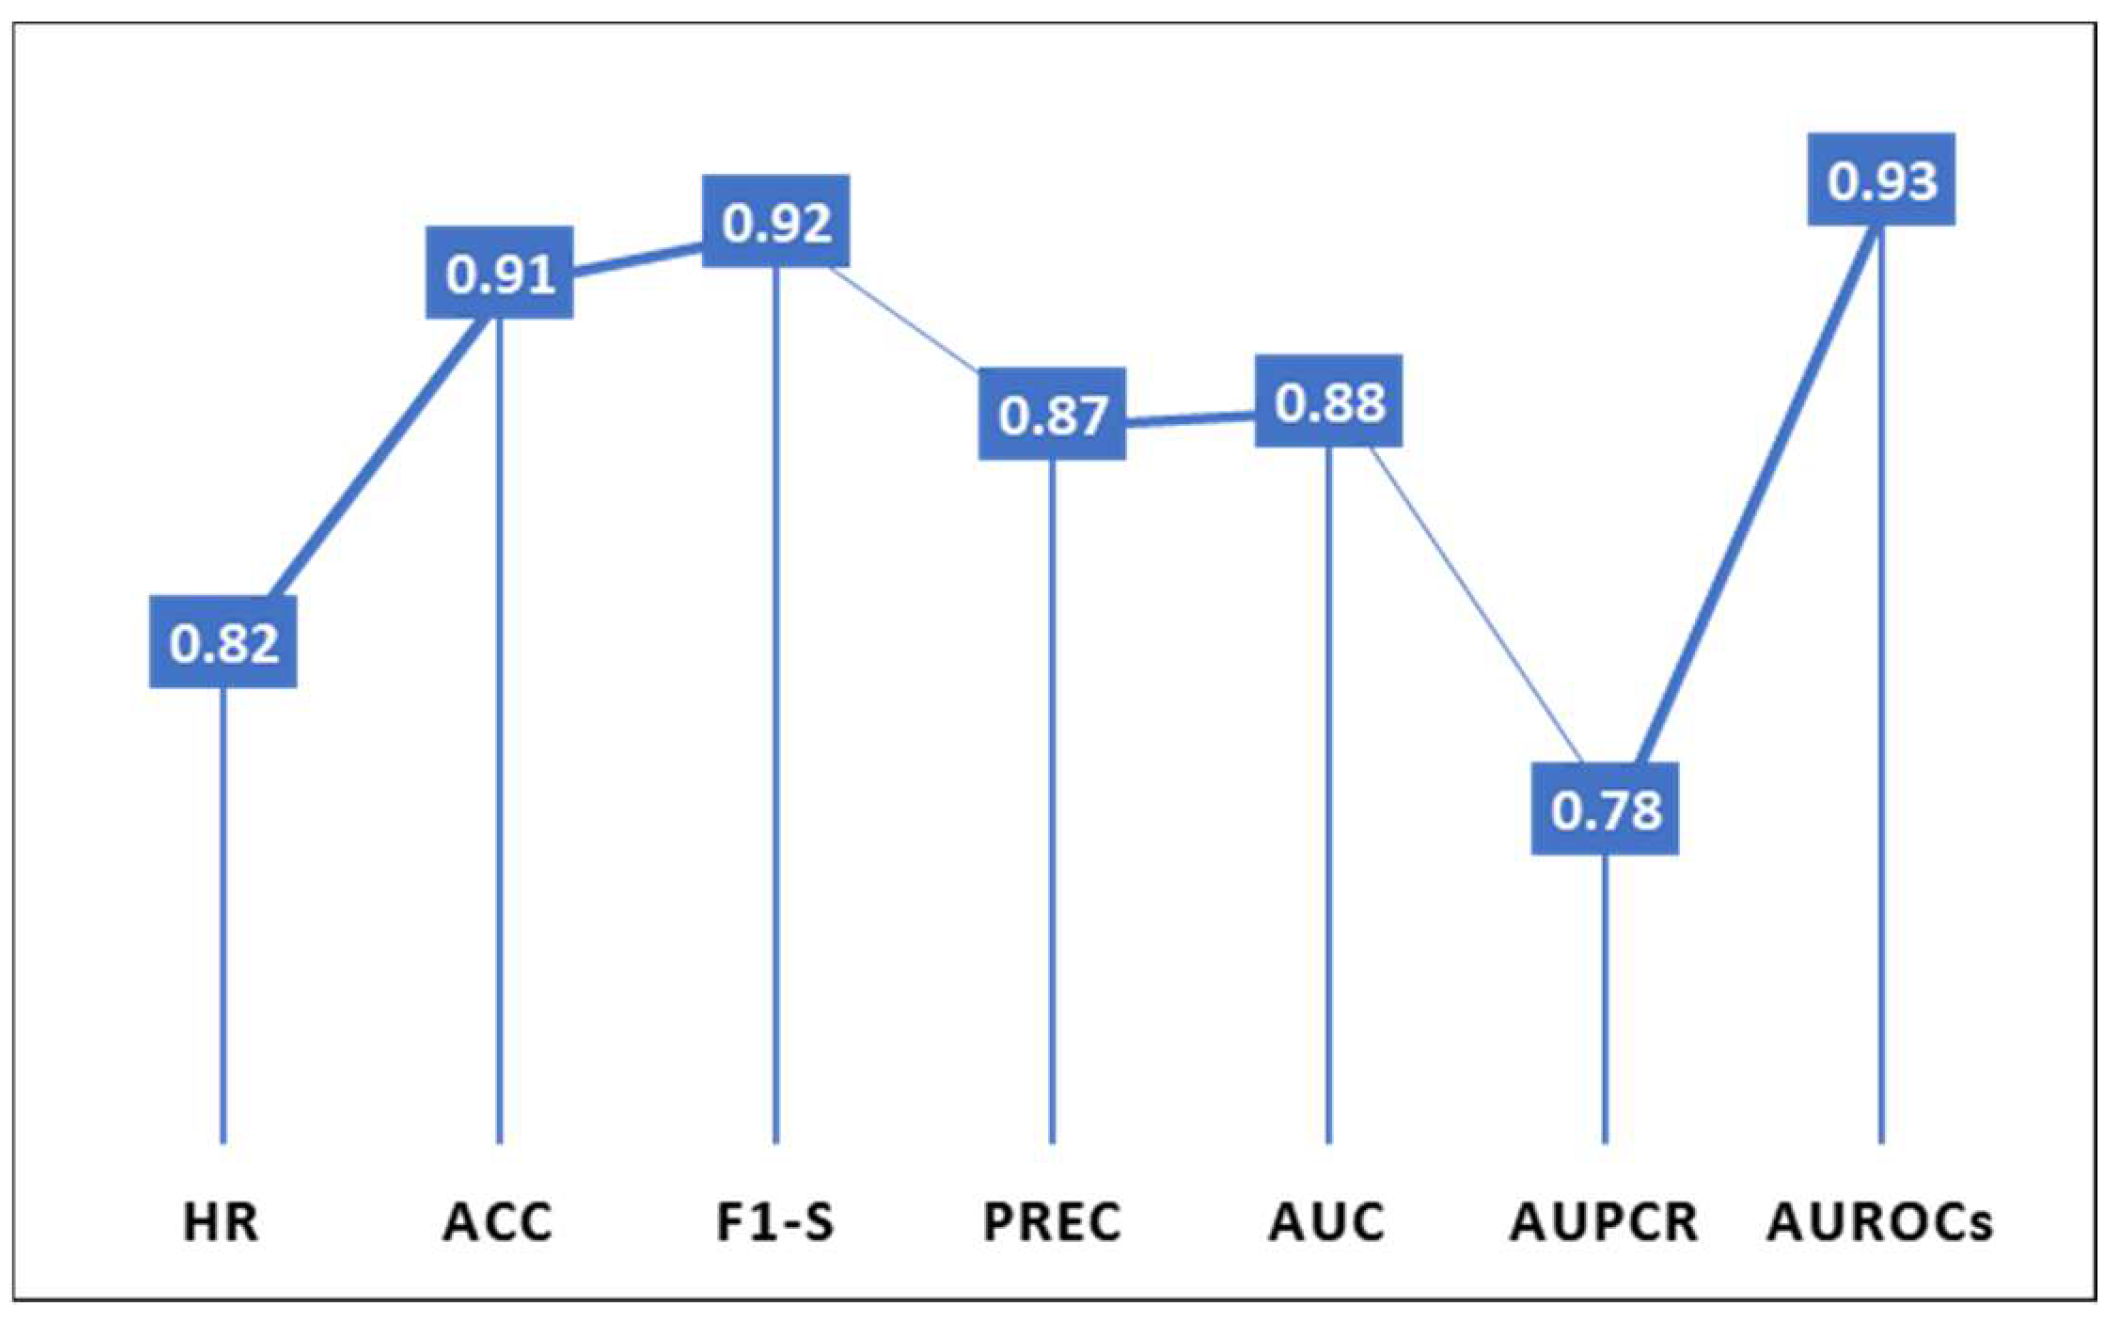
Figure 3 presents the overall average performances of the metrics used in the studies analyzed, where the metrics with the best prediction rate were AUROCs (93%), followed by F1-S (92%) and ACC (91%). The rest of the metrics had a 78% and 87% prediction rate.
The above implies that, in mortality risk prediction in COVID-19 and comorbidity patients and related areas, the preferred metric for assessing prediction accuracy is ACC, followed by AUC, where F1-S also stands out, offering pressure greater than 90%.

3.4. Average Performance of the Algorithms Based on the Feature Selection Technique Metric Performance

Data are the essential components of dataset prediction models, containing independent and predictive features. However, identifying the most important features of a model is a complex and crucial step to ensure the robustness and accuracy of models based on AI algorithms [89,90,91]. Therefore, this paper presents Table 7, the classification of the feature selection techniques used by the prediction methods of the reviewed studies.
The feature selection technique most used was reduced feature set (RFS), followed by time series, A-priori (They do not use any in particular), and K-fold cross validation (K-fold CV). The rest of the techniques were used a maximum of two times. The method with the lowest performance was time series, with 65% for the RF algorithm, followed by SHapley Additive exPlanations (SHAP), with 78% for XGBoost (with a minimum performance of 94%). Chi-square (CNN, Bagging), Kaplan Meier (KM) (XGBoost), RFS (LR, KNN, XGBoost, DT), and SHAP (RF) techniques were all used, and the rest of the techniques were lower than 93%.
Figure 4 shows the average performance values of the algorithms as a function of the feature selection technique, such as time series, SSR, and MRMR. At the same time, we identified that KM and SHAP have the best performance.
Finally, we identified that, in mortality risk prediction in COVID-19 and comorbidity patients and related areas, the feature selection techniques which allow the achievement of a probability greater than or equal to 95% of obtaining more accurate prediction models are KM and SHAP.

3.5. Algorithms Performance Average

Table 8 introduces the average performance of the metric with the best accuracy of the algorithms found in each of the 32 papers and shows that the algorithms RF, CNN, CAIM, XGBoost, and DT have the highest performance, with a minimum of 96% accuracy for the prediction model. The RNN, KNN, CoxSA, CovRNNN, and GB-ADAM algorithms stand out, whose performance is between (90–95%). At the last level, there are algorithms, such as EC, LR, KM, Bagging, EC, NBS, and CatBoost, with a performance between (89–76%).
A detailed review shows the performance algorithm in [86], which evaluates seven algorithms, e.g., CatBoost obtained the best performance, with 76% for the PREC metric. The study shows that the optimization of the features classified in an inferential way the values for each feature with three levels (high, medium, and low). The over-parameterization of features is a factor that could influence the quality of the accuracy metrics evaluated in each algorithm. However, ref. [80] evaluated LR, SVM, KNN, RF, and XGBoost algorithms. For optimization of the samples (features) used, two techniques (SMOTE, ADASYN) were applied, which allowed the prioritization of two features (age, exposure) for the training of the algorithm, which resulted in 97% accuracy for the ACC metric. The above may mean that the techniques and the number of feature optimization techniques applied in the model impact the final performance.

3.6. Platforms or Tools Used for Mortality Risk Prediction in COVID-19 Patients and Comorbidity

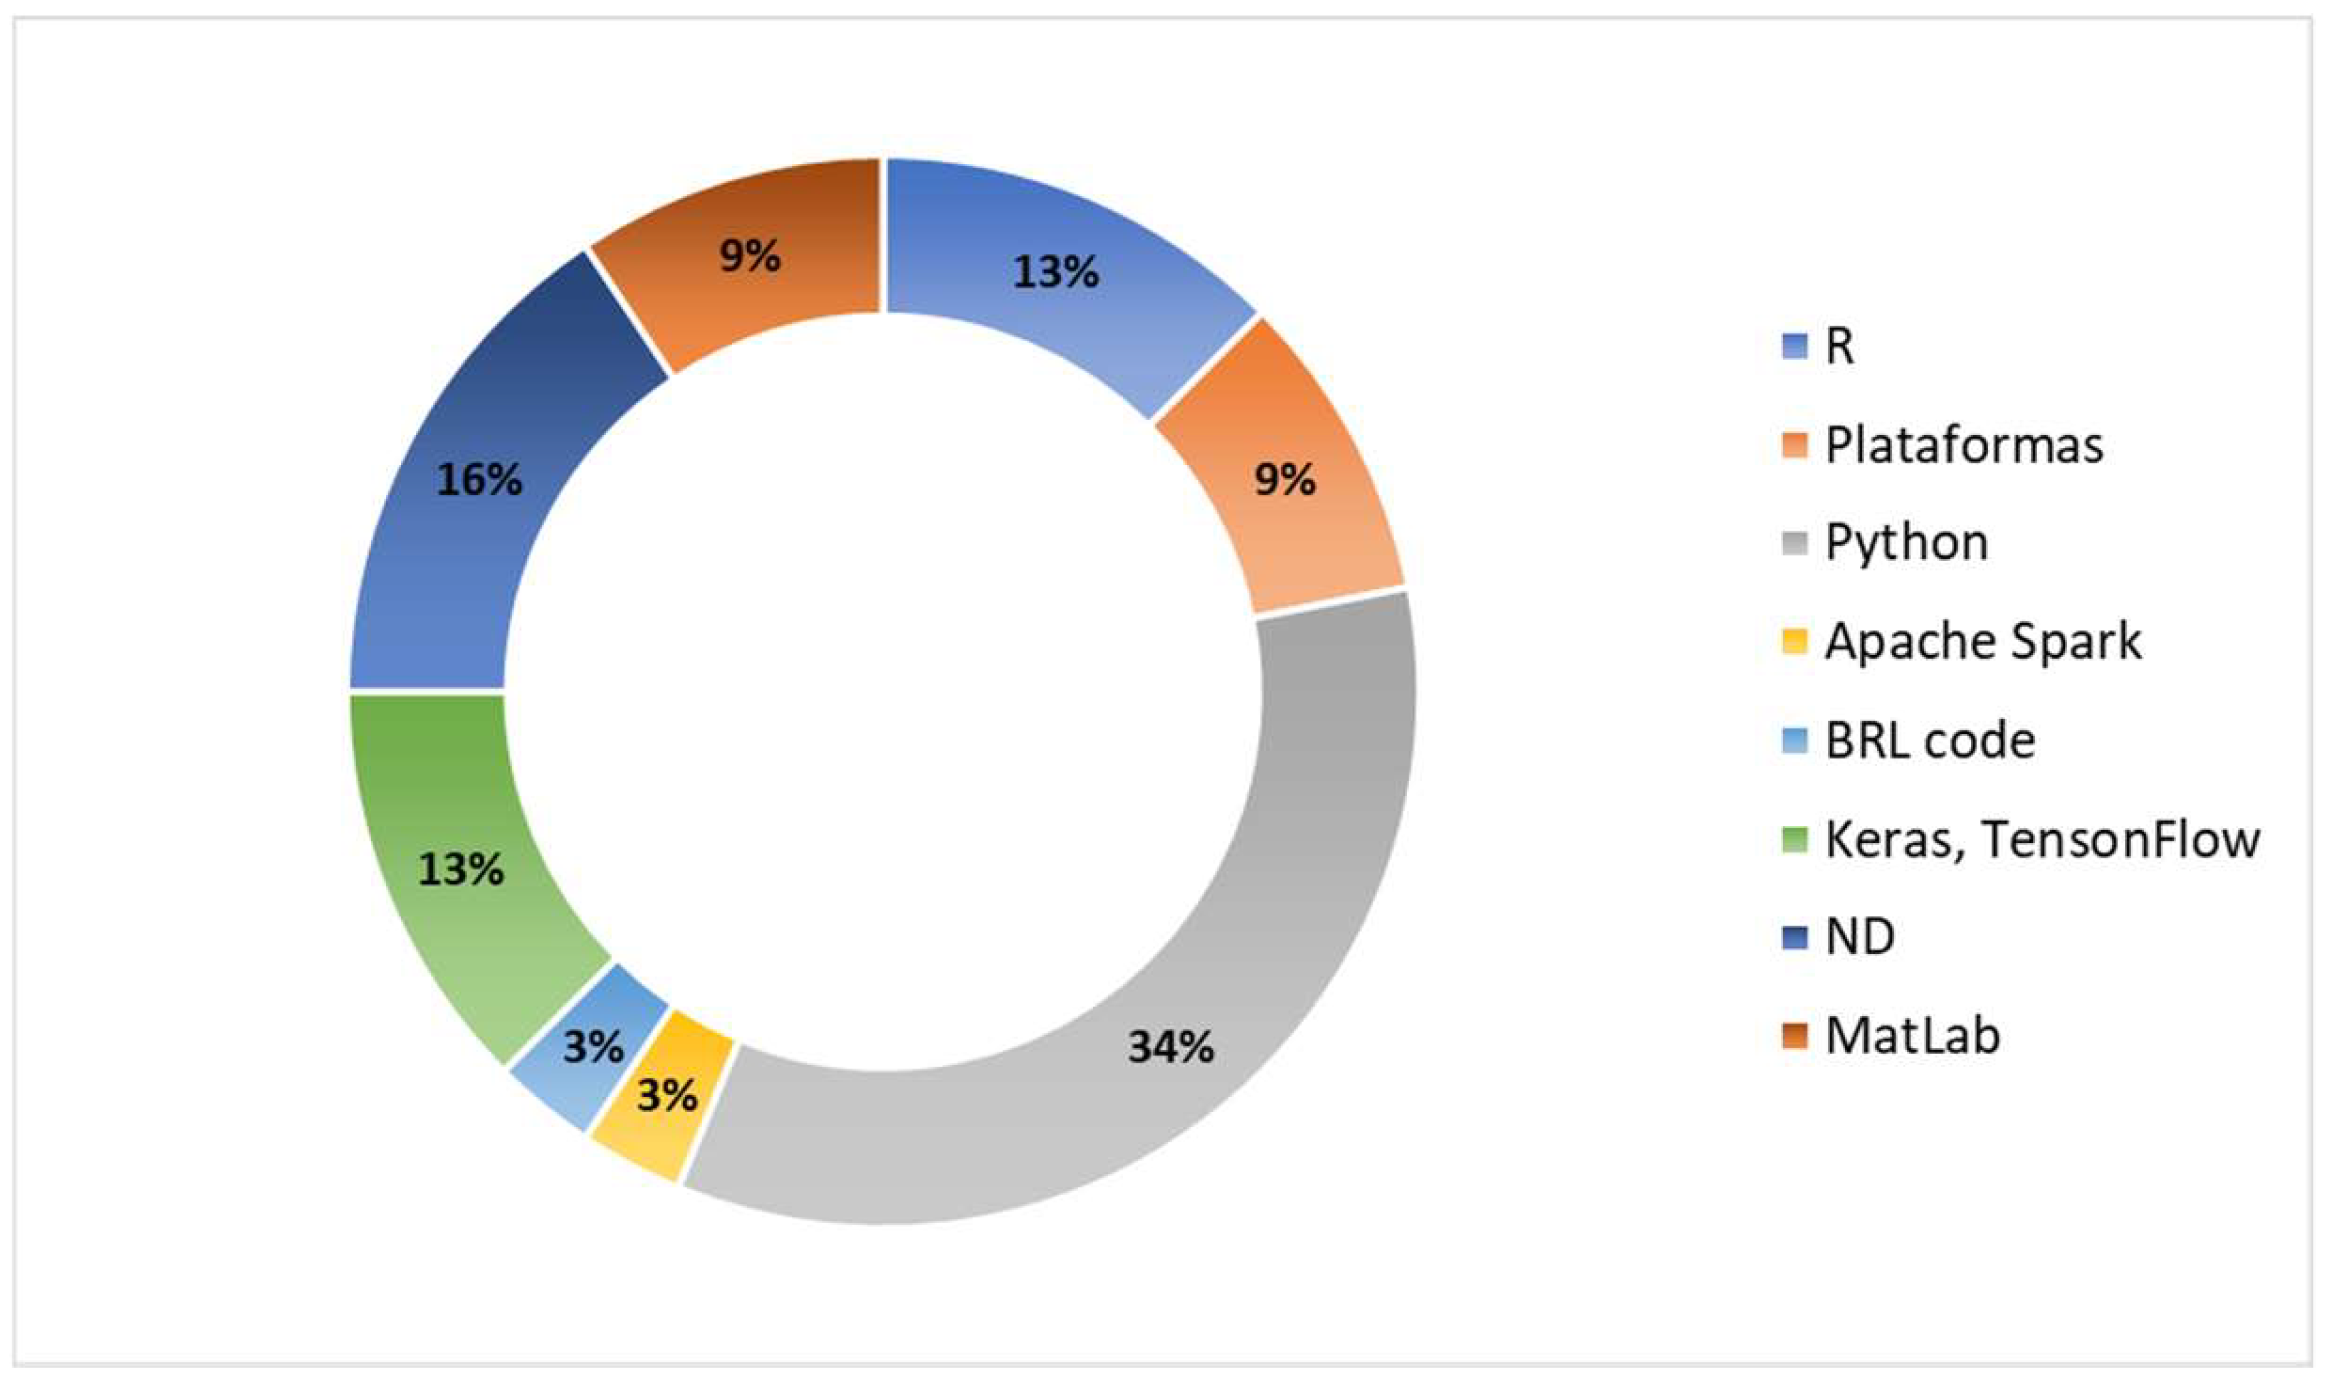
The review allowed found that Python was the most used tool for the implementation of mortality risk prediction models in COVID-19 patients with comorbidity, with 34% (11/32). The reviewed studies evidence the strengths of the tool for several aspects, such as open-source, multiplatform, a large number of libraries, reusable code, easy to learn, using high-level language for coding, and an extensive community of collaborators around the world. However, they are characterized by being slow in specific processes due to memory consumption.
The study demonstrated that 13% (4/32) of the R language includes linear and non-linear models, easy-to-create graphics, multiplatform, and open-source material. However, it can be challenging to learn and slow to function with regards to many programming languages. Keras-TensorFlow appears with 13% (4/32) of participation in the reviewed works, which has, as a differentiating character, the use of neural network algorithms and its compatibility with Python. However, it adds a layer of complexity to the processing because it uses dependencies. Regarding MatLab, only 9% (3/32) of studies used it, although it offers high precision in its calculations, comprehensive support, fast prototyping, and an extensive community. However, it is necessary to pay a license fee for its use. For more details, see Table 9.
On the other hand, 9% (3/32) of the papers use various (online, web-based) specific platforms to implement the prediction method. Finally, one work used Apache Spark and BRL code tools. Figure 5 illustrates the percentage of participation of each tool among the reviewed papers. Finally, it is important to mention that, based on many essential features, the researchers of the scanned documents rely on the Python tool to implement the designed prediction models.

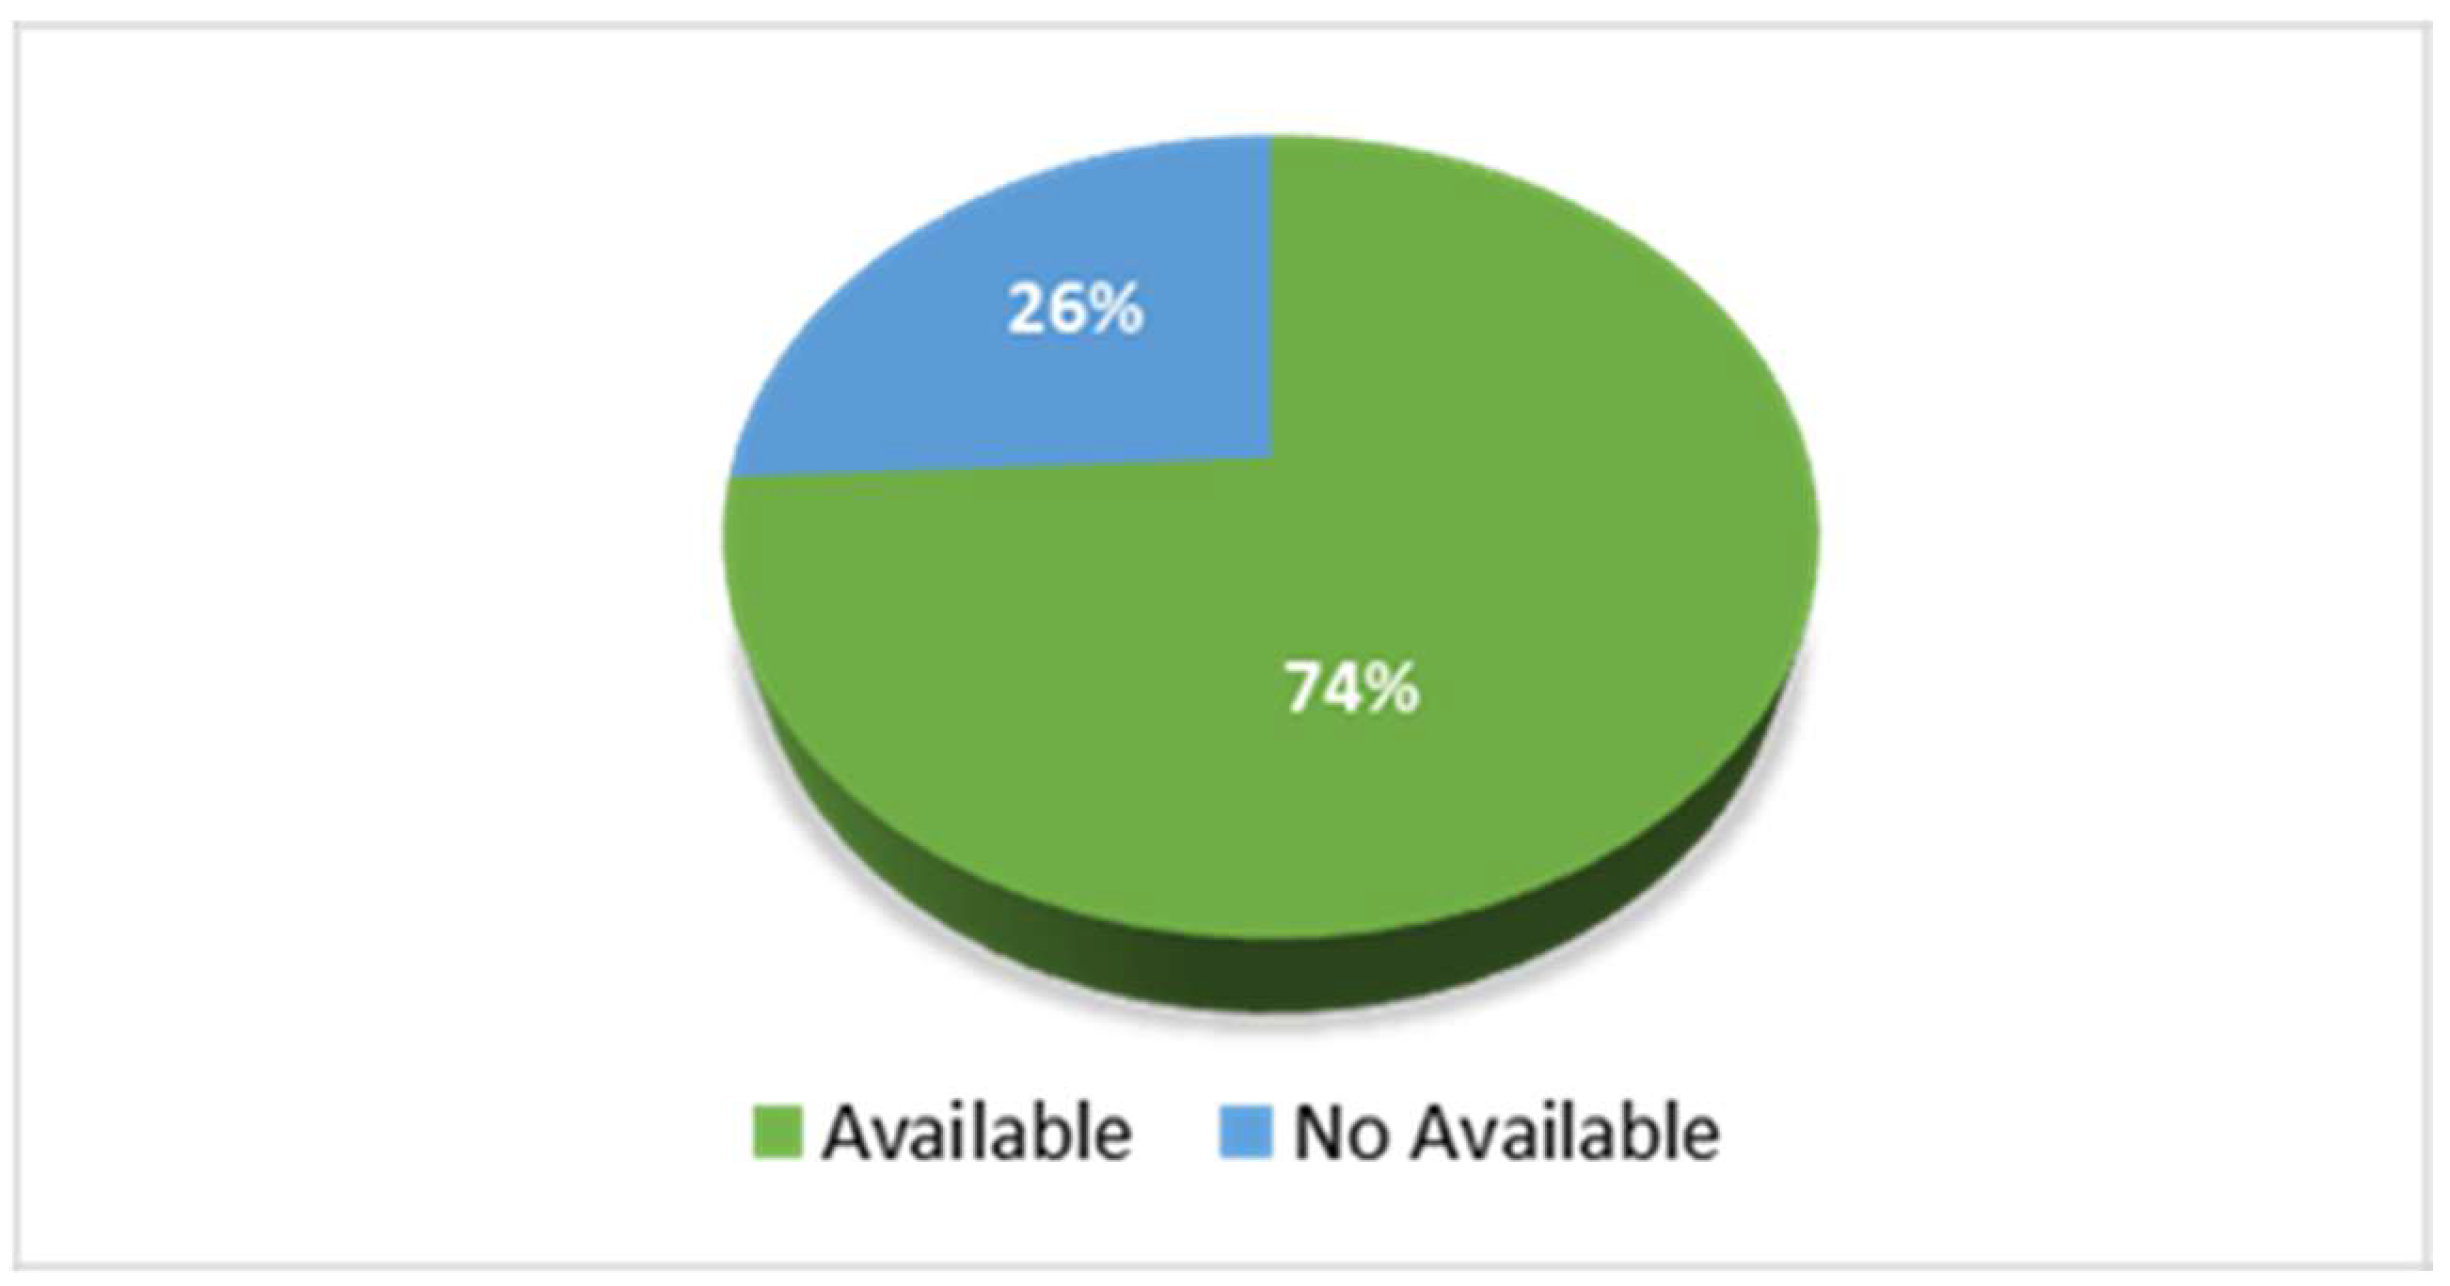
3.7. Datasets Found in the Reviewed Studies

The analysis of the 32 selected works revealed that only seven papers have available databases. Some works need to request the dataset from a specific author (at the author’s discretion), and others explicitly stated that the dataset was unavailable. In summary, Figure 6 presents a distribution of the findings. Studies have shown web-based systems implementations for mortality risk prediction in COVID-19 and comorbid patients. You can view available datasets and platforms in Table 10.

4. Bibliometrics Analysis

This section presents a brief bibliometric analysis to introduce the trend of rapidly emerging topics in mortality risk prediction in COVID-19 and comorbidity patients research based on ML algorithms, where significant applied research activity has been extensively initiated since the beginning of the final phase of the pandemic. We focus on the methodology used in the bibliometric analysis, allowing traceability of the state of research applied in the different aspects of mortality risk prediction in COVID-19 patients and related research that can be found in the literature analysis. Therefore, we present the bibliographic articulation between various articles on machine learning to combat COVID-19, diagrammed by links between clusters representing networks and correlations, built based on the relationship between the number of publications, citations, countries, standard references, co-citations, organizations, and journals.
To achieve the above, 925 articles from the primary collection were identified in the SCOPUS Bibliographic Database between 2019 and 2022 and the VOSviewer bibliometric analysis software was used to analyze the selected information.

4.1. Prolifics Authors

Figure 7 shows the bibliographic coupling between authors with at least one citation and four published papers (resulting in 22 authors with this coincidence), where the clusters, in red, blue, and green represent the authors who had developed similar works related to the prediction of mortality risk in COVID-19 patients and patients with comorbidity, based on ML algorithms, and who cite the same source in their reference lists. The similarity in the color of the authors’ clusters also implies a more significant overlap between the reference lists of these authors’ publications. Additionally, shows visible names which may not be included in the map structure.
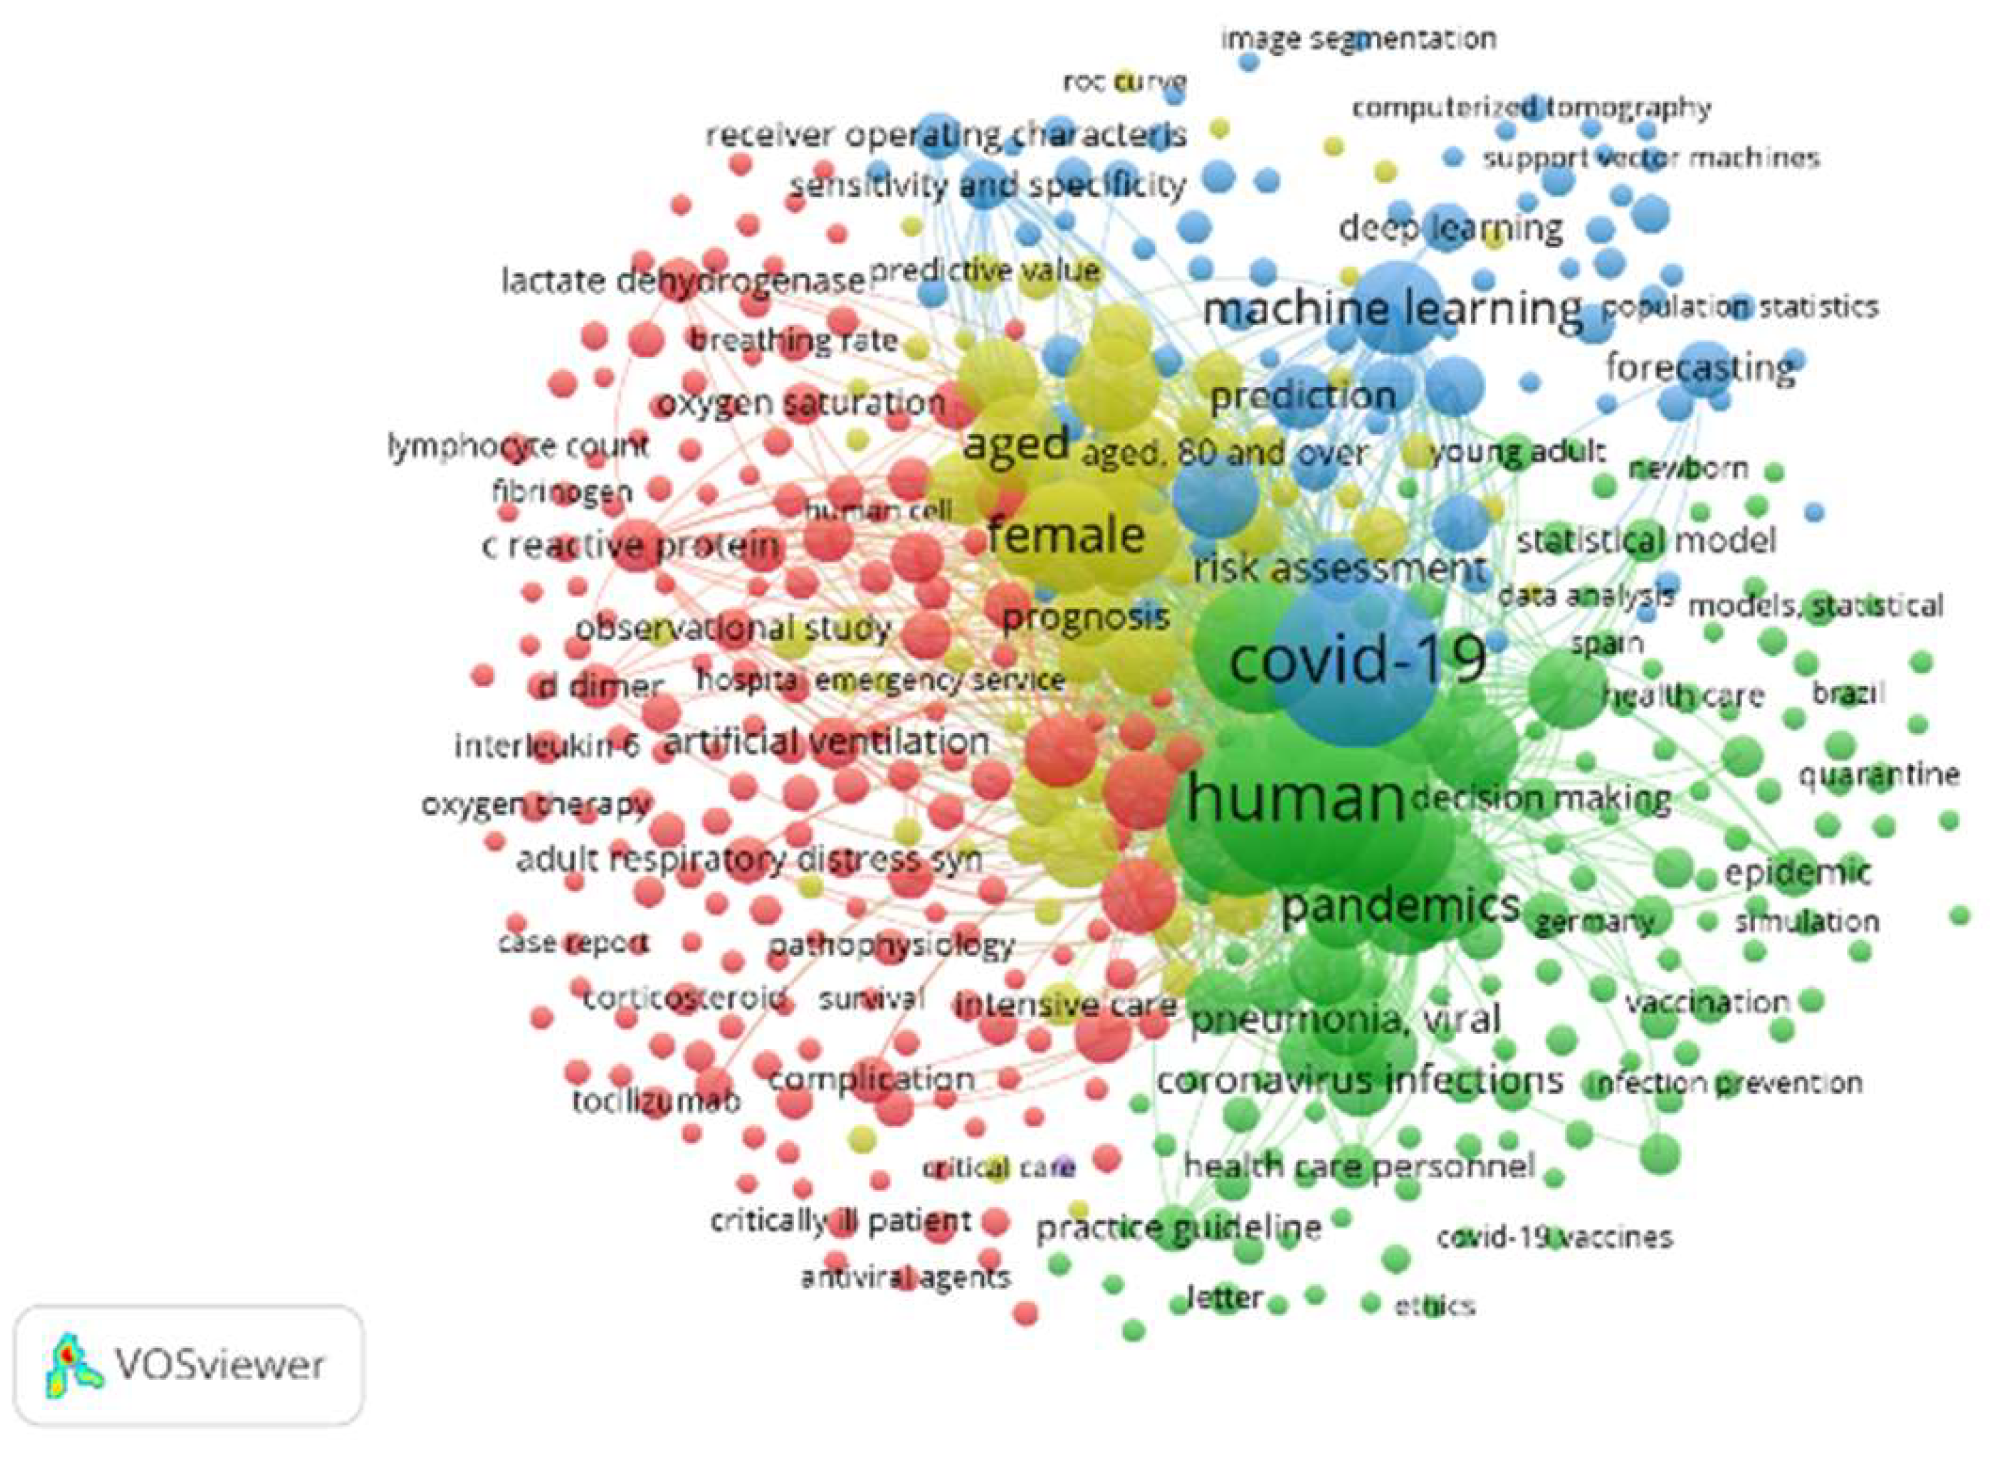
4.2. Keywords

Figure 8 highlights two clusters. First, the largest cluster (blue color) shows the appearance of the keyword “COVID-19” 660 times, which, in turn, is related to research using the keywords “Machine learning” and “Deep learning,” which appear 203 and 61 times, respectively. This indicates interest in research that applies artificial intelligence tools or techniques to “COVID-19” topics. Secondly, the green clusters, with the keywords “algorithm” and “algorithms”, have between 372 and 191 occurrences, respectively, and show developed methods or procedures addressing to topic related to “COVID-19.”
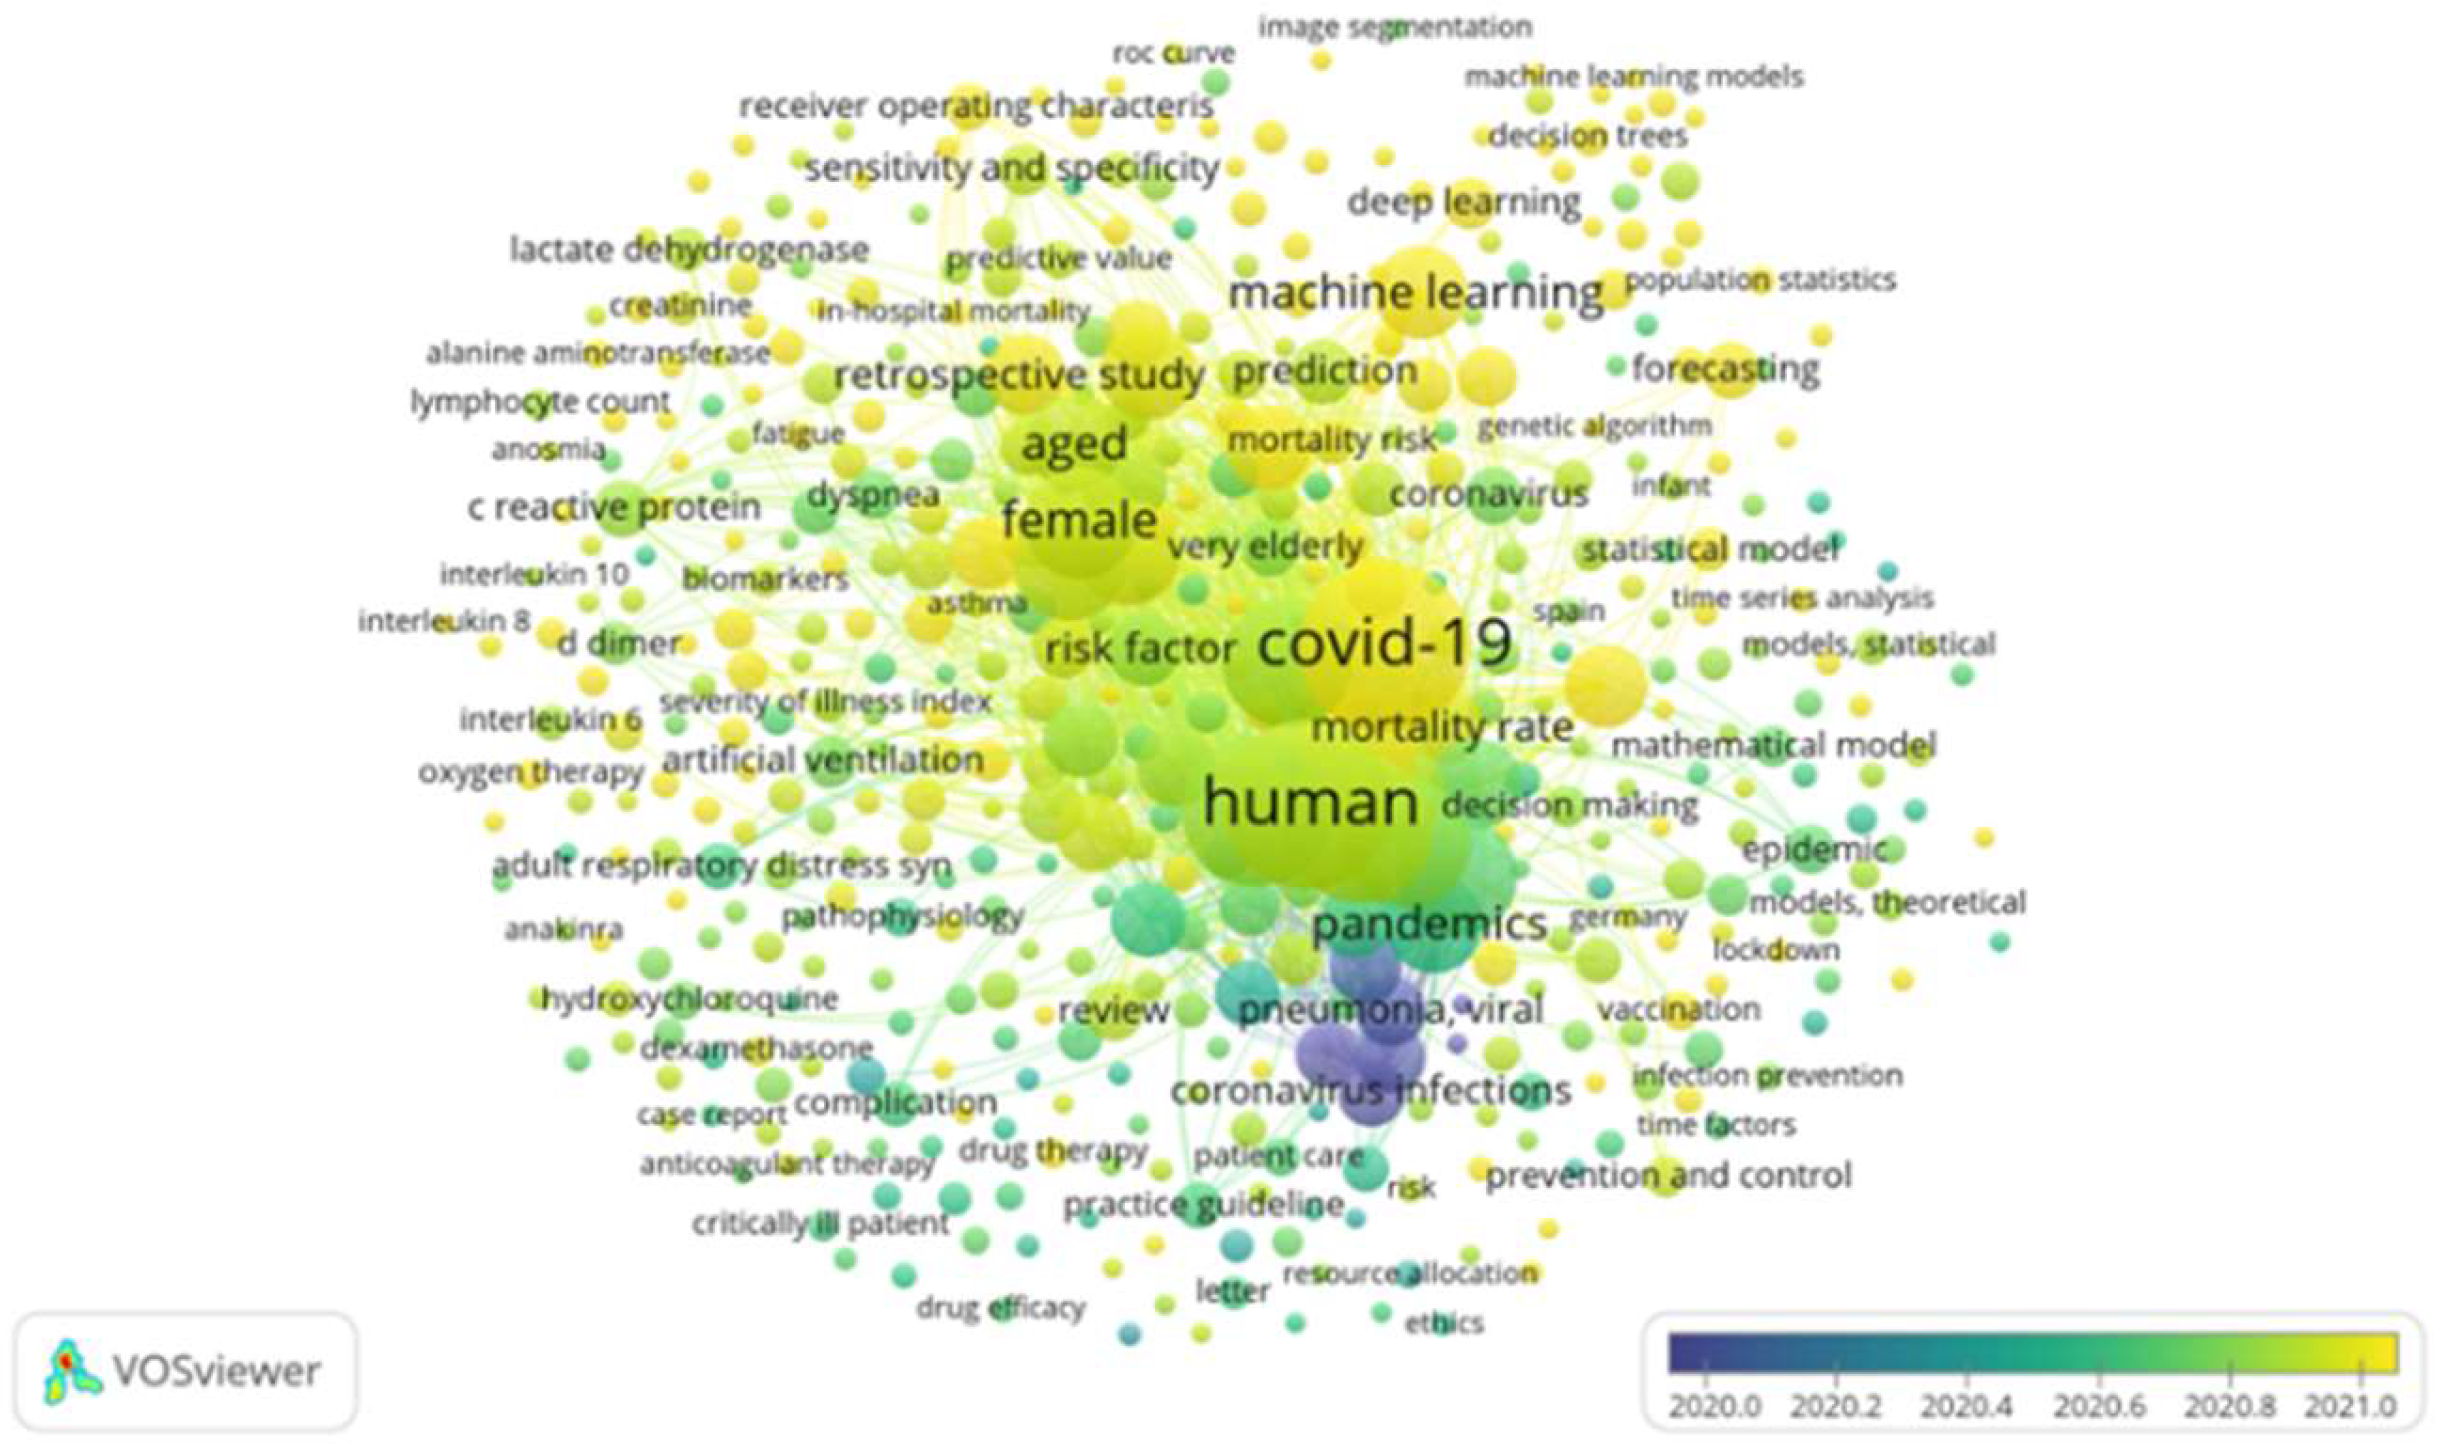
Figure 9 shows that the topics covered in the studies reviewed (between 2020 and 2021) are concentrated in small visualization of the co-word network in the research topic “AI applied to COVID-19”. Note: the visualization of the co-word network was based on occurrences.
Clusters (lilac and dark green) represent the beginning of the pandemic in 2020, where general topics, such as coronavirus infections, pneumonia virus, c-reactive protein levels, and pneumonia virus, among others, were covered. Then, in the mid-late 2020 (lemon-green clusters), they represented topics even closer to the subject of this work, where the mathematical model, comorbidity, and risk factor stand out. Finally, the yellow-colored clusters represent papers that address specific concepts directly related to the topic of study of this work, where we can highlight COVID-19, SARS-CoV-2, hospital mortality, machine learning, artificial intelligence, algorithm, hospital mortality, artificial neural networks (ANN), diabetes mellitus, coronavirus, as well as others with lower correlation index, such as deep learning, forecasting, diagnosis, statistical model, diabetes, blood sugar levels, and decision trees.

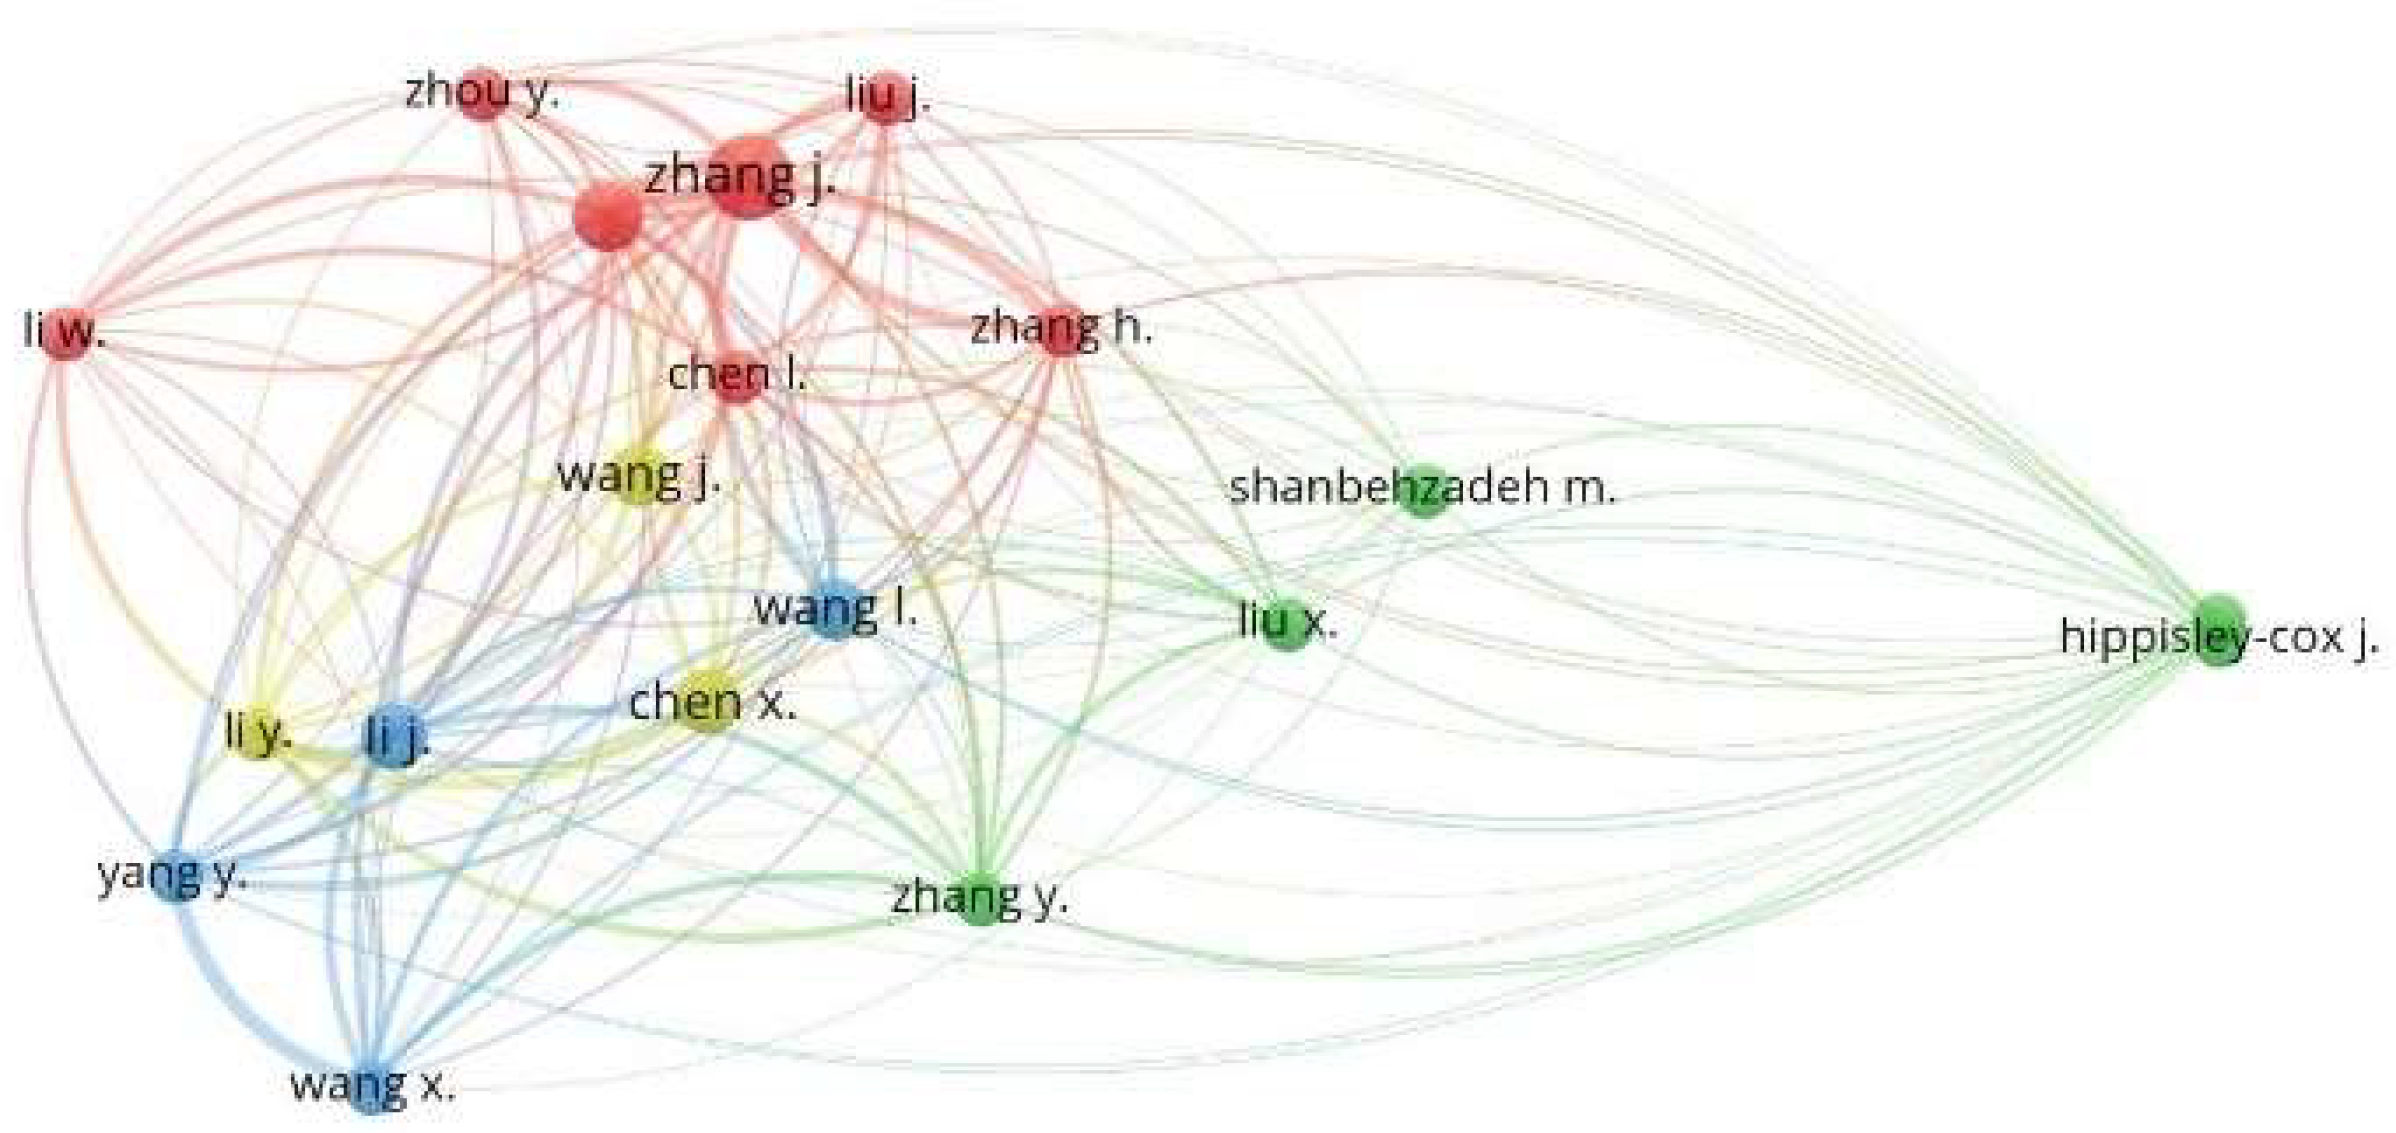
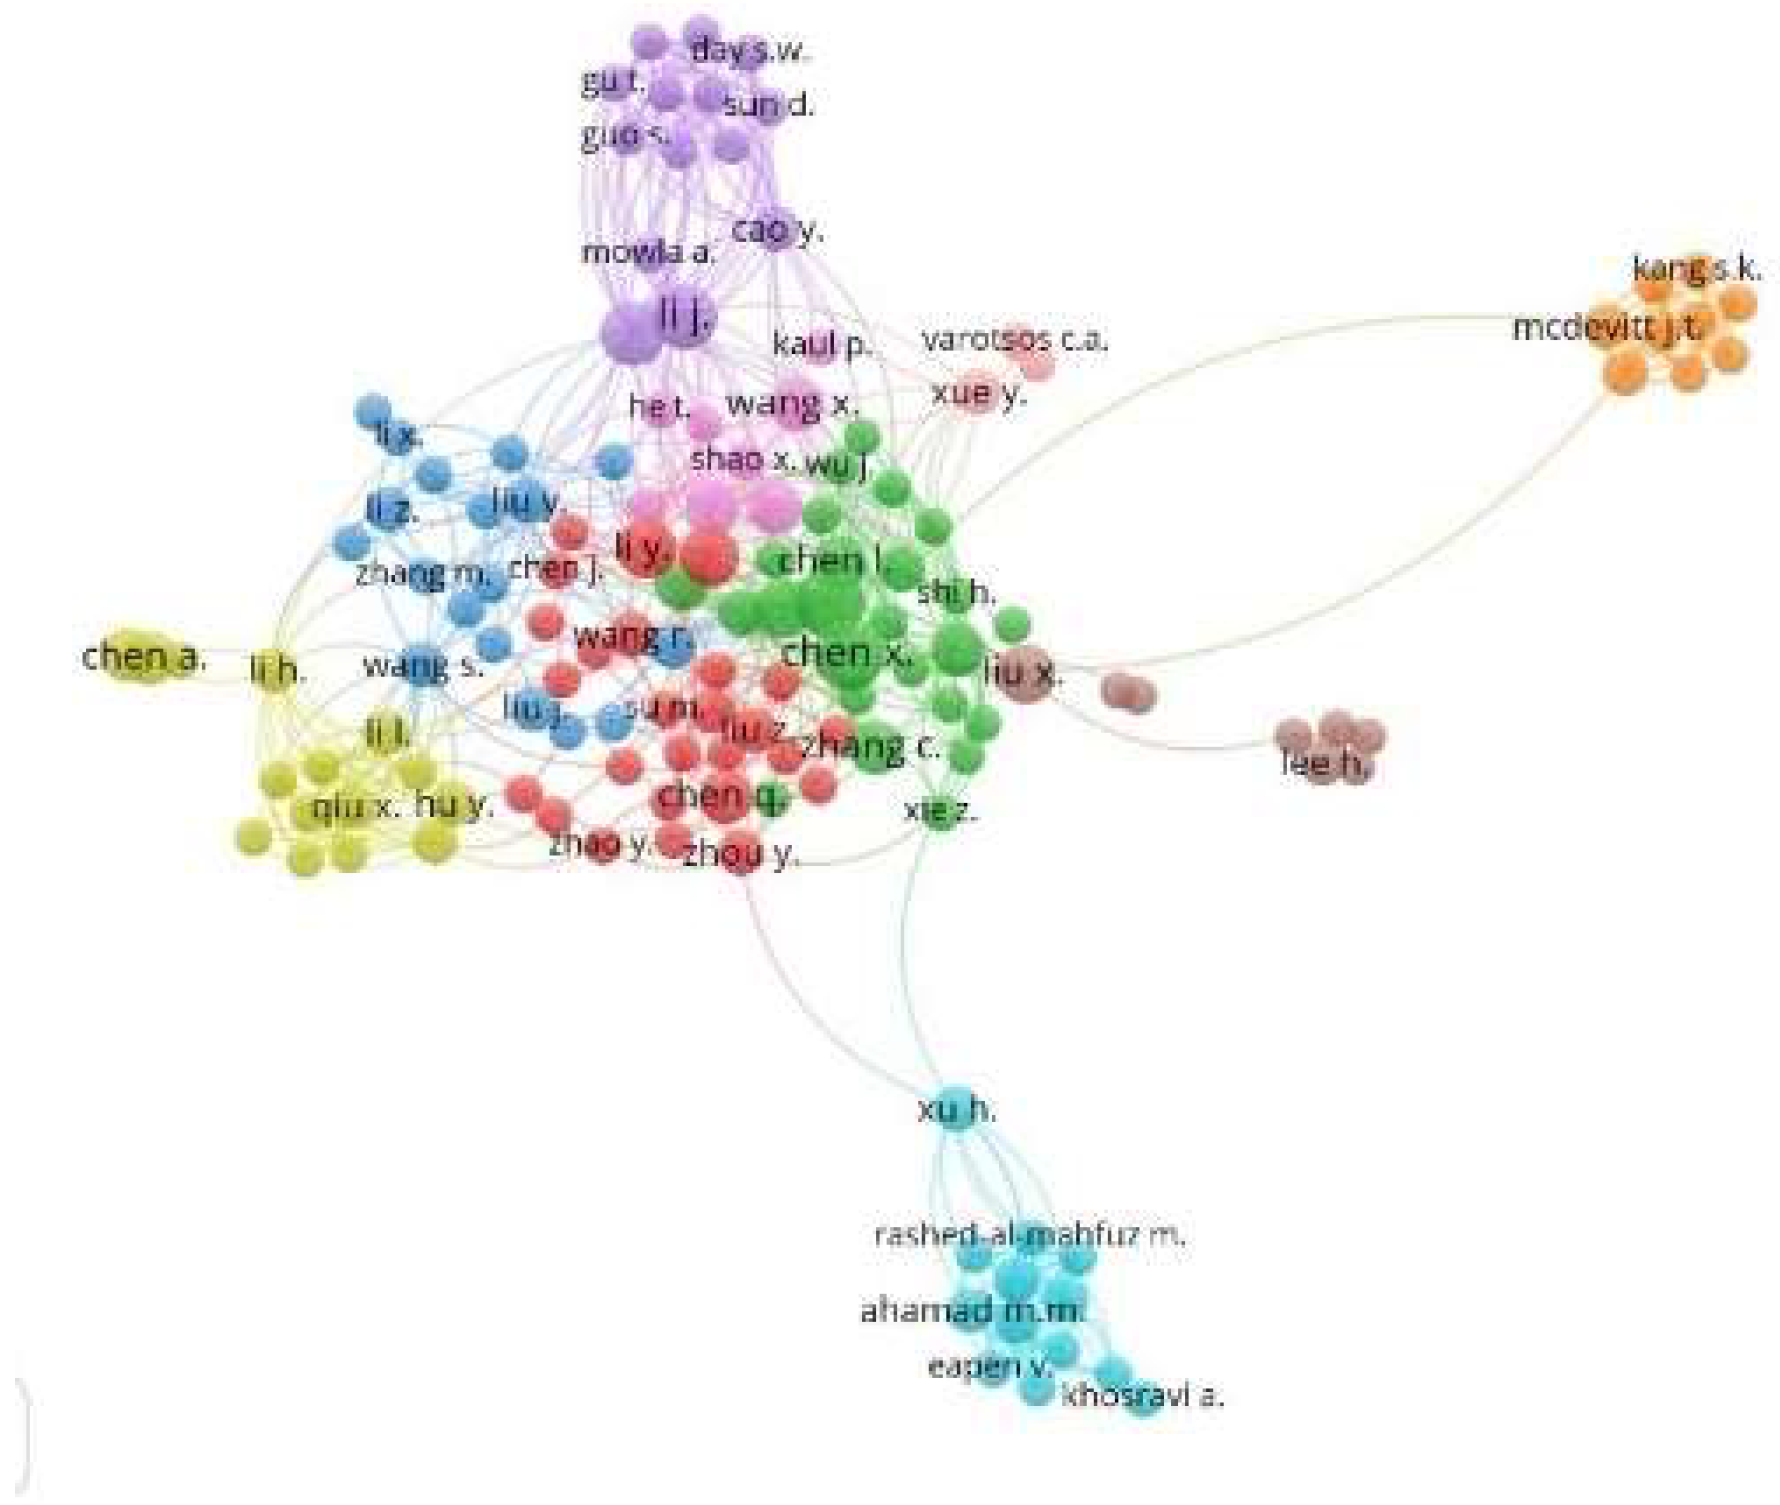
4.3. Co-Authorship and Authors

Figure 10 shows four main clusters, namely: green (center-right), red (center), blue (left), and purple (top), where they coincide with the principal co-authors and authors who publish together or who work in similar research fields of the IA research topic applied to COVID-19, where the purple cluster stands out as containing the most significant number of authors with the highest rate of participation as co-authors. It also shows the network of co-authors and leads authors who publish together or work in similar research fields. We used the co-authorship and mentor analyzers as characteristics, where the minimum limits of two (2) documents and one (1) citation per author were defined, which selected 5315 authors, and only 341 authors complied with the established limits.
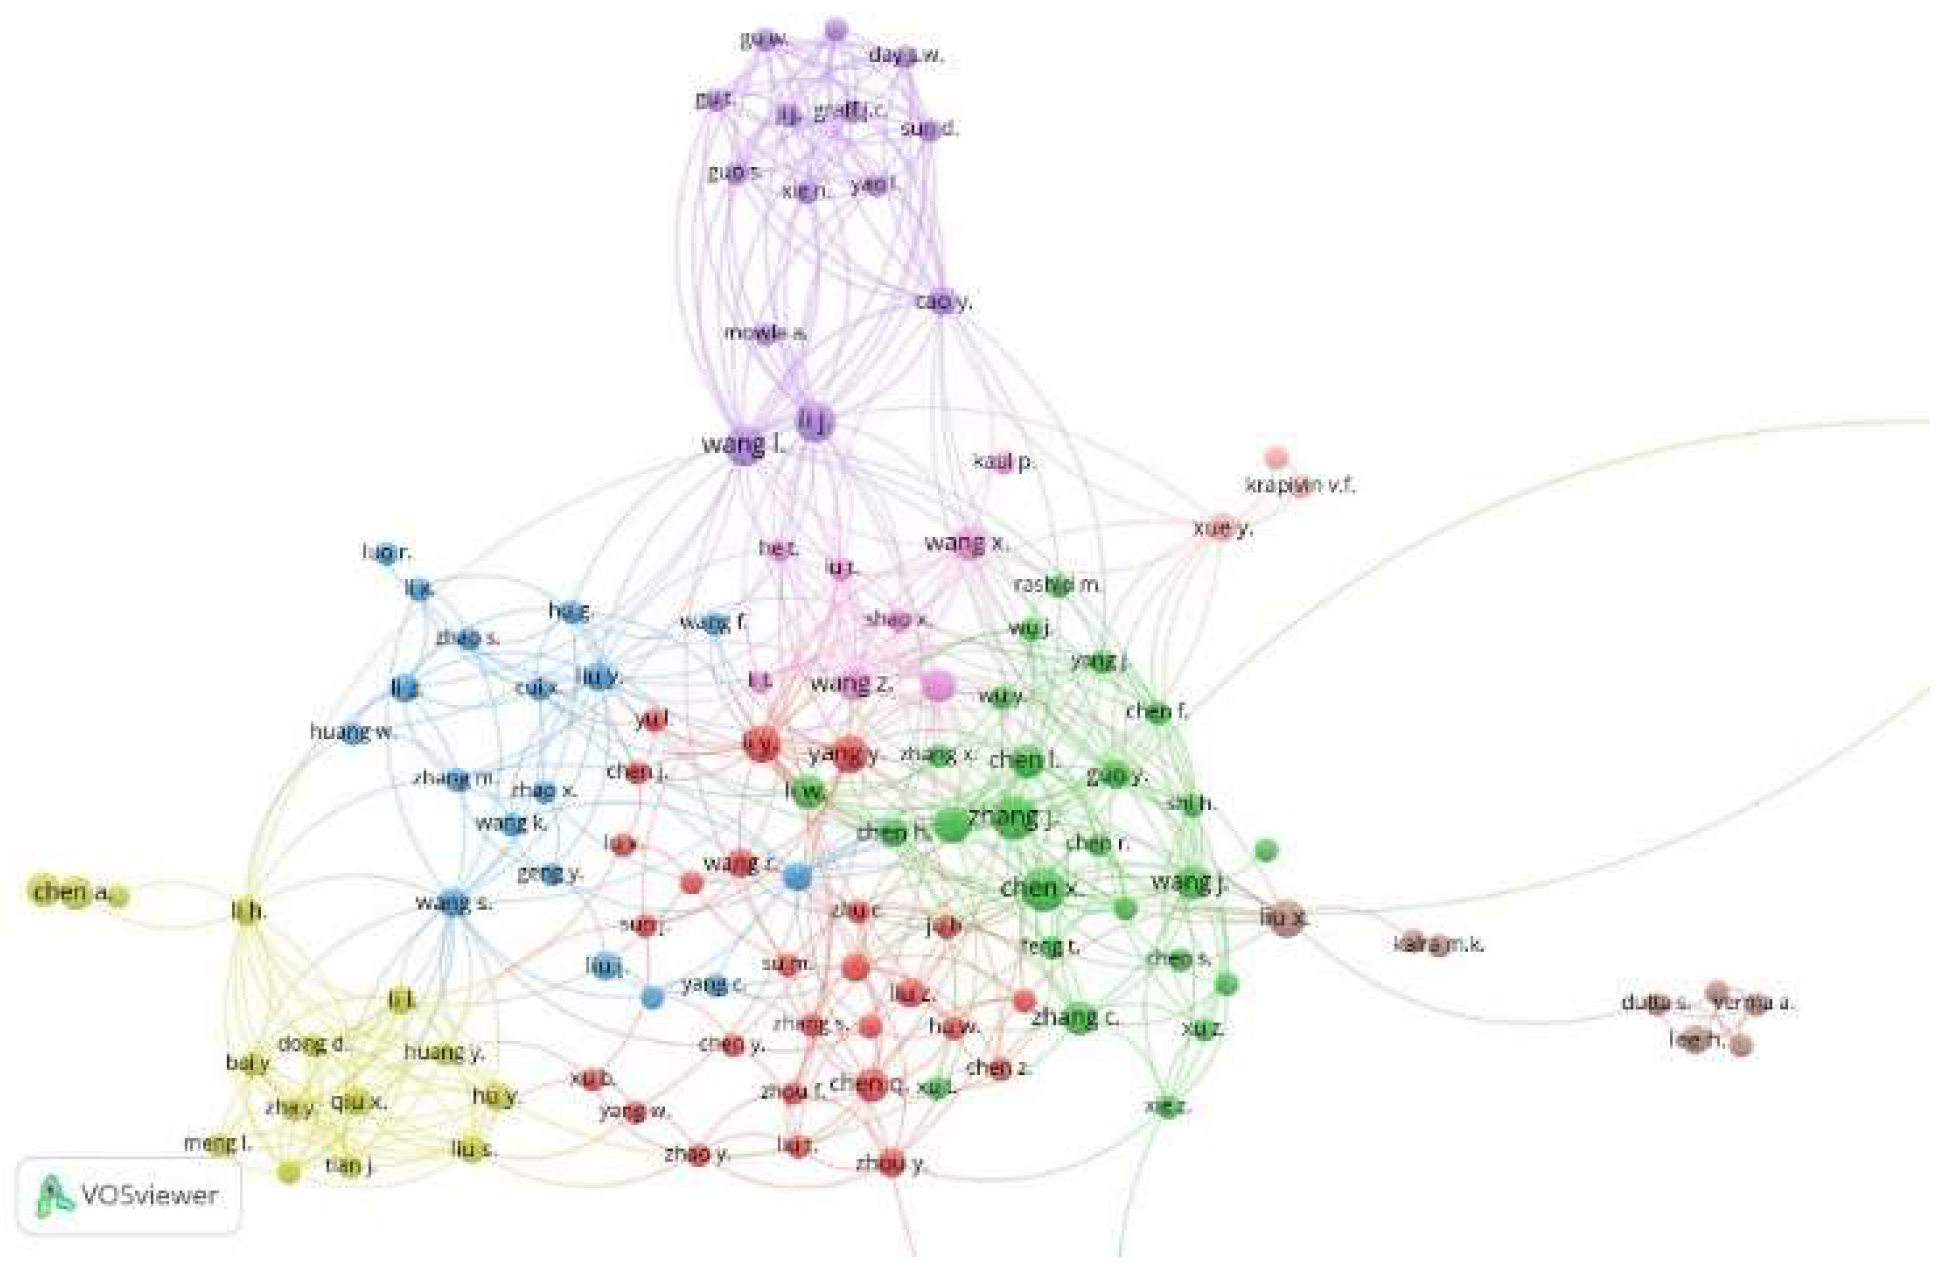
On the other hand, we evidenced that a smaller group of authors consists of 39 authors, as presented in Figure 11, where Li, J. and Whan, I., in the purple clusters, represent the authors with the strongest co-authorship links.
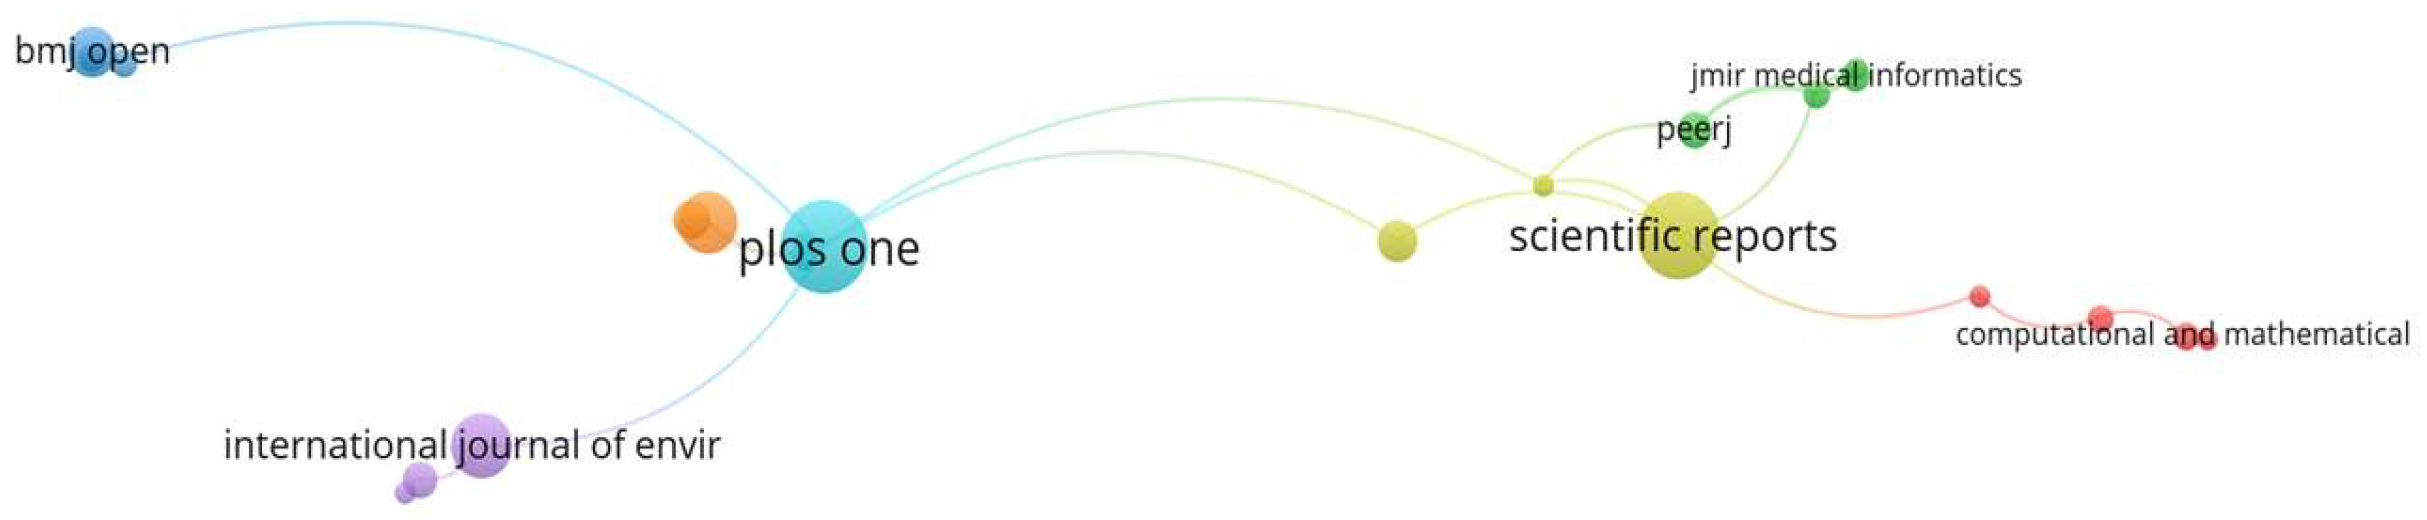
Figure 12 shows two main clusters, yellow (right) and cyan (left), as the most cited journal sources according to the authors’ publications, which indicates the strong citation between the journals “Plos one” (32) and “Scientific reports” (28), due to having the highest number of published papers. The journals “Bmj open,” “International journal of environmental research and public health,” and “Journal of medical internet research” are highlighted. However, they have a low number of published papers (7), but a strong link regarding co-citation. This analysis was limited to include only journals with at least two (2) documents and two (2) citations; as a result, 538 matched journals for the analysis, and only 108 met the defined limits.
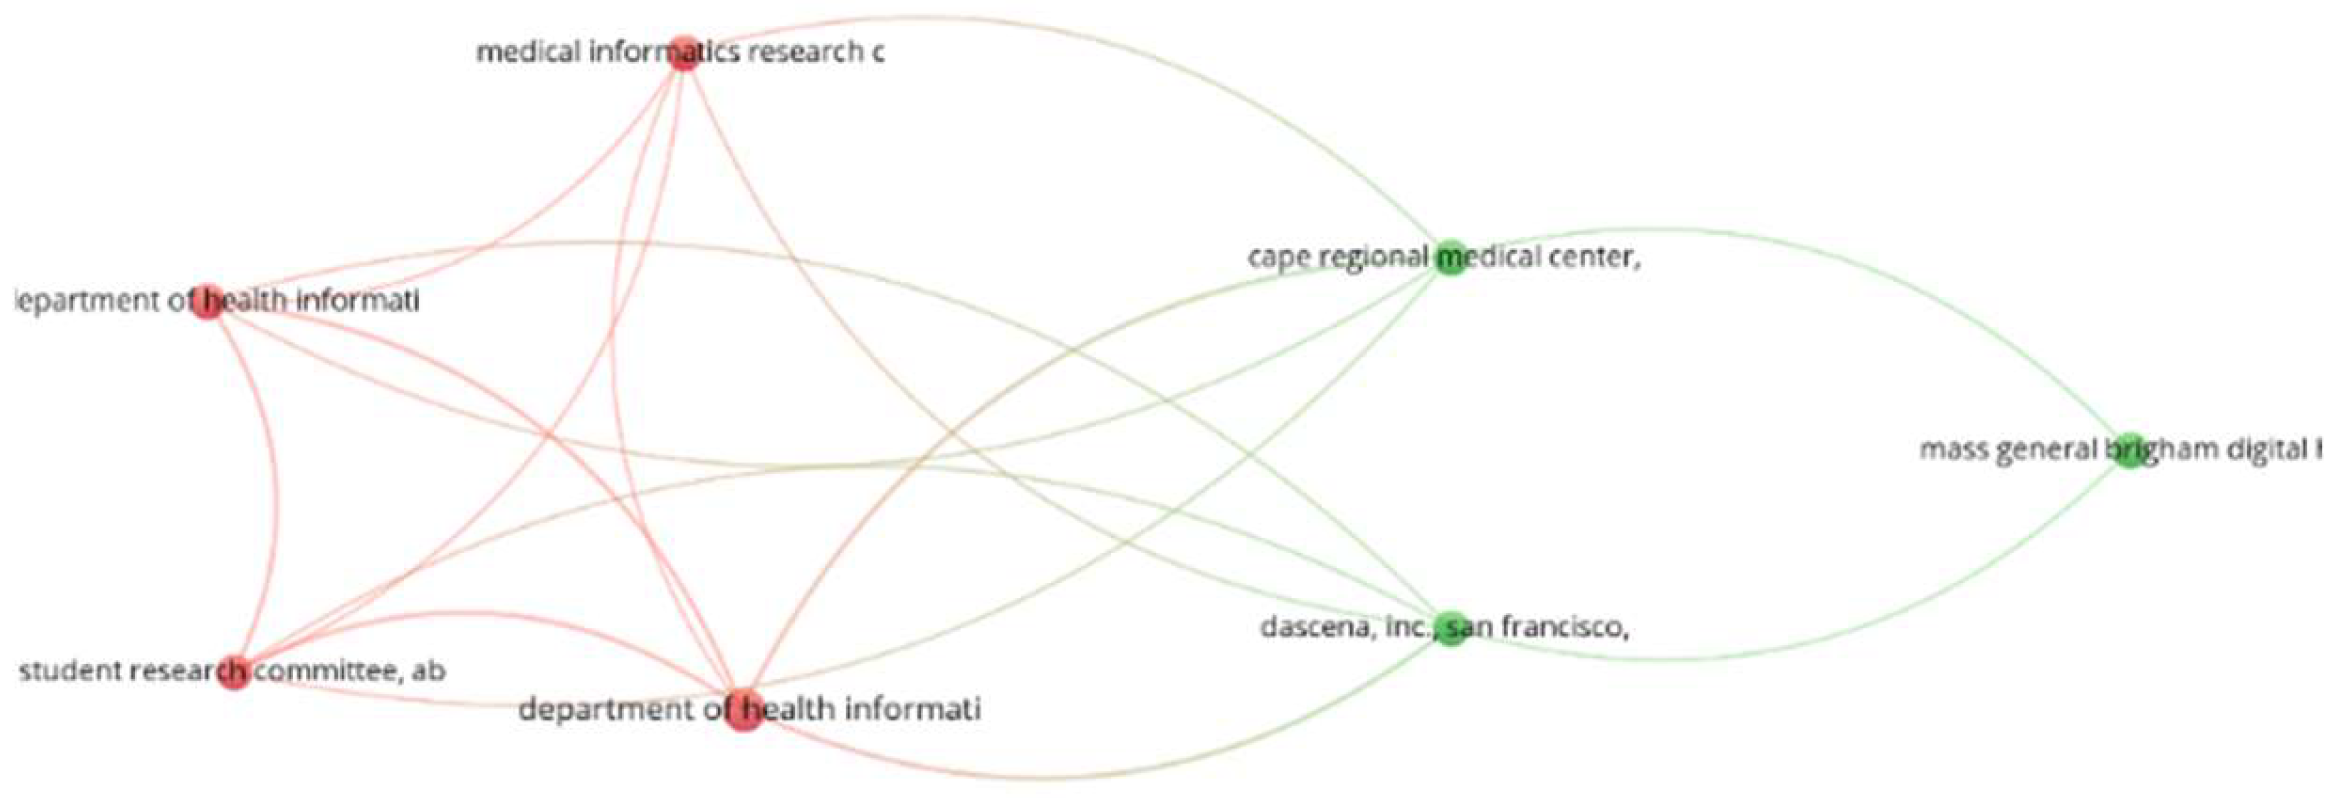
Finally, Figure 13 shows two clusters, red (left) and green (right), with the red clusters being the most representative, with the highest number of citations from authors from three (3) institutions located in the United Kingdom, followed by the green clusters representing institutions in the United States of America. For this analysis, only institutions with a minimum of two (2) published documents and one (1) citation were included, which selected 3741 institutions, and only 77 complied with the defined limits.

5. Challenges

This work reviewed 925 papers about using AI algorithms to predict mortality risk in “COVID-19” patients and comorbidity; after careful analysis, we found that only 32 studies linked the application of ML algorithms to predict mortality risk in “COVID-19” patients and comorbidity. Then, from the 32 papers, we found information about evaluated techniques, the best-performing feature selection techniques applied to the prediction models, the data set used, and the software used for the analysis.
Regarding the type of algorithms, the study found that 100% of the papers reviewed used algorithms based on supervised machine learning classification. RF, XGBoost, LR, and KNN algorithms were the most used in the prediction of mortality risk in “COVID-19” patients and comorbidity, followed by CoxSA, CNN, DT, CatBoost, and ANN algorithms, where the emerging algorithm XGBoost stands out and shows higher performance than other well-known ML algorithms. Finally, algorithms such as SV, GB, CAIM, FM, NBS, AE, GRU-D, RNNs, GB-ADAM, KM, EC, CovRNN, and bagging are not usually attractive to predict mortality risk.
The review also revealed that, for experimental work, the studies evaluated and compared at least five (5) algorithms (e.g., [57,67,76,77,92]). It can be recommended that a prediction model use a single algorithm and that, although many algorithms are evaluated, the research community still has much work to evaluate state-of-the-art algorithms that are out of existing studies. Applying state-of-the-art ML algorithms in mortality risk prediction in COVID-19 and comorbid patients still has issues to be addressed and resolved.
The top performing ML algorithms for mortality risk prediction in “COVID-19” patients and comorbidity identified seven (7) performance metrics for the evaluation of the prediction models evaluated in the studies, such as ACC, AUC, accuracy, F1 score, AUROCs, HR, and AUPCR, with ACC and AUC being the most used, representing 44% and 28% of the studies, respectively. Within the 22 algorithms used by the reviewed studies, those with the highest accuracy performance for predicting mortality risk in COVID-19 patients and with comorbidity were RF, CNN, DT, RF, CAIM, CNN, ANN, and XGBoost, which achieved a performance between 95% and 97%. The findings show the predictive potential of ML algorithms for mortality risk prediction in COVID-19 patients and patients with comorbidity, especially algorithms such as RF and XGBoost. However, the studies reviewed do not establish the minimum performance threshold for the ACC metric (to be considered accepted), but they set it at 95% for AUC. Finally, several studies are being addressed directions towards research (predictions or other applications) based on clinical data taken from X-rays, computed tomography (CT), and magnetic resonance imaging (MRI), as well as the use of the CNN algorithm [69,80,88] based on neural networks.
On the other hand, the study established that the variable selection technique most used by the studies reviewed was RFS, followed by time series, A-priori, and K-fold CV. Additionally, the method with the lowest performance was time series, with 65% for the RF algorithm, followed by SHAP, with 78% for XGBoost. However, the Chi-square, KM, RFS, and SHAP techniques showed the best, with 94% minimum performance. The rest of the techniques obtained lower performance (maximum 93%). It was confirmed that to implement ML algorithms to predict mortality risk in “COVID-19” patients, as well as comorbidity, it is necessary to not use one technique to design the prediction model only This is because the performance may change between one or another algorithm. Depending on the variable selection technique used.
Finally, this study showed that, after 32 studies reviewed, only seven (7) used primary clinical datasets that are available online ([59,67,75,79,80,83]). We recommended that clinical datasets be used in future studies to increase the interest in mortality risk prediction in “COVID-19” patients with comorbidity to help have more accurate prediction models trained in real scenarios.
Four (4) works are web-based platforms focusing on mortality risk predictions in “COVID-19” patients and comorbidity areas. They are not general solutions because they use characteristics prevalent only in specific geographical contexts, such as India ([77]) or Italy ([78]). The rest of the platforms are more generic ([62,72]).
In general, studies do not use software platforms. However, using data mining library software, such as R and Python, allows predictive performance in terms of accuracy score of the algorithms (RF, XGBoost), which can be better with R and Python, even when using the same dataset.
Finally, the run-time of each algorithm is essential and depends on the solution context. A system to predict mortality risk in “COVID-19” patients’ comorbidity is used in intensive healthcare units. The speed of getting information to decide can mean the difference between the life and death of a patient.

5.1. Future Directions

This work represents the first systematic review of mortality risk predictions based on machine learning in patients with COVID-19 and comorbidity. Mortality prediction can be helpful to the medical team to facilitate decision-making to minimize mortality in patients with this clinical condition, maximizing the resources available in the ICU and being directed to those with the highest probability of death. This study offers the opportunity to improve prediction models based on the discussions and conclusions that researchers should follow in future research.
  • More studies evaluating the XGBoost algorithm are required due to the relevance of the algorithm.
  • It is suggested that researchers should focus on applying neural network-based algorithms to prediction studies using digital images (e.g., X-ray, CT scans, among others).
  • More studies suggest that one should employ ensemble algorithms, such as logistic regression (LR) ensemble and support vector machines (SVM), to improve prediction.
  • The research topic concentrates on publication and citation in the United States and the United Kingdom, with little participation from Latin American countries, where only Brazil stands out with 26 publications; this indicates that more efforts are needed in South American countries to contribute to solutions to this topic.
  • Most of the studies reviewed focused on evaluating the performance of prediction models using AUC and ACC metrics, indicating a priori that these are the best metrics to measure the accuracy of the predictors. However, for non-balanced datasets, there are better options than AUC and ACC; they can create problems for ML algorithms. Therefore, we recommend carefully selecting and applying sampling techniques to the datasets [93,94,95].
  • It is essential to unbalance datasets, adding a challenge to ML for training and evaluating the algorithms. Therefore, to improve the algorithm performances, we recommend considering the sensitivity of the algorithms when having an unbalanced dataset or when obtaining a small number of samples [96]
  • The sensitivity and privacy of patient data are obstacles for researchers to access real and reliable databases.
  • It is crucial that more medical research centers collect, systematize, and publish patient data that contribute to the consolidation of robust datasets for studies that offer more reliability.
  • More work is needed to address prediction methodologies, but algorithms using the same performance metrics for each algorithm were compared.

5.2. Lessons Learned

To carry out this study, the team had to define situations and solve challenges typical of research work, which leads to the achievement of the proposed objectives. The following are some of the main lessons learned from the execution of the research work.
  • The team initially identified that completing phase 3 of the PRISMA “Eligibility” methodology could take one month; however, the results showed that it should take an additional six weeks to read the completed papers and present the results.
  • To complete the project, the team extended three months beyond the initial schedule (six months); in other words, the project took nine months to complete.
  • For the bibliometric analysis, the team should have scheduled more time to deliver the results in the last month. The delay was due to the team’s researchers taking more time to graph and analyze the results in the VOSviewer tool.

6. Conclusions

Currently, the prediction of mortality risk in “COVID-19” patients and comorbidity using machine learning applications has become of great interest to researchers in the area; however, there are still gaps to be resolved. This analysis has some limitations. First, this study includes articles from scientifically valid multidisciplinary databases; however, it excludes works published in proceedings, theses, or book chapters.
This study used PRISMA as the systematic literature review methodology to investigate ML algorithms, the variable selection techniques used, the ML algorithms implemented with the best performance, the type of dataset used, and the software or platform used for the analysis and implementation of models for the prediction of mortality risk in COVID-19 patients and patients with comorbidity. Algorithms are being used to predict mortality risk. However, it is evident that 100% of all algorithms are based on supervised learning; of the 32 papers, only seven (7) use published data, and four (4) implemented the prediction model in a web-based solution. The best-performing algorithms were the RF, CNN, DT, CAIM, and XGBoost. We found that the R tool obtained better prediction performance than Apache Spark, even better than implementations made with libraries such as TensorFlow, Keras, and those developed with Python language. Finally, it is essential to highlight that Keras software libraries facilitate the design and development of models based on ANN algorithms.
The analysis showed that the RF algorithm was the most used (in 11 studies), followed by the XGBoost method (in 6 studies), and was among the top five best performers. However, the CNN, DT, and CAIM algorithms also obtained high performance. Similarly, RF presented the highest accuracy, reaching an average of 89% (evaluated 11 times in the 32 reviewed), followed by XGBoost, with 88% (evaluated six times in the 32 reviewed), highlighting that this algorithm is one of those with the highest potential to deliver better performance in prediction issues in the clinical area.
Additionally, we can apply this work to predicting mortality in patients with inadequate health habits, such as smokers, those with nutritional issues, those suffering from alcoholism, drug addicts, and COVID-19 patients.
Finally, COVID-19 is now an endemic disease and is being suffered in patients with comorbidity, raising mortality risks in humans. Knowing new and better algorithms and more powerful and effective software environments is necessary to predict these patients’ mortality risks. This serves as the first line of medical care for decision-making that impacts two aspects. First, to save human lives; second, to maximize the resources available for the timely maintenance of patients with these clinical conditions.

Author Contributions

D.S., C.G. and J.M. have conceived this work’s main idea and contribution. D.S., C.G. and C.H. have contributed to selecting the search formula and methodology used. D.S., C.G., L.C.-B., C.H. and A.M. have contributed to the selection, reading, and analysis of the articles reviewed based on the analysis tools used. D.S., C.G. and C.H. wrote the paper. Finally, D.S., C.G., C.H. and L.C.-B., performed the diagramming and analysis of graphs using the Vosviewer tool. K.S.: supervision, proofreading and funding acquisition. All authors have read and agreed to the published version of the manuscript.

Funding

Partially, this work results from a postdoctoral fellowship, which the Colombia Ministry of Science financed, Technology, and Innovation, within the call “891-2020 MEC. 2- Additional Bank No. 2”. We are also grateful for the financial support of the University of the Coast, and the Autonomous University of Bucaramanga, where we developed the research.

Acknowledgments

Colombia Ministry of Science, Technology, and Innovation, University of the Coast, and the Autonomous University of Bucaramanga.

Conflicts of Interest

The authors declare no conflict of interest.

References

  1. Ifeoluwapo, R.A.; Supriyanto, E.; Taheri, S. COVID-19 Death Risk Assessment in Iran using Artificial Neural Network. J. Phys. Conf. Ser. 2021, 1964, 062117. [Google Scholar] [CrossRef]
  2. Weyori, B.A.; Appiahene, P.; Kutiame, S.; Millham, R.; Adekoya, A.F.; Tettey, M. Application of Machine Learning Algorithms in Coronary Heart Disease: A Systematic Literature Review and Meta-Analysis Predicting Blocking Bugs View project Machine Learning and Big Financial Data View project Application of Machine Learning Algorithms in Coronary Heart Disease: A Systematic Literature Review and Meta-Analysis. IJACSA Int. J. Adv. Comput. Sci. Appl. 2022, 13, 2022. [Google Scholar] [CrossRef]
  3. Mohan, S.; Thirumalai, C.; Srivastava, G. Effective heart disease prediction using hybrid machine learning techniques. IEEE Access 2019, 7, 81542–81554. [Google Scholar] [CrossRef]
  4. Zhong, X.; Ye, Y. Application of machine learning for predicting the spread of COVID-19. arXiv 2022, arXiv:2204.04364. [Google Scholar]
  5. Ellahham, S. Artificial intelligence in the diagnosis and management of COVID-19: A narrative review. J. Med. Artif. Intell. 2021. [Google Scholar] [CrossRef]
  6. Chamola, V.; Hassija, V.; Gupta, V.; Guizani, M. A Comprehensive Review of the COVID-19 Pandemic and the Role of IoT, Drones, AI, Blockchain, and 5G in Managing its Impact. IEEE Access 2020, 8, 90225–90265. [Google Scholar] [CrossRef]
  7. Manoj, M.; Srivastava, G.; Somayaji, S.R.K.; Gadekallu, T.R.; Maddikunta, P.K.R.; Bhattacharya, S. An Incentive Based Approach for COVID-19 planning using Blockchain Technology. In Proceedings of the IEEE Globecom Workshops, Taipei, Taiwan, 7–11 December 2020; pp. 1–6. [Google Scholar] [CrossRef]
  8. Buch, V.H.; Ahmed, I.; Maruthappu, M. Artificial intelligence in medicine: Current trends and future possibilities. Br. J. Gen. Pract. 2018, 68, 143–144. [Google Scholar] [CrossRef] [Green Version]
  9. Oh, S.H.; Lee, S.J.; Park, J. Precision Medicine for Hypertension Patients with Type 2 Diabetes via Reinforcement Learning. J. Pers. Med. 2022, 12, 87. [Google Scholar] [CrossRef]
  10. Wang, L.; He, X.; Zhang, W.; Zha, H. Supervised reinforcement learning with recurrent neural network for dynamic treatment recommendation. In Proceedings of the 24th ACM SIGKDD international conference on knowledge discovery & data mining, London, UK, 19–23 August 2018; 2018; pp. 2447–2456. [Google Scholar] [CrossRef] [Green Version]
  11. Shameer, K.; Johnson, K.W.; Glicksberg, B.S.; Dudley, J.T.; Sengupta, P.P. Machine learning in cardiovascular medicine: Are we there yet? Heart 2018, 104, 1156–1164. [Google Scholar] [CrossRef]
  12. Steuwer, B.; Eyal, N. SARS-CoV-2 human challenge studies. N. Engl. J. Med. 2021, 385, 1727–1728. [Google Scholar] [CrossRef]
  13. Ramos, C. COVID-19: La nueva enfermedad causada por un coronavirus. Salud Pública De Mex. 2020, 62, 225–227. [Google Scholar] [CrossRef]
  14. Rothan, H.A.; Byrareddy, S.N. The epidemiology and pathogenesis of coronavirus disease (COVID-19) outbreak. J. Autoimmun. 2020, 109, 102433. [Google Scholar] [CrossRef]
  15. Zhu, N.; Zhang, D.; Wang, W.; Li, X.; Yang, B.; Song, J.; Zhao, X.; Huang, B.; Shi, W.; Lu, R.; et al. A Novel Coronavirus from Patients with Pneumonia in China, 2019. N. Engl. J. Med. 2020, 382, 727–733. [Google Scholar] [CrossRef]
  16. Abas, A.H.; Marfuah, S.; Idroes, R.; Kusumawaty, D.; Park, M.N.; Siyadatpanah, A.; Alhumaydhi, F.; Mahmud, S.; Tallei, T.E.; Emran, T.B.; et al. Can the SARS-CoV-2 Omicron Variant Confer Natural Immunity against COVID-19? Molecules 2022, 27, 2221. [Google Scholar] [CrossRef]
  17. Mohapatra, R.K.; Kandi, V.; Tuli, H.S.; Chakraborty, C.; Dhama, K. The recombinant variants of SARS-CoV-2: Concerns continues amid COVID-19 pandemic. J. Med. Virol. 2022, 94, 3506. [Google Scholar] [CrossRef]
  18. Macedo, A.; Gonçalves, N.; Febra, C. COVID-19 fatality rates in hospitalized patients: Systematic review and meta-analysis. Ann. Epidemiol. 2021, 57, 14–21. [Google Scholar] [CrossRef]
  19. Chen, J.M. Novel statistics predict the COVID-19 pandemic could terminate in 2022. J. Med. Virol. 2022, 94, 2845–2848. [Google Scholar] [CrossRef]
  20. Gómez-Pavón, J.; González Del Castillo, J.; Martín-Delgado, M.; Martín-Sánchez, F.; Martínez-Sellés, M.; Molero García, J.; Moreno Guillén, S.; Rodríguez-Artalejo, F.; Ruiz-Galiana, J.; Cantón, R.; et al. COVID-19: Some unresolved issues. Rev. Esp. Quimioter. 2022, 35, 421–434. [Google Scholar] [CrossRef]
  21. Kommers, P.; Thanh, D.N.H.; Juwono, F.; Owan, V.J.; Akah, L.U.; Alawa, D.A. ICT Deployment for Teaching in the COVID-19 Era: A Quantitative Assessment of Availability and Challenges in Public Universities. Front. Educ. 2022, 7, 920932. [Google Scholar] [CrossRef]
  22. Dattner, I.; Huppert, A. Modern statistical tools for inference and prediction of infectious diseases using mathematical models. Stat. Methods Med. Res. 2018, 27, 1927–1929. [Google Scholar] [CrossRef] [Green Version]
  23. Rodríguez-Velásquez, J.O.; Prieto-Bohórquez, S.E.; Correa-Herrera, S.C.; Pérez-Díaz, C.E.; Soracipa-Muñoz, M.Y. Dinámica de la epidemia de malaria en Colombia: Predicción probabilística temporal. Rev. Salud Pública 2017, 19, 52–59. [Google Scholar] [CrossRef] [PubMed] [Green Version]
  24. Alanazi, S.A.; Kamruzzaman, M.M.; Alruwaili, M.; Alshammari, N.; Alqahtani, S.A.; Karime, A. Measuring and Preventing COVID-19 Using the SIR Model and Machine Learning in Smart Health Care. J. Healthc. Eng. 2020, 2020, 8857346. [Google Scholar] [CrossRef] [PubMed]
  25. Lu, M.; Ishwaran, H. Cure and death play a role in understanding dynamics for COVID-19: Data-driven competing risk compartmental models, with and without vaccination. PLoS ONE 2021, 16, e0254397. [Google Scholar] [CrossRef] [PubMed]
  26. Haouari, M.; Mhiri, M. A particle swarm optimization approach for predicting the number of COVID-19 deaths. Sci. Rep. 2021, 11, 16587. [Google Scholar] [CrossRef] [PubMed]
  27. Bartoszko, J.; Dranitsaris, G.; Wilcox, M.E.; Del Sorbo, L.; Mehta, S.; Peer, M.; Parotto, M.; Bogoch, I.; Riazi, S. Development of a repeated-measures predictive model and clinical risk score for mortality in ventilated COVID-19 patients. Can. J. Anesth. 2022, 69, 343–352. [Google Scholar] [CrossRef] [PubMed]
  28. Hao, B.; Sotudian, S.; Wang, T.; Xu, T.; Hu, Y.; Gaitanidis, A.; Breen, K.; Velmahos, G.C.; Paschalidis, I.C. Early prediction of level-of-care requirements in patients with COVID-19. Elife 2020, 9, 1–23. [Google Scholar] [CrossRef]
  29. Williams, J.; Stebbing, J. COVID-19 and the risk to cancer patients in China. Int. J. Cancer 2021, 148, 265–266. [Google Scholar] [CrossRef]
  30. Boukhris, M.; Hillani, A.; Moroni, F.; Annabi, M.S.; Addad, F.; Harada, M.; Mansour, S.; Zhao, X.; Ybarra, L.F.; Abbate, A.; et al. Cardiovascular Implications of the COVID-19 Pandemic: A Global Perspective. Can. J. Cardiol. 2020, 36, 1068–1080. [Google Scholar] [CrossRef]
  31. Naudé, W. Artificial Intelligence versus COVID-19 in Developing Countries: Priorities and Trade-Offs; WIDER Background Note; UNU-WIDER: Helsinki, Sweden, 2020. [Google Scholar] [CrossRef]
  32. Unberath, M.; Ghobadi, K.; Levin, S.; Hinson, J.; Hager, G.D. Artificial Intelligence-based Clinical Decision Support for COVID-19—Where Art Thou? Adv. Intell. Syst. 2020, 2, 2000104. [Google Scholar] [CrossRef]
  33. D Nguyen, D.C.; Ding, M.; Pathirana, P.N.; Seneviratne, A. Blockchain and AI-Based Solutions to Combat Coronavirus (COVID-19)-Like Epidemics: A Survey. IEEE Access 2021, 9, 95730–95753. [Google Scholar] [CrossRef]
  34. Ulhaq, A.; Khan, A.; Gomes, D.; Paul, M. Computer Vision For COVID-19 Control: A Survey. arXiv 2020, arXiv:2004.09420. [Google Scholar] [CrossRef]
  35. Shaikh, F.; Andersen, M.; Sohail, M.; Mulero, F.; Awan, O.; Dupont-Roettger, D.; Kubassova, O.; Dehmeshki, J.; Bisdas, S. Current Landscape of Imaging and the Potential Role for Artificial Intelligence in the Management of COVID-19. Curr. Probl. Diagn. Radiol. 2021, 50, 430–435. [Google Scholar] [CrossRef]
  36. Alamo, T.; Reina, D.G.; Gata, P.M. Data-Driven Methods to Monitor, Model, Forecast and Control COVID-19 Pandemic: Leveraging Data Science, Epidemiology and Control Theory. arXiv 2020, arXiv:2006.01731. [Google Scholar] [CrossRef]
  37. Shinde, G.R.; Kalamkar, A.B.; Mahalle, P.N.; Dey, N.; Chaki, J.; Hassanien, A.E. Forecasting Models for Coronavirus Disease (COVID-19): A Survey of the State-of-the-Art. SN Comput. Sci. 2020, 1, 197. [Google Scholar] [CrossRef]
  38. Ahmad, A.; Garhwal, S.; Ray, S.K.; Kumar, G.; Malebary, S.J.; Barukab, O.M. The Number of Confirmed Cases of COVID-19 by using Machine Learning: Methods and Challenges. Arch. Comput. Methods Eng. 2020, 28, 2645–2653. [Google Scholar] [CrossRef]
  39. Kannan, S.; Subbaram, K.; Ali, S.; Kannan, H. The Role of Artificial Intelligence and Machine Learning Techniques: Race for COVID-19 Vaccine. Arch. Clin. Infect. Dis. 2020, 15, 103232. [Google Scholar] [CrossRef]
  40. Rahmatizadeh, S.; Valizadeh-Haghi, S.; Dabbagh, A. The role of artificial intelligence in management of critical COVID-19 patients. J. Cell. Mol. Anesth. 2020, 5, 16–22. [Google Scholar] [CrossRef]
  41. Bhattacharya, S.; Maddikunta, P.K.R.; Pham, Q.V.; Gadekallu, T.R.; Chowdhary, C.L.; Alazab, M.; Piran, M.J. Deep learning and medical image processing for coronavirus (COVID-19) pandemic: A survey. Sustain. Cities Soc. 2021, 65, 102589. [Google Scholar] [CrossRef]
  42. Henriquez, C.; Mardin, J.; Salcedo, D.; Pulgar-Emiliani, M.; Avendaño, I.; Angulo, L.; Pinedo, J. Predictive Model of Cardiovascular Diseases Implementing Artificial Neural Networks. In International Conference on Computer Information Systems and Industrial Management; Springer: Cham, Switzerland, 2022; pp. 231–242. [Google Scholar]
  43. Shah, S.K.; A McElfish, P. Cancer Screening Recommendations During the COVID-19 Pandemic: Scoping Review. JMIR Cancer 2022, 8, e34392. [Google Scholar] [CrossRef]
  44. Palazzuoli, A.; Lavie, C.J.; Severino, P.; Dastidar, A.; Sammut, E.; McCullough, P.A. Co-Management of COVID-19 and Heart Failure During the COVID-19 Pandemic: Lessons Learned. Rev. Cardiovasc. Med. 2022, 23, 218. [Google Scholar] [CrossRef]
  45. Bostanghadiri, N.; Jazi, F.M.; Razavi, S.; Fattorini, L.; Darban-Sarokhalil, D. Mycobacterium tuberculosis and SARS-CoV-2 Coinfections: A Review. Front. Microbiol. 2022, 12, 747827. [Google Scholar] [CrossRef] [PubMed]
  46. Al-Taie, A.; Arueyingho, O.; Khoshnaw, J.; Hafeez, A. Clinical outcomes of multidimensional association of type 2 diabetes mellitus, COVID-19 and sarcopenia: An algorithm and scoping systematic evaluation. Arch. Physiol. Biochem. 2022, 1–19. [Google Scholar] [CrossRef] [PubMed]
  47. Yusuf, E.; Seghers, L.; Hoek, R.A.S.; van den Akker, J.P.C.; Bode, L.G.M.; Rijnders, B.J.A. Aspergillus in critically ill COVID-19 patients: A scoping review. J. Clin. Med. 2021, 10, 2469. [Google Scholar] [CrossRef] [PubMed]
  48. Thatiparthi, A.; Martin, A.; Liu, J.; Egeberg, A.; Wu, J.J. Biologic Treatment Algorithms for Moderate-to-Severe Psoriasis with Comorbid Conditions and Special Populations: A Review. Am. J. Clin. Dermatol. 2021, 22, 425–442. [Google Scholar] [CrossRef] [PubMed]
  49. Mitaka, H.; Kuno, T.; Takagi, H.; Patrawalla, P. Incidence and mortality of COVID-19-associated pulmonary aspergillosis: A systematic review and meta-analysis. Mycoses 2021, 64, 993–1001. [Google Scholar] [CrossRef]
  50. Casalini, G.; Giacomelli, A.; Ridolfo, A.; Gervasoni, C.; Antinori, S. Invasive Fungal Infections Complicating COVID-19: A Narrative Review. J. Fungi 2021, 7, 921. [Google Scholar] [CrossRef]
  51. Khalsa, R.K.; Khashkhusha, A.; Zaidi, S.; Harky, A.; Bashir, M. Artificial intelligence and cardiac surgery during COVID-19 era. J. Card. Surg. 2021, 36, 1729–1733. [Google Scholar] [CrossRef]
  52. Douedi, S.; Mararenko, A.; Alshami, A.; Al-Azzawi, M.; Ajam, F.; Patel, S.; Douedi, H.; Calderon, D. COVID-19 induced bradyarrhythmia and relative bradycardia: An overview. J. Arrhythm. 2021, 37, 888–892. [Google Scholar] [CrossRef]
  53. Tamuzi, J.L.; Ayele, B.T.; Shumba, C.S.; Adetokunboh, O.O.; Uwimana-Nicol, J.; Haile, Z.T.; Inugu, J.; Nyasulu, P.S. Implications of COVID-19 in high burden countries for HIV/TB: A systematic review of evidence. BMC Infect. Dis. 2020, 20, 744. [Google Scholar] [CrossRef]
  54. Moher, D.; Shamseer, L.; Clarke, M.; Ghersi, D.; Liberati, A.; Petticrew, M.; Shekelle, P.; Stewart, L.A.; PRISMA-P Group. Preferred reporting items for systematic review and meta-analysis protocols (PRISMA-P) 2015 statement. Rev. Esp. Nutr. Hum. Diet. 2016, 20, 148–160. [Google Scholar] [CrossRef] [Green Version]
  55. Page, M.J.; McKenzie, J.E.; Bossuyt, P.M.; Boutron, I.; Hoffmann, T.C.; Mulrow, C.D.; Shamseer, L.; Tetzlaff, J.M.; Akl, E.A.; Brennan, S.E.; et al. The PRISMA 2020 statement: An updated guideline for reporting systematic reviews. Syst. Rev. 2021, 10, 89. [Google Scholar] [CrossRef]
  56. Selcuk, A.A. A Guide for Systematic Reviews: PRISMA. Turk. Arch. Otorhinolaryngol. 2019, 57, 57–58. [Google Scholar] [CrossRef]
  57. Atlam, M.; Torkey, H.; El-Fishawy, N.; Salem, H. Coronavirus disease 2019 (COVID-19): Survival analysis using deep learning and Cox regression model. Pattern Anal. Appl. 2021, 24, 993–1005. [Google Scholar] [CrossRef]
  58. Khan, I.U.; Aslam, N.; Aljabri, M.; Aljameel, S.S.; Kamaleldin, M.M.A.; Alshamrani, F.M.; Chrouf, S.M.B. Computational Intelligence-Based Model for Mortality Rate Prediction in COVID-19 Patients. Int. J. Environ. Res. Public Health 2021, 18, 6429. [Google Scholar] [CrossRef]
  59. Mohammad, R.M.A.; Aljabri, M.; Aboulnour, M.; Mirza, S.; Alshobaiki, A. Classifying the Mortality of People with Underlying Health Conditions Affected by COVID-19 Using Machine Learning Techniques. Appl. Comput. Intell. Soft Comput. 2022, 2022, 3783058. [Google Scholar] [CrossRef]
  60. Shafiekhani, S.; Rafiei, S.; Abdollahzade, S.; Souri, S.; Moomeni, Z. Risk Factors Associated with In-Hospital Mortality in Iranian Patients with COVID-19: Application of Machine Learning. Pol. J. Med. Phys. Eng. 2022, 28, 19–29. [Google Scholar] [CrossRef]
  61. Hou, W.; Zhao, Z.; Chen, A.; Li, H.; Duong, T.Q. Machining learning predicts the need for escalated care and mortality in COVID-19 patients from clinical variables. Int. J. Med. Sci. 2021, 18, 1739–1745. [Google Scholar] [CrossRef]
  62. Xu, W.; Sun, N.N.; Gao, H.N.; Chen, Z.Y.; Yang, Y.; Ju, B.; Tang, L. Risk factors analysis of COVID-19 patients with ARDS and prediction based on machine learning. Sci. Rep. 2021, 11, 2933. [Google Scholar] [CrossRef]
  63. Ikemura, K.; Bellin, E.; Yagi, Y.; Billett, H.; Saada, M.; Simone, K.; Stahl, L.; Szymanski, J.; Goldstein, D.Y.; Gil, M.R. Using automated machine learning to predict the mortality of patients with COVID-19: Prediction model development study. J. Med. Internet Res. 2021, 23, e23458. [Google Scholar] [CrossRef]
  64. Sankaranarayanan, S.; Balan, J.; Walsh, J.; Wu, Y.; Minnich, S. Piazza, A.; Osborne, C.; Oliver, G.; Lesko, J.; Bates, K.L.; et al. COVID-19 mortality prediction from deep learning in a large multistate electronic health record and laboratory information system data set: Algorithm development and validation. J. Med. Internet Res. 2021, 23, e30157. [Google Scholar] [CrossRef]
  65. Lima, T.P.F.; Sena, G.R.; Neves, C.S.; Vidal, S.A.; Lima, J.T.O.; Mello, M.J.G.; Silva, F.A. Death risk and the importance of clinical features in elderly people with COVID-19 using the random forest algorithm. Rev. Bras. Saúde Matern. Infant. 2021, 21, S445–S451. [Google Scholar] [CrossRef]
  66. Di Castelnuovo, A.; Bonaccio, M.; Costanzo, S.; Gialluisi, A.; Antinori, A.; Berselli, N.; Blandi, L.; Bruno, R.; Cauda, R.; Guaraldi, G.; et al. Common cardiovascular risk factors and in-hospital mortality in 3,894 patients with COVID-19: Survival analysis and machine learning-based findings from the multicentre Italian CORIST Study. Nutr. Metab. Cardiovasc. Dis. 2020, 30, 1899–1913. [Google Scholar] [CrossRef] [PubMed]
  67. Guadiana-Alvarez, J.L.; Hussain, F.; Morales-Menendez, R.; Rojas-Flores, E.; García-Zendejas, A.; Escobar, C.A.; Ramírez-Mendoza, R.A.; Wang, J. Prognosis patients with COVID-19 using deep learning. BMC Med. Inform. Decis. Mak. 2022, 22, 78. [Google Scholar] [CrossRef] [PubMed]
  68. Khadem, H.; Nemat, H.; Eissa, M.R.; Elliott, J.; Benaissa, M. COVID-19 mortality risk assessments for individuals with and without diabetes mellitus: Machine learning models integrated with interpretation framework. Comput. Biol. Med. 2022, 144, 105361. [Google Scholar] [CrossRef] [PubMed]
  69. Meng, L.; Dong, D.; Li, L.; Niu, M.; Bai, Y.; Wang, M.; Qiu, X.; Zha, Y.; Tian, J. A Deep Learning Prognosis Model Help Alert for COVID-19 Patients at High-Risk of Death: A Multi-Center Study. IEEE J. Biomed. Heal. Inform. 2020, 24, 3576–3584. [Google Scholar] [CrossRef]
  70. Nieto-Codesido, I.; Calvo-Alvarez, U.; Diego, C.; Hammouri, Z.; Mallah, N.; Ginzo-Villamayor, M.J.; Salgado, F.J.; Carreira, J.M.; Rábade, C.; Barbeito, G.; et al. Risk Factors of Mortality in Hospitalized Patients With COVID-19 Applying a Machine Learning Algorithm. Open Respir. Arch. 2022, 4, 100162. [Google Scholar] [CrossRef]
  71. Shanbehzadeh, M.; Valinejadi, A.; Afrah, R.; Kazemi-Arpanahi, H.; Orooji, A.; Kaffashian, M. Comparison of Machine-Learning Algorithms Efficiency to Build a Predictive Model for Mortality Risk in COVID-19 Hospitalized Patients. Koomesh 2022, 24, 128–138. Available online: https://www.scopus.com/inward/record.uri?eid=2-s2.0-85125205351&partnerID=40&md5=877e60c345b975a6d6c62b881ec38ca6 (accessed on 18 March 2022).
  72. Tezza, F.; Lorenzoni, G.; Azzolina, D.; Barbar, S.; Leone, L.; Gregori, D. Predicting in-Hospital Mortality of Patients with COVID-19 Using Machine Learning Techniques. J. Pers. Med. 2021, 11, 343. [Google Scholar] [CrossRef]
  73. Wang, J.M.; Liu, W.; Chen, X.; McRae, M.P.; McDevitt, J.T.; Fenyö, D. Predictive Modeling of Morbidity and Mortality in Patients Hospitalized With COVID-19 and its Clinical Implications: Algorithm Development and Interpretation. J. Med. Internet Res. 2021, 23, e29514. [Google Scholar] [CrossRef]
  74. Yu, L.; Halalau, A.; Dalal, B.; Abbas, A.E.; Ivascu, F.; Amin, M.; Nair, G.B. Machine learning methods to predict mechanical ventilation and mortality in patients with COVID-19. PLoS ONE 2021, 16, e0249285. [Google Scholar] [CrossRef]
  75. Amini, N.; Mahdavi, M.; Choubdar, H.; Abedini, A.; Shalbaf, A.; Lashgari, R. Automated prediction of COVID-19 mortality outcome using clinical and laboratory data based on hierarchical feature selection and random forest classifier. Comput. Methods Biomech. Biomed. Eng. 2022. [Google Scholar] [CrossRef]
  76. Becerra-Sánchez, A.; Rodarte-Rodríguez, A.; Escalante-García, N.I.; Olvera-González, J.E.; De la Rosa-Vargas, J.I.; Zepeda-Valles, G.; Velásquez-Martínez, E.D.J. Mortality Analysis of Patients with COVID-19 in Mexico Based on Risk Factors Applying Machine Learning Techniques. Diagnostics 2022, 3, 1396. [Google Scholar] [CrossRef]
  77. Das, A.K.; Mishra, S.; Gopalan, S.S. Predicting COVID-19 community mortality risk using machine learning and development of an online prognostic tool. PeerJ 2020, 8, e10083. [Google Scholar] [CrossRef]
  78. Halasz, G.; Sperti, M.; Villani, M.; Michelucci, U.; Agostoni, P.; Biagi, A.; Rossi, L.; Botti, A.; Mari, C.; Maccarini, M.; et al. A machine learning approach for mortality prediction in COVID-19 pneumonia: Development and evaluation of the Piacenza score. J. Med. Internet Res. 2021, 23, e29058. [Google Scholar] [CrossRef]
  79. Kar, S.; Chawla, R.; Haranath, S.P.; Ramasubban, S.; Ramakrishnan, N.; Vaishya, R.; Sibal, A.; Reddy, S. Multivariable mortality risk prediction using machine learning for COVID-19 patients at admission (AICOVID). Sci. Rep. 2021, 11, 12801. [Google Scholar] [CrossRef]
  80. Khozeimeh, F.; Sharifrazi, D.; Izadi, N.H.; Joloudari, J.H.; Shoeibi, A.; Alizadehsani, R.; Gorriz, J.M.; Hussain, S.; Sani, Z.A.; Moosaei, H.; et al. Combining a convolutional neural network with autoencoders to predict the survival chance of COVID-19 patients. Sci. Rep. 2021, 11, 15343. [Google Scholar] [CrossRef]
  81. Parchure, P.; Joshi, H.; Dharmarajan, K.; Freeman, R.; Reich, D.L.; Mazumdar, M.; Timsina, P.; Kia, A. Development and validation of a machine learning-based prediction model for near-term in-hospital mortality among patients with COVID-19. BMJ Support. Palliat. Care 2020, 12, e424–e431. [Google Scholar] [CrossRef]
  82. Rasmy, L.; Nigo, M.; Kannadath, B.S.; Xie, Z.; Mao, B.; Patel, K.; Zhou, Y.; Zhang, W.; Ross, A.; Xu, H.; et al. Recurrent neural network models (CovRNN) for predicting outcomes of patients with COVID-19 on admission to hospital: Model development and validation using electronic health record data. Lancet Digit. Health 2022, 4, e415–e425. [Google Scholar] [CrossRef]
  83. Ryan, L.; Lam, C.; Mataraso, S.; Allen, A.; Green-Saxena, A.; Pellegrini, E.; Hoffman, J.; Barton, C.; McCoy, A.; Das, R. Mortality prediction model for the triage of COVID-19, pneumonia, and mechanically ventilated ICU patients: A retrospective study. Ann. Med. Surg. 2020, 59, 207–216. [Google Scholar] [CrossRef]
  84. Stachel, A.; Daniel, K.; Ding, D.; Francois, F.; Phillips, M.; Lighter, J. Development and validation of a machine learning model to predict mortality risk in patients with COVID-19. BMJ Health Care Inform. 2021, 28, e100235. [Google Scholar] [CrossRef]
  85. Yun, J.; Basak, M.; Han, M.-M. Bayesian Rule Modeling for Interpretable Mortality Classification of COVID-19 Patients. Comput. Mater. Contin. 2021, 69, 2827–2843. [Google Scholar] [CrossRef]
  86. Aggarwal, A.; Chakradar, M.; Bhatia, M.S.; Kumar, M.; Stephan, T.; Gupta, S.K.; Alsamhi, S.H.; Al-Dois, H. COVID-19 Risk Prediction for Diabetic Patients Using Fuzzy Inference System and Machine Learning Approaches. J. Healthc. Eng. 2022, 2022. [Google Scholar] [CrossRef] [PubMed]
  87. Ebrahimi, V.; Sharifi, M.; Mousavi-Roknabadi, R.S.; Sadegh, R.; Khademian, M.H.; Moghadami, M.; Dehbozorgi, A. Predictive determinants of overall survival among re-infected COVID-19 patients using the elastic-net regularized Cox proportional hazards model: A machine-learning algorithm. BMC Public Health 2022, 22, 10. [Google Scholar] [CrossRef]
  88. Elghamrawy, S.M.; Hassanien, A.E.; Vasilakos, A.V. Genetic-based adaptive momentum estimation for predicting mortality risk factors for COVID-19 patients using deep learning. Int. J. Imaging Syst. Technol. 2021, 32, 614–628. [Google Scholar] [CrossRef]
  89. Ma, J.; Wang, Y.; Niu, X.; Jiang, S.; Liu, Z. A comparative study of mutual information-based input variable selection strategies for the displacement prediction of seepage-driven landslides using optimized support vector regression. Stoch. Environ. Res. Risk Assess. 2022, 36, 3109–3129. [Google Scholar] [CrossRef]
  90. Rockova, V.; McAlinn, K. Dynamic Variable Selection with Spike-and-Slab Process Priors. Bayesian Anal. 2021, 16, 233–269. [Google Scholar] [CrossRef]
  91. Medeiros, M.C.; Vasconcelos, G.; Veiga, Á.; Zilberman, E. Forecasting Inflation in a Data-Rich Environment: The Benefits of Machine Learning Methods. J. Bus. Econ. Stat. 2019, 39, 98–119. [Google Scholar] [CrossRef]
  92. Mustafa, S.; Ali, A.; Salahuddin, H.; Chaudhry, M.U. Two-step Feature Selection for Predicting Mortality Risk in COVID-19 Patients. In Proceedings of the International Conference on Computing, Electronic and Electrical Engineering, ICE Cube, Quetta, Pakistan, 26–27 October 2021. [Google Scholar] [CrossRef]
  93. Why Accuracy Is Not A Good Metric For Imbalanced Data—Towards AI. Available online: https://towardsai.net/p/l/why-accuracy-is-not-a-good-metric-for-imbalanced-data (accessed on 18 November 2022).
  94. Folleco, A.; Khoshgoftaar, T.M.; Napolitano, A. Comparison of four performance metrics for evaluating sampling techniques for low quality class-imbalanced data. In Proceedings of the 7th International Conference on Machine Learning and Applications, ICMLA 2008, San Diego, CA, USA, 11–13 December 2008; pp. 153–158. [Google Scholar] [CrossRef]
  95. Luque, A.; Carrasco, A.; Martín, A.; de las Heras, A. The impact of class imbalance in classification performance metrics based on the binary confusion matrix. Pattern Recognit. 2019, 91, 216–231. [Google Scholar] [CrossRef]
  96. Raeder, T.; Forman, G.; Chawla, N.V. Learning from Imbalanced Data: Evaluation Matters. Intell. Syst. Ref. Libr. 2012, 23, 315–331. [Google Scholar] [CrossRef]
Figure 1. PRISMA flow diagram at four levels, based on “Search equation”.
Electronics 11 04015 g001
Figure 2. Number of algorithm performance metrics applied in the observed studies.
Electronics 11 04015 g002
Figure 3. Average performance of the metrics used in the observed studies.
Electronics 11 04015 g003
Figure 4. The average performance of algorithms based on the feature selection technique.
Electronics 11 04015 g004
Figure 5. Tools distribution analysis.
Electronics 11 04015 g005
Figure 6. Distribution of the type of dataset used in the studies reviewed.
Electronics 11 04015 g006
Figure 7. Bibliographic coupling between authors. Three clusters, red (top), blue (bottom), and green (right), correspond to all authors working in similar research fields. ML was applied to COVID-19, and the same sources in their reference lists were cited.
Electronics 11 04015 g007
Figure 8. Visualization of the co-word network in the research topic “AI applied to COVID-19”.
Electronics 11 04015 g008
Figure 9. Co-word network visualization in the research topic “ML applied to COVID-19”. Note: the visualization of the co-word overlap was based on the occurrences and an average number of publications from 2020 to June 2021.
Electronics 11 04015 g009
Figure 10. Citation and co-authors analysis.
Electronics 11 04015 g010
Figure 11. Citation and analysis of co-authors with strong links.
Electronics 11 04015 g011
Figure 12. Author citations by journal.
Electronics 11 04015 g012
Figure 13. Author citations by the organization.
Electronics 11 04015 g013
Table 1. Summary of literature review papers that analyzed the relationship of COVID-19 with underlying disease (comorbidity).
WorksScope
[43]This review aims to assist healthcare providers in identifying approaches for prioritizing patients and increasing breast, cervical, and colorectal cancer screening during the uncertainty of the COVID-19 pandemic.
[44]This study review focuses on the heart failure population, its associated morbidity, and mortality burden with COVID-19, as well as its impact on healthcare systems.
[45]The literature review evaluates the rate of Mycobacterium tuberculosis and Severe Acute Respiratory Syndrome Coronavirus-2 coinfections and interactions between these infectious agents.
[46]This work provides a scoping and comprehensive review of the clinical outcomes from the cross-link of type 2 diabetes mellitus (T2DM), COVID-19, and sarcopenia.
[47]This review clarifies the findings of COVID-19 patients associated with pulmonary aspergillosis.
[48]This review discusses the benefits and disadvantages of biologics as a first-line treatment choice, updates treatment recommendations according to current evidence, and proposes psoriasis treatment algorithms.
[49,50]This systematic review and meta-analysis present the incidence and mortality of COVID-19-associated pulmonary aspergillosis CAPA in critically ill patients with COVID-19 to improve guidance on surveillance and prognostication.
[51]This paper explores AI: the advancements in methodology; current integration in cardiac surgery or other clinical scenarios; and potential future roles, which are innately nearing as the COVID-19 era urges alternative approaches to care.
[52]This review provides a literature review including the epidemiology, pathogenesis, and management of COVID-19-induced bradyarrhythmia.
[53]This study review focuses on the heart failure population, its associated morbidity, and mortality burden with COVID-19, as well as the impact on healthcare systems.
Table 2. Inclusion and exclusion criteria.
CharacteristicInclusion CriteriaExclusion Criteria
Type of ResearchPeer-reviewedCase reports, letters to the editors, preprinted documents, qualitative studies, surveys or reviews, simulation studies, and studies describing review protocols
Research focusIncludes analysis or evaluation of one or more AI methods, algorithms, or techniques relating to COVID-19 Does not include analysis or evaluation of one or more methods, algorithms, or AI techniques related to COVID-19
Type of dataset used for evaluation or validationValidates one or more methods, algorithms, or AI techniques relating to COVID-19 AI using a real datasetDoes not use a real dataset
Type of comorbidities addressed in the researchContains aspects of diagnosis, prognosis, management, or treatment of one of the major chronic diseases with the highest prevalence in the world (CVD, diabetes, or cancer)Does not contain aspects of diagnosis, prognosis, management, or treatment of one of the major chronic diseases with the highest prevalence in the world (CVD, diabetes, or cancer)
Table 3. List of studies selected for the systematic literature review organized by the general subject of study.
StudiesNo. of WorksThe General Subject of StudyChallenges
[57,58]2Detection of COVID-19 using ML techniquesSurvival analysis for COVID-19 and predicting the mortality rate in COVID-19 cases.
[59,60,61,62,63,64,65,66,67,68,69,70,71,72,73,74]16Predicting the risk of dying in COVID-19 and comorbid patients using ML techniquesClassifying the mortality rate of patients diagnosed with COVID-19, Predicting the mortality risk of COVID-19 patients based on the patient’s physiological conditions and demographic characteristics, identifying key clinical measures to triage patients more effectively to general admission versus intensive care unit (ICU) admission and to predict mortality in COVID-19 pandemic, predicting the probability of acute respiratory distress syndrome (ARDS) in COVID-19 patients, predicting COVID-19 disease severity, cardiovascular risk factors, and in-hospital mortality in patients with COVID-19, mortality risk prediction of hospitalized coronavirus disease-2019 (COVID-19) patients with and without diabetes mellitus (DM), and machine learning models for prediction of mechanical ventilation (MV) for patients presented to the emergency room and for prediction of in-hospital mortality once an patien is admitted.
[75,76,77,78,79,80,81,82,83,84,85]11Prediction of COVID-19 using ML techniquesMachine learning framework for the prediction of COVID-19 comparing seven ML algorithms, alternative algorithmic analysis for predicting the health status of patients using four ML algorithms, an online prognostic tool to predicting COVID-19 community mortality risk using five ML algorithms, machine learning approach for mortality prediction in COVID-19 pneumonia using Naïve Bayes algorithm, validation of individualized mortality risk scores based on the anonymized clinical and laboratory data at admission and determine the probability of Deathsusing eXtreme Gradient Boosting (XGB) Algorithm, CNN-AE method to predict the survival chance of COVID-19 patients using a CNN trained with clinical information, a model for prediction of near-term in-hospital mortality among patients with COVID-19 by application of time–series algorithm, recurrent neural network models (CovRNN) for predicting outcomes of patients with COVID-19, mortality prediction model for the triage of COVID-19, pneumonia, mechanically ventilated ICU patients, XGBoost Algorithm, and Bayesian rule modeling for interpretable mortality classification of COVID-19 patients using class-attribute interdependency maximization (CAIM).
[86,87,88]3Improvement of COVID-19 prediction using ML techniquesEstimate the risk level of COVID-19 in diabetic patients without a medical practitioner’s advice for timely action and overcoming the multifold mortality rate of COVID-19 in diabetic patients, where after hyper-parameter optimization, the CatBoost classifier gives the best accuracy. Using the elastic-net regularized Cox proportional hazards model and creating a machine learning algorithm to predict overall survival among re-infected COVID-19 patients. This model also reduced its core features to maximize simplicity and generalizability. Finally, to predict mortality risk factors for COVID-19 patients used, a genetic-based adaptive estimation technic was used to predict mortality risk factors in COVID-19 patients using an optimized convolution neural network (CNN).
Table 4. Algorithms applied in the reviewed algorithms.
AlgorithmsNo. of Works
RF11
CoxSA2
LR3
Support Vector (SV)1
KNN3
Gradient Boosting (GB)1
CNN2
XGBoost6
Class-Attribute Interdependency Maximization (CAIM)1
Fuzzy Model (FM)1
Naïve Bayes Score (NBS)1
CNN-AutoEncoder (CNN-AE)1
Gated Recurrent Unit (GRU-D)1
Recurrent neural networks (RNNs)1
Decision Tree (DT)2
CatBoost2
Genetic-Based Adaptive Momentum Estimation (GB-ADAM)1
Kaplan-Meier (KM)1
Ensemble Classifier (EC)1
Recurrent Neural Network-Based Models (CovRNN)1
Bagging algorithm1
ANN2
Table 5. Performance metrics applied to the algorithms in the observed studies.
MetricsNo. of Works
Hazard Ratio (HR)1
Accuracy (ACC)19
Area Under Curve (AUC)12
F1-score3
Precision5
Area Under the Precision-Recall Curve (AUPCR)1
Area Under the Receiver Operating Characteristic Curve (AUROCs)2
Table 6. Algorithm performance based on the evaluation of the best-performing metrics within the observed studies.
AlgorithmsMetrics (%)
HRACCF1-SPRECAUCAUPCRAUROCs
CoxSA0.820.93
LR 0.90, 0.94, 0.80 0.79
SV 0.97
KNN 0.94, 0.94 0.94
RF 0.97, 0.65, 0.94, 088, 0.92, 0.93 0.78, 0.89, 0.80, 0.87 0.84, 097
GB 0.97
CNN 0.97, 092 0.95
XGBoost 0.87, 0.98, 0.97, 0.96, 0.940.920.860.92, 0.860.78
FM 0.980.92 0.900.96
NBS 0.78
CNN-AE 0.96
GRU-D 0.93
RNN 0.93
DT 0.94
CatBoost 0.86 0.76
GB-ADAM 0.93
KM 0.87
EC 0.81
CovRNN 0.93
CatBoost 0.83
Bagging 0.85
ANN 0.90, 0.95 0.91
Table 7. Algorithm performance average based on feature selection technique.
Feature Selection Techniques
Chi-squareTime SeriesLASSOA-PrioriK-fold CVKMRFSSHAP p-ValueCrossover in GASSR +OPTUMInformation GainECMRMR **GEDEON
CoxSA 0.93
(LR) 0.94 0.80
(SV)
(KNN) 0.94
(RF) 0.87 0.83 0.940.950.92 0.89
(GB)
CNN0.97 0.92
XGBoost 0.860.92 0.960.940.78
(FM)
(NBS) 0.80
CNN-AE 0.96
RNN 0.93
DT 0.97 0.94
CatBoost 0.86
GB-ADAM 0.93
KM 0.87
EC 0.81
CovRNN 0.93
Bagging0.85 0.850.85
ANN
LASSO (least absolute shrinkage and selection operator), + sum of squared residuals, ** maximum relevance minimum redundancy.
Table 8. Metric average performance with the best accuracy of the algorithms found in the review.
StudyAlgorithmMetric Performance
[66]CoxSAHR0.82
[77]RFACC0.97
[69]CNNACC0.97
[83]XGBoostAUC0.87
[81]RFAUC0.87
[85]CAIMACC0.96
[73]XGBoostAUC0.92
[78]NBSAUC0.8
[80]CNNACC0.96
[65]RFAUC0.83
[64]RNNAUC0.93
[79]XGBoostACC0.96
[58]KNNACC0.93
[63]XGBoostAUPCR0.78
[84]LRAUC0.8
[72]RFACC0.84
[74] CatBoostAUC0.86
[62]DTACC0.97
[61]RFAUC0.89
[57]CoxSAACC0.93
[71]KNNPREC0.94
[86]CatBoostPREC0.76
[68]RFPREC0.8
[67]ANNACC0.95
[88]GB-ADAMACC0.93
[70]RFROC0.97
[87]KMACC0.87
[60]ECF1-S0.81
[82]CovRNNAUROCs0.93
[75]RFACC0.92
[59]BaggingACC0.85
[76]ANNACC0.90
Table 9. Tools used for the implementation of the models designed in the works analyzed in the review.
StudiesToolsLanguage and LibrariesDataset
[66]R Not presented
[77]Online COVID-19 Mortality Risk Prediction Tool (CoCoMoRP) Not presented
[69] PythonNot presented
[83] Pythonhttps://physionet.org/content/mimiciii/1.4/
[81]Apache Spark Not presented
[85]BRL code Not presented
[73] Keras, TensorFlowNot presented
[78] PythonNot presented
[80] Pythonhttps://www.kaggle.com/datasets/danialsharifrazi/covid19-numeric-datase
[65] PythonNot presented
[64] AutoGluon/TensorFlow KerasNot presented
[79] Pythonhttps://github.com/beoutbreakprepared/nCoV2019
[58] PythonNot presented
[63]Automated Machine Learning (AutoML) Not presented
[84]SAS base V.9.4 and SAS enterprise miner V.14.3, Python
[72]ND Not presented
[74] PythonNot presented
[62] PythonNot presented
[61]R https://www.kaggle.com/datasets/sudalairajkumar/novel-corona-virus-2019-datase
[57]ND Not presented
[71]ND Not presented
[86]MATLAB Not presented
[68] PythonNot presented
[67] Keras, TensorFlowhttps://www.covidanalytics.io/dataset
[88] TensorFlowNot presented
[70]R Not presented
[87]R Not presented
[60]MATLAB–IBM SPSS Statistics Not presented
[82]Prediction model Risk of Bias ASsessment (PROBAST) Not presented
[75]MATLAB https://github.com/nasrinam/clinical-and-laboratory-dataset.COVID19/
[59]ND https://dataverse.harvard.edu/dataset.xhtml?persistentId=doi:10.7910/DVN/RRCQEO
[76]ND Not presented
Table 10. Dataset and platforms used in the reviewed studies.
Publisher’s Note: MDPI stays neutral with regard to jurisdictional claims in published maps and institutional affiliations.

