Abstract
Inductive wireless power transfer systems often incorporate unconventional, irregularly shaped transmitter windings for the purposes of covering a designated area, fitting into special enclosures and enhancing the tolerance of misalignment. To design and optimise the winding structures, the inductive parameters must be extracted and linked to the design objectives. Conventionally, these parameters can be extracted using three-dimensional finite element analysis, which often requires subjective manual tweaks and prolonged trial and error procedures. The efficacy is therefore greatly dependent on the experience of the designer. In this paper, a case study for modelling and optimising the spatial coverage by scuplturing the winding shape is demonstrated via a Christmas tree model, utilising the parametric formation equations and line-integral based numerical solvers. A cone-shaped winding with variable interturn pitches was used as the transmitter and a receiver winding was designed to be fit into a bubble that can be hung on the tree. A two-stage optimisation method with simplified degree-of-freedom parameters and brutal force search was used to find the optimal design candidate. Heatmaps of receiver output voltages were generated in a time-efficient way, intuitively helping the designers to make adjustments for the winding structures. A practical prototype was built to verify the open loop voltage distribution on the receiving winding at various positions and another demonstration was made to show the continuum of power coverage around the Christmas tree.
1. Introduction
More than a hundred years ago, Nikola Tesla invented the world’s first wireless power transfer (WPT) systems. Limited by the technologies available at the time, his great ambition of a widespread deployment of wireless power was never completed [1]. Nowadays, modern wireless power implementations based on semiconductor power electronic converters have been widely used for charging portable electronic devices, such as the published standards Qi [2] and AirFuel [3], and the standards for charging electric vehicles such as the SAE J2954 [4]. Most of these charging standards mainly focus on efficient power delivery and dedicated one-to-one power delivery. However, none of them have insights into a broader coverage of continuous power delivery like Tesla’s dream of the World Wireless System [5]. On a different technology track, the low power ambient RF energy harvesting technologies have been developed [6] for uninterrupted power provisioning over a large spatial area; however, they are only limited to up to a few milliWatt power capabilities and a poor energy conversion efficiency (RF–to–DC) of below 60%. This may be sufficient for mobile edge computing (such as IoT sensors) with energy storage and periodically consuming energy for communication [7,8] only. The inductive coupling WPT is considered suitable for higher power (up to several Watts) over a wider spatial coverage. This can be achieved by optimising the spatial trajectories of the transmitting windings. However, existing designs mostly stick to regular shapes such as circles, rectangles, and regular polygons. This paper elaborates a case study on the design and optimisation of more irregular and complicated winding geometries, which are made into WPT systems covering a designated target region in space. This is to address the practical challenges in consumer product designs where the receivers/loads are expected to be used in a spatial region continuously, which is from a different perspective where maximum power efficiency is targeted.
A brief review of existing WPT technologies is summarised first. The Qi standard has become the most commercially successful wireless power solution, which is adopted in products from the world’s major manufacturers such as Apple, Samsung, and Huawei. However, despite the name “wireless” charging, Qi still requires alignment and preferably physical contact between the transmitter and the receiver, which restricts continuous and free-positioning wireless power delivery [9]. Qi has recommended conventional planar circular or round-cornered rectangle windings for the transmitters or the receivers (either with or without relay resonators) to be fit in the enclosures of electronic products [10,11]. These windings are of a diameter ranging between 4–6 cm and are expected to be used concentrically with a separation distance of below 1 cm. Therefore, the variation of the mutual inductance (also the coupling coefficient) between the two parts changes significantly when the position of the receiving unit moves, and thus collapses the output power and voltage levels. Omni-directional WPT systems are proposed to tackle this issue. In ref. [12], the authors proposed a crossed dipole structure incorporating ferrite bars with phase-modulated currents driving the two independent orthogonal transmission bars. However, a same cross-dipole structure receiver design is essential and a power combination circuit is required to achieve the free-positioning feature. Similar ideas resolving the misalignment issue by optimising ferrite materials are also seen in ref. [13,14]. In a different manner, in ref. [15], multiple transmitter windings were used to allow rotary misalignments of simple winding receivers receiving power continuously. Both directional [16] and omni-directional [17,18] WPT can be achieved using the three-orthogonal circular winding design. Both aforementioned ideas introduce multiple independently controlled transmitter windings to enhance the coverage against misalignment, but the winding design themselves are still regular. These works are also mostly tackling the angular misalignments but the continuum of power delivery over spatial displacement is not targeted. Practically, this increases the costs of the manufacturing and raises the challenges in the robustness and reliability of the sophisticated controls.
The impact of misalignment on the received load and power levels of a single transmitter and single receiver winding WPT system can be revealed from the following equations. In a generic two-coil WPT system, as shown in Figure 1, the receiving side fixed-load output power is:
where is the winding series resistance in both windings (assumes the same for simplicity), is the equivalent load-side resistance, is the series reactance (effectively zero if ), M is the mutual inductance between the two windings, and is the transmitter (primary) side current. The power source loss is generally proportional to the supply current, therefore a current sources is assumed in the model. The no-load output voltage is:
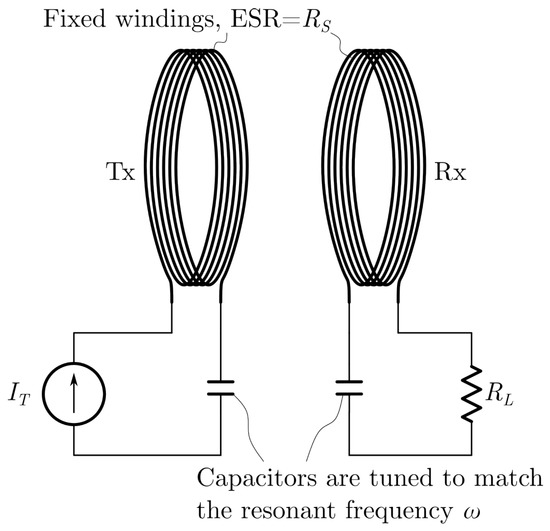
Figure 1.
Schematic of a generic two-coil matched WPT system.
It can be seen seen from (1) and (2) that the mutual inductance directly affects the output power and no-load voltage levels.
When a larger region of stable power reception is required, such as a wireless sensor network or a distributed lighting system, a more flexible and irregular transmitter winding can be used. In the design workflow, the following objectives are normally raised initially.
- Objective 1. Within the given spatial region, the load is guaranteed to receive at least at a given equivalent series load impedance .
- Objective 2. Within the given spatial region, the open-circuit (no-load) output voltage at the receiver is guaranteed at least when the load is connected in parallel. (Parallel capacitor compensation connection at the receiver is assumed. The no-load voltage in a series compensated circuit is very sensitive to the tolerances of the inductance and capacitive values near the resonant frequency.)
Depending on the application requirements, either one or both of the above objectives can be considered. In this paper, a Christmas tree with wireless powered decoration bubbles is used as the example for elaboration of the methodologies, as shown in Figure 2. There are receiver circuits and LEDs inside the mock bubbles and they consume low power, but are more sensitive to the driving voltage. Therefore, the voltage coverage objective (Objective 2) was selected in this work. When the mock bubbles are hung around the tree at where they normally supposed to be, in all places the LEDs should be lit as expected.
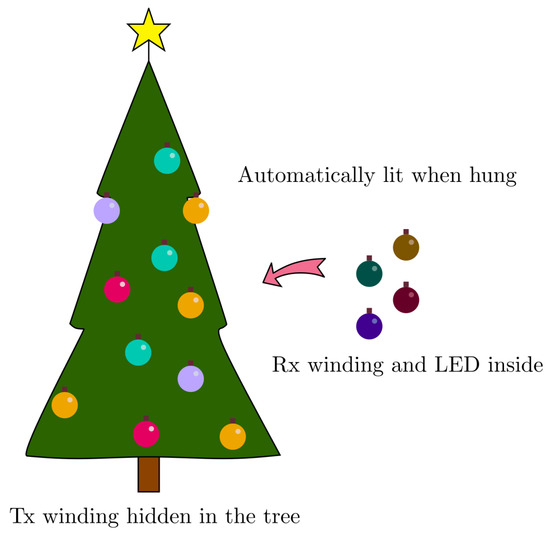
Figure 2.
An illustration of wirelessly powered bubbles on a Christmas tree.
The rest of the sections are arranged as follows. First, the mathematical modelling of the solution space and the objective functions are explained. Then the evaluation and optimisation methods are illustrated. In the results section, the rendered heatmaps from the simulation results are shown and the experimental results are presented. There are further discussions of the practical considerations of the design workflow, followed by a conclusion.
2. Materials and Methods
2.1. Assumptions
A few assumptions were first decided to simplify the degree-of-freedom of the design space. Based on the requirements in the Christmas tree example application, there is a single transmitter winding and multiple receivers in the system. The dimensional and the components’ parameters in this system are identified in Table 1. The parameters in italic fonts are dependent variables.

Table 1.
The general parameters identified in a single transmitter and multiple receivers WPT system.
Among all parameters, the focus in this paper is the transmitter winding trajectory as it greatly affects the coverage and uniformity of the deliverable voltage/power over the defined regions. The other parameters were assumed as follows. Generally, the higher is, the higher power and efficiency the system is able to achieve with the same set of winding as long as the ac resistance is not significantly deteriorating. For current silicon MOSFETs and available litz wires with the finest strands, (e.g., 48 AWG), the sweet spot is normally around 500 kHz from experience. The load is very light in this example—decorative LEDs normally have an operating impedance around several hundreds to thousands of Ohms. Reaching the forward voltage of the LEDs is more critical compared to the power delivery, thus the receiver was designed with a shunt connection. There might be other non-technical considerations, for example, both compensation capacitors at the transmitter and the receivers are preferred to be identical to reduce the number of SKUs, despite not being necessary. This will implicitly require the same and with very different shapes and dimensions.
The schematic of the system with a single receiver is shown in Figure 3. When multiple receivers are attached to the system, in this particular example, the mutual couplings between receivers are minimal; whilst each receiver power is negligible, a simple superposition of this single receiver case can be assumed.
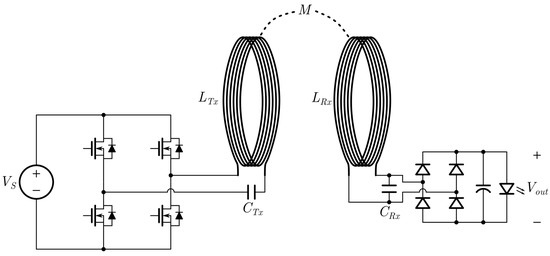
Figure 3.
Schematic of the example WPT system with a full-bridge driver and an LED load.
The primary side current can be controlled in two ways—either fixing 180 phase shift whilst adjusting or fixing but adjust the phase shift. In both methods the duty ratio shall be the same and just a little bit below 50% reserving sufficient dead time. The amplitude of the first order harmonic of the voltage seen by the transmitter resonator is:
where d is the percentage of the phase shift out of the half-cycle period, which is also equivalent to the on time duty ratio in the phase shift control. The output voltage after the rectifier is determined by both open-circuit voltage from the shunt resonator (2) and the V-I curve of the load LED, as well as the forward voltage drop on the full wave rectifier. As the equivalent source impedance seen by the load (including the rectifier) is large, an over-voltage at no-load will not be retained when a diode load is connected, but will only sink more current. It is therefore in-line with Objective 2 that we only need to guarantee a minimum open-circuit voltage on the receiving resonator. In this particular case, the designated region is where the bubbles are normally hung—the entire crown on the tree, which is effectively the inner volume of a cone shape , defined by its base circle radius r and height h. A mathematical description of the objective is:
The definition for is:
and
where h is the height and r is the bottom surface radius of the cone sitting on the plane. For the best visual clarity on a planar media, a cross-sectional sampling can be used, similar to a CT scan. Particularly, if a model is approximately symmetrical, a centre cross-section is sufficiently representative.
2.2. Solution Space
To further simplify the complication of representing the winding structures whilst keeping generality, the Tx winding is assumed to be wound around the surface of the cone shape and can be flexibly defined using the segmented spiral model with key points in IPTVisual [19]. The solution space is condensed from the space curve down to a finite array of coordinates in .
As depicted in Figure 4, the segment interpolated between two key points in cylindrical system and is following the curve:
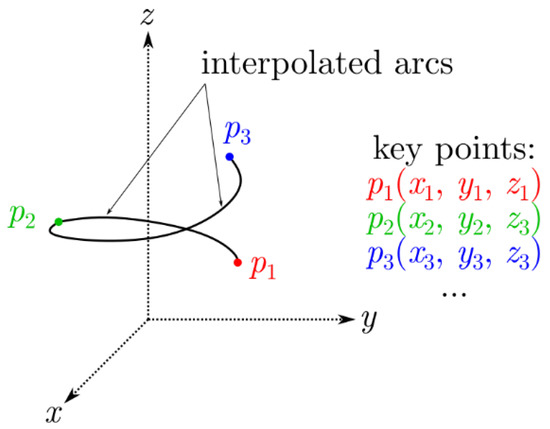
Figure 4.
Spiral interpolation from key points [19].
It is worth noting that the solution space is not with a fixed length. For example, a three-turn cone spiral with and and an equal pitch can be defined using the four points in Table 2. All four points are in the first quadrant of the plane, which further helps to shrink down the size of the degrees of freedom. A returning lead with a vertical and a horizontal segment is also modelled together. A wire cross-sectional diameter of was used. These result in a self-inductance of . To match this value, an eight-turn winding using diameter wires around the equator band on a sphere of in diameter as the receiver winding gives a self-inductance of . The key points coordinates are tabulated in Table 3. Compensation capacitors of were selected resulting a resonance frequency of . A rendering of both windings is shown in Figure 5.

Table 2.
Four key points to define a cone spiral, unit in metres.

Table 3.
Nine key points to define the receiver winding on a sphere, unit in metres.
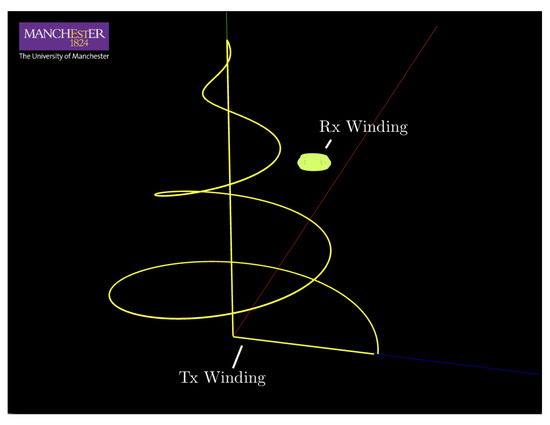
Figure 5.
A 3-turn Tx cone spiral winding and a 8-turn Rx mid-spherical winding.
2.3. Parametric Search
The spiral winding model also helps downgrade the degrees of freedom (DoF) of the solution space. With a large number of DoF, iterative numerical methodologies can be used, such as the genetic algorithms. In this particular case, with the following assumptions, the DoF can be further reduced down to 2, and therefore a brutal force search was used.
- The first key point is bind to the apex of the cone;
- The last key point is bind to a point on the base circle;
- All key points are located on the plane;
- All key points are on the cone surface.
The coordinates for key points 2 and 3 in Table 2 are defined by:
where are the coordinates. In practice, brutal force loops every intervals for both coordinates were used.
2.4. Computational Complexity
The evaluation of the power or voltage distributions involved cascaded computational stages. From the top to the bottom levels, they are (1.) Rasterisation of observation points; (2.) Solution to the power/voltage; (3a.) Solution to the mutual and self inductance values; and (3b.) Creation of winding structures and segmentation. The computational complexity is tabulated in Table 4.

Table 4.
Computational complexity in cascaded stages.
2.5. Evaluation
A linear sampling and evaluation algorithm was used to generate the heatmaps for more intuitive assessments, helping manual or automatic tunings of the design pattern. The receiver circuit was virtually moved to the sampling locations and the solver programme was executed and was recorded. An observation plane was selected and a proper resolution interval was chosen. In this particular example, a resolution of was used over a horizontal span between and , and a vertical span between and , reserving additional margins outside the box boundaries. A pseudo code is shown in Algorithm 1 where the sampling took place on the plane. The mutual inductance calculation is purely dependent on the space curves, and can be calculated using Neumann’s formula [19]. The as a function is based on (2).
| Algorithm 1: Generating the spatial heat map on over positions on plane. |
 |
In order to speed up the process, it is obvious that the weakest covered areas are at the cone surfaces. Instead of evaluating over the whole -plane (~1600 points), a quick 12–point test was performed, and the minimum load voltage was evaluated over the design candidates. The locations of these observation points are rendered in Figure 6.
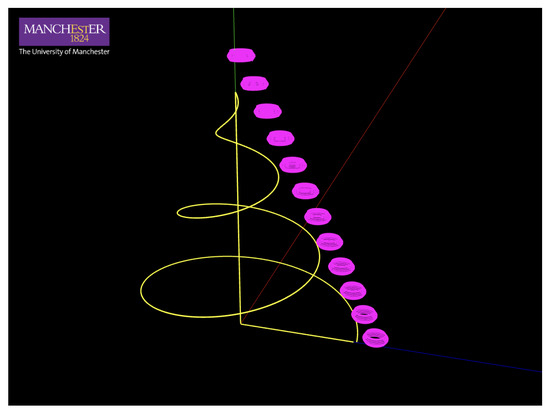
Figure 6.
Twelve observation locations for faster evaluation.
Together with the faster and slower evaluation methods a two–stage optimisation workflow is shown in Figure 7.
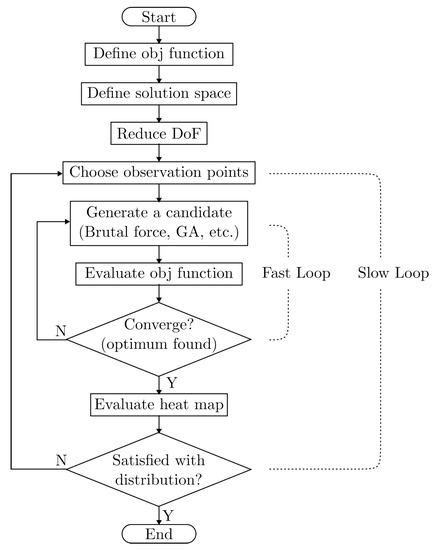
Figure 7.
Two-stage flowchart for optimising the tree WPT system.
3. Results
3.1. Simulation Results
The output matrix of open-circuit voltages in Algorithm 1 was plotted with colour blocks with corresponding x and z coordinates labelled as shown in Figure 8. The dc source voltage was set to . A contour of the cone shape is outlined in red on the plot.
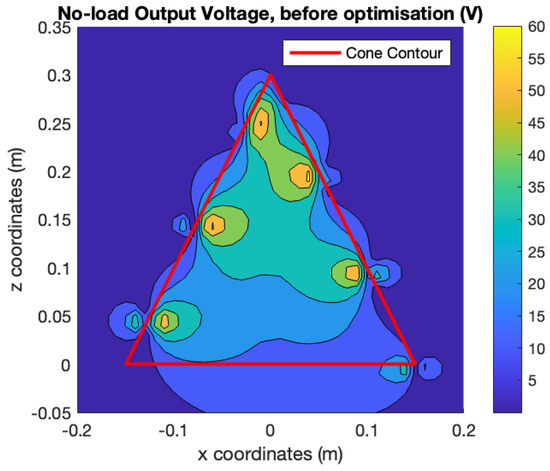
Figure 8.
Heatmap of open-circuit voltage at the receiver in different locations with an equal pitch.
At a glance, it can be seen that the majority of the area inside the cone is above , with a few corners and edge stripes falling below 10 and the top corner area exceeding 60.
The brutal force optimisation suggests that the point 2 and 3 coordinates in Table 5 will give the minimal received voltages at the load among all testing locations being optimal among all observation points in Figure 6.

Table 5.
Tweaked four key points for a better distribution, unit in metres.
Without changing any other values, a new plot was generated with the same setup and is shown in Figure 9. It can be seen from the plot that the voltages in the centre areas are more evenly distributed with a peak of around 40, and a majority coverage over 10. It is obviously a better solution compared to the unoptimised initial setup.
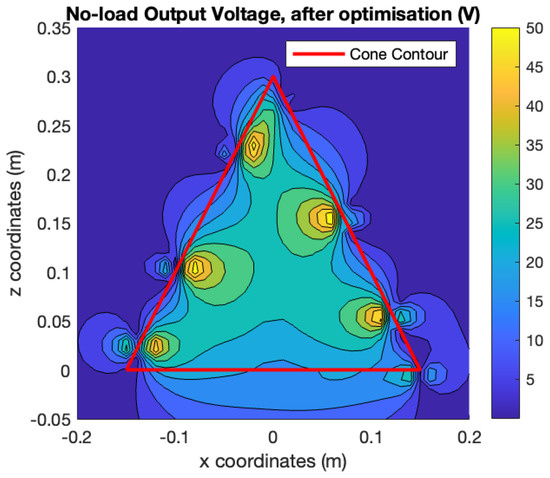
Figure 9.
Heatmap of open-circuit voltage at the receiver in different locations after optimisation.
3.2. Experiment Verification
An acrylic cone frame with six limbs was created to verify the optimised solution candidate. The wire was wound around the frame at the designated ticks on the edge to match the optimised winding model in Table 5. The Tx winding was compensated for with a capacitor and was driven with peak current at the resonance frequency kHz. The open-loop voltage (without compensation) on the Rx winding was directly measured by the oscilloscope and compared to the simulation results. Figure 10a shows the rendered simulation results with the voltages displayed in colours. Figure 10b shows the experimental setup, with the receiver winding fixed at the exact positions of the observation points and the measured and simulated voltages are plotted in Figure 10c.
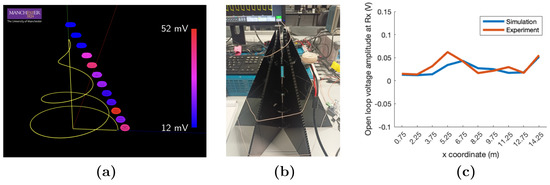
Figure 10.
Verification of open-loop voltages at observation points. (a) Simulation results rendered in colour at the observation positions. (b) Experiment setup with the acrylic frame. (c) Comparison of simulated and measured voltages.
A practical experiment was built on a Christmas tree. Due to the difficulties of fixing the winding into exact coordinates, only a roughly matching winding prototype was created. A diameter eight-turn receiver winding was built on a 3D printed bobbin and the compensation capacitor/rectifier circuit was embedded in the centre of the bobbin, as shown in Figure 11. A LED was used as the load. Due to the wires being used being slightly thinner than the modelling wire, the actual self-inductance was at the receiving winding and at the transmitter winding. The compensation capacitors were both 275 VAC X2 polymer film capacitors. The transmitting resonator was driven by a variable dc voltage source fed inverter operating at 500 kHz. In the experiment, the dc voltage was set to as the load was very light. It can be seen in Figure 12 that the receiver is lit with around the same brightness at different positions in the tree crown.
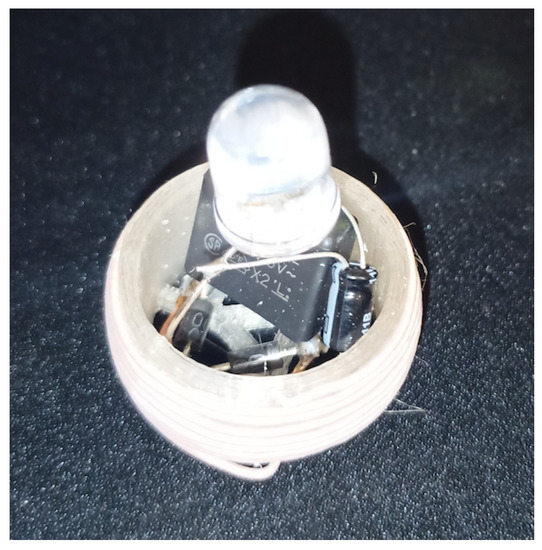
Figure 11.
The receiver circuit with an LED load.
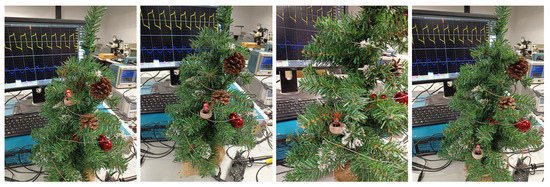
Figure 12.
Receivers placed at different locations around the tree, with similar level of brightness.
4. Discussion
It was found that the visualisation tools greatly help the designers to understand and optimise-by-tweak the winding structure designs. In this particular example, the heatmap consists of 41 × 41 sampling points and the overall computational time is around 20 s on a 2021 Macbook Pro. This includes generating the spatial curve, interpolating the segments and calculation of the mutual and self inductance without reusing the values—in other words, there is still further room for shortening the evaluation time, which makes manual tweaking more convenient. On the other hand, depending on the nature of the solution space, a genetic algorithm may be used for automatic tuning of the design patterns but may only be considered when the structure is so complicated that manual tweaking is very inefficient. Furthermore, machine learning and generative neural network methods may be trained by the datasets generated by the method in this paper, and possibly a much faster evaluation and optimisation tool may be developed.
The power delivery to multiple loads at substantial levels of power would be another complicated issue and cannot be modelled without firstly defining the load behaviour. Despite the mutual coupling among the receiver windings being negligible, the loads can still mutually affect each other through the transmitter circuit. A mathematical modelling for similar systems has been raised in ref. [8] where a power split can be individually optimised.
The above example shows the objective, but the method would be exactly the same for the objective. Depending on the optimisation goals, the numerical solver may also be optimised for other metrics. Other than the heatmap representation, a summarised objective function may be used, e.g., a standard deviation function on all sampling points enclosed by the boundary of the interested area.
5. Conclusions
In this paper, the design methodologies for irregular windings used in WPT systems delivering smooth power or voltage within a designated area is proposed and elaborated. To speed up the process, a two-stage optimisation method was used including a brutal force search of the key point coordinates and heatmap visualisation. A Christmas tree example was used to help the demonstration of the modelling, evaluation and tweaking processes. It was verified by an experiment with close shapes and dimensions that the measurements match the predicted performances well. The computational resources are technically viable for both manual and automatic optimisations. The design paradigm in this work is significantly different from existing WPT systems where the focus is on how to sculpture very irregular spatial wire trajectories and optimise for a wider coverage with a single winding design. The visualisation methodology is feasible and accessible for industrial designers without a power electronics background.
Funding
This research received no external funding.
Acknowledgments
Special thanks to Thomas Johnson and Xindong Li for the technical support and material donation from The University of Manchester.
Conflicts of Interest
The authors declare no conflict of interest.
References
- Carlson, W.B. Wireless LightingG and the Oscillator: (1893–1894). In Tesla: Inventor of the Electrical Age; Princeton University Press: Princeton, NJ, USA, 2013; pp. 176–192. [Google Scholar]
- Wireless Power Consortium. Qi Standard. Available online: https://www.wirelesspowerconsortium.com (accessed on 13 July 2022).
- Alliance, A. AirFuel. Available online: https://airfuel.org/ (accessed on 13 July 2022).
- International, S. Wireless Power Transfer for Light-Duty Plug-in/Electric Vehicles and Alignment Methodology. Available online: https://www.sae.org/standards/content/j2954_202010 (accessed on 13 July 2022).
- Lumpkins, W. Nikola Tesla’s Dream Realized: Wireless power energy harvesting. IEEE Consum. Electron. Mag. 2014, 3, 39–42. [Google Scholar] [CrossRef]
- Kim, S.; Vyas, R.; Bito, J.; Niotaki, K.; Collado, A.; Georgiadis, A.; Tentzeris, M.M. Ambient RF Energy-Harvesting Technologies for Self-Sustainable Standalone Wireless Sensor Platforms. Proc. IEEE 2014, 102, 1649–1666. [Google Scholar] [CrossRef]
- Pham, Q.V.; Fang, F.; Ha, V.N.; Piran, M.J.; Le, M.; Le, L.B.; Hwang, W.J.; Ding, Z. A Survey of Multi-Access Edge Computing in 5G and Beyond: Fundamentals, Technology Integration, and State-of-the-Art. IEEE Access 2020, 8, 116974–117017. [Google Scholar] [CrossRef]
- Diamanti, M.; Tsiropoulou, E.E.; Papavassiliou, S. The Joint Power of NOMA and Reconfigurable Intelligent Surfaces in SWIPT Networks. In Proceedings of the 2021 IEEE 22nd International Workshop on Signal Processing Advances in Wireless Communications (SPAWC), Lucca, Italy, 27–30 September 2021; pp. 621–625. [Google Scholar] [CrossRef]
- Sato, M.; Hattori, Y.; Ueda, M.; Bu, Y.; Mizuno, T. Improved Performance of a Flat-Wire Coil With Magnetic Composite Material for Wireless Power Transfer. IEEE Magn. Lett. 2021, 12, 1–5. [Google Scholar] [CrossRef]
- Wireless Power Consortium. Qi Specification: Power Transmitter Reference Designs; Version 1.3; Wireless Power Consortium: Piscataway, NJ, USA, 2021. [Google Scholar]
- Wireless Power Consortium. Qi Specification: Power Receiver Design Examples; Version 1.3; Wireless Power Consortium: Piscataway, NJ, USA, 2021. [Google Scholar]
- Choi, B.H.; Lee, E.S.; Sohn, Y.H.; Jang, G.C.; Rim, C.T. Six Degrees of Freedom Mobile Inductive Power Transfer by Crossed Dipole Tx and Rx Coils. IEEE Trans. Power Electron. 2016, 31, 3252–3272. [Google Scholar] [CrossRef]
- Yao, Y.; Gao, S.; Mai, J.; Liu, X.; Zhang, X.; Xu, D. A Novel Misalignment Tolerant Magnetic Coupler for Electric Vehicle Wireless Charging. IEEE J. Emerg. Sel. Top. Ind. Electron. 2022, 3, 219–229. [Google Scholar] [CrossRef]
- Zhuang, T.; Yao, Y.; Wang, Y.; Liu, X.; Xu, D. Design and Optimization of a Compact and Misalignment-tolerant Wireless Power Transfer System. In Proceedings of the 2021 IEEE 12th Energy Conversion Congress & Exposition—Asia (ECCE-Asia), Singapore, 24–27 May 2021; pp. 1287–1292. [Google Scholar] [CrossRef]
- Ng, W.M.; Zhang, C.; Lin, D.; Ron Hui, S.Y. Two- and Three-Dimensional Omnidirectional Wireless Power Transfer. IEEE Trans. Power Electron. 2014, 29, 4470–4474. [Google Scholar] [CrossRef]
- Zhang, C.; Lin, D.; Hui, S.Y. Basic Control Principles of Omnidirectional Wireless Power Transfer. IEEE Trans. Power Electron. 2016, 31, 5215–5227. [Google Scholar] [CrossRef]
- Lin, D.; Zhang, C.; Hui, S.Y.R. Mathematical Analysis of Omnidirectional Wireless Power Transfer—Part-I: Two-Dimensional Systems. IEEE Trans. Power Electron. 2017, 32, 625–633. [Google Scholar] [CrossRef]
- Lin, D.; Zhang, C.; Hui, S.Y.R. Mathematic Analysis of Omnidirectional Wireless Power Transfer—Part-II Three-Dimensional Systems. IEEE Trans. Power Electron. 2017, 32, 613–624. [Google Scholar] [CrossRef]
- Zhang, C.; Chen, X.; Chen, K.; Lin, D. IPTVisual: Visualisation of the Spatial Energy Flows in Inductive Power Transfer Systems with Arbitrary Winding Shapes. World Electr. Veh. J. 2022, 13, 63. [Google Scholar] [CrossRef]
Publisher’s Note: MDPI stays neutral with regard to jurisdictional claims in published maps and institutional affiliations. |
© 2022 by the author. Licensee MDPI, Basel, Switzerland. This article is an open access article distributed under the terms and conditions of the Creative Commons Attribution (CC BY) license (https://creativecommons.org/licenses/by/4.0/).