

Analysis of the S-ANFIS Algorithm for the Detection of Blood Infections Using Hybrid Computing


Abstract
1. Introduction
Outcome
2. Literature Survey
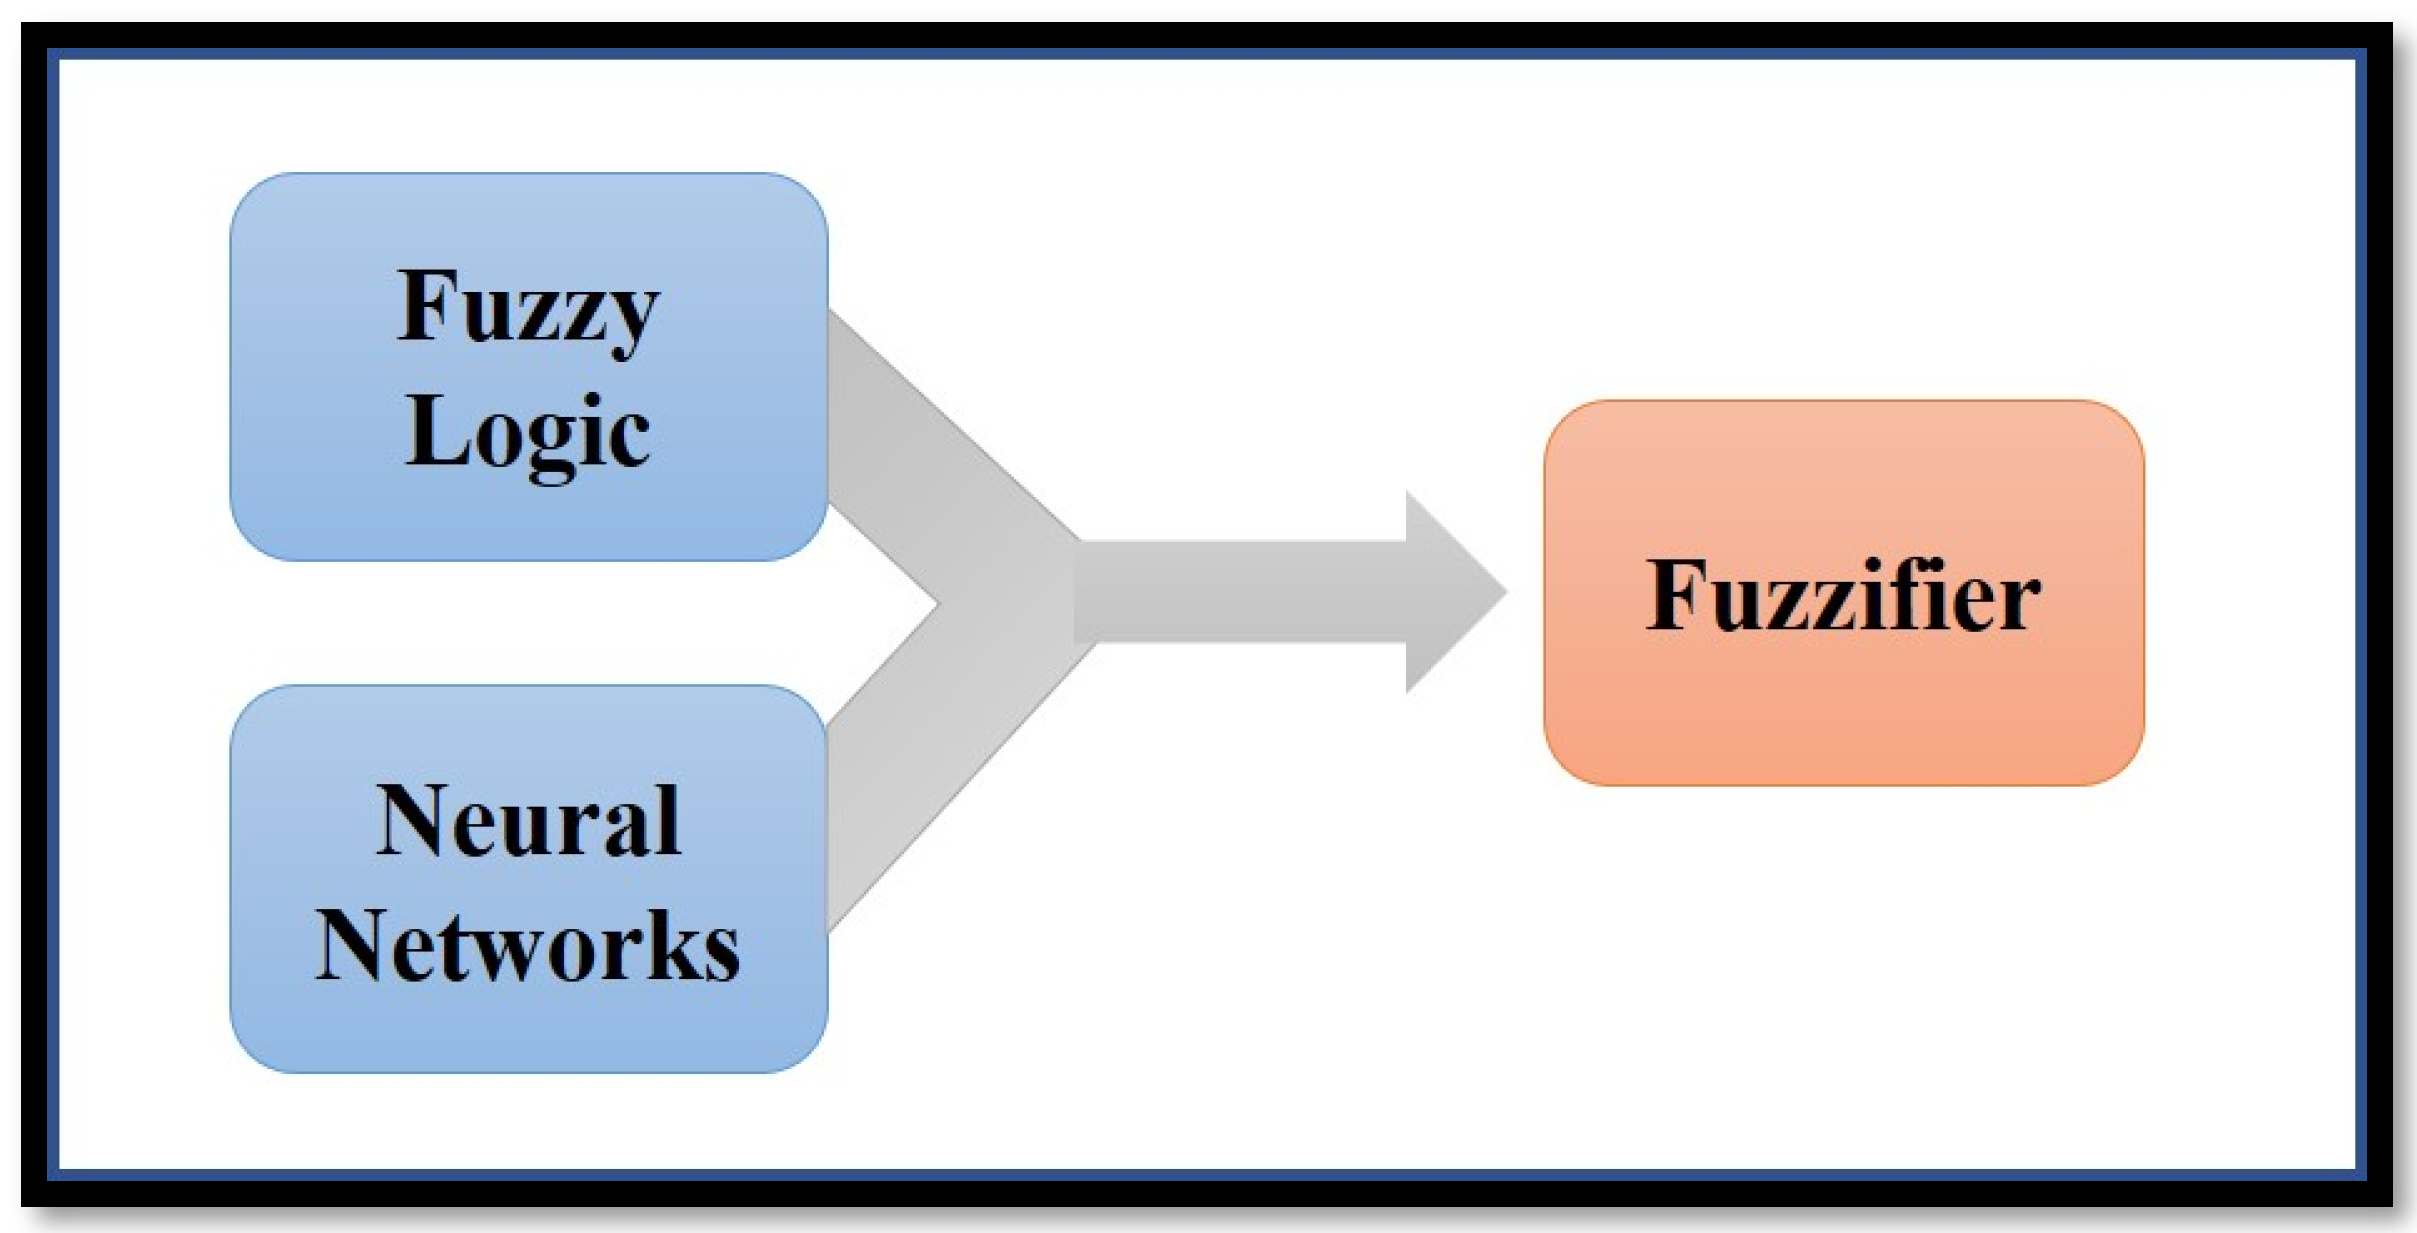
- Fuzzy logic
- Neural Network
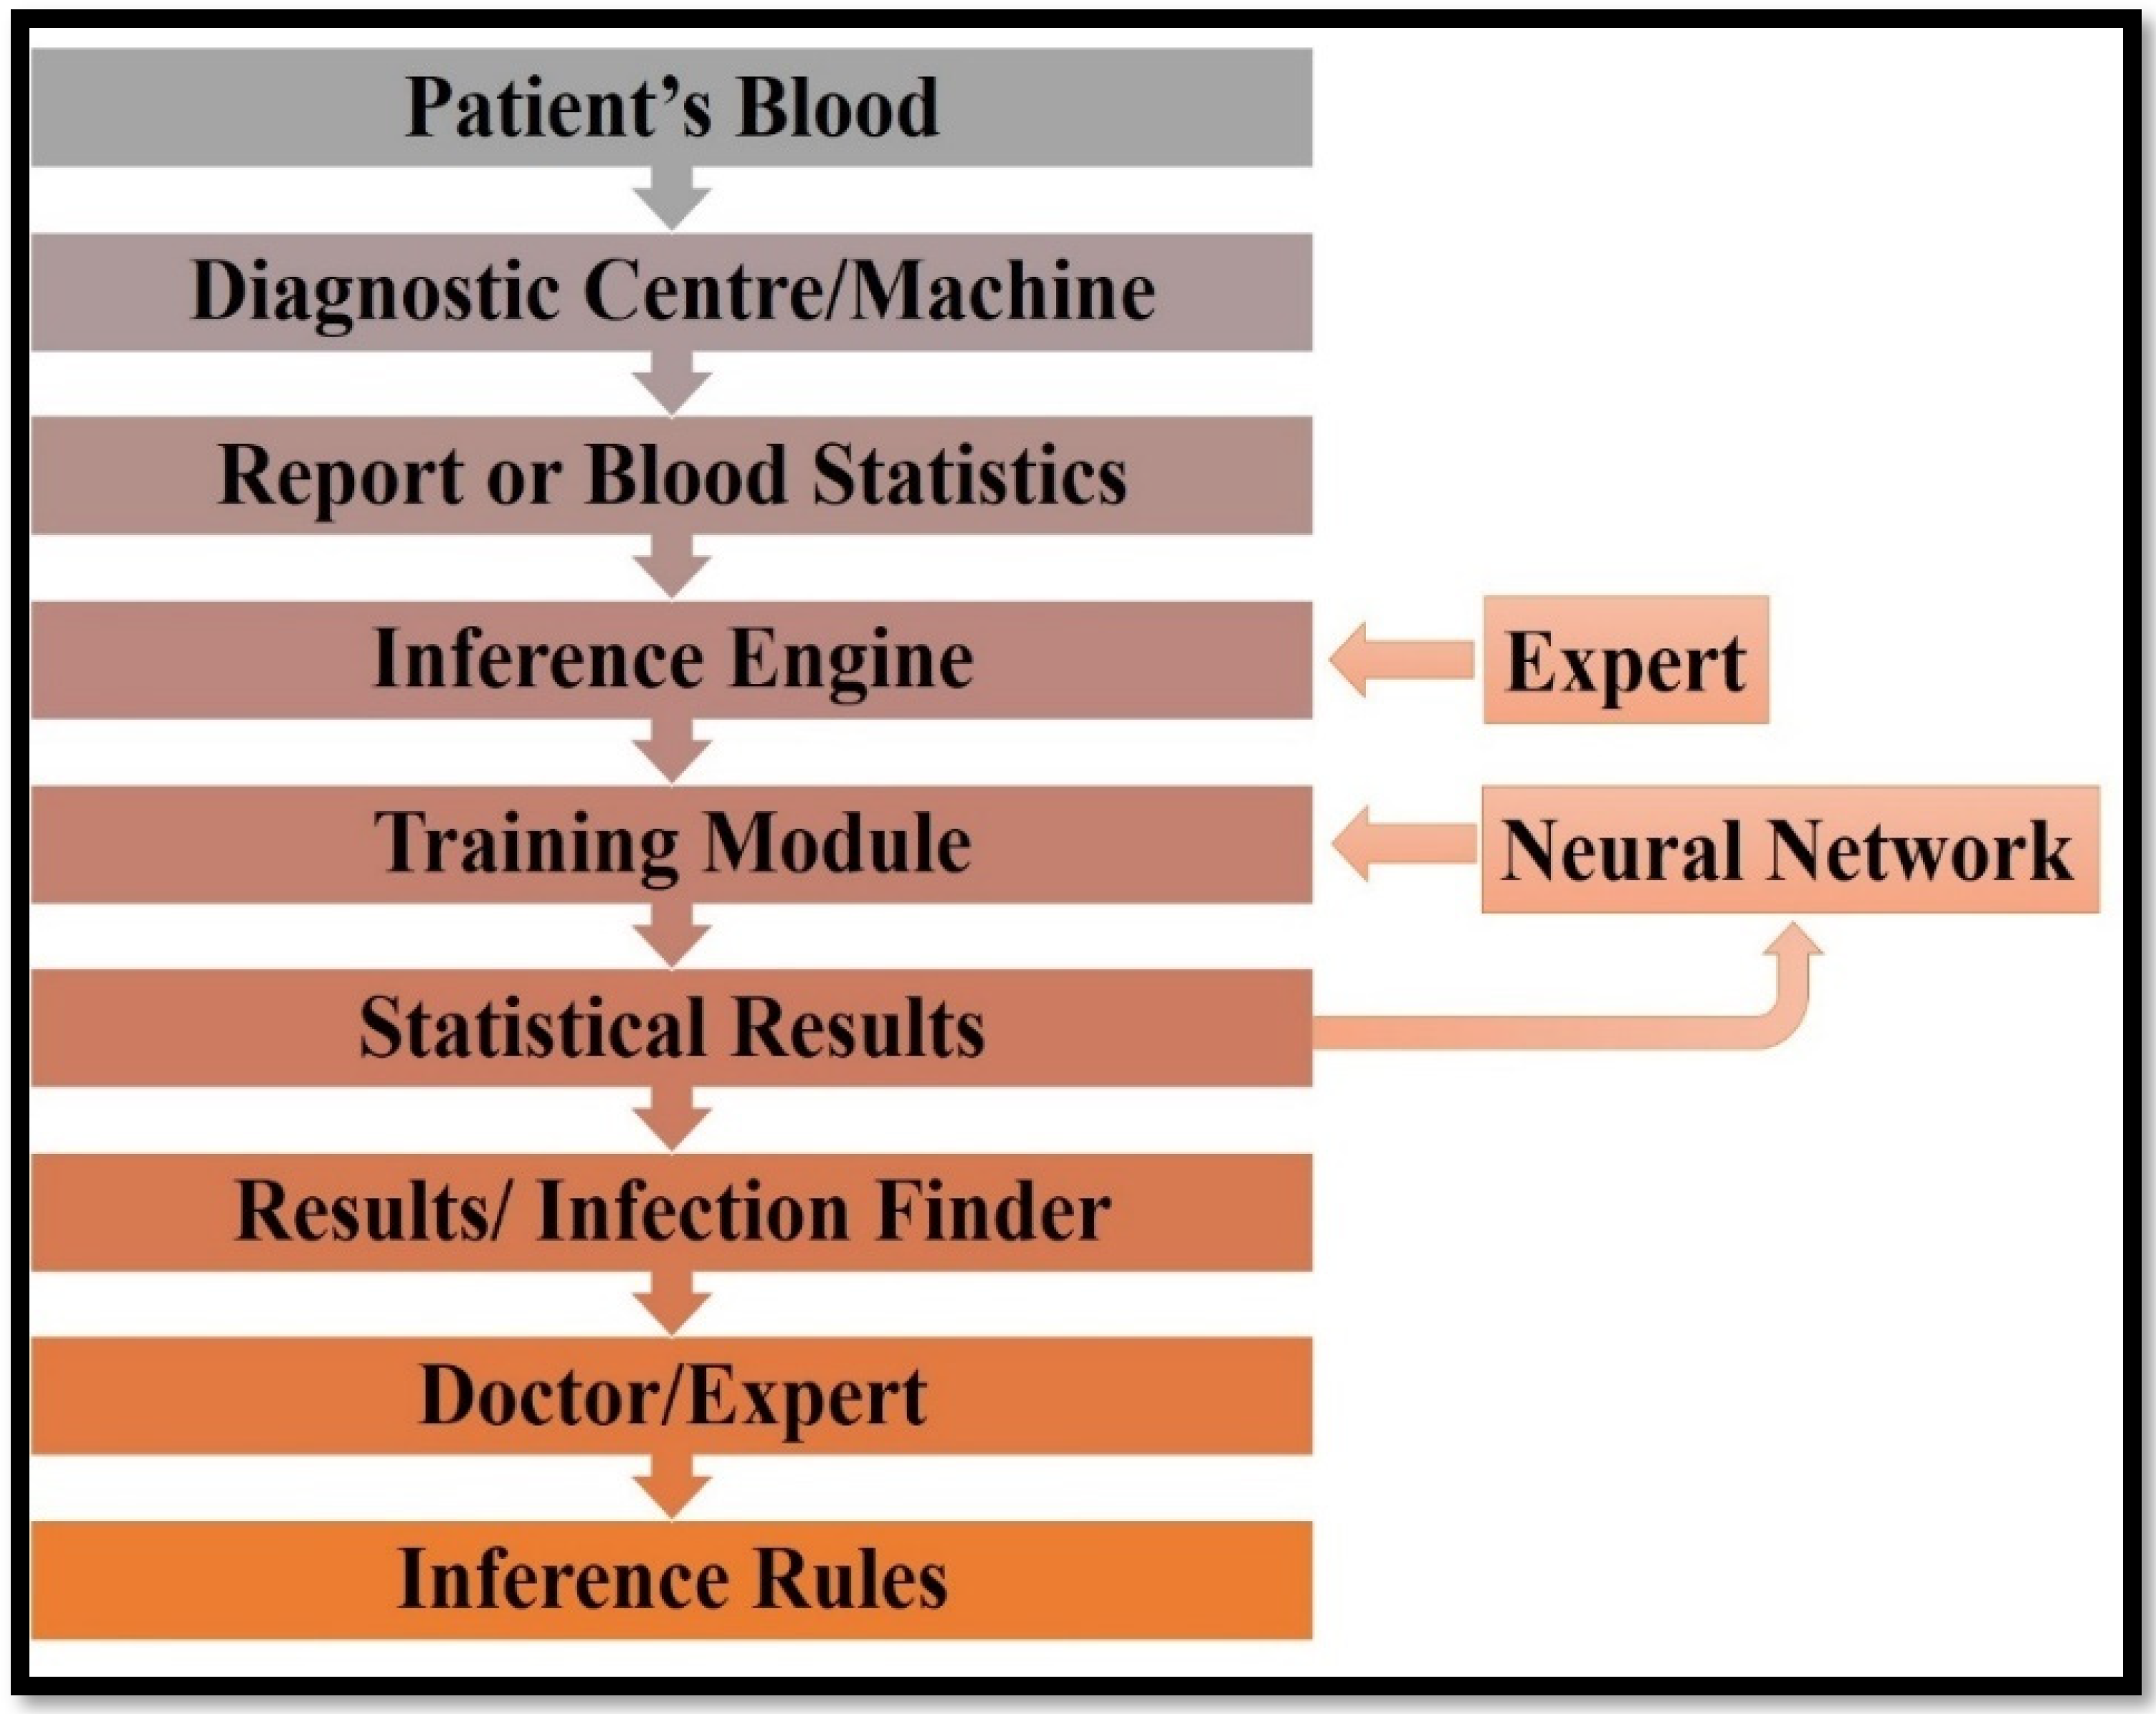
3. Proposed Work
Fuzzy Logic Algorithm
| Algorithm 1. Pseudocode. |
| Input: Blood Report |
| Output: Abstracted summary with infection and treatment |
| Steps to perform: |
| 1. Perform pre-processing to convert input values into readable values and reduce the dimensionality. |
| 2. Extract the major features from the input values and match the input value with respect to the ideal parameter range, and treat this as an outcome (1). |
| 3. Use the fuzzy inference system rules on the outcome values (1). |
| 4. Based on the scores and the ANFIS model, the prediction of blood infection is considered as the outcome (2). |
| 5. Check the outcome (2) and apply the Neuro-fuzzy system to get the appropriate treatment from experts’ databases; this treatment string is considered as the outcome (3). |
| 6. The obtained values (2) and (3) are shown to the users on the interface as the final output. |
| Algorithm 2. Blood Infection Algorithm. |
|
4. Implementation
- MainActivity.java
- ○
- MainActivity
- ○
- Fuzzylogic()
- MedihelpDatabase.java
- AndroidMenifest.xml
- ○
- Manifest
- ○
- Application
- ○
- Activity_main.xml
- ○
- Linearlayout
- ○
- Scrollview
- utility.java
- ○
- Utility (parameters/range)
- colours.xml
- ○
- Resources
- ○
- colors
- main_menu.xml
- Translation editor
- Bloodsample.java
- ○
- BloodSample
4.1. Components of Complete Blood Count
4.1.1. Haemoglobin (HB)
4.1.2. Red Blood Cells (RBC)
4.1.3. Platelet Count (PC)
4.1.4. Hematocrit Value (HCT)
4.1.5. Mean Corpuscular Vol. Mass (MCV)
4.1.6. Mean Corpuscular Haemoglobin (MCH)
4.1.7. Mean Corpuscular Haemoglobin Concentration (MCHC)
4.1.8. Red Blood Cell Distribution width (RDW-CV)
4.1.9. Blood Sugar (BS)

| Parameters | Input Values of Sample 1 | Ideal Range | Disease | Treatment | Expert |
|---|---|---|---|---|---|
| HB | 6.5 (L) | 13.5 to 17.5 | Vitamin (B12) | Injection (B12) | (V) |
| RBC | 1.8 (L) | 3.5 to 6.5 | |||
| PC | 180 (N) | 150 to 450 | |||
| HCT | 19.5 (V.L.) | 35 to 54 | |||
| MCV | 109.6 (H) | 76 to 96 | |||
| MCH | 36.5 (H) | 27 to 32 | |||
| MCMC | 33.3 (N) | 30.5 to 34.5 | |||
| RDW-CV | 17.0 (H) | 11 to 16 | |||
| BS | 101.4 (N) | 70 to 150 |
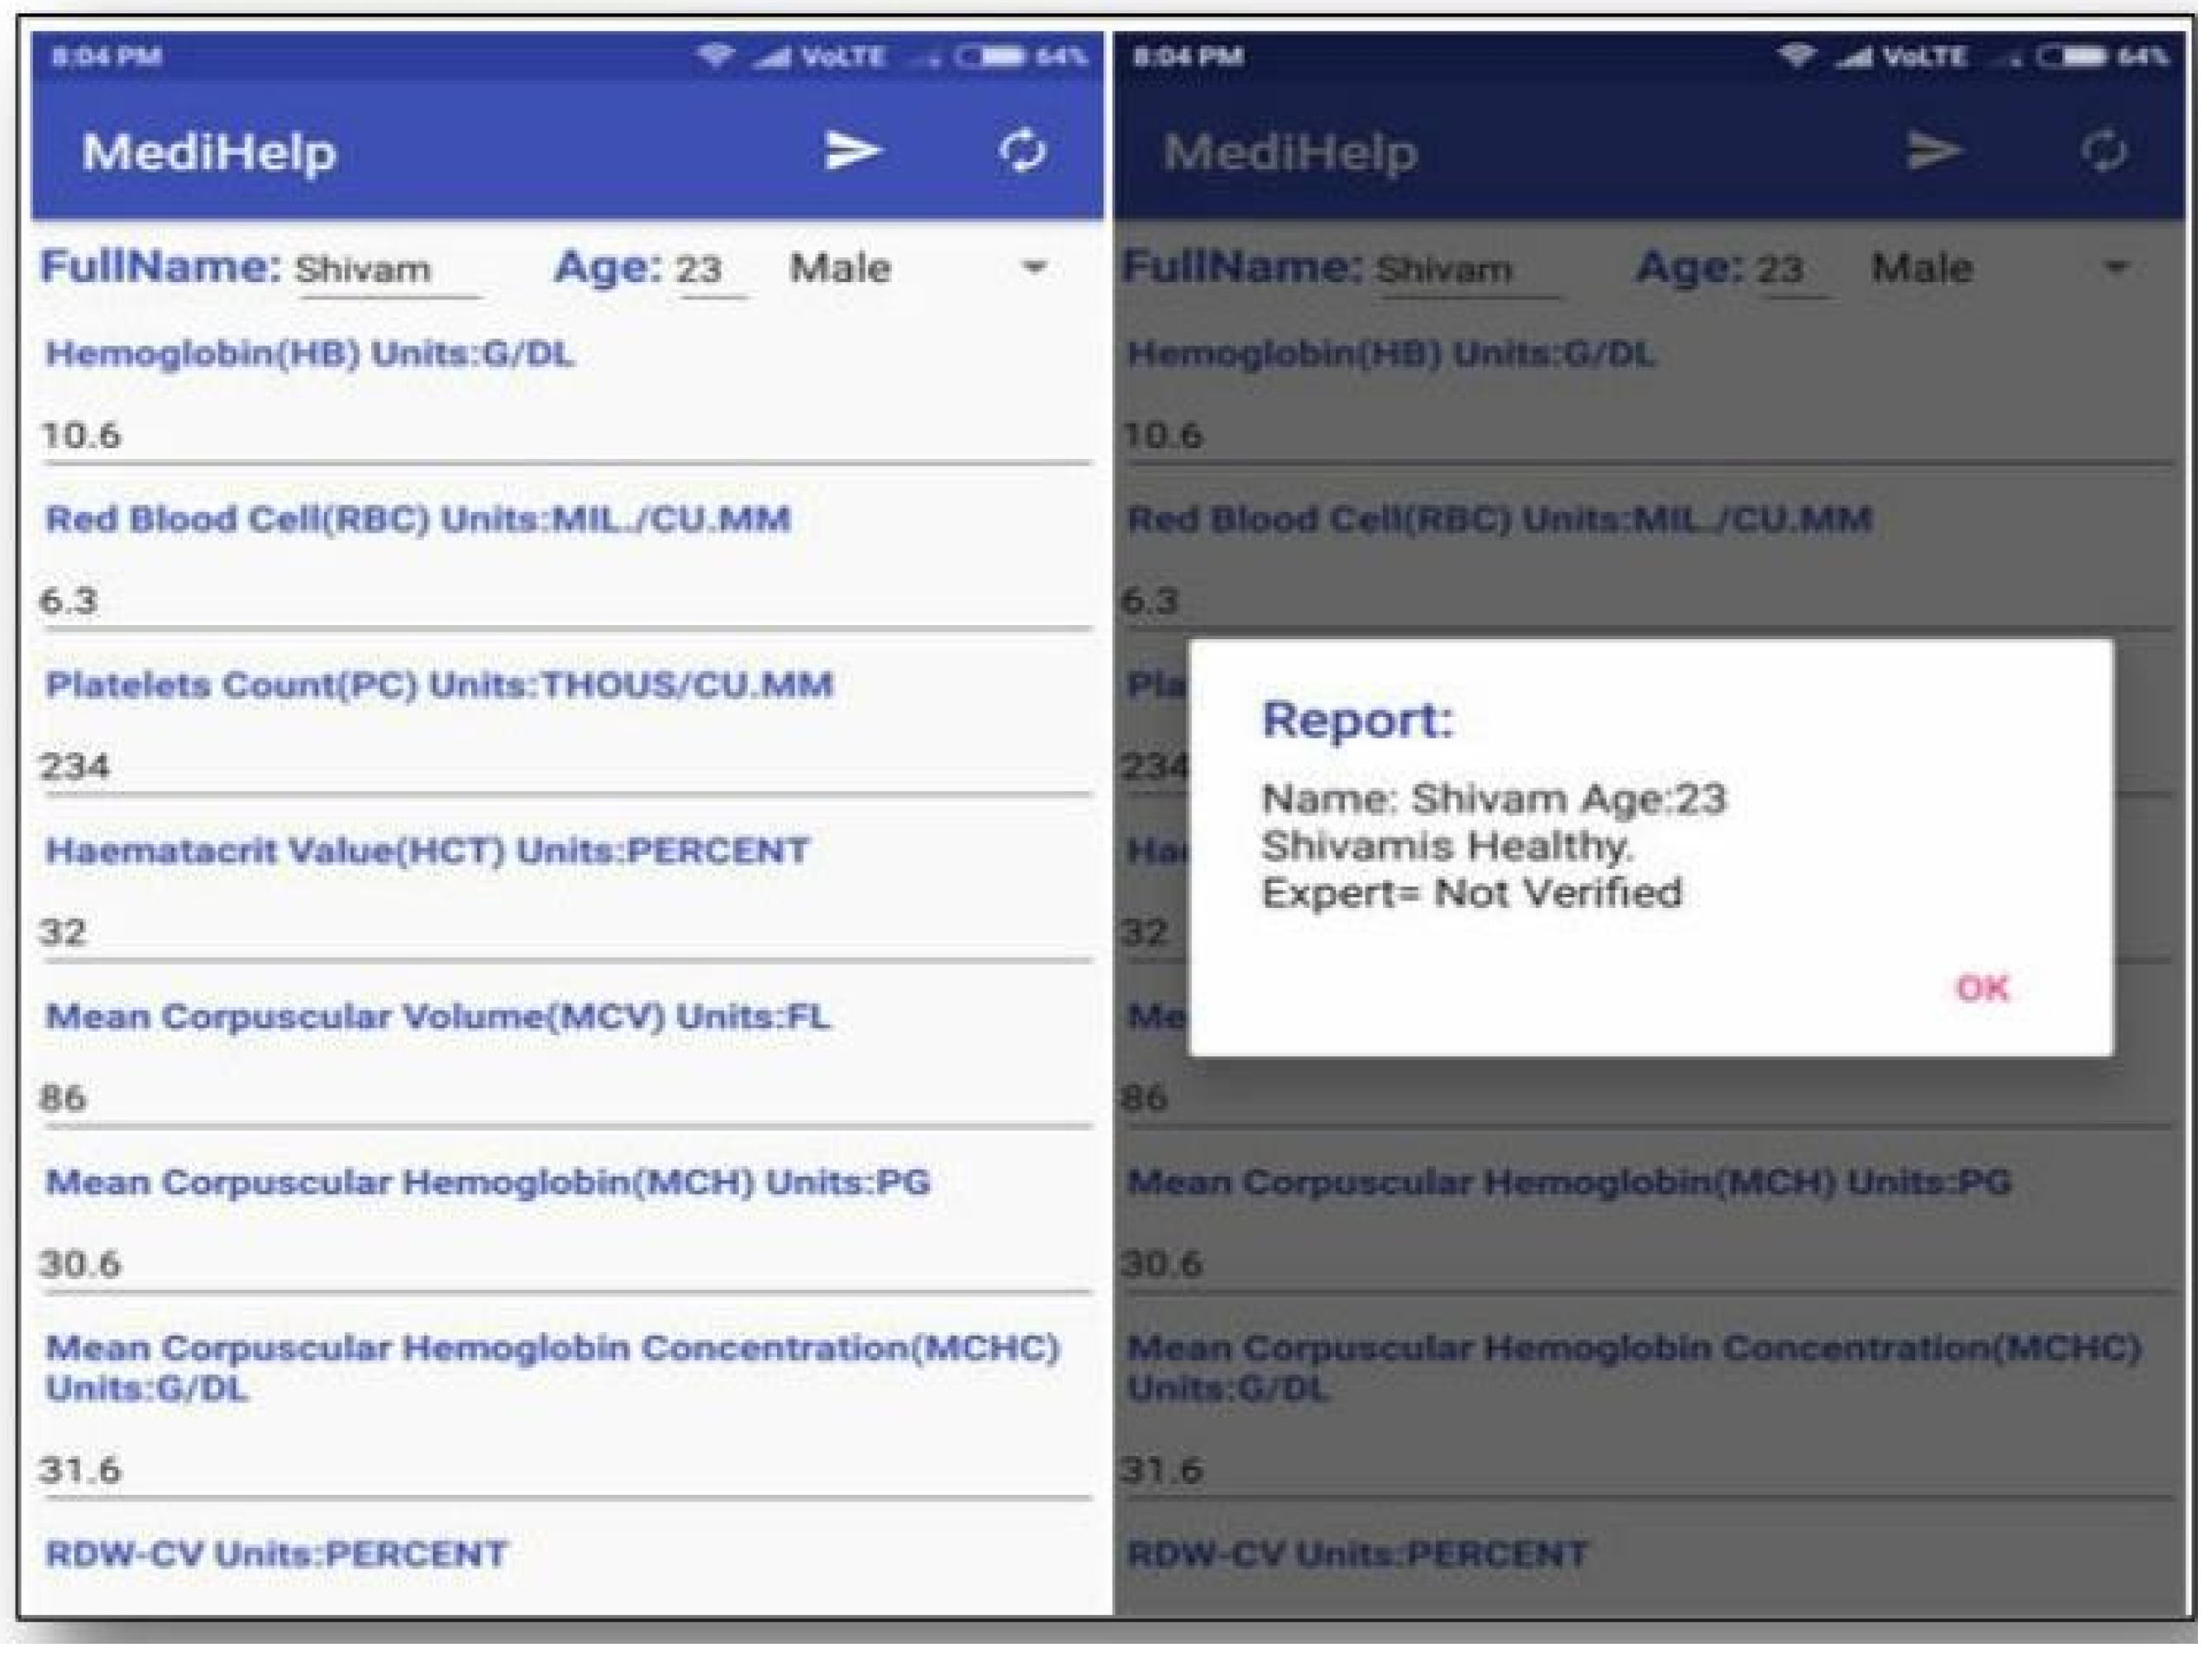
| Parameters | Input Values of Sample 1 | Ideal Range | Disease | Treatment | Expert |
|---|---|---|---|---|---|
| HB | 14.9 (N) | 13.5 to 17.5 | Healthy | (V) | |
| RBC | 4.25 (N) | 3.5 to 6.5 | |||
| PC | 305 (N) | 150 to 450 | |||
| HCT | 33.6 (L) | 35 to 54 | |||
| MCV | 95.5 (N) | 76 to 96 | |||
| MCH | 31.0 (N) | 27 to 32 | |||
| MCMC | 31.50 (N) | 30.5 to 34.5 | |||
| RDW-CV | 16.5 (H) | 11 to 16 | |||
| BS | 121 (N) | 70 to 150 |
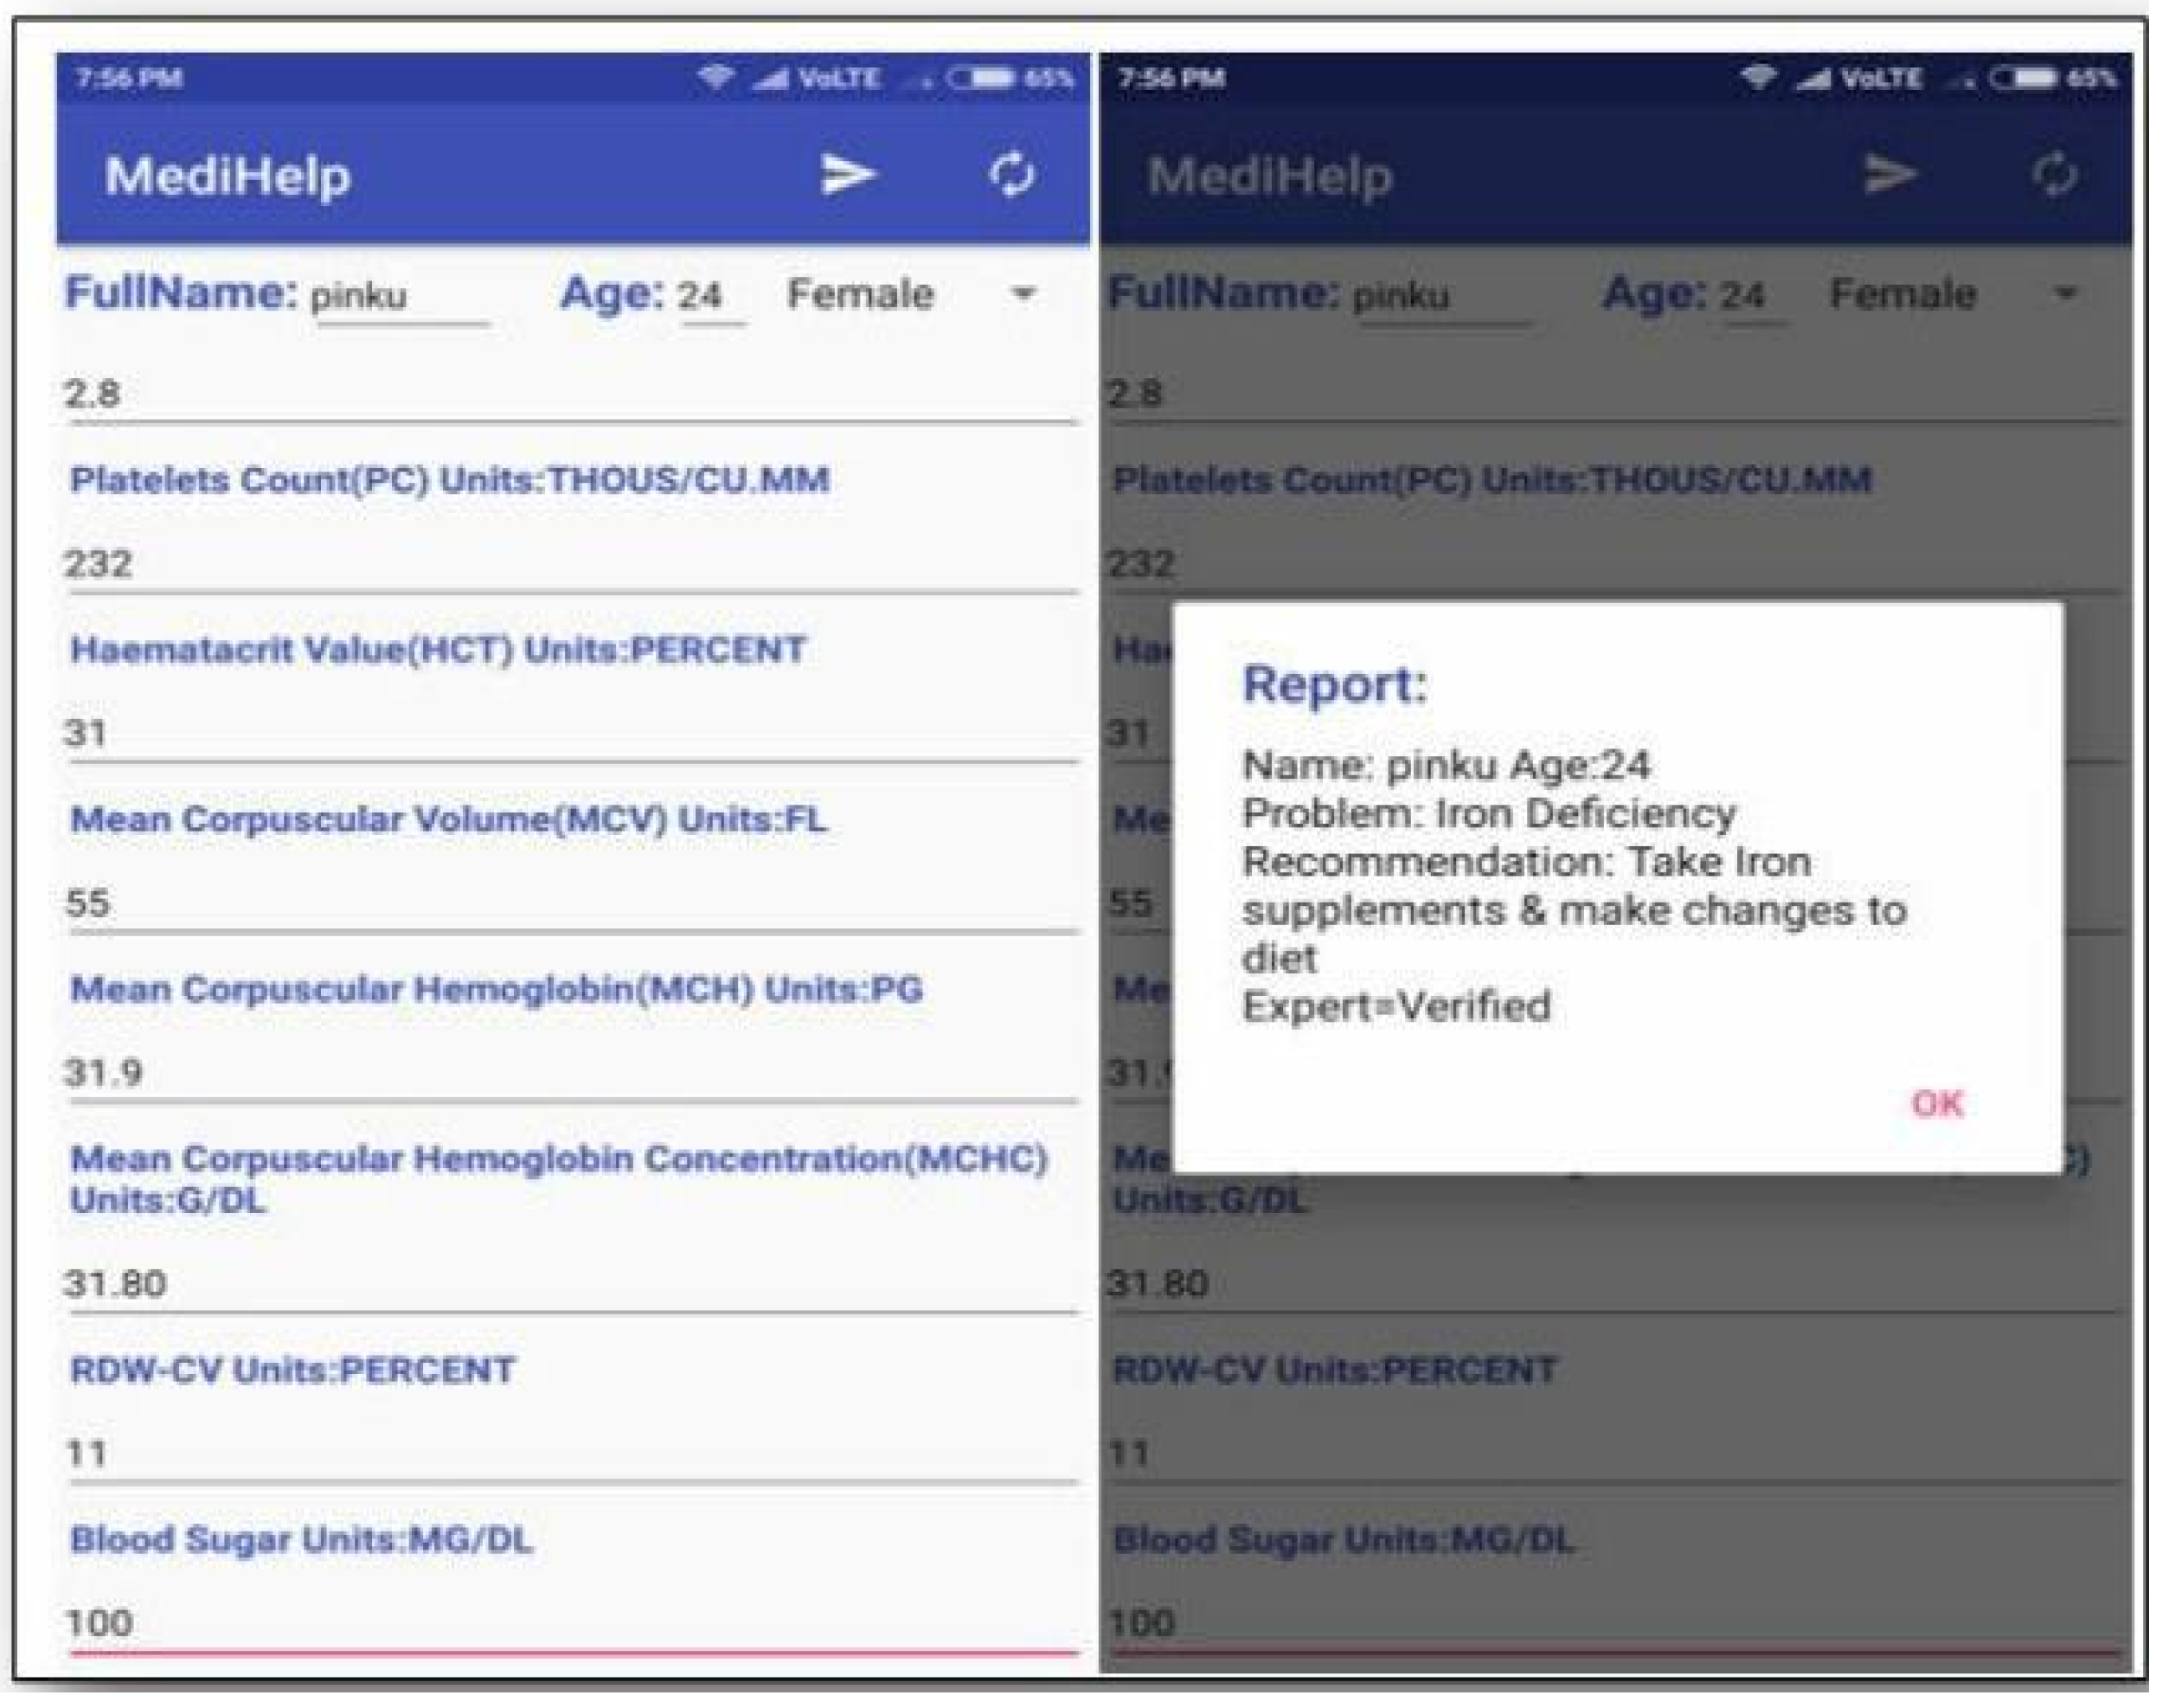
| Parameters | Input Values of Sample 1 | Ideal Range | Disease | Treatment | Expert |
|---|---|---|---|---|---|
| HB | 10.1 (L) | 13.5 to 17.5 | Iron Deficiency | Iron Supplement | (V) |
| RBC | 2.8 (L) | 3.5 to 6.5 | |||
| PC | 232 (N) | 150 to 450 | |||
| HCT | 31 (L) | 35 to 54 | |||
| MCV | 55 (V.L.) | 76 to 96 | |||
| MCH | 31.9 (N) | 27 to 32 | |||
| MCMC | 31.8 (N) | 30.5 to 34.5 | |||
| RDW-CV | 11.0 (N) | 11 to 16 | |||
| BS | 91 (N) | 70 to 150 |
| Parameters | Input Values of Sample 1 | Ideal Range | Disease | Treatment | Expert |
|---|---|---|---|---|---|
| HB | 11.2 (L) | 13.5 to 17.5 | Blood Cancer | Chemo-Therapy | (V) |
| RBC | 4.92 (N) | 3.5 to 6.5 | |||
| PC | 365 (N) | 150 to 450 | |||
| HCT | 36.8 (N) | 35 to 54 | |||
| MCV | 74.8 (L)) | 76 to 96 | |||
| MCH | 22.8 (L) | 27 to 32 | |||
| MCMC | 30.60 (N) | 30.5 to 34.5 | |||
| RDW-CV | 14.7 (N) | 11 to 16 | |||
| BS | 128.4 (N) | 70 to 150 |
4.2. Fuzzy Inference System
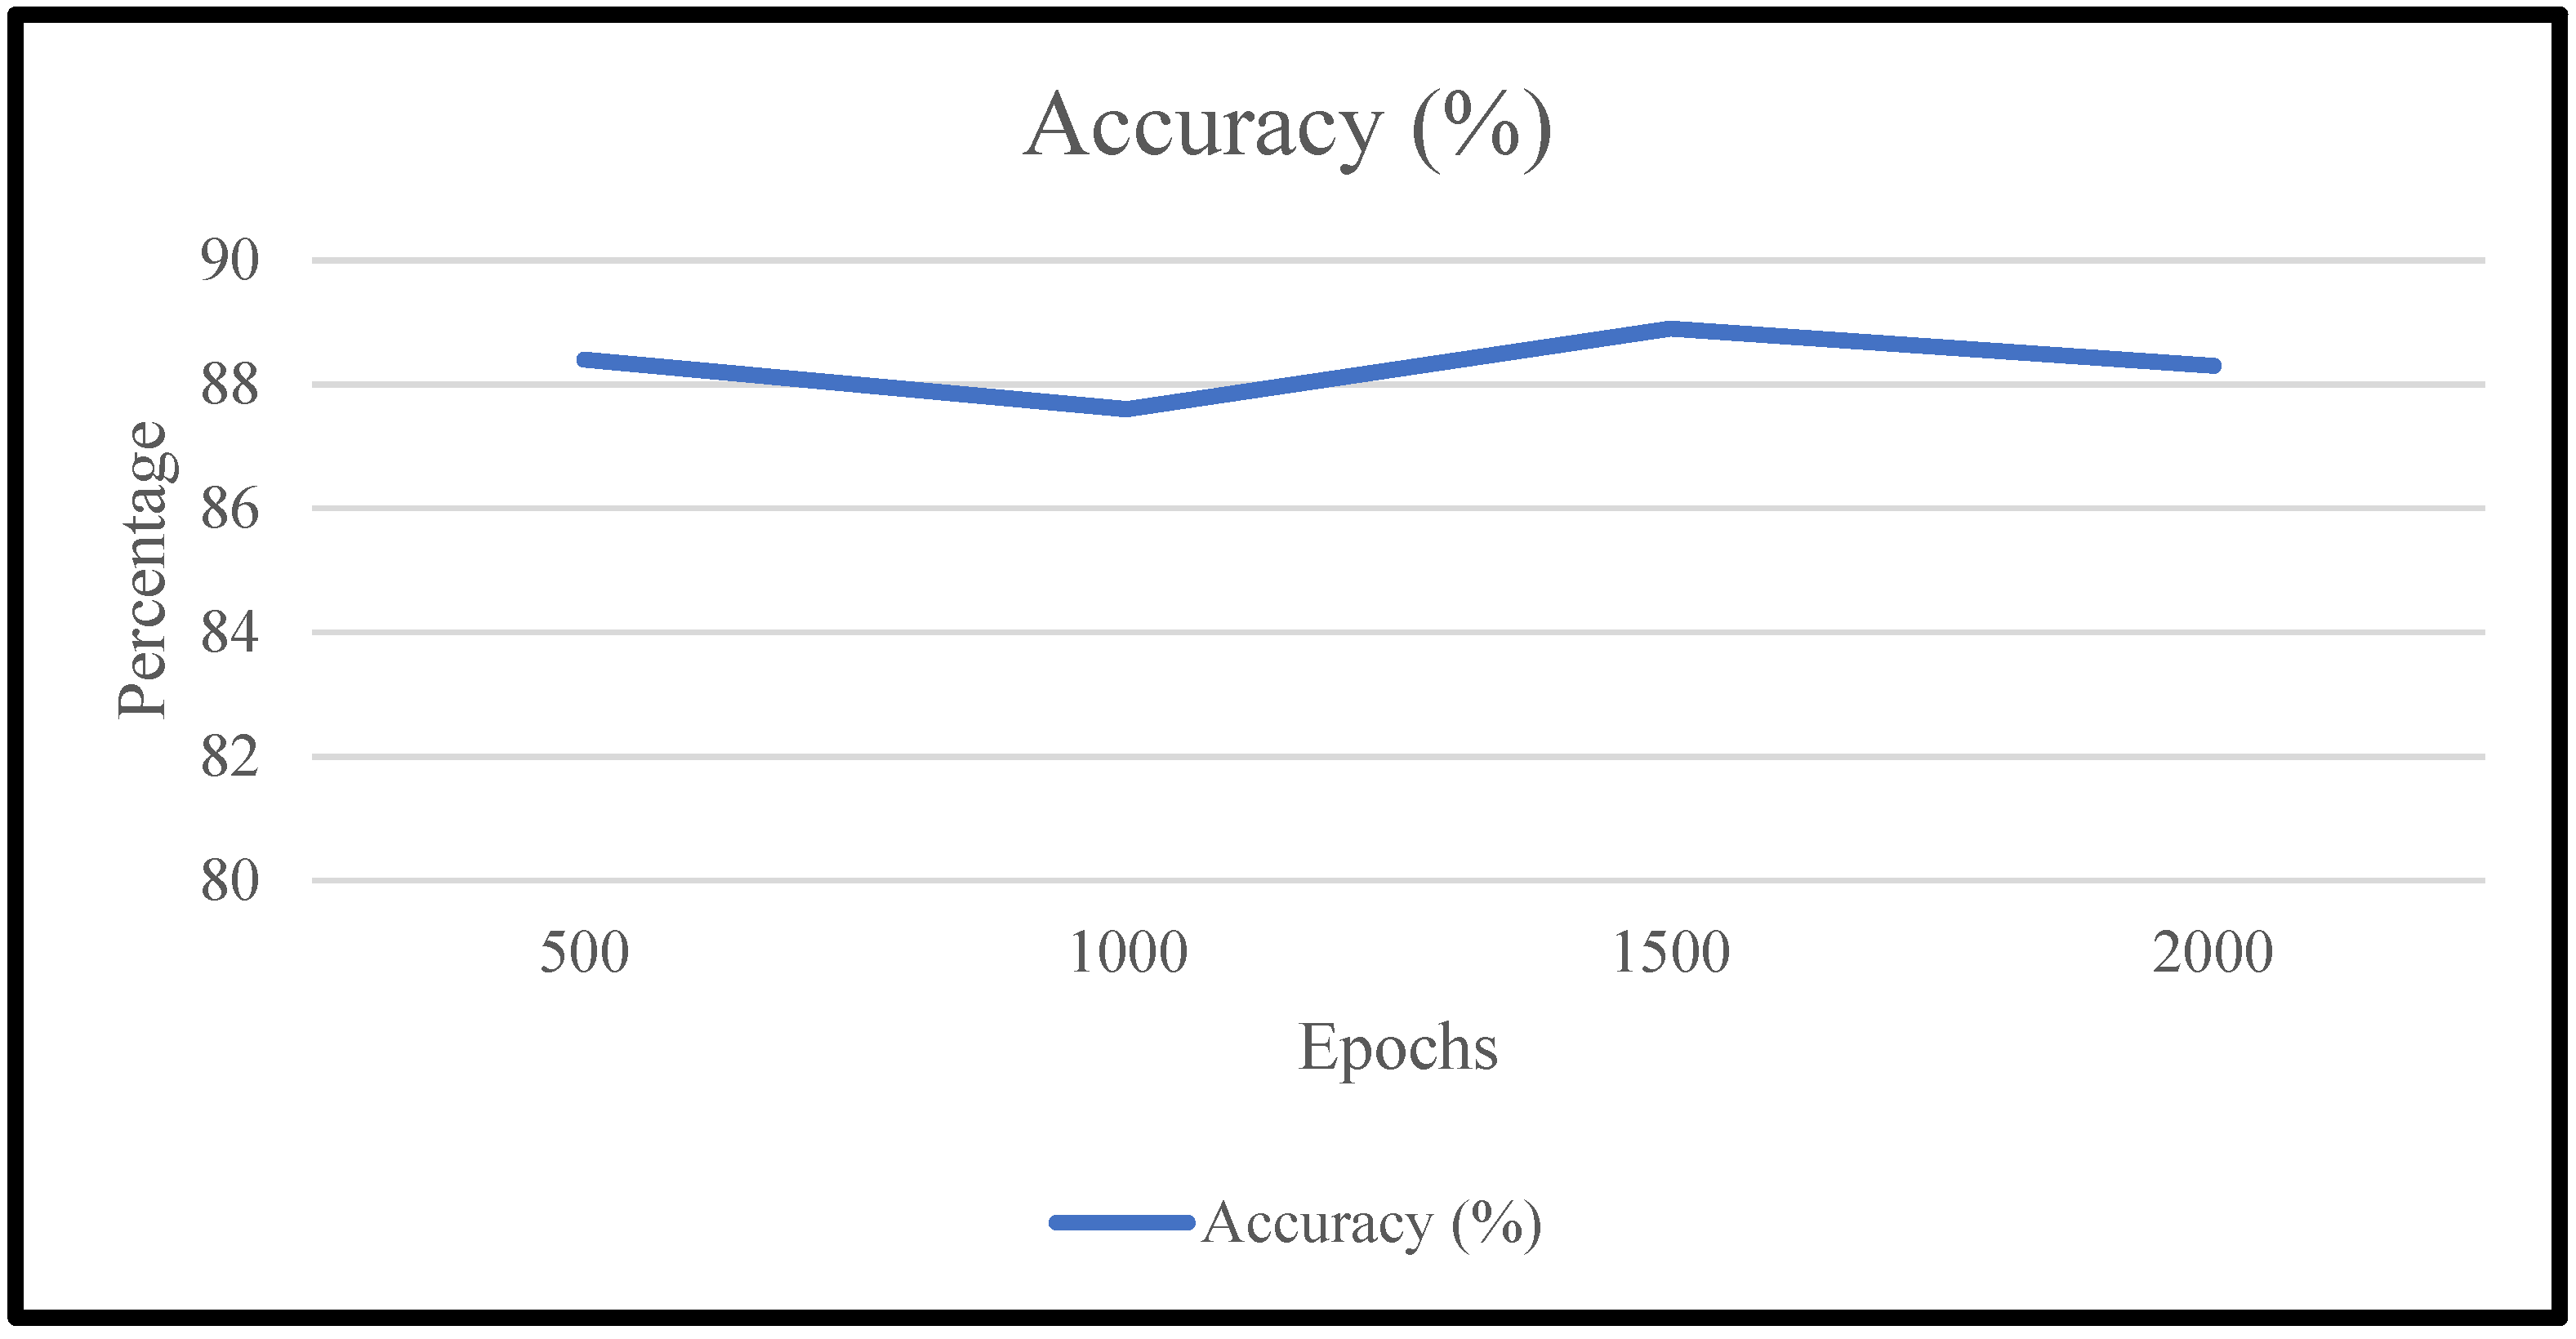
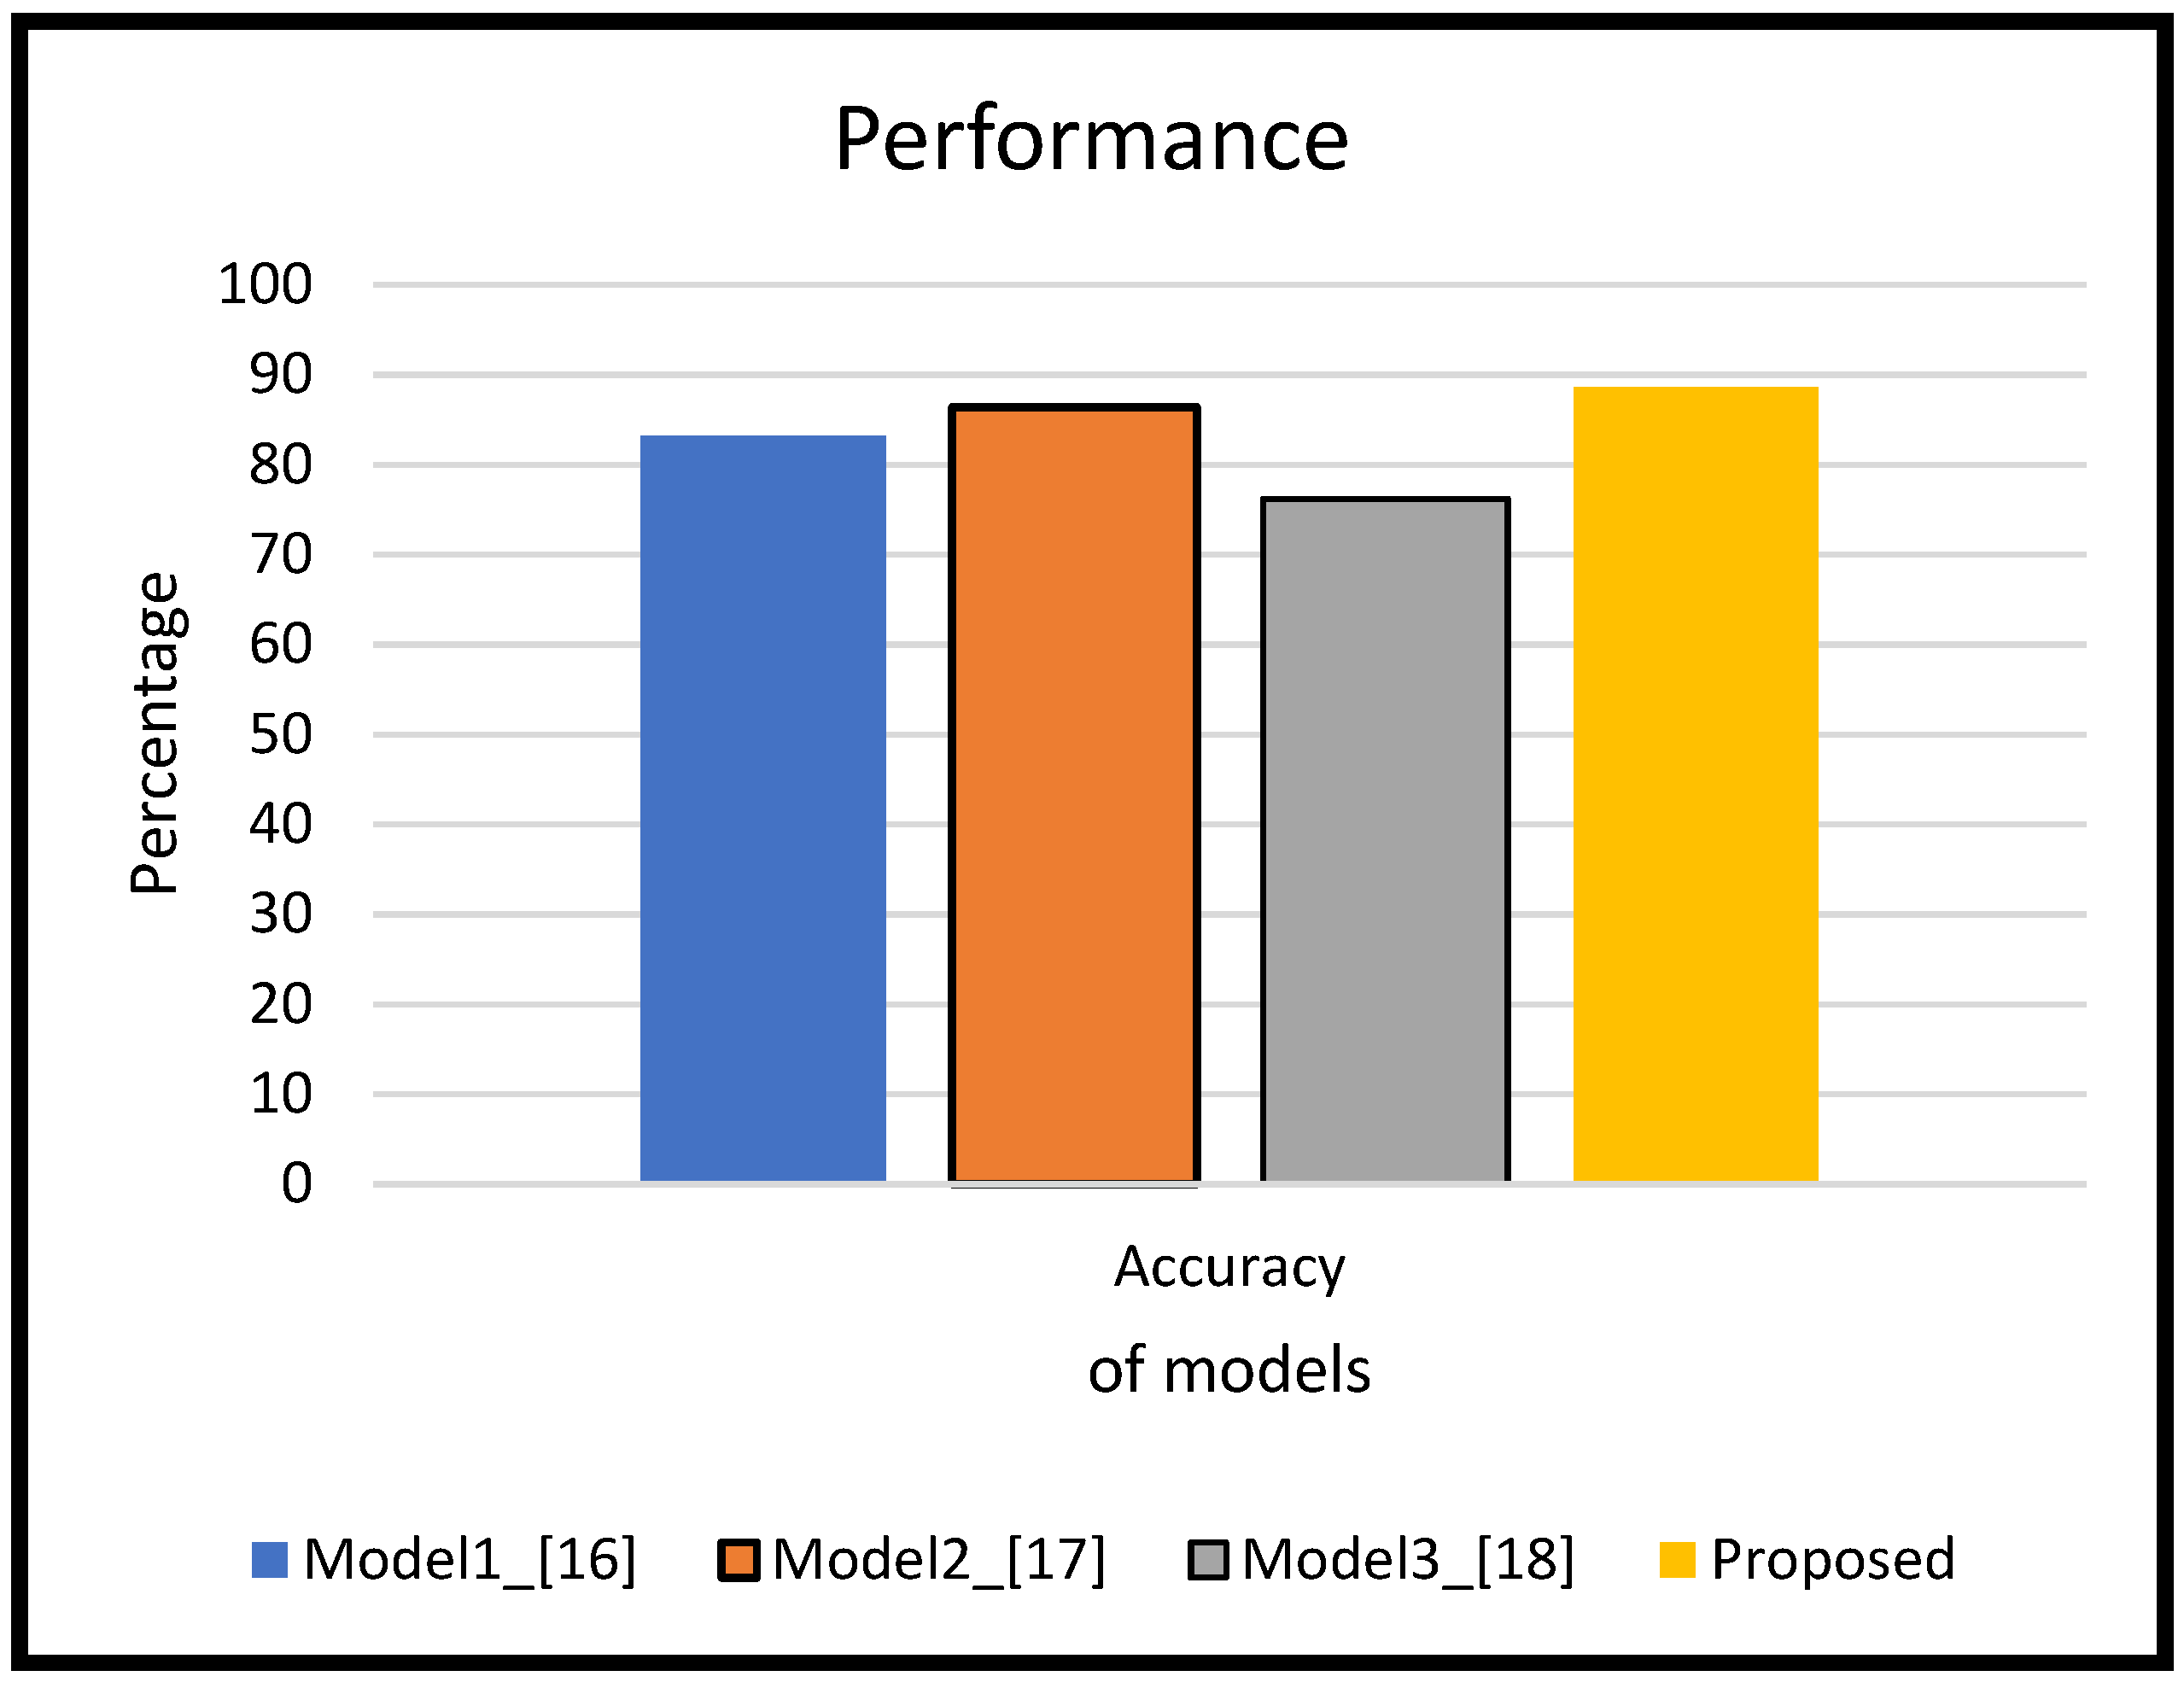
5. Results and Discussion
- If the input value is greater than the range
- If the input value is lesser than the range
- If the input value is in between the range
Range Limit of Linguistic Variables and the Corresponding of Input Data
6. Conclusions
Author Contributions
Funding
Data Availability Statement
Conflicts of Interest
References
- Ferraz, A.; Brito, J.H.; Carvalho, V.; Machado, J. Blood type classification using computer vision and machine learning. Neural Comput. Appl. 2017, 28, 2029–2040. [Google Scholar] [CrossRef]
- Vellido, A. The importance of interpretability and visualization in machine learning for applications in medicine and health care. Neural Comput. Appl. 2020, 32, 18069–18083. [Google Scholar] [CrossRef]
- Dong, N.; Zhai, M.; Chang, J.; Wu, C. A self-adaptive approach for white blood cell classification towards point-of-care testing. Appl. Soft Comput. 2021, 111, 107709. [Google Scholar] [CrossRef]
- Atakorah, E.A.; Afranie, B.O.; Addy, K.D.; Sarfo, A.D.; Okyere, B.A. Assessment of intestinal and blood protozoan infections among pregnant women visiting ante-natal care at Tafo Hospital, Ghana. Heliyon 2022, 8, e09968. [Google Scholar] [CrossRef]
- Okaba, K.; Motomura, A.; Horioka, K.; Inokuchi, G.; Chiba, F.; Hoshioka, Y.; Saito, N.; Makino, Y.; Torimitsu, S.; Yamaguchi, R.; et al. Prevalence of blood-borne infections in forensic samples: Epidemiology in areas of Chiba, Japan. J. Forensic Leg. Med. 2022, 90, 102396. [Google Scholar] [CrossRef]
- Toğaçar, M.; Ergen, B.; Cömert, Z. Classification of white blood cells using deep features obtained from Convolutional Neural Network models based on the combination of feature selection methods. Appl. Soft Comput. 2020, 97 Pt B, 106810. [Google Scholar] [CrossRef]
- Lu, Y.; Qin, X.; Fan, H.; Lai, T.; Li, Z. WBC-Net: A white blood cell segmentation network based on UNet++ and ResNet. Appl. Soft Comput. 2021, 101, 107006. [Google Scholar] [CrossRef]
- Shortliffe, E. MYCIN Expert System. Available online: http://www.it.bton.ac.uk/staff/lp22/cs237medicalxSys.html1970s (accessed on 2 March 2022).
- Alshaban, S.; Taher, A.K. Building a Proposed Expert System Used by Blood. Available online: http://www.academicjournal.org/JETR (accessed on 23 December 2021).
- Congiliaro, N.; Disletano, A.; Mirabella, O. An Expert System for Medical Diagnosis. Available online: http://Ieeexplore.ieee.org/document/5450/ (accessed on 11 February 2022).
- Khan, I.V.; Zope, P.; Suralkon, S.R. Importance of ANN in Medical Diagnose Disease Like Acute Nephrities & Heart Disease. Available online: http://www.ijesit.com/vol%202/issue%202/IJESIT201302-33.pdf (accessed on 11 February 2022).
- Mahajan, S.; Shrivastava, G. Effective Diagnosis of Disease through Symptoms Using AI & NN. Int. J. Eng. Res. Appl. (IJERA) 2013, 3, 2229–2231. [Google Scholar]
- Mankad, K.B. Design of Genetic-Fuzzy Based Diagnostic System to identify Chikungunya. Int. Res. J. Eng. Technol. (IRJET) 2015, 2, 153–161. [Google Scholar]
- Yao, C.; Qu, Y.; Jin, B.; Guo, L.; Li, C.; Cui, W.; Feng, L. A Convolutional Neural Network Model for Online Medical Guidance. Volume 4. 2016. Available online: https://www.ieee.org/publications_standards/publications/rights/index.html (accessed on 21 December 2021).
- Singh, A.; Singh, S.; Samson, P. Recommender system for the Detection and the prevention of Dengue. Int. J. Curr. Res. 2010 2017, 9, 1–8. [Google Scholar]
- Tiwari, P.; Qian, J.; Li, Q.; Wang, B.; Gupta, D.; Khanna, A.; Rodrigues, J.J.P.C.; de Albuquerque, V.H.C. Detection of subtype blood cells using deep learning. Cogn. Syst. Res. 2018, 52, 1036–1044. [Google Scholar] [CrossRef]
- Ansari, S.; Shafi, I.; Ansari, A.; Ahmad, J.; Shah, S.I. Diagnosis of Liver Disease Induced by Hepatitis Virus Using Artificial Neural Networks. In Proceedings of the 2011 IEEE 14th International Multitopic Conference, Karachi, Pakistan, 22–24 December 2011. [Google Scholar] [CrossRef]
- Filimon, D.; Albu, A. Skin Disease Diagnosis using Artificial Neural Network. In Proceedings of the 2014 IEEE 9th IEEE International Symposium on Applied Computational Intelligence and Informatics (SACI), Timisoara, Romania, 15–17 May 2014. [Google Scholar] [CrossRef]
- Khodaei-mehr, J.; Tangestanizadeh, S.; Vatankhah, R.; Sharifi, M. ANFIS-Based Optimal Control of Hepatitis C virus epidemic. IFAC-PapersOnLine 2018, 51, 539–544. [Google Scholar] [CrossRef]
- Ayangbekun, O.J.; Bankole, F.O. An Expert System for Diagnoses of Blood Disorder. Int. J. Comput. Appl. 2014, 100, 36–40. [Google Scholar]
- Khurshid, Z.; Warsi, I.; Moin, S.F.; Slowey, P.D.; Latif, M.; Zohaib, S.; Zafar, M.S. Biochemical analysis of oral fluids for disease detection. Adv. Clin. Chem. 2021, 100, 205–253. [Google Scholar] [CrossRef]
- Gour, N.; Khanna, P. Multi-class multi-label ophthalmological disease detection using transfer learning based convolutional neural network. Biomed. Signal Process. Control 2021, 66, 102329. [Google Scholar] [CrossRef]
- Tsai, I.C.; Mayo, L.M.; Jones, B.W.; Stone, A.E.; Janse, S.A.; Bewley, J.M. Precision dairy monitoring technologies use in disease detection: Differences in behavioural and physiological variables measured with precision dairy monitoring technologies between cows with or without metritis, hyperketonemia, and hypocalcemia. Livest. Sci. 2021, 244, 104334. [Google Scholar] [CrossRef]
- Hawley, A. Fuzzy nets: Fuzzy logic and neural networks. In Proceedings of the IJCNN’01. International Joint Conference on Neural Networks. Proceedings (Cat. No.01CH37222), Washington, DC, USA, 15–19 July 2001; Volume 1, pp. 544–546. [Google Scholar] [CrossRef]
- Khatter, H.; Aggarwal, V. Efficient parallel processing by improved CPU-GPU interaction. In Proceedings of the 2014 International Conference on Issues and Challenges in Intelligent Computing Techniques (ICICT), Ghaziabad, India, 7–8 February 2014; pp. 159–161. [Google Scholar] [CrossRef]
- Aggarwal, N.; Kumar, A.; Khatter, H.; Aggarwal, V. Analysis the effect of Data Mining Techniques on Database. Int. J. Adv. Eng. Softw. 2012, 47, 164–169. [Google Scholar] [CrossRef]
- Aggarwal, S.; Aggarwal, J. Neural Network Techniques for Cancer Prediction: A Survey. Procedia Comput. Sci. 2015, 60, 769–774. [Google Scholar] [CrossRef]
- Jangra, A.; Rajput, P.; Dwivedi, D.K.; Lahkar, M. Amelioration of Repeated Restraint Stress-Induced Behavioral Deficits and Hippocampal Anomalies with Taurine Treatment in Mice. Neurochem. Res. 2020, 45, 731–740. [Google Scholar] [CrossRef]
- Gupta, S.P.; Patil, V.M. Recent Studies on Design and Development of Drugs against Alzheimer’s Disease (AD) Based on Inhibition of BACE-1 and Other AD-causative Agents. Curr. Top Med. Chem. 2020, 20, 1195–1213. [Google Scholar] [CrossRef] [PubMed]
- Al-ali, A.; Elharrouss, O.; Qidwai, U.; Al-Maaddeed, S. ANFIS-Net for automatic detection of COVID-19. Sci. Rep. 2021, 11, 17318. [Google Scholar] [CrossRef]
- Islam, M.M.; Karray, F.; Alhajj, R.; Zeng, J. A Review on Deep Learning Techniques for the Diagnosis of Novel Coronavirus (COVID-19). IEEE Access 2021, 9, 30551–30572. [Google Scholar] [CrossRef]
- Nilashi, M.; Ahmadi, H.; Shahmoradi, L.; Ibrahim, O.; Akbari, E. A predictive method for hepatitis disease diagnosis using ensembles of neuro-fuzzy technique. J. Infect. Public Health 2019, 12, 13–20. [Google Scholar] [CrossRef]
- Juneja, A.; Juneja, S.; Kaur, S.; Kumar, V. Predicting Diabetes Mellitus with Machine Learning Techniques Using Multi-Criteria Decision Making. Int. J. Inf. Retr. Res. 2021, 11, 38–52. [Google Scholar] [CrossRef]
- Rashid, J.; Batool, S.; Kim, J.; Wasif Nisar, M.; Hussain, A.; Juneja, S.; Kushwaha, R. An Augmented Artificial Intelligence Approach for Chronic Diseases Prediction. Front. Public Health 2022, 10, 860396. [Google Scholar] [CrossRef]
- Padmavathy, T.V.; Vimalkumar, M.N.; Bhargava, D.S. Adaptive clustering based breast cancer detection with ANFIS classifier using mammographic images. Clust. Comput. 2019, 22, 13975–13984. [Google Scholar] [CrossRef]
- Tokachichu, J.; Gaddam, T.R.D. Performance analysis of a transmission line connected with UPFC designed with three level cascaded H bridge inverter with generalized SVM technique using PI, FUZZY LOGIC, ANN and ANFIS controllers. Mater. Today Proc. 2022, 51 Pt 1, 1243–1251. [Google Scholar] [CrossRef]
- Zhang, Z.; Peng, B.; Luo, C.; Tai, C. ANFIS-GA system for three-dimensional pulse image of normal and string-like pulse in Chinese medicine using an improved contour analysis method. Eur. J. Integr. Med. 2021, 42, 101301. [Google Scholar] [CrossRef]
- Behnood, A.; Golafshani, E.M.; Hosseini, S.M. Determinants of the infection rate of the COVID-19 in the U.S. using ANFIS and virus optimization algorithm (VOA). Chaos Solitons Fractals 2020, 139, 110051. [Google Scholar] [CrossRef]
- Zardkoohi, M.; Molaeezadeh, S.F. Long-term prediction of blood pressure time series using ANFIS system based on DKFCM clustering. Biomed. Signal Process. Control. 2022, 74, 103480. [Google Scholar] [CrossRef]
- Seifallahi, M.; Mehraban, A.H.; Khamseh, F.; Salehi, M.; Hajati, G.; Khansari, M.; Ahmadzadeh, M.; Babaie, M. Detection of mild cognitive Impairment from gait using Adaptive Neuro-Fuzzy Inference system. Biomed. Signal Process. Control. 2022, 71 Pt B, 103195. [Google Scholar] [CrossRef]
- Raghav, G.; Khatter, H. Intelligent Curation Fuzzy Inference System for Blood Infections in Android. In Proceedings of the IEEE 4th International Conference on Computational Intelligence & Communication Technology (CICT), Ghaziabad, India, 9–10 February 2018. [Google Scholar]
- Raghav, G.; Khatter, H. Blood Diagnostic Disease Using the Fuzzy Inference System and Neural Network. International Journal of Scientific Research in Computer Science. Eng. Inf. Technol. 2017, 2, 1–6. [Google Scholar]


| S.No | Author’s Name | Approaches | Advantages | Disadvantages | Still in Use |
|---|---|---|---|---|---|
| 1 | Edward et al. (1970) [8] | Backward Chaining, a Rule-based system | It provides accurate results | It is only for diagnoses of a few blood infections | Yes |
| 2 | Ayangbekun et al. (August 2014) [4] | Use as MYCIN, Caduceus | Suggest the cause based on symptoms | Limited database | No |
| 3 | Saad et al. (April 2009) [9] | Fuzzy system | Easy to use | No diagnostic | No |
| 4 | N.Congiliaro et al. (August 2002) [10] | FIS and rule-based | An automatic system that diagnoses based on rules | Few rules only | No |
| 5 | Irfan et al. (March 2013) [11] | Use for Heart disease and approach is CNN | Easy to use and scan | Limited Data set | Yes |
| 6 | Mahajan S. et al. (August 2013) [12] | Fuzzy Logic | This is only for specific disease | Not global, only for a particular disease | Yes |
| 7 | Bharat et al. (July 2015) [13] | Genetic algorithm | This identifies the disease of chikungunya and related fever | Prediction accuracy is 85% | Yes |
| 8 | Qu et al. (2016) [14] | Data mining and Rule-based algorithm | It reduces the cost, time, and energy | Only for remote areas | Yes |
| 9 | Singh et al. (July 2017) [15] | MYCIN and fuzzy logic | It helps to detect the Dengue | Specific disease only | Yes |
| 10 | Ferraz et al. (2017) [1] | Use of a Support vector machine to determine the blood compatibility | Prototypes are small in size, lightweight, easy transportation, ease of use, fast results, high reliability, and low cost | The system gives the result as Yes or No. No further membership or fuzzy value was generated. | Yes |
| 11 | Na Dong et al. (2021) [3] | Use of particle swarm optimisation support vector machine (PSO-SVM) classifier | 99.76% classification accuracy, which well demonstrates its effectiveness | Only for one parameter WBC | NO |
| 12 | Yan Lu et al. (2021) [7] | Use of ResNet and Fuzzy rules | Better results and classification | Only for one parameter WBC | NO |
| 13 | Prayag Tiwari et al. (2018) [16] | CNN is used on the blood images | Accuracy is more | Only used for the classification of blood cells | No |
| 14 | Kutlu et al. (2020) [17] | Based on the CNN version, Regional CNN. | Better in Comparison to other models | Only for White Blood Cells. | No |
| 15 | Balaji et al. (2021) [18] | Better on Catheter-Related Blood Stream Infection based on a survey of the patients after discharge. | Implemented on Real scenarios, i.e., hospitals | Only for the south Indian region | Yes |
| 16 | Emmanuel et al. (2022) [4] | Based on the study of intestinal and blood protozoans’ parasitic load and their risk factors which uses fuzzy rules | Taken dataset of the patients of Tafo Hospital, Ghana | Dataset corpus is less and has only three months of data | No |
| 17 | Keisuke Okaba et al. (2022) [5] | Based on the patient report and hepatitis types, i.e., HBV, HCV, HIV, HTLV, and TP, the work has concluded | Concluded the various combinations of blood-borne infections of the patients of Chiba, Japan | In the paper, only the cases prescribed by the doctors and autopsy cases are considered. | No |
| 18 | J.Khodaei-mehr et al. (2018) [19] | Used the ANFIS to train the coefficient and further applied the Genetic algorithm | The authors worked on 14 parameters and worked on the minute details. | The results are compared with the model which was published in 2014 and still performance is not good. | No |
| Parameters | Ideal Range | Units |
|---|---|---|
| HB | 13.5 to 17.5 | g/dL |
| RBC | 3.5 to 6.5 | million/c |
| PC | 150 to 450 | thous/mm3 |
| HCT | 35 to 54 | % |
| MCV | 76 to 96 | Fl |
| MCH | 27 to 32 | Pg |
| MCMC | 30.5 to 34.5 | g/dL |
| RDW-CV | 11 to 16 | % |
| BS | 70 to 150 | mg/dL |
| Input | Low | Very Low | Normal | High | Very High |
|---|---|---|---|---|---|
| HB | 13.5 > x ≥ (13.5 − 10) | X < (13.5 − 10) | 13.5 ≤ x ≤ 17.5 | 17.5 < x ≤ (17.5 + 10) | (17.5 + 10) < x |
| RBC | 3.5 > x ≥ (3.5 − 10) | X < (3.5 − 10) | 3.5 ≤ x ≤ 6.5 | 6.5 < x ≤ (6.5 + 10) | (6.5 + 10) < x |
| PC | 150 > x ≥ (150 − 10) | X < (150 − 10) | 150 ≤ x ≤ 450 | 450 < x ≤ (450 + 10) | (450 + 10) < x |
| HCT | 35 > x ≥ (35 − 10) | X < (35 − 10) | 35 ≤ x ≤ 54 | 54 < x ≤ (54 + 10) | (54 + 10) < x |
| MCV | 76 > x ≥ (76 − 10) | X < (76 − 10) | 76 ≤ x ≤ 96 | 96 < x ≤ (96 + 10) | (96 + 10) < x |
| MCH | 27 > x ≥ (27 − 10) | X < (27 − 10) | 27 ≤ x ≤ 32 | 32 < x ≤ (32 + 10) | (32 + 10) < x |
| MCMC | 30.5 > x ≥ (30.5 − 10) | X < (30.5 − 10) | 30.5 ≤ x ≤ 34.5 | 34.5 < x ≤ (34.5 + 10) | (34.5 + 10) < x |
| RDW-CV | 11 > x ≥ (11 − 10) | X < (11 − 10) | 11 ≤ x ≤ 16 | 16 < x ≤ (16 + 10) | (16 + 10) < x |
| BS | 70 > x ≥ (70 − 10) | X < (70 − 10) | 70 ≤ x ≤ 150 | 150 < x ≤ (150 + 10) | (150 + 10) < x |
| Parameters | Ideal-Range/Units | Input Formula | Input Value | Output Range |
|---|---|---|---|---|
| Haemoglobin | 13.5–17.5 g/dL | 13.5 > x ≥ (13.5 − 10) | 10.1 | Low |
| RBC | 3.5–6.5 mil/c | 3.5 > x ≥ (3.5 − 10) | 2.8 | Low |
| PC | 150–450 t/mm3 | 150 ≤ x ≤ 450 | 231 | Normal |
| HCT | 35–54% | 35 > x ≥ (35 − 10) | 31 | Low |
| MCV | 76–96 fl | X < (76 − 10) | 55 | Very Low |
| MCH | 27–32 pg | 27 ≤ x ≤ 32 | 31.9 | Normal |
| MCHC | 30.5–34.5 g/dL | 30.5 ≤ x ≤ 34.5 | 31.8 | Normal |
| RDW-CV | 11–16% | 11 ≤ x ≤ 16 | 11 | Normal |
| Blood Sugar | 70–150 mg/dL | 70 ≤ x ≤ 150 | 100 | Normal |
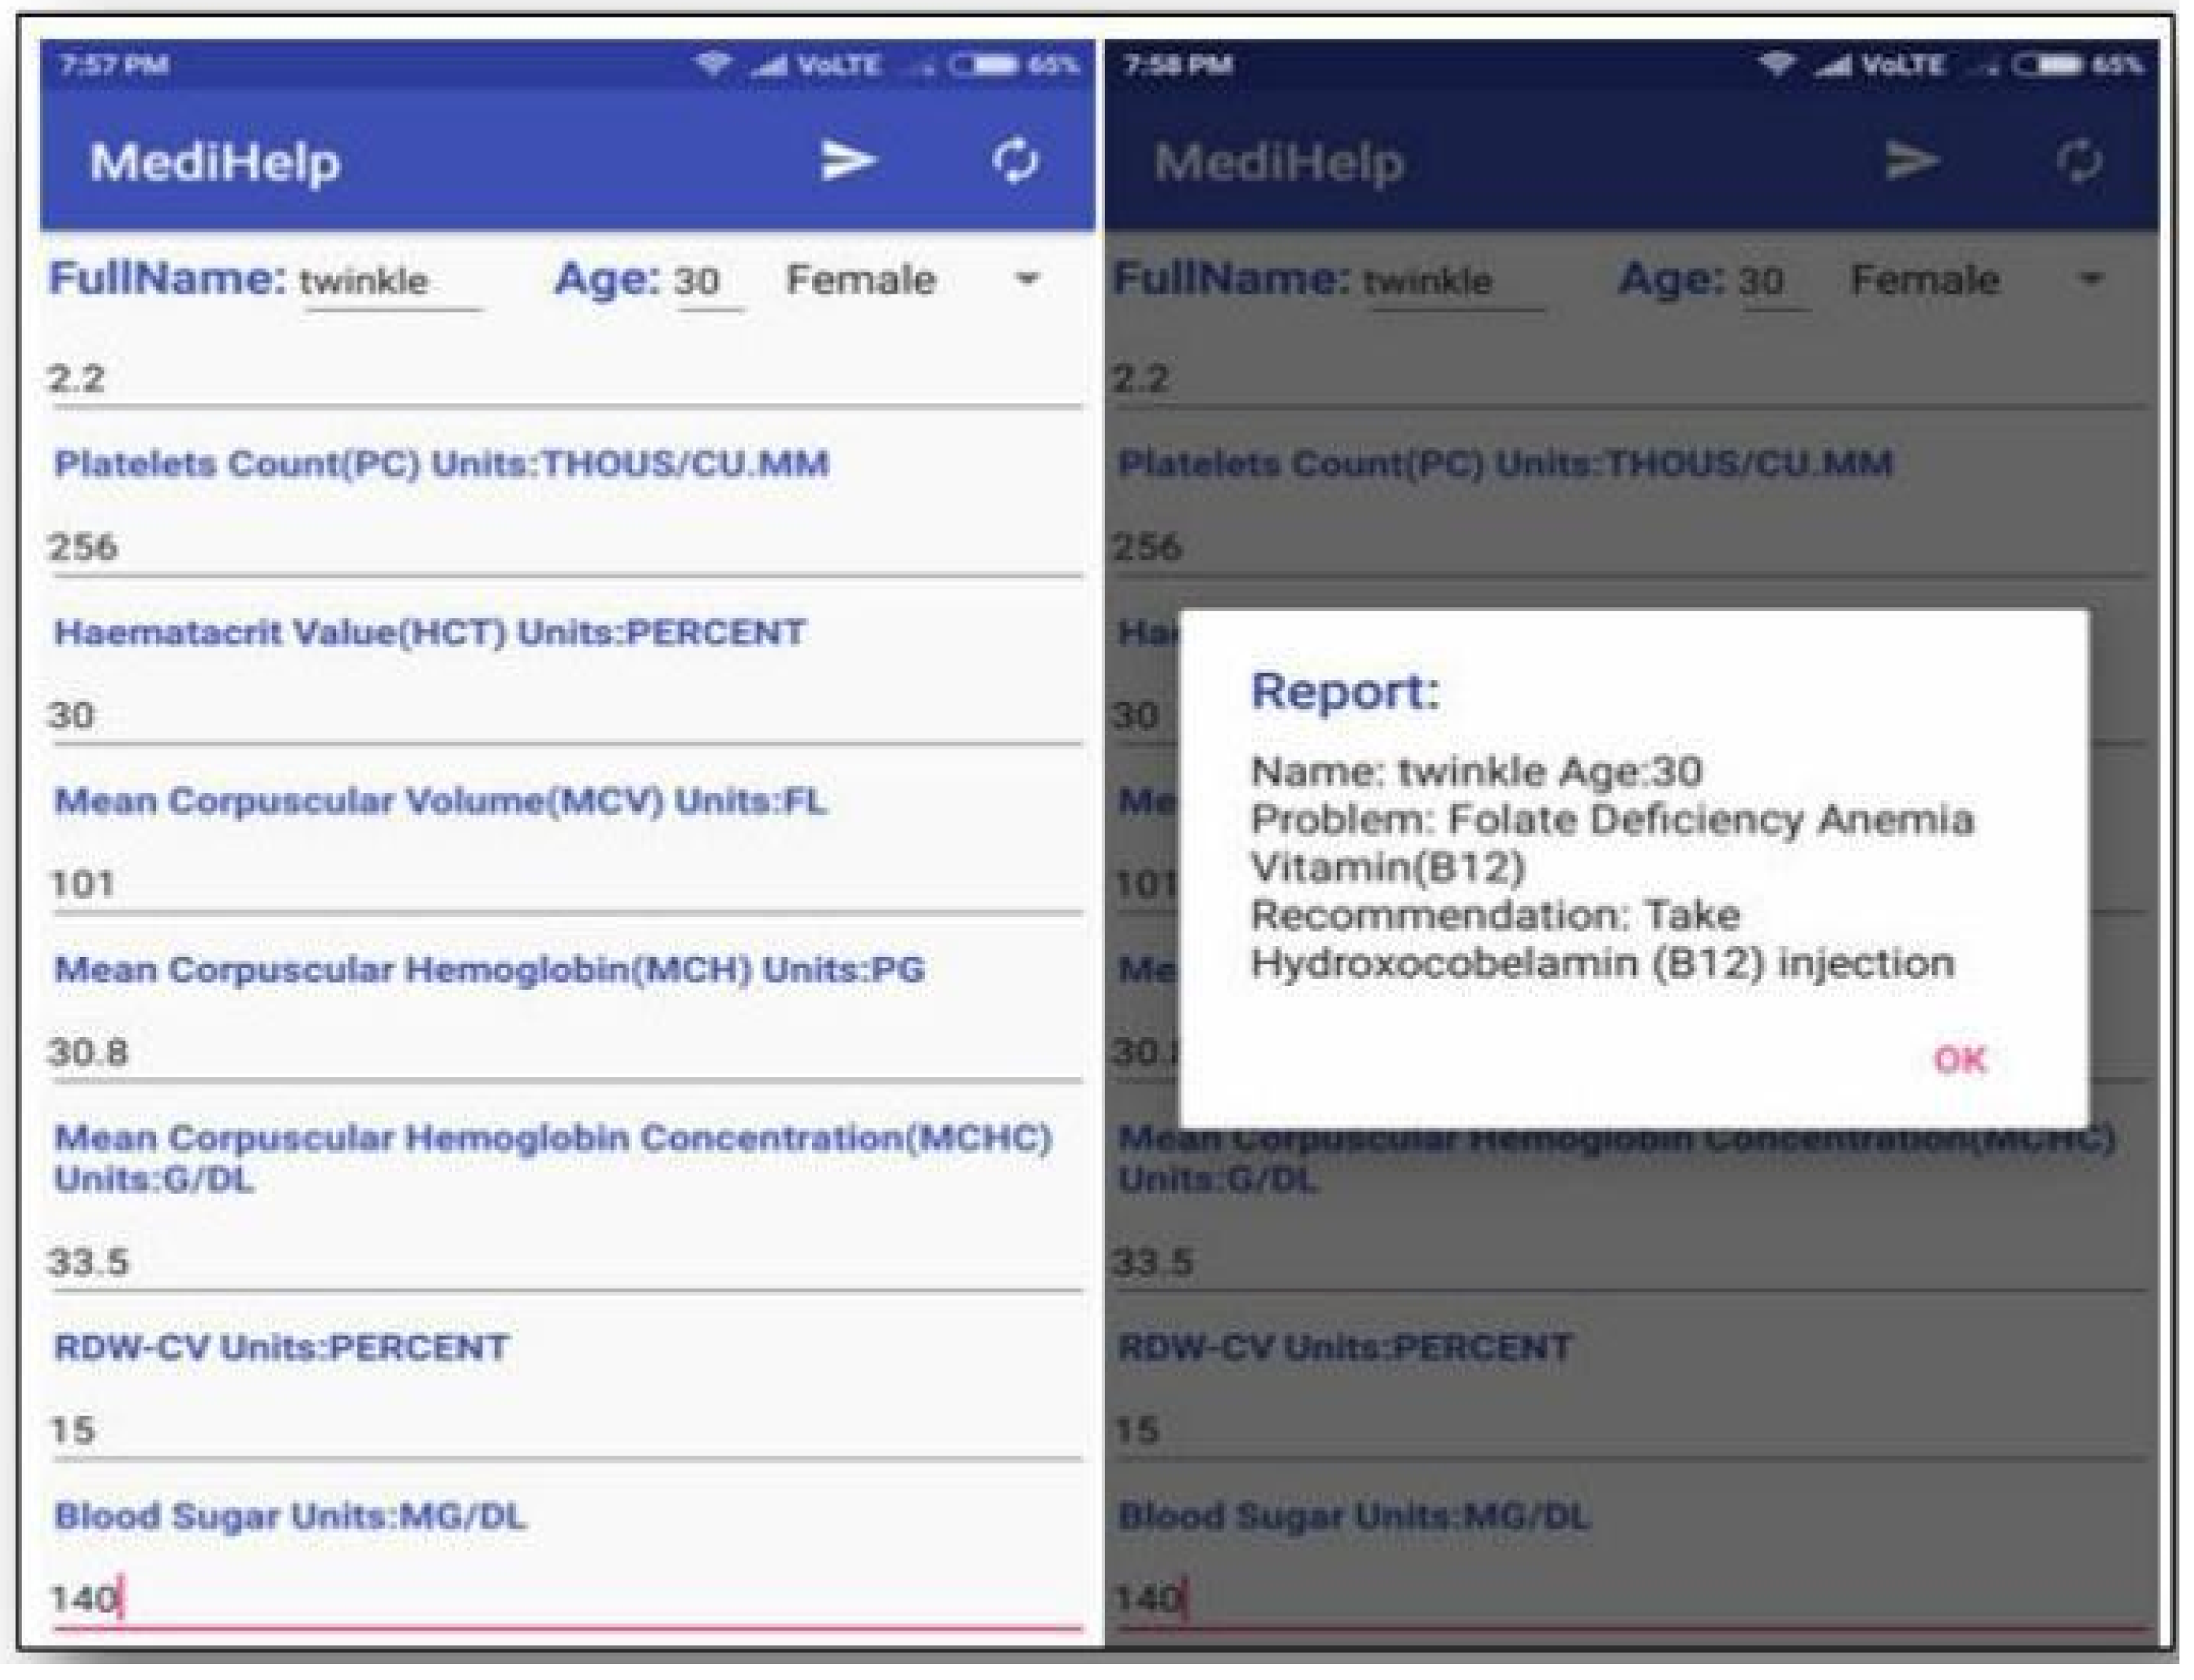
| Parameters | Ideal Range/Units | Input Formula | Input Value | Output Range |
|---|---|---|---|---|
| Haemoglobin | 13.5–17.5 g/dL | 13.5 > x ≥ (13.5 − 10) | 11.5 | Low |
| RBC | 3.5–6.5 mil/c | 3.5 > x ≥ (3.5 − 10) | 2.2 | Low |
| PC | 150–450 t/mm3 | 150 ≤ x ≤ 450 | 256 | Normal |
| HCT | 35–54% | 35 > x ≥ (35 − 10) | 30 | Low |
| MCV | 76–96 fl | X < (76 − 10) | 101 | High |
| MCH | 27–32 pg | 27 ≤ x ≤ 32 | 30.8 | Normal |
| MCHC | 30.5–34.5 g/dL | 30.5 ≤ x ≤ 34.5 | 33.5 | Normal |
| RDW-CV | 11–16% | 11 ≤ x ≤ 16 | 15 | Normal |
| Blood Sugar | 70–150 mg/dL | 70 ≤ x ≤ 150 | 140 | Normal |
| Parameters | Ideal Range/Units | Input Formula | Input Value | Output Range |
|---|---|---|---|---|
| Haemoglobin | 13.5–17.5 g/dL | 13.5 > x ≥ (13.5 − 10) | 10.6 | Low |
| RBC | 3.5–6.5 mil/c | 3.5 ≤ x ≤ 6.5 | 6.3 | Normal |
| PC | 150–450 t/mm3 | 150 ≤ x ≤ 450 | 234 | Normal |
| HCT | 35–54% | 35 > x ≥ (35 − 10) | 32 | Low |
| MCV | 76–96 fl | 76 ≤ x ≤ 96 | 86 | Normal |
| MCH | 27–32 pg | 27 ≤ x ≤ 32 | 30.6 | Normal |
| MCHC | 30.5–34.5 g/dL | 30.5 ≤ x ≤ 34.5 | 31.6 | Normal |
| RDW-CV | 11–16% | 11 ≤ x ≤ 16 | 11.8 | Normal |
| Blood Sugar | 70–150 mg/dL | 70 ≤ x ≤ 150 | 120 | Normal |
Publisher’s Note: MDPI stays neutral with regard to jurisdictional claims in published maps and institutional affiliations. |
© 2022 by the authors. Licensee MDPI, Basel, Switzerland. This article is an open access article distributed under the terms and conditions of the Creative Commons Attribution (CC BY) license (https://creativecommons.org/licenses/by/4.0/).
Share and Cite
Khatter, H.; Gupta, A.K.; Garg, R.R.; Sain, M. Analysis of the S-ANFIS Algorithm for the Detection of Blood Infections Using Hybrid Computing. Electronics 2022, 11, 3733. https://doi.org/10.3390/electronics11223733
Khatter H, Gupta AK, Garg RR, Sain M. Analysis of the S-ANFIS Algorithm for the Detection of Blood Infections Using Hybrid Computing. Electronics. 2022; 11(22):3733. https://doi.org/10.3390/electronics11223733
Chicago/Turabian StyleKhatter, Harsh, Amit Kumar Gupta, Ruchi Rani Garg, and Mangal Sain. 2022. "Analysis of the S-ANFIS Algorithm for the Detection of Blood Infections Using Hybrid Computing" Electronics 11, no. 22: 3733. https://doi.org/10.3390/electronics11223733
APA StyleKhatter, H., Gupta, A. K., Garg, R. R., & Sain, M. (2022). Analysis of the S-ANFIS Algorithm for the Detection of Blood Infections Using Hybrid Computing. Electronics, 11(22), 3733. https://doi.org/10.3390/electronics11223733