Review

Use of Machine Learning in Air Pollution Research: A Bibliographic Perspective

1
Department of Computer Science, Kirori Mal College, University of Delhi, New Delhi 110007, India
2
Department of Computer Science and Engineering, Chandigarh University, Sahibzada Ajit Singh Nagar 140413, India
3
Department of Computer Science and Engineering, SGT University, Gurugram 122505, India
4
Department of Artificial Intelligence and Big Data, Woosong University, Daejeon 34606, Korea
5
Division of Research & Innovation, Uttranchal University, Dehradun 248007, India
*
Author to whom correspondence should be addressed.
Electronics 2022, 11(21), 3621; https://doi.org/10.3390/electronics11213621
Submission received: 21 September 2022 / Revised: 22 October 2022 / Accepted: 31 October 2022 / Published: 6 November 2022
(This article belongs to the Special Issue Feature Papers in Computer Science & Engineering)

Abstract

:
This research is an attempt to examine the recent status and development of scientific studies on the use of machine learning algorithms to model air pollution challenges. This study uses the Web of Science database as a primary search engine and covers over 900 highly peer-reviewed articles in the period 1990–2022. Papers published on these topics were evaluated using the VOSViewer and biblioshiny software to identify and visualize significant authors, key trends, nations, research publications, and journals working on these issues. The findings show that research grew exponentially after 2012. Based on the survey, “particulate matter” is the highly occurring keyword, followed by “prediction”. Papers published by Chinese researchers have garnered the most citations (2421), followed by papers published in the United States of America (2256), and England (722). This study assists scholars, professionals, and global policymakers in understanding the current status of the research contribution on “air pollution and machine learning” as well as identifying the relevant areas for future research.

1. Introduction

Air pollution causes the extensive deterioration of the environment, human health, and the worldwide economy annually and has established itself as a global human hazard. The WHO reports that “the combined effects of both ambient (outdoor) and household air pollution causes about seven million premature deaths every year”. This is a result of increased mortality from stroke [1,2], coronary heart disease [3,4], chronic obstructive pulmonary disease [5,6], lung cancer [7,8], and acute respiratory infections [9,10]. The WHO statistics also show that 90 percent of people breathe highly polluted air, exceeding the air quality limits specifically in low- and middle-income countries [11]. There is a need to raise public awareness about the development of effective pollution maps that provide an early warning of harmful air pollutants.
In recent years, there have been many alarming cases of human and natural pollution, causing serious damage to human health and the environment [12,13,14,15,16]. The major natural air pollutants contaminating the air are sulfur dioxide (SO2), carbon monoxide (CO), particulate matter (PM), nitrogen dioxide (NO2), ozone (O3), and polycyclic aromatic hydrocarbons (PAHs). The main contributors among various man-made sources of air pollution are stationary vehicle emissions, power generation, agricultural and industrial emissions, re-emission from aquatic and terrestrial surfaces, residential heating and cooking, etc. In any specific region, air pollution comes not only from nearby local sources but also from the regional and global sources that affect air quality [17,18,19]. Due to the differences in the number, design, fuel source, emission control technology, and density of these sources, the air pollution concentrations vary considerably across different locations. Daily, weekly, and seasonal changes in the meteorological factors along with different sources lead to great variations in the temporal trends in atmospheric pollutant concentrations. Various machine learning algorithms have been used in the air pollution domain for the prediction of air pollution [20,21], source apportionment [22,23], air pollution monitoring [24,25,26], etc.
Scholars analyze and organize their readings and findings using different qualitative and quantitative literature review approaches. Bibliometrics is one such technique and it is a widely used research method for detecting the state-of-the-art for a particular field. This field introduces a statistically based, systematic, transparent, and reproducible review method [27,28,29]. It uses information like title name, journal name, author names, and their affiliations, keywords, abstract, references, etc., extracted from any academic databases (like Scopus, WoS, PubMed, etc.) by analyzing the vast body of data. As a result, it infers the themes which have been researched, detects the most prolific institutions and scholars and the trends over time, identifies shifts over time in the discipline’s boundary, and provides a big picture of the area. Numerous bibliometric studies have been conducted over time in almost all disciplines like health and infection (COVID-19 [30]), tourism [31], educational administration [32,33], etc. Bibliometric analysis of a global issue like air pollution is important for achieving clarity and direction.
Some previous bibliometric studies have reviewed various aspects of air pollution. For example, in [34], the authors determined the research landscape of the effects of air pollution on children. All WoS-based literature on air pollution between the times span 2005 and 2014 was examined in [35]. In [36], the authors critically analyzed the published literature from 2006 to 2015 on atmospheric pollution sources. In [37], authors visually and quantitatively evaluated the global scientific documents of research on haze from 2000 to 2016. The authors performed a bibliometric literature review of outdoor air pollution-based papers on respiratory health-related issues [38]. Some studies based on machine learning implementation in air pollution on different applications were also reviewed. In [39], the authors did a bibliometric review of statistical forecasting and prediction methods for air pollution. They analyzed the development trend with evolutionary trees and used the Markov chain to forecast the future research trends for major air contaminants. Lu et al., in [40], have done extensive research on the forecasting problem of air pollution. They classified the forecasting models using artificial intelligence, numerical forecasting methods, and statistical forecasting. Rybarczyk [41] did a systematic literature review on machine learning-based air pollution literature and concluded that researchers preferably use support vector machines and neural network algorithms for prediction applications and regression methods for estimation applications. Authors in [42] searched the Web of Science database for all published works and used CiteSpace 5.8.R1 to examine the nations, organizations, authors, keywords, and references in order to identify the hotspots and new directions for AI in the field of air pollution. A bibliometric analysis based on the Web of Science was done in [43] to analyze publications in the topic of ozone pollution using CiteSpace 5.7.R3. The authors concludedthat three areas have received the majority of attention in this field of study: the ozone pollution risk assessment for both people and plants under short- and long-term exposure; the ozone pollution characterization and modelling of ozone mobility on different scales; and elucidating the mechanism of ozone formation and source apportionment. The study in [44] focused on papers with “construction dust” as the subject term in the Web of Science Core Collection Database since 2010, using CiteSpace software to systematically sort and analyze the distribution of construction dust (CD) research, its future research areas, and the development of its fronts. In addition to producing keyword co-appearance and paper co-citation analysis, these articles’ characteristics, including their quantity trend, quality, author group, affiliated institution type, and journal type, are also reported. Nevertheless, a quantitative analysis of a large number of academic works including all the possible application areas for the machine learning methods for air pollution is required. Therefore, to provide clear insights for future study and implementation, this paper conducts a bibliometric-based evaluation and synthesis of the “Air Pollution and Machine Learning” literature.
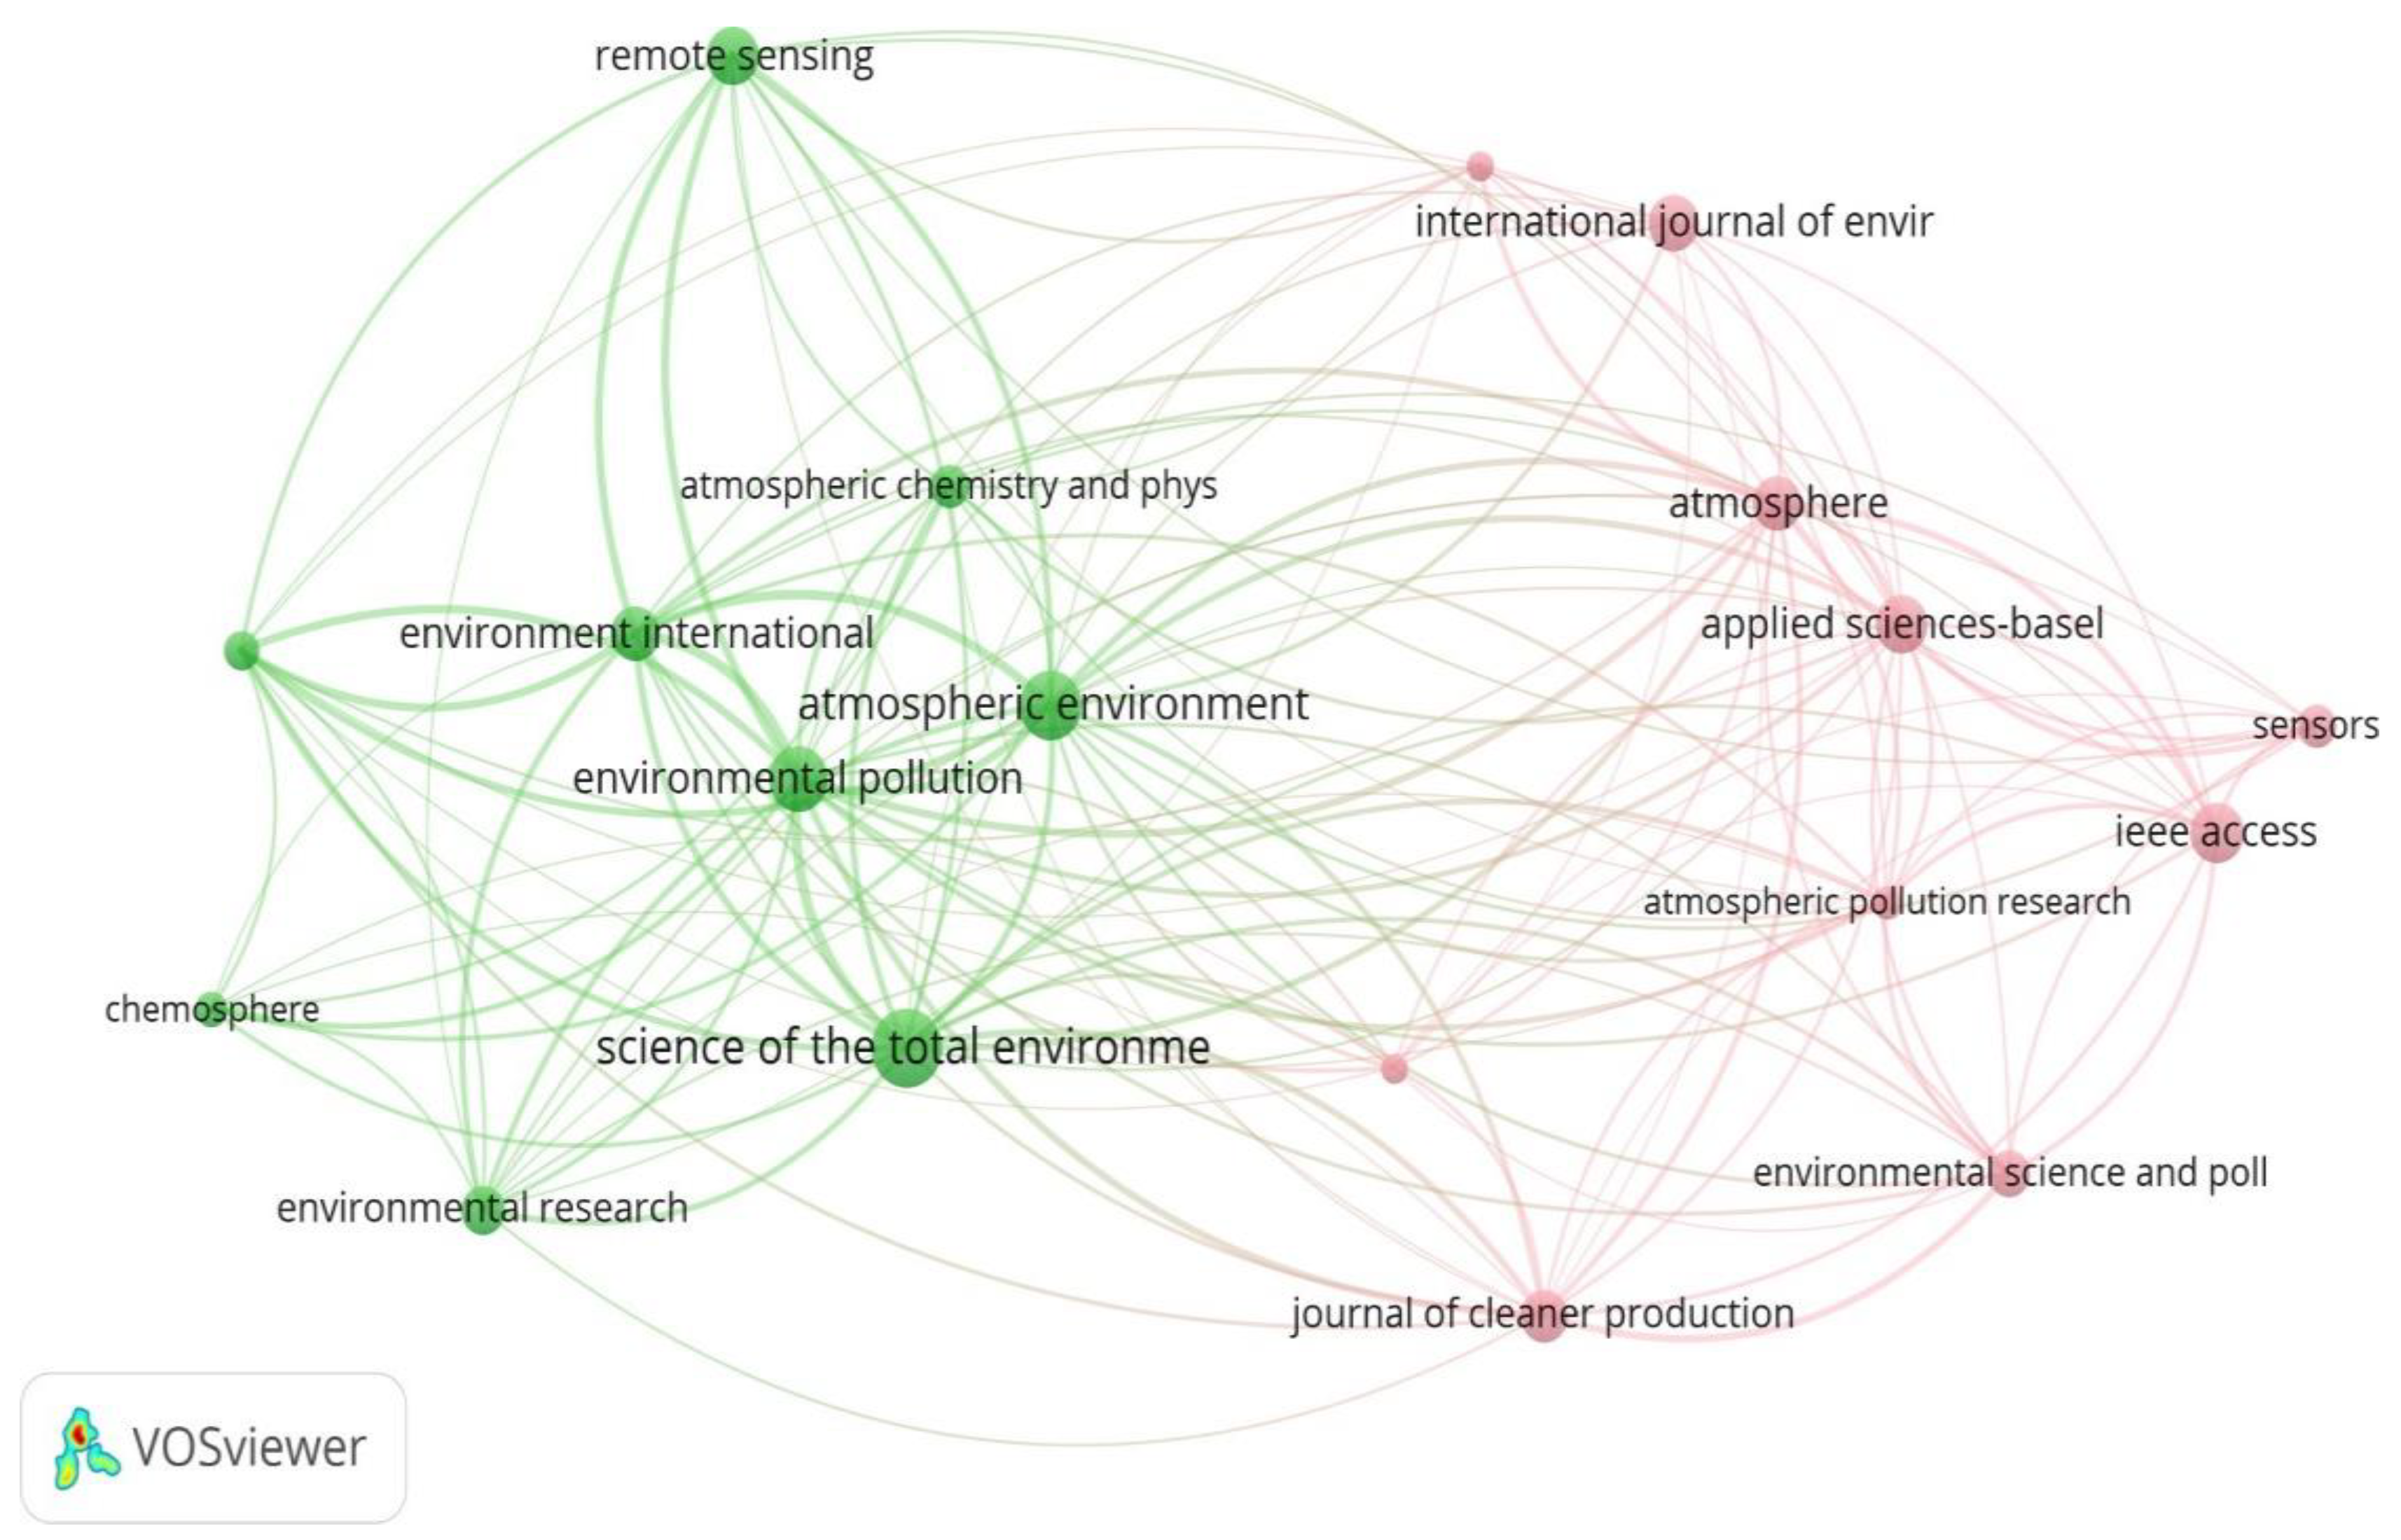
To the author’s best knowledge, no bibliometric analysis of research publications on air pollution and machine learning algorithms conjointly has been published to date. This study aims to acquire an in-breadth understanding of the use of machine learning algorithms in the context of the air pollution domain. To acquire an overall picture of the development state of this field, the authors analyzed the available literature in terms of subject categories, the number of publications, and journal kinds from the WoS online database. Those papers were exported to the VOSviewer and biblioshiny softwares for analysis. We further identified the research needs and collaborative links across the world based on cooperation among countries, authors, and institutions. This study thus provides researchers with a broad insight into the unique research questions about the air pollution field, as listed below:
a. How has the amount of research on “air pollution and machine learning” has evolved through time?
b. What is the annual scientific publication growth of this topic?
c. What are the key terms associated with “air pollution and machine learning” found in the literature?
d. How are the well-renowned researchers collaborating?
e. What are the most productive and influential journals and universities?
f. Which countries collaborate on various aspects of the air pollution problem?
The rest of the manuscript is organized as follows. Section 2 introduces the materials and methodologies. Section 3 presents the results and discusses the bibliometric analysis performed using the VOSviewer and biblioshiny software tools. Finally, Section 4 concludes the paper and identifies areas for future research.

2. Materials and Methods

2.1. Bibliographic Repositories

An extensive search was performed on the WoS database for research articles and state of the art reviews with the keywords “machine learning” and “air pollution”, as shown in Table 1. The date of the retrieval of records was 17 January 2022. The language selected was English. The initial search returned 924 related studies and their full records were downloaded. The information for documents that meet the requirements contained the language, year of publication, journal, author, title, keywords, affiliation, abstract, document type, and counts of citations which were exported into text (.txt) format.

2.2. Bibliometric Analysis Tools

To analyze the bibliographic data, we used the following tools:
1. Biblioshiny application based on bibliometrix [45]: Bibliometrix is an R language-based package for performing the quantitative analysis of bibliographic data. It evaluates couplings, scientific collaboration, co-word analyses, and co-citations of the published literature. Biblioshiny is a shiny application that provides a user-friendly web interface for bibliometrix. As compared to other free softwares like CiteSpace [46], biblioshiny focuses not only on data visualization but also on the correctness and statistical completeness of the results.
2. VOSviewer [47,48,49]: this is a tool for building and visualizing bibliometric networks. Several types of analyses can be conducted using VOSviewer, such as co-occurrence analysis, co-authorship analysis, and citation analysis. The co-authorship study shows how various writers, institutions, and nations which have collaborated on publications. The number of documents where two key terms appear together is projected using co-occurrence analysis. The number of times journals, authors, and works cite one another is calculated using citation analysis [50].
The advantage of both of these software is their free availability to the researchers. These can be used easily for constructing user-friendly and powerful visual maps and provides more insights into diverse literature.
There has been a growing trend for analyzing research using biblioshiny and VOSviewer in several other contexts. For instance, Mukta etal. [51] performed a systematic bibliometric analysis of the effect of social media on the emergence of influencers and influencer marketing. [52] accounts for a bibliometric study performed on the Pfizer-BioNTech vaccine used for a COVID-19 infection. [53] examined the research trends on the usage and analysis of propaganda in social media using a bibliometric study. The crisp analysis and future directions provided by these studies in their respective fields motivated the authors to perform a bibliometric analysis on the topic which is under study.

3. Results

In this section, we present a result analysis of the bibliographic data obtained. We analyzed the authors and their networks, collaborations among universities and countries, the overall trends, the concurrently occurred keywords, and categorized the journals according to their impact in the given area.

3.1. Bibliometric Analysis of Publications

In total, 924 publications on the topic of “air pollution” and “machine learning” were screened in the WoS core database between 1990 and 2022. It included 706(76.4%) journal articles, 155(16.77%) proceeding papers, 33(3.57%) review articles, and 30(3.24%) other forms of publications, including book chapters, data papers, etc., as shown in Figure 1.
The basic information is summarized in Table 2. It showed that all papers were published in 425 sources. A total of 3539 authors have contributed to the overall literature, with an average citation of 11.17 per document. The total keywords used by the authors were 2342. The number of documents authored by a single author is only 31, whereas the number of documents authored by multiple authors is 3508, indicating that it is a highly collaborative area with a collaboration index of 4.02. Although the research in the air pollution field is quite mature, the usage of machine learning algorithms started in the year 2001.
The maximum number of papers published per year during the initial ten years (2001–2010) was only five, which is shown in Figure 2. This area has observed a substantial increase in publications every year after 2012. Starting from 4 publications in the year 2011, it dramatically increased to 320 in 2021. In 2022, 24 papers have been published.
From Figure 3, it has been observed that primarily “Environmental Sciences”, “Engineering Electrical Electronic”, “Meteorology & Atmospheric Sciences”, “Computer Science & Artificial Intelligence”, “Health Sciences”, “Computer Science & Information Systems”, and “Public Environmental & Occupational Health” are the key disciplines which account for most of the publications. Among these, Environmental Sciences is the core with 44.481% of the total published papers, followed by “Engineering Electrical Electronic” accounting for 13.312%, “Meteorology & Atmospheric Sciences” with 12.121%, “Computer Science & Artificial Intelligence” with 11.472%, “Computer Science & Information Systems” with 9.632% records, and others like public environmental occupational health, the chemistry of published studies, remote sensing, etc. The variety of subject areas included in the search results indicated that the use of machine learning methods in air pollution is a multidisciplinary research field.

3.2. Bibliometric Analysis of Keywords

Keywords are associated with the themes related to a topic. The co-occurrence analysis of keywords helps in identifying the emerging trends as key terms as well as their relationship with other terms. VOSviewer aggregates and analyses the co-occurrences of both the author and other keywords in terms of the frequency and relatedness. Common functional terms like prepositions, articles, and pronouns are excluded from the analysis. After feeding WoS data, the software returned 3754 keywords in all. A threshold of 50 papers in which a keyword should occur was taken and a total of 19 keywords were obtained. Figure 4 shows the map of prominent keywords on which most of the literature review has focused. This total keyword space was then subdivided into three clusters. Cluster 1(green color) contains general key terms specific to air pollution like machine learning, exposure, health, mortality, PM2.5, etc. Cluster 2(yellow) contains terms like PM10, regression, model, deep learning, big data, and performance. Keywords like China, random forest, etc., are found in Cluster 3(blue color). The top ten terms that appeared most frequently are listed in Table 3. In addition to the searched keywords, the next top five prominent keywords are “particulate matter (especially PM2.5, PM10)”, “prediction”, “exposure”, “model”, and “mortality”.

3.3. Bibliometric Analysis of the Co-Authorship

In total, 3735 authors have participated in the “air pollution” and “machine learning” area. The top-ten most productive authors in terms of the number of publications (NP) and the total number of citations (TC) are listed in Table 4. Among them, Y Liu from Emory University of Georgia has 18 papers focusing on air pollution exposure modeling, followed by YM Guo (11), Y Wang (11), SS Li (10), and M Jerett (9), whereas M Jerrett (489), A Lyapustin (405), I Kloog (381), YM Guo (354), and SS Li (341) account for the greatest number of total citations. Y Liu (9), M Jerrett (8), I Kloog (8), YM Guo (7), and SS Li (7) are the top five authors with a maximum h-index. To get a clearer insight into the co-authorship, we set a minimum cutoff of six papers published by each author, with a minimum of 35 citations. As a result, 23 authors met this condition. These cut-offs were chosen from large datasets based on earlier bibliographic research that typically utilizes up to twenty to thirty articles (or authors or citations) [51]. Figure 5 shows the resultant network of co-authorship for the most prominent authors. It consists of three clusters. The major cluster in yellow shows a strong collaboration between Alexei Lyapustin, Joel Schwatrz, Itai Kloog, M Stafoggia, and Kees D Hoogh. This cluster is connected to the blue cluster via the authors Alexei Lyapustin and Joel Schwatrz.
Other members in the blue cluster are Yang Liu, Xia Meng, Qingyang Xiao, and Lianfa Li. The third cluster in green consists of authors like Yuming Guo, SS Li, Jun Ma, etc.
We found that scholars from 1363 research institutes around the world have published work on the topic of “air pollution and machine learning”. To gather the most prominent organizations, we set the minimum number of publications published per institution to nine, with a minimum of 30 citations. Twenty-two institutions met this criterion. Figure 6 depicts a map of the prominent co-authorship of organizations with five clusters co-publishing together from a large network of universities. Cluster 1(yellow) is headed by the National Aeronautics and Space Administration (NASA) with the University of California Berkeley, Harvard University, etc., as its members. These universities often collaborate and publish together. Cluster 2(blue) is led by Emory University and has Fudan University, Nanijing University of Information Science and technology as its members. This cluster is connected to the central purple cluster via the Chinese Academy of Sciences and to the next yellow cluster via Zhejiang University. The last cluster in green includes research institutions like Sun Yat Sen University and Wuhan University.
Table 5 lists the top five countries both in terms of the total number of citations (TC) and the number of publications (NP). It shows that researchers from China, the USA, India, the UK, and Spain account for the maximum number of publications. Moreover, scholars from China, the USA, Australia, the UK, and Italy account for the maximum citations and have contributed the most in this research area.
Figure 7 illustrates the map of co-authorship of prominent countries that collaborate. We used a threshold of 12 documents published along with a minimum of 50 citations per country. Out of the total of 36 countries, 23 met this cut-off. It is worth noting that the size of nodes corresponds to the number of documents published by that country; for example, China has the most papers published. This map contains four sub-networks of countries. The most spectacular blue network consists of researchers from China and Japan. The magnanimous network at the bottom in pink consists of countries like England, Spain, Canada, Germany, Greece, etc., showing their collaboration. The intermediary green network consists of Saudi Arabia, South Korea, Pakistan, Malaysia, etc. The smallest yellow cluster consists of countries such as India, Taiwan, and the USA.

3.4. Bibliometric Analysis of the Citations and Publications

Kessler [54] demonstrated that scientific works exhibit an intellectual likeness through their referencing pattern. When a common article is cited by another two articles, this means that both of them deliberately stress similar discussions. Citation analysis is based on how closely items are related, or how many times they cite each other. It can be performed on published documents, authors, and journals.
Table 6 lists the top ten most referenced publications returned by the WoS concerning the search criteria. The two most cited articles are “Mapping global urban areas using MODIS 500-m data:New methods and datasets based on “urban ecoregions”” by Annemarie Schneider [55], published in Remote Sensing of Environment in 2010. This is followed by the paper titled “Applications of low-cost sensing technologies for air quality monitoring and exposure assessment: How far have they gone?” by Lidia Morawska [56], published in Environment International in 2018.
The next analysis was around the question: which papers in the field of “air pollution” and “machine learning” cite each other? We kept the citation count to 70 to get the most influential papers. Twenty-four papers met the criteria. The citation analysis of the published papers is shown in Figure 8. The commonly cited references can be bifurcated into five clusters. Cluster 1(yellow) constitutes the various geospatial estimation-based methods for air pollution. Papers belonging to this cluster [57,64,65] conducted an in-depth analysis of Aerosol Optical Depth (AOD) satellite data and Land Use Regression (LUR) using random forest methods for estimating various PM Concentrations. Cluster 2(blue) includes the research studies for predicting PM2.5 [58,66,67]. Cluster 3(green) analyzed the spatio-temporal studies to predict various pollutants [62,63,68]. Cluster 4(purple) involves studies on forecasting ambient air pollutant trends [59,69]. Finally, cluster 5(pink) consists of source apportionment and air pollution monitoring-based studies [22,70].
The top ten most cited journals in this domain are listed in Table 7. “Atmospheric Environment” is the most-cited journal with 800 citations, followed by “Environment International” with 709 citations, “Science of the Total Environment” with 702 citations, and Environmental Pollution with 625 citations. In terms of the number of publications, Science of Total Environment is on the top with 39 publications, followed by Atmospheric Environment with 32 publications and Environmental Pollution with 28 publications. Not surprisingly, Table 7 represents the leading top-tier journals known for delivering academic excellence in the broader areas of atmospheric sciences, environmental sciences, pollution studies, applied sciences, remote sensing, and technology.
Out of all the journals that have published papers on the searched keywords with a criterion of a minimum of eight publications and being cited at least 70 times, only twenty met the criterion. Out of these, nineteen formed a connected cluster of journals having cited each other.The resulting network map displayed in Figure 9 depicts two major clusters of journals. Green includes journals like Environmental Pollution, Atmospheric Environment, Remote Sensing, Atmospheric Chemistry and Physics, and Science of the Total Environment along with the others. The other pink cluster includes journals like the Journal of Cleaner Production, Atmospheric Pollution Research, International Journal of Environment, Science of total environment, etc.

4. Conclusions

The bibliometric study findings show where academic research on “air pollution” and “machine learning” takes place, as well as which authors or groups of authors are significant to cite when performing fresh research on these topics. The number of articles published on these topics has risen dramatically since 2012, which is unsurprising given the importance of this field of research. The results showed that various subjects have been involved, such as “Environmental Sciences”, “Engineering Electrical Electronic”, “Meteorology & Atmospheric Sciences”, and “Computer Science & Artificial Intelligence” in making this an interdisciplinary study area. According to this study, this field is most popular among scholars in China, the United States, India, the UK, and Spain. While academics from China and the United States published a large number of publications, they were also successful in publishing the highly cited paper. A strong cluster of universities, including the Chinese Academy of Sciences, NASA, and Emory University of Atlanta, tend to co-author publications on this issue. Many machine learning algorithms in air pollution studies have dealt with particulate matter prediction techniques and our survey has concluded that the random forest method has been popular among researchers to locate near-optimal solutions. While academics have researched “air pollution” broadly with a specific interest in prediction and exposure, as the co-occurrence analysis indicates, other key aspects of this study are less prominent, including indoor air pollution prediction and monitoring, haze forecasting, and source apportionment. If the patterns indicated in this literature analysis continue, “air pollution” and similar concepts will remain major topics in a variety of academic disciplines, including climate change studies, accounting for the global burden of countries, and environmental studies in general. These aspects of air pollution are crucial for academics and public policymakers who want to have a comprehensive grasp of “air pollution” and the practice of raising public awareness. This review also provides a map that can help authors, reviewers, and journal editors think about their future work, the worth of that work, and the tangents that journals might take.

Author Contributions

Conceptualization, N.K.; literature search and original draft preparation, S.J.; bibliometric analysis, S.J., K. and S.V.; critical revision of paper, N.K., A.S.M.S.H. and S.S.S.; supervision, N.K.; funding acquisition, A.S.M.S.H. All authors have read and agreed to the published version of the manuscript.

Funding

This research was supported by the Woosong University Academic Research in 2022.

Conflicts of Interest

The authors declare no conflict of interest.

References

  1. Hong, Y.C.; Lee, J.T.; Kim, H.; Kwon, H.J. Air pollution: A new risk factor in ischemic stroke mortality. Stroke 2002, 33, 2165–2169. [Google Scholar] [CrossRef] [PubMed] [Green Version]
  2. Kettunen, J.; Lanki, T.; Tiittanen, P.; Aalto, P.P.; Koskentalo, T.; Kulmala, M.; Salomaa, V.; Pekkanen, J. Associations of fine and ultrafine particulate air pollution with stroke mortality in an area of low air pollution levels. Stroke 2007, 38, 918–922. [Google Scholar] [CrossRef] [PubMed] [Green Version]
  3. Ruckerl, R.; Ibald-Mulli, A.; Koenig, W.; Schneider, A.; Woelke, G.; Cyrys, J.; Heinrich, J.; Marder, V.; Frampton, M.; Wichmann, H.E.; et al. Air pollution and markers of inflammation and coagulation in patients with coronary heart disease. Am. J. Respir. Crit. Care Med. 2006, 173, 432–441. [Google Scholar] [CrossRef] [PubMed]
  4. Gan, W.Q.; Koehoorn, M.; Davies, H.W.; Demers, P.A.; Tamburic, L.; Brauer, M. Long-term exposure to traffic-related air pollution and the risk of coronary heart disease hospitalization and mortality. Environ. Health Perspect. 2011, 119, 501–507. [Google Scholar] [CrossRef]
  5. Andersen, Z.J.; Hvidberg, M.; Jensen, S.S.; Ketzel, M.; Loft, S.; Sørensen, M.; Tjønneland, A.; Overvad, K.; Raaschou-Nielsen, O. Chronic obstructive pulmonary disease and long-term exposure to traffic-related air pollution: A cohort study. Am. J. Respir. Crit. Care Med. 2011, 183, 455–461. [Google Scholar] [CrossRef]
  6. Anderson, H.R.; Spix, C.; Medina, S.; Schouten, J.P.; Castellsague, J.; Rossi, G.; Zmirou, D.; Touloumi, G.; Wojtyniak, B.; Ponka, A.; et al. Air pollution and daily admissions for chronic obstructive pulmonary disease in 6 european cities: Results from the aphea project. Eur. Respir. J. 1997, 10, 1064–1071. [Google Scholar] [CrossRef] [Green Version]
  7. Nyberg, F.; Gustavsson, P.; Jarup, L.; Bellander, T.; Berglind, N.; Jakobsson, R.; Pershagen, G. Urban air pollution and lung cancer in stockholm. Epidemiology 2000, 11, 487–495. [Google Scholar] [CrossRef]
  8. Raaschou-Nielsen, O.; Andersen, Z.J.; Beelen, R.; Samoli, E.; Stafoggia, M.; Weinmayr, G.; Hoffmann, B.; Fischer, P.; Nieuwenhuijsen, M.J.; Brunekreef, B.; et al. Air pollution and lung cancer incidence in 17 european cohorts: Prospective analyses from the european study of cohorts for air pollution effects (escape). Lancet Oncol. 2013, 14, 813–822. [Google Scholar] [CrossRef]
  9. Darrow, L.A.; Klein, M.; Flanders, W.D.; Mulholland, J.A.; Tolbert, P.E.; Strickland, M.J. Air pollution and acute respiratory infections among children 0–4 years of age: An 18-year time-series study. Am. J. Epidemiol. 2014, 180, 968–977. [Google Scholar] [CrossRef] [Green Version]
  10. Ezzati, M.; Kammen, D.M. Indoor air pollution from biomass combustion and acute respiratory infections in kenya: An exposure-response study. Lancet 2001, 358, 619–624. [Google Scholar] [CrossRef]
  11. World Health Organization (WHO). Air Pollution. 2021. Available online: https://www.who.int/health-topics/air-pollution#tab=tab_1 (accessed on 3 August 2021).
  12. Mokhtari, I.; Bechkit, W.; Rivano, H.; Yaici, M.R. Uncertainty-aware deep learning architectures for highly dynamic air quality prediction. IEEE Access 2021, 9, 14765–14778. [Google Scholar] [CrossRef]
  13. Orru, H.; Ebi, K.L.; Forsberg, B. The interplay of climate change and air pollution on health. Curr. Environ. Health Rep. 2017, 4, 504–513. [Google Scholar] [CrossRef] [PubMed]
  14. Tagaris, E.; Liao, K.; DeLucia, A.J.; Deck, L.; Amar, P.; Russell, A.G. Potential impact of climate change on air pollution-related human health effects. Environ. Sci. Technol. 2009, 43, 4979–4988. [Google Scholar] [CrossRef] [PubMed]
  15. Kampa, M.; Castanas, E. Human health effects of air pollution. Environ. Pollut. 2008, 151, 362–367. [Google Scholar] [CrossRef]
  16. Qureshi, M.I.; Rasli, A.M.; Awan, U.; Ma, J.; Ali, G.; Alam, A.; Sajjad, F.; Zaman, K. Environment and air pollution: Health services bequeath to grotesque menace. Environ. Sci. Pollut. Res. 2015, 22, 3467–3476. [Google Scholar] [CrossRef]
  17. Loomis, D.; Grosse, Y.; Lauby-Secretan, B.; el Ghissassi, F.; Bouvard, V.; Benbrahim-Tallaa, L.; Guha, N.; Baan, R.; Mattock, H.; Straif, K. The carcinogenicity of outdoor air pollution. Lancet Oncol. 2013, 14, 1262. [Google Scholar] [CrossRef]
  18. Crouse, D.L.; Ross, N.A.; Goldberg, M.S. Double burden of deprivation and high concentrations of ambient air pollution at the neighbourhood scale in montreal, Canada. Soc. Sci. Med. 2009, 69, 971–981. [Google Scholar] [CrossRef]
  19. Du, X.; Guo, H.; Zhang, H.; Peng, W.; Urpelainen, J. Cross-state air pollution transport calls for more centralization in India’s environmental federalism. Atmos. Pollut. Res. 2020, 11, 1797–1804. [Google Scholar] [CrossRef]
  20. Wang, W.; Men, C.; Lu, W. Online prediction model based on support vector machine. Neurocomputing 2008, 71, 550–558. [Google Scholar] [CrossRef]
  21. Kerckhoffs, J.; Hoek, G.; Portengen, L.; Brunekreef, B.; Vermeulen, R.C.H. Performance of prediction algorithms for modeling outdoor air pollution spatial surfaces. Environ. Sci. Technol. 2019, 53, 1413–1421. [Google Scholar] [CrossRef]
  22. Kaur, M.; Verma, S. Flying ad-hoc network (FANET): Challenges and routing protocols. J. Comput. Theor. Nanosci. 2020, 17, 2575–2581. [Google Scholar] [CrossRef]
  23. Batth, R.S.; Gupta, M.; Mann, K.S.; Verma, S.; Malhotra, A. Comparative Study of TDMA-Based MAC Protocols in VANET: A Mirror Review. In International Conference on Innovative Computing and Communications. Advances in Intelligent Systems and Computing; Khanna, A., Gupta, D., Bhattacharyya, S., Snasel, V., Platos, J., Hassanien, A., Eds.; Springer: Singapore, 2020; Volume 1059. [Google Scholar] [CrossRef]
  24. Tanvi, S.; Verma, S.; Kavita. Prediction of heart disease using Cleveland dataset: A machine learning approach. Int. J. Rec. Res. Asp. 2017, 4, 17–21. [Google Scholar]
  25. Ghosh, G.; Sood, M.; Verma, S. Internet of things based video surveillance systems for security applications. J. Comput. Theor. Nanosci. 2020, 17, 2582–2588. [Google Scholar] [CrossRef]
  26. Tian, X.; Huang, Y.; Verma, S.; Jin, M.; Ghosh, U.; Rabie, K.M.; ThuanDo, D. Power allocation scheme for maximizing spectral efficiency and energy efficiency tradeoff for uplink NOMA systems in B5G/6G. Phys. Commun. 2020, 43, 101227. [Google Scholar] [CrossRef]
  27. Pritchard, A. Statistical bibliography or bibliometrics. J. Doc. 1969, 25, 348–349. [Google Scholar]
  28. Broadus, R.N. Toward a definition of bibliometrics. Scientometrics 1987, 12, 373–379. [Google Scholar] [CrossRef]
  29. Diodato, V.P.; Gellatly, P. Dictionary of Bibliometrics; Routledge: London, UK, 2013. [Google Scholar]
  30. Yu, Y.; Li, Y.; Zhang, Z.; Gu, Z.; Zhong, H.; Zha, Q.; Yang, L.; Zhu, C.; Chen, E. A bibliometric analysis using VOS viewer of publications on COVID-19. Ann. Transl. Med. 2020, 8, 816. [Google Scholar] [CrossRef]
  31. Koseoglu, M.A.; Rahimi, R.; Okumus, F.; Liu, J. Bibliometric studies in tourism. Ann. Tour. Res. 2016, 61, 180–198. [Google Scholar] [CrossRef]
  32. Hallinger, P.; Kovačević, J. A bibliometric review of research on educational administration: Science mapping the literature, 1960 to 2018. Rev. Educ. Res. 2019, 89, 335–369. [Google Scholar] [CrossRef]
  33. Hallinger, P.; Chatpinyakoop, C. A bibliometric review of research on higher education for sustainable development, 1998–2018. Sustainability 2019, 11, 2401. [Google Scholar] [CrossRef] [Green Version]
  34. Kumar, M.; Raju, K.S.; Kumar, D.; Goyal, N.; Verma, S.; Singh, A. An efficient framework using visual recognition for IoT based smart city surveillance. Multimed. Tools Appl. 2021, 80, 31277–31295. [Google Scholar] [CrossRef] [PubMed]
  35. Kumar, S.; Shanker, R.; Verma, S. Context Aware Dynamic Permission Model: A Retrospect of Privacy and Security in Android System. In Proceedings of the 2018 International Conference on Intelligent Circuits and Systems (ICICS), Phagwara, India, 19–20 April 2018; pp. 324–329. [Google Scholar] [CrossRef]
  36. Yang, G.; Jan, M.A.; Rehman, A.U.; Babar, M.; Aimal, M.M.; Verma, S. Interoperability and Data Storage in Internet of Multimedia Things: Investigating Current Trends, Research Challenges and Future Directions. IEEE Access 2020, 8, 124382–124401. [Google Scholar] [CrossRef]
  37. Babbar, H.; Rani, S.; Masud, M.; Verma, S.; Anand, D.; Jhanjhi, N. Load balancing algorithm for migrating switches in software-defined vehicular networks. Comput. Mater. Contin. 2021, 67, 1301–1316. [Google Scholar] [CrossRef]
  38. Dash, S.; Verma, S.; Kavita; Bevinakoppa, S.; Wozniak, M.; Shafi, J.; Ijaz, M.F. Guidance Image-Based Enhanced Matched Filter with Modified Thresholding for Blood Vessel Extraction. Symmetry 2022, 14, 194. [Google Scholar] [CrossRef]
  39. Dogra, V.; Singh, A.; Verma, S.; Kavita; Jhanjhi, N.Z.; Talib, M.N. Analyzing DistilBERT for Sentiment Classification of Banking Financial News. In Intelligent Computing and Innovation on Data Science; Peng, S.L., Hsieh, S.Y., Gopalakrishnan, S., Duraisamy, B., Eds.; Lecture Notes in Networks and Systems; Springer: Singapore, 2021; Volume 248. [Google Scholar] [CrossRef]
  40. Bai, L.; Wang, J.; Ma, X.; Lu, H. Air pollution forecasts: An overview. Int. J. Environ. Res. Public Health 2018, 15, 780. [Google Scholar] [CrossRef] [Green Version]
  41. Rybarczyk, Y.; Zalakeviciute, R. Machine learning approaches for outdoor air quality modelling: A systematic review. Appl. Sci. 2018, 8, 2570. [Google Scholar] [CrossRef] [Green Version]
  42. Guo, Q.; Ren, M.; Wu, S.; Sun, Y.; Wang, J.; Wang, Q.; Ma, Y.; Song, X.; Chen, Y. Applications of artificial intelligence in the field of air pollution: A bibliometric analysis. Front. Public Health 2020, 1, 2972. [Google Scholar] [CrossRef]
  43. Hou, Y.; Shen, Z. Research Trends, Hotspots and Frontiers of Ozone Pollution from 1996 to 2021: A Review Based on a Bibliometric Visualization Analysis. Sustainability 2022, 14, 10898. [Google Scholar] [CrossRef]
  44. Guo, P.; Tian, W.; Li, H.; Zhang, G.; Li, J. Global characteristics and trends of research on construction dust: Based on bibliometric and visualized analysis. Environ. Sci. Pollut. Res. 2020, 27, 37773–37789. [Google Scholar] [CrossRef]
  45. Aria, M.; Cuccurullo, C. bibliometrix: An r-tool for comprehensive science mapping analysis. J. Informetr. 2017, 11, 959–975. [Google Scholar] [CrossRef]
  46. Chen, C. The citespace manual. Coll. Comput. Inform. 2014, 1, 1–84. [Google Scholar]
  47. Eck, N.J.V.; Waltman, L. Visualizing bibliometric networks. In Measuring Scholarly Impact; Springer: Cham, Switzerland, 2014; pp. 285–320. [Google Scholar]
  48. Eck, N.J.V.; Waltman, L. Software survey: Vosviewer, a computer program for bibliometric mapping. Scientometrics 2010, 84, 523–538. [Google Scholar]
  49. Eck, N.J.V.; Waltman, L. Text mining and visualization using VOS viewer. arXiv 2011, arXiv:1109.2058. [Google Scholar]
  50. Park, A.; Montecchi, M.; Plangger, K.; Pitt, L. Understanding fake news: A bibliographic perspective. Def. Strateg. Commun. 2020, 8, 141–172. [Google Scholar] [CrossRef]
  51. Abhishek; Srivastava, M. Mapping the influence of influencer marketing: A bibliometric analysis. Mark. Intell. Plan. 2021, 39, 979–1003. [Google Scholar] [CrossRef]
  52. Hassan, W.; Ara, A. Bibliometric analysis of pfizer-biontech (bnt162b2): A covid-19 vaccine. J. Pure Appl. Microbiol. 2021, 15, 1211–1229. [Google Scholar] [CrossRef]
  53. Chaudhari, D.D.; Pawar, A.V. Propaganda analysis in social media: A bibliometric review. Inf. Discov. Deliv. 2021, 49, 57–70. [Google Scholar] [CrossRef]
  54. Kessler, M.M. Bibliographic coupling between scientific papers. Am. Doc. 1963, 14, 10–25. [Google Scholar] [CrossRef]
  55. Schneider, A.; Friedl, M.A.; Potere, D. Mapping global urban areas using modis 500-m data: New methods and datasets based on “urban ecoregions”. Remote Sens. Environ. 2010, 114, 1733–1746. [Google Scholar] [CrossRef]
  56. Morawska, L.; Thai, P.K.; Liu, X.; Asumadu-Sakyi, A.; Ayoko, G.; Bartonova, A.; Bedini, A.; Chai, F.; Christensen, B.; Dunbabin, M.; et al. Applications of low-cost sensing technologies for air quality monitoring and exposure assessment: How far have they gone? Environ. Int. 2018, 116, 286–299. [Google Scholar] [CrossRef]
  57. Chen, G.; Li, S.; Knibbs, L.D.; Hamm, N.A.S.; Cao, W.; Li, T.; Guo, J.; Ren, H.; Abramson, M.J.; Guo, Y. A machine learning method to estimate pm2. 5 concentrations across china with remote sensing, meteorological and land use information. Sci. Total Environ. 2018, 636, 52–60. [Google Scholar] [CrossRef] [PubMed]
  58. Huang, C.-J.; Kuo, P.-H. A deep CNN-LSTM model for particulate matter (pm2. 5) forecasting in smart cities. Sensors 2018, 18, 2220. [Google Scholar] [CrossRef] [PubMed]
  59. Lu, W.-Z.; Wang, W.-J. Potential assessment of the support vector machine method in forecasting ambient air pollutant trends. Chemosphere 2005, 59, 693–701. [Google Scholar] [CrossRef] [PubMed]
  60. Zimmerman, N.; Presto, A.A.; Kumar, S.P.N.; Gu, J.; Hauryliuk, A.; Robinson, E.S.; Robinson, A.L.; Subramanian, R. A machine learning calibration model using random forests to improve sensor performance for lower-cost air quality monitoring. Atmos. Meas. Tech. 2018, 11, 291–313. [Google Scholar] [CrossRef] [Green Version]
  61. Beckerman, B.S.; Jerrett, M.; Serre, M.; Martin, R.V.; Lee, S.; van Donkelaar, A.; Ross, Z.; Su, J.; Burnett, R.T. A hybrid approach to estimating national scale spatiotemporal variability of pm2. 5 in the contiguous united states. Environ. Sci. Technol. 2013, 47, 7233–7241. [Google Scholar] [CrossRef] [Green Version]
  62. Reid, C.E.; Jerrett, M.; Petersen, M.L.; Pfister, G.G.; Morefield, P.E.; Tager, I.B.; Raffuse, S.M.; Balmes, J.R. Spatiotemporal prediction of fine particulate matter during the 2008 northern California wildfires using machine learning. Environ. Sci. Technol. 2015, 49, 3887–3896. [Google Scholar] [CrossRef]
  63. Zhan, Y.; Luo, Y.; Deng, X.; Chen, H.; Grieneisen, M.L.; Shen, X.; Zhu, L.; Zhang, M. Spatiotemporal prediction of continuous daily pm2.5 concentrations across china using a spatially explicit machine learning algorithm. Atmos. Environ. 2017, 155, 129–139. [Google Scholar] [CrossRef]
  64. Stafoggia, M.; Bellander, T.; Bucci, S.; Davoli, M.; de Hoogh, K.; De’Donato, F.; Gariazzo, C.; Lyapustin, A.; Michelozzi, P.; Renzi, M.; et al. Estimation of daily pm10 and pm2.5 concentrations in Italy, 2013–2015, using a spatiotemporal land-use random-forest model. Environ. Int. 2019, 124, 170–179. [Google Scholar] [CrossRef]
  65. Chen, G.; Wang, Y.; Li, S.; Cao, W.; Ren, H.; Knibbs, L.D.; Abramson, M.J.; Guo, Y. Spatiotemporal patterns of pm10 concentrations over china during 2005–2016: A satellite-based estimation using the random forests approach. Environ. Pollut. 2018, 242, 605–613. [Google Scholar] [CrossRef]
  66. Brokamp, C.; Jandarov, R.; Rao, M.B.; LeMasters, G.; Ryan, P. Exposure assessment models for elemental components of particulate matter in an urban environment: A comparison of regression and random forest approaches. Atmos. Environ. 2017, 151, 1–11. [Google Scholar] [CrossRef] [Green Version]
  67. Di, Q.; Amini, H.; Shi, L.; Kloog, I.; Silvern, R.; Kelly, J.; Sabath, M.B.; Choirat, C.; Koutrakis, P.; Lyapusti, A.; et al. An ensemble-based model of pm2. 5 concentrations across the contiguous united states with high spatiotemporal resolution. Environ. Int. 2019, 130, 104909. [Google Scholar] [CrossRef] [PubMed]
  68. Zhan, Y.; Luo, Y.; Deng, X.; Grieneisen, M.L.; Zhang, M.; Di, B. Spatiotemporal prediction of daily ambient ozone levels across china using random forest for human exposure assessment. Environ. Pollut. 2018, 233, 464–473. [Google Scholar] [CrossRef] [PubMed]
  69. Freeman, B.S.; Taylor, G.; Gharabaghi, B.; Thé, J. Forecasting air quality time series using deep learning. J. Air Waste Manag. Assoc. 2018, 68, 866–886. [Google Scholar] [CrossRef] [PubMed] [Green Version]
  70. Shaban, K.B.; Kadri, A.; Rezk, E. Urban air pollution monitoring system with forecasting models. IEEE Sens. J. 2016, 16, 2598–2606. [Google Scholar] [CrossRef]
Figure 1. Type of publications on “air pollution and machine learning”.
Electronics 11 03621 g001
Figure 2. Number of publications on air pollution and machine learning since 2012.
Electronics 11 03621 g002
Figure 3. Different research areas with publications on “Air pollution and machine learning”.
Electronics 11 03621 g003
Figure 4. Map of co-occurrences of keywords.
Electronics 11 03621 g004
Figure 5. Map of co-authorship of prominent authors.
Electronics 11 03621 g005
Figure 6. Map of prominent co-authorship of organizations.
Electronics 11 03621 g006
Figure 7. Map of co-authorship of prominent countries.
Electronics 11 03621 g007
Figure 8. Citation Analysis of Published Papers [22,57,58,59,62,63,64,65,66,67,68,69,70].
Electronics 11 03621 g008
Figure 9. Map of citation analysis of Main Journals.
Electronics 11 03621 g009
Table 1. Source retrieval.
Search queryTS = (“atmospheric pollutant” OR “Atmospheric pollutants” OR “Air pollutants” OR “air pollution”) AND (machine learning)
Timespan1990 to 2022
Type of documentsArticles, reviews, proceeding papers, book chapters, and early access papers
Table 2. Important information and summary.
DescriptionResults
Timespan1990:2022
Sources (journals, books, etc.)425
Documents924
Keywords plus (ID)1646
Authors’ keywords (DE)2342
Average citations per document11.17
Authors3539
Authors of single-authored documents31
Authors of multi-authored documents3508
Single-authored documents35
Documents per author0.257
Authors per document3.9
Co-Authors per documents5.19
Collaboration Index4.02
Table 3. Ten topmost co-occurring keywords.
RankKeywordNumber of Occurrences
1air pollution404
2machine learning371
3particulate matter261
4prediction107
5exposure95
6model88
7mortality76
8random forest75
9China74
10deep learning58
Table 4. Top10 most productive authors.
RankAuthors (NP)Author (TC)Author(h-index)
1Liu Y (18)Jerrett M (489)Liu Y (9)
2Guo YM (11)Lyapustin A (405)Jerrett M (8)
3Wang Y (11)Kloog I (381)Kloog I (8)
4Li SS (10)Guo Y (354)Guo YM (7)
5Jerrett M (9)Li, SS (341)Li SS (7)
6Kloog I (9)Chen GB (333)Lyapustin A (7)
7Zhang L (9)Schwartz J (309)Chen GB (6)
8Chen GB (8)Knibbs LD (303)Stafoggia M (6)
9Schwartz J (8)Reid CE (257)Wang YJ (6)
10Stafoggia M (8)Stafoggia M (252)De Hoogh K (5)
Table 5. Top 5 productive Countries.
RankCountry (NP)Country (TC)
1China (279)China (3168)
2USA (135)USA (2286)
3India (71)Australia (686)
4UK (33)UK (562)
5Spain (32)Italy (462)
Table 6. Ten most cited papers indexed in WoS.
RankPublication (Authors, Year, Source, TC) [Ref]
1Schneider A, 2010, Remote Sensing Environment, 414 [55]
2Morawska L, 2018, Environment International, 210 [56]
3Chen Gb, 2018, Science of Total Environment, 198 [57]
4Huang Cj, 2018, Sensors-Basel, 197 [58]
5Lu WZ, 2005, Chemosphere, 156 [59]
6Zimmerman N, 2018, Atmospheric Measurement Techniques, 152 [60]
7Beckerman BS, 2013, Environmental Science & Technology, 145 [61]
8Reid CE, 2015, Environmental Science & Technology, 118 [62]
9Zhan Y, 2017, Atmospheric Environment, 113 [63]
10Stafoggia M, 2019, Environment International, 113 [64]
Table 7. TopTen most influential journals.
RankJournals (NP)Journals (TC)
1Science of The Total Environment (39)Atmospheric Environment (800)
2Atmospheric Environment (32)Environment International (709)
3Environmental Pollution (28)Science of The Total Environment (702)
4IEEE Access (25)Environmental Pollution (625)
5Applied Sciences-Basel (23)Remote Sensing of Environment (440)
6Remote Sensing (23)Environmental Science Technology (346)
7International Journal of EnvironmentalResearch and Public Health (22)Journal Of Cleaner Production (324)
8Atmosphere (21)Atmospheric Chemistry and Physics (323)
9Environment International (21)Sensors (282)
10Journal Of Cleaner Production (20)IEEE Access (278)
Publisher’s Note: MDPI stays neutral with regard to jurisdictional claims in published maps and institutional affiliations.

