Review

Out-of-Distribution (OOD) Detection Based on Deep Learning: A Review

1
School of Information Science and Engineering, Yanshan University, Qinhuangdao 066004, China
2
Hebei Key Laboratory of Information Transmission and Signal Processing, Yanshan University, Qinhuangdao 066004, China
*
Author to whom correspondence should be addressed.
Electronics 2022, 11(21), 3500; https://doi.org/10.3390/electronics11213500
Submission received: 20 September 2022 / Revised: 25 October 2022 / Accepted: 27 October 2022 / Published: 28 October 2022

Abstract

:
Out-of-Distribution (OOD) detection separates ID (In-Distribution) data and OOD data from input data through a model. This problem has attracted increasing attention in the area of machine learning. OOD detection has achieved good intrusion detection, fraud detection, system health monitoring, sensor network event detection, and ecosystem interference detection. The method based on deep learning is the most studied in OOD detection. In this paper, related basic information on OOD detection based on deep learning is described, and we categorize methods according to the training data. OOD detection is divided into supervised, semisupervised, and unsupervised. Where supervised data are used, the methods are categorized according to technical means: model-based, distance-based, and density-based. Each classification is introduced with background, examples, and applications. In addition, we present the latest applications of OOD detection based on deep learning and the problems and expectations in this field.

1. Introduction

Although machine learning based on a neural network has made great progress, even surpassing human beings under experimental conditions, the many failed examples reveal the vulnerability of the model when dealing with different distributed data [1]. Therefore, Out-of-Distribution (OOD) detection based on deep learning has received more and more attention in machine learning [2]. In order to separate OOD samples more effectively, various improvement methods have been proposed by researchers.
In general, a new research direction has to go from simple to complex, from point to surface. OOD detection is still in the initial stage. Most studies use specific data. Therefore, according to the number of labeled data, they are divided into supervised, semisupervised, and unsupervised. In the supervised methods, all the training data are labeled. In unsupervised methods, all the training data are not labeled. In the semisupervised method, part of the training data is labeled and the other part is not labeled. Among them, supervised methods are the most common. In these supervised methods, model-based OOD detection methods usually rely on the Softmax scoring function from the penultimate layer or output layer of the neural network [3]. For any given test time input, all existing solutions require a complete feedforward channel and use a fixed amount of calculation [4]. Distance-based methods usually define proximity metrics between objects. OOD data are far away from most other objects. When the data can be presented in two-dimensional or three-dimensional scatter diagrams, distance-based Out-of-Distribution points can be visually detected [5]. In addition, the density estimation of objects can be calculated relatively directly, especially when there is a proximity measure between objects. Objects in low-density areas are relatively far from their neighbors and may be considered out-of-distribution points. This type of method is called density-based.
OOD detection is similar to a binary classification problem in output form. ID samples are easy to obtain, but OOD samples are difficult to obtain, so the number of pieces is imbalanced. In special cases, there may be no OOD samples at all in the training stage, and only ID samples participate in model training. To solve this problem, we need to use semisupervised methods, of which the most common is the autoencoder [6,7,8]. In recent years, with the continuous development of OOD detection, researchers are no longer satisfied with detecting specific samples. They hope that the model has good generalization capability. Zhou et al. [9] proposed to solve the problem of data generalization by Out-of-Distribution Knowledge Distillation (OKD) and achieved good results. Rather than focusing on the model structure, most recent works [10,11,12,13,14] have targeted improvements in the objective function over ERM (empirical risk minimization).
In this paper, the background of OOD detection is briefly introduced in Section 2. Section 3 gives an overview of OOD detection based on deep learning. Section 4, Section 5 and Section 6 introduce the different classifications of OOD detection based on deep learning. Section 7 presents the areas where OOD detection based on deep learning has been applied. Section 8 introduces the challenges of OOD detection.

2. Background

In this section, we present background information related to OOD detection in this survey and the dataset and evaluation metrics used.

2.1. Development Background of OOD Detection

OOD detection is developed based on anomaly detection. This paper lists some representative research results by timeline. In the early 1980s, Hawkins et al. [15] summarized the latest achievements of anomaly detection at that time and proposed the possible future development direction in combination with the defects of anomaly detection in several areas. Svante et al. [16] proposed PCA (principal component analysis). PCA is a dimensionality reduction method that is often used to reduce the dimensionality of high-dimensional data sets. It converts a large set of variables into a smaller set of variables while retaining most of the information in the set, so the calculation method is simplified. Corts et al. [17] proposed the classic support vector machine, which solved the binary classification problem in supervised learning. Liu et al. [18] presented the Isolation Forest, solving the problem of slow speed and poor accuracy when processing big data. In 2012, Krizhevsky et al. [19] presented the AlexNet, solving the vanishing gradient problem of Sigmaid when the network is deep. Kim et al. [20] combined CNN and NLP for feature extraction, solving the problem of not being able to capture the key features formed by continuous data. Schlegl et al. [21] proposed an anomaly detection model based on generative adversarial networks (GAN), which provides negative training for unsupervised learning. In 2017, Hendrycks et al. [22] proposed a baseline system for OOD detection. Liang et al. [23] improved the baseline and proposed the ODIN model, and Devries [4], Shalev [24], Denouden [6], and Abdelzad et al. [5] improved the baseline in different directions, ultimately improving the detection effect. Yang et al. [25] expounded on the definition, method, evaluation, impact, and future direction of the OOD generalization problem in a review.

2.2. Datasets of Reference

2.2.1. MNIST

The MNIST dataset is a classic dataset in machine learning. It consists of 60,000 training samples and 10,000 test samples. Each sample is a 28 × 28 pixels grayscale handwritten digital picture, as shown in Figure 1. Download address: http://yann.lecun.com/exdb/mnist/ (accessed 19 on September 2022).

2.2.2. CIFAR-10

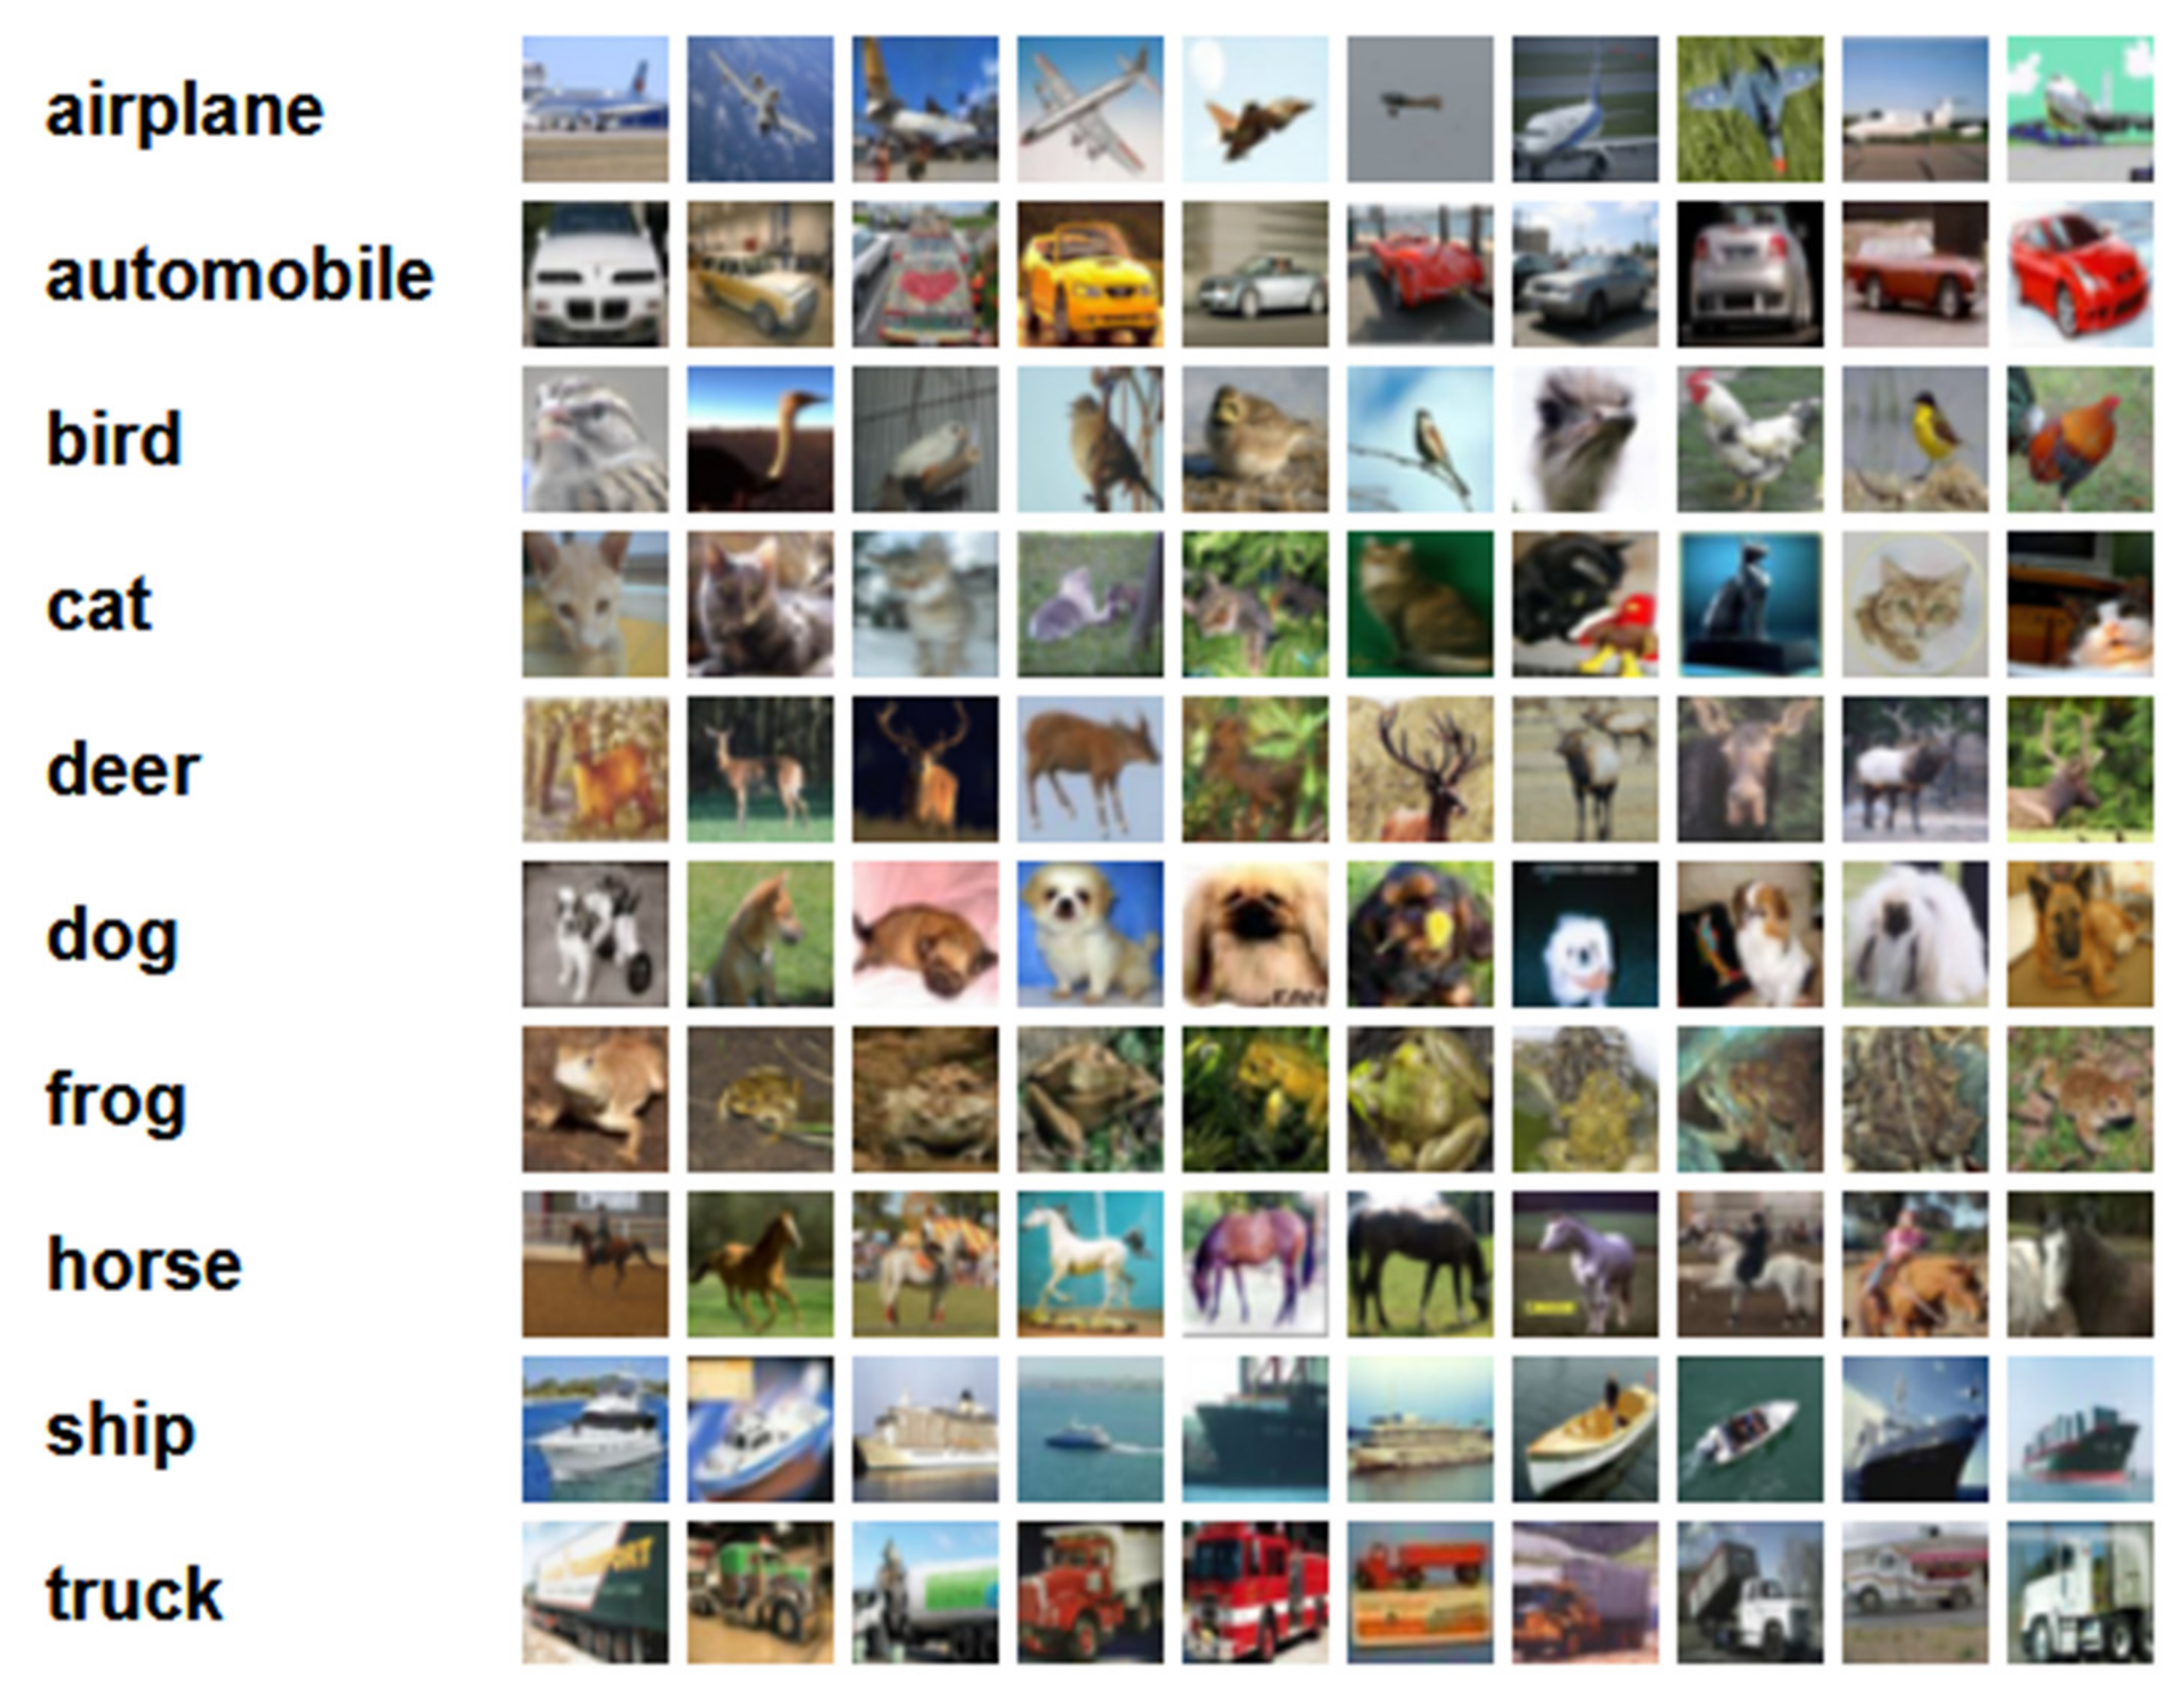
CIFAR-10 is a color image dataset closer to universal objects. CIFAR-10 is a small dataset compiled by Hinton students Alex Krizhevsky and Ilya Sutskever for identifying universal objects. It includes 10 categories of RGB color pictures: airplane, automobile, bird, cat, deer, dog, frog, horse, ship, and truck. The size of each print is 32 × 32, each category has 6000 images, and there are a total of 50,000 training pictures and 10,000 test pictures in the dataset, as shown in Figure 2. Download address: http://www.cs.toronto.edu/~kriz/cifar.html (accessed on 27 October 2022).

2.2.3. CIFAR-100

This dataset is like CIFAR-10, except it has 100 classes, and each class contains 600 images. Each category has 500 training images and 100 test images. The 100 classes in CIFAR-100 are divided into 20 superclasses. Each image has a label of its class and its superclass. Download address: http://www.cs.toronto.edu/~kriz/cifar.html (accessed on 27 October 2022).

2.3. Evaluation Metrics

There are several fixed detection indicators for OOD detection.
The true positive rate (TPR) is calculated as follows, where TP and FN represent true positives and false negatives, respectively:
T P R = T P T P + F N
The false positive rate (FPR) is calculated as follows, where FP and TN indicate false positives and true negatives, respectively:
F P R = F P F P + T N
The Area Under the Receiver Operating Characteristic curve (AUROC) represents the probability that the model ranks a random positive example more highly than a random negative example. Under ideal conditions, the expected score of AUROC is 100%. Area Under Precision–Recall (AUPR) is the area under the precision–recall curve reflecting the relationship between precision and recall, where precision is equal to TP/(TP + FP), and the recall rate is TP/(TP + FN). However, Hendrycks et al. [22] proposed that these are not objective and pointed out that the PR curve is related to identifying positive and negative samples. Therefore, they created two more modes to evaluate: AUPR In and AUPR Out. When the in-distribution samples are set to positive, the area under the precision-recall curve is called AUPR In. When the Out-of-Distribution samples are set to positive, the area under the precision-recall curve is called AUPR Out.

3. OOD Detection Based on Deep Learning

This section presents the definition of OOD detection based on deep learning and similar research. In addition, we present the categorization that we use to describe the methods.

3.1. Definition

The present popular deep learning methods include training data and test data. These data are ID (In Distribution) samples of IID (Independent Identical Distribution), but the application data re-input after model training is often uncontrollable in an actual application. In addition to the ID sample, the application data may be an OOD sample [26]. These OOD data may be caused by wrong data and new or unknown types of data. OOD detection’s main task is to focus on which data are different from all other data and make sure all such data are data-driven [27].

3.2. Related Works

3.2.1. Anomaly Detection

Anomaly detection (AD) aims to detect any anomalous samples that deviate from the predefined normality during testing [28]. The deviation can happen due to either a covariate shift or a semantic shift while assuming the other distribution shift does not exist. Atha et al. [29] used anomaly detection to evaluate metal surface corrosion. Patel et al. [30] addressed the problem of face spoof detection against print and replay attacks by anomaly detection. Other example applications include adversarial defense [31], image forensics [32], etc.

3.2.2. Novelty Detection

Novelty detection aims to detect any test samples that do not fall into any training category [33,34]. The rise in the use of police-operated surveillance cameras has outpaced the ability of humans to monitor them effectively. Idrees et al. [35] solved this problem with Novelty Detection. Kerner et al. [36] presented a system based on convolutional autoencoders for detecting novel features in multispectral images and applied the methodology to the detection of novel geological features in multispectral images of the Martian surface collected by the Mastcam imaging system on the Mars Science Laboratory Curiosity rover. Al-Behadili et al. [37] proposed an incremental Parzen window kernel density estimator (IncPKDE) that addresses the problems of data streaming using a model that is insensitive to the training set size and has the ability to detect novelties within multiclass recognition systems. Many conventional outlier detection tools are based on the assumption that the data are identically and independently distributed. Liu et al. [38] proposed an outlier-resistant data filter–cleaner.

3.2.3. Outlier Detection

Outlier detection aims to detect samples that are markedly different from the others in the given observation set, due to either covariate or semantic shift. Data closer in time are more correlated to each other than those farther apart. Basu et al. [39] proposed the problem of detecting unusual values or outliers from time series data. Machine learning-based strategies are examined by Xiao et al. [40] and are one type of Outlier Detection method.

3.2.4. Discussion

Anomaly detection is a technique for identifying abnormal situations and mining nonlogical data. Novelty detection finds novel data in the dataset that may belong to the classification but have not been seen. Outlier detection focuses on data points that are significantly different from other observations. Although the names of these terms are different, the core of their strategy is finding OOD samples. The difference between them is that the setting may be somewhat different [41]. Anomaly detection is generally a multicategory dataset (such as CIFAR10, which contains 10 categories). One or several are considered normal, and the other categories are considered abnormal. Out-of-Distribution detection usually uses a complete dataset as ID data and another complete dataset as OOD data (for example, CIFAR10 is ID data, while the SVHN dataset is OOD data).

3.3. Baseline Model

Background: In practical classification tasks, many highly reliable predictions are absurd and seriously wrong. So, if the classifier cannot accurately indicate when some errors occurred, which would cause serious problems, this system will be restricted in practical applications. To solve this problem, Hendrycks et al. [22] proposed an OOD detection baseline.
Application examples: Hendricks pointed out that the anomaly detection model gives misclassified samples and OOD samples a high softmax probability, so the softmax probability value cannot directly represent the confidence level of the model. The properly classified samples obtained a higher softmax probability value than the incorrectly classified and OOD samples.
Taking the image processing task as an example in the experimental process, three training sets were used: MINIST, CIFAR-10, and CIFAR-100. Naturally, the inputs consisting of the distribution of these three datasets were regarded as in-distribution. In order to construct test sets, Out-of-Distribution datasets for these were selected. The main contributions of the baseline can be summarized in three aspects:
(1)
Use softmax probability values of model predicted samples to detect OOD samples effectively;
(2)
OOD detection tasks and new evaluation indicators are developed;
(3)
A novel approach is proposed: determining whether a sample is abnormal by combining the output of a neural network with the quality of reconstructed samples.
Discussion: Experiments prove that the baseline can achieve a good recognition effect for different designated tasks, providing valuable ideas for end-to-end anomaly detection. In addition, it can be widely applied in many fields not limited to image processing and the natural language processing involved in the experiment.

3.4. Categorization

We refer to the classification method of Pang et al. [42] for anomaly detection. OOD detection can be classified by considering some criteria, such as:
  • The machine learning paradigm used: supervised, semisupervised, or unsupervised;
  • The different technical means: model, distance, or density.
The models used in the methods studied in this article are all based on deep learning. All methods are data-dependent because they have a training step. OOD detection is still in the initial experimental stage. There are few unsupervised methods in the existing research, so most of the methods discussed in this survey are supervised.

4. Supervised Methods

In this section, we present the supervised methods proposed in the literature for the problem of OOD detection according to the categorization adopted in this survey.

4.1. Model-Based Methods

4.1.1. Structure-Based Methods

Background: The probability output of the model does not directly represent the confidence level of the model. Therefore, the model can carry out OOD detection by learning the uncertain attributes of input samples. When testing data, if the data entered by the model are an ID sample, the uncertainty is low. Conversely, if the data entered by the model are an OOD sample, the uncertainty is high. This type of method needs to modify the network structure of the model to learn the uncertainty attribute [43].
Representative model: Devries et al. [4] proposed adding another branch to the original classification: a confidence branch to predict confidence c , where the input is x , the threshold value is θ , and the predicted probability is p .
p , c = f ( x , θ ) p i , c 0 , 1 , i = 1 M p i = 1
During the training process, the network is indicated by interpolation, and the confidence is used to adjust the softmax prediction probability. In order to avoid some extreme situations in the network, for example, c always takes a value of 0, the confidence loss is added as a logarithmic penalty, and the confidence is always set to 1 (high confidence). After the training is completed, when the OOD sample is judged by loss estimation, the function is directly evaluated.
The model continuously improves classification performance through training and measures whether the input data are an ID sample based on confidence.
Application examples: Guénais et al. [44] proposed a Bayesian framework to obtain reliable uncertainty estimates for deep classifiers. Their approach consists of a plug-in “generator” used to augment the data with an additional class of points on the boundary of the training data, followed by Bayesian inference on top of features trained to distinguish these “out-of-distribution” points. A new nondistributed classifier based on policy entropy has been proposed by Andreas et al. [45]. This method uses policy entropy as the classification score of a class of classifiers, which can reliably detect states that are not encountered in deep reinforcement learning.

4.1.2. Threshold-Based Methods

Background: The OOD detection baseline uses the pretraining model’s maximum softmax probability of the output signal to conduct statistical analysis and judge the softmax probability distribution of OOD samples and ID samples. The distance between OOD samples and ID samples can be further expanded and then selects an appropriate threshold to evaluate the sample distribution.
Representative model: Liang et al. [23] proposed ODIN (Out-of-Distribution detector for Neural networks) based on the baseline, mainly using temperature scaling and input processing to improve the performance of OOD detection.
f = f 1 , , f N , where N represents the classification number. ε is the perturbation magnitude.
Temperature scaling:
p i ( x ; T ) = exp ( f i ( x ) / T ) j 1 N exp ( f i ( x ) / T )
Input processing:
x ¯ = x ε s i g n ( x log p y ^ ( x ; T ) )
ODIN uses temperature scaling and input processing to expand the softmax distribution difference between ID samples and OOD samples.
Application examples Hsu et al. [3] proposed a decomposition confidence score and an improved preprocessing method based on ODIN, making significant breakthroughs in semantic transfer and nonsemantic transfer. Zhou et al. [46] proposed contrast loss, which can improve the compactness of the representation so that OOD instances can be better distinguished from cases in the distribution. Xin et al. [47] proposed a method that introduced Channel Mean Deviation (CMD), a model-agnostic distance metric, to evaluate the statistics of the features extracted by the classification model. Single image detection is achieved by using a lightweight channel sensitivity adjustment model, which is an improvement on other statistical detection methods. A summary of similar methods since 2020 for the category is shown in Table 1.

4.2. Distance-Based Methods

Background: This method is relatively straightforward, using a classifier to classify the extracted features to determine whether it is an OOD sample. Some methods modify the network structure to be a class classifier, which is the number of categories of the original classification task, and the first class is the OOD class. Some methods directly extract the features for classification without modifying the network structure. Although this method is straightforward, it has achieved good results.
Representative model: Abdelzad et al. [5] proposed the OODL (Out-of-Distribution discernment layer) method, which can distinguish OOD samples very easily by selecting specific and easily distinguishable layer output characteristics. Based on this, input and output data from different layers are extracted. The method uses a one-class SVM classifier, counts the classification error rate of this layer, and then selects the layer with the smallest error to detect OOD samples.
A preprocessing method to obtain x is also proposed by adding a small perturbation to each input x . Then, we used the feature x for detection.
Denote as Q i the output of network Q for class i . ε is the perturbation magnitude.
x = x ε   s i g n ( x log p ( max i Q i x ) )
Application examples: Xu et al. [72] constructed a Latent Sequence Gaussian Mixture (LSGM) model to describe how the latent features in the distribution are generated across the representation space based on the traces of DNN inference. Chen et al. [73] proposed learning a shared latent space on a unit hypersphere. By using class centers and boundaries, invisible samples can be separated from visible samples.

4.3. Density-Based Methods

Background: The softmax confidence of any pretrained neural network could be replaced with an energy function. Compared with other anomaly detection methods that use pretrained models, this method does not need to adjust other model parameters due to the parameter-free feature of the energy measurement. This is different from the softmax confidence score. The probability density is aligned. Therefore, anomaly detection performance can be significantly improved.
Representative model: Li et al. [27] proposed an energy-based anomaly detection framework. OOD detection can be regarded as a binary classification problem. For the input sample model, a score value needs to be given to measure the degree of deviation of the current sample from the normal distribution. The intuitive method is to use density estimation. The energy function is used to build the density function of the model:
E x ; f represents the energy score of input x and neural network f . T is the temperature parameter.
p x = e E x ; f / T x e E x ; f / T
Application examples: Zisselman et al. [74] introduced the residual flow, a novel flow architecture that learns the residual distribution from a base Gaussian distribution. Zong et al. [75] presented a Deep Autoencoding Gaussian Mixture Model (DAGMM) for unsupervised anomaly detection. The joint optimization, which balances autoencoding reconstruction, density estimation of latent representation, and regularization, helps the autoencoder escape from less attractive local optima and further reduces reconstruction errors, avoiding the need for pretraining. Ren et al. [76] proposed a likelihood ratio method for deep generative models, which effectively corrects for these confounding background statistics.

4.4. Performance Comparison

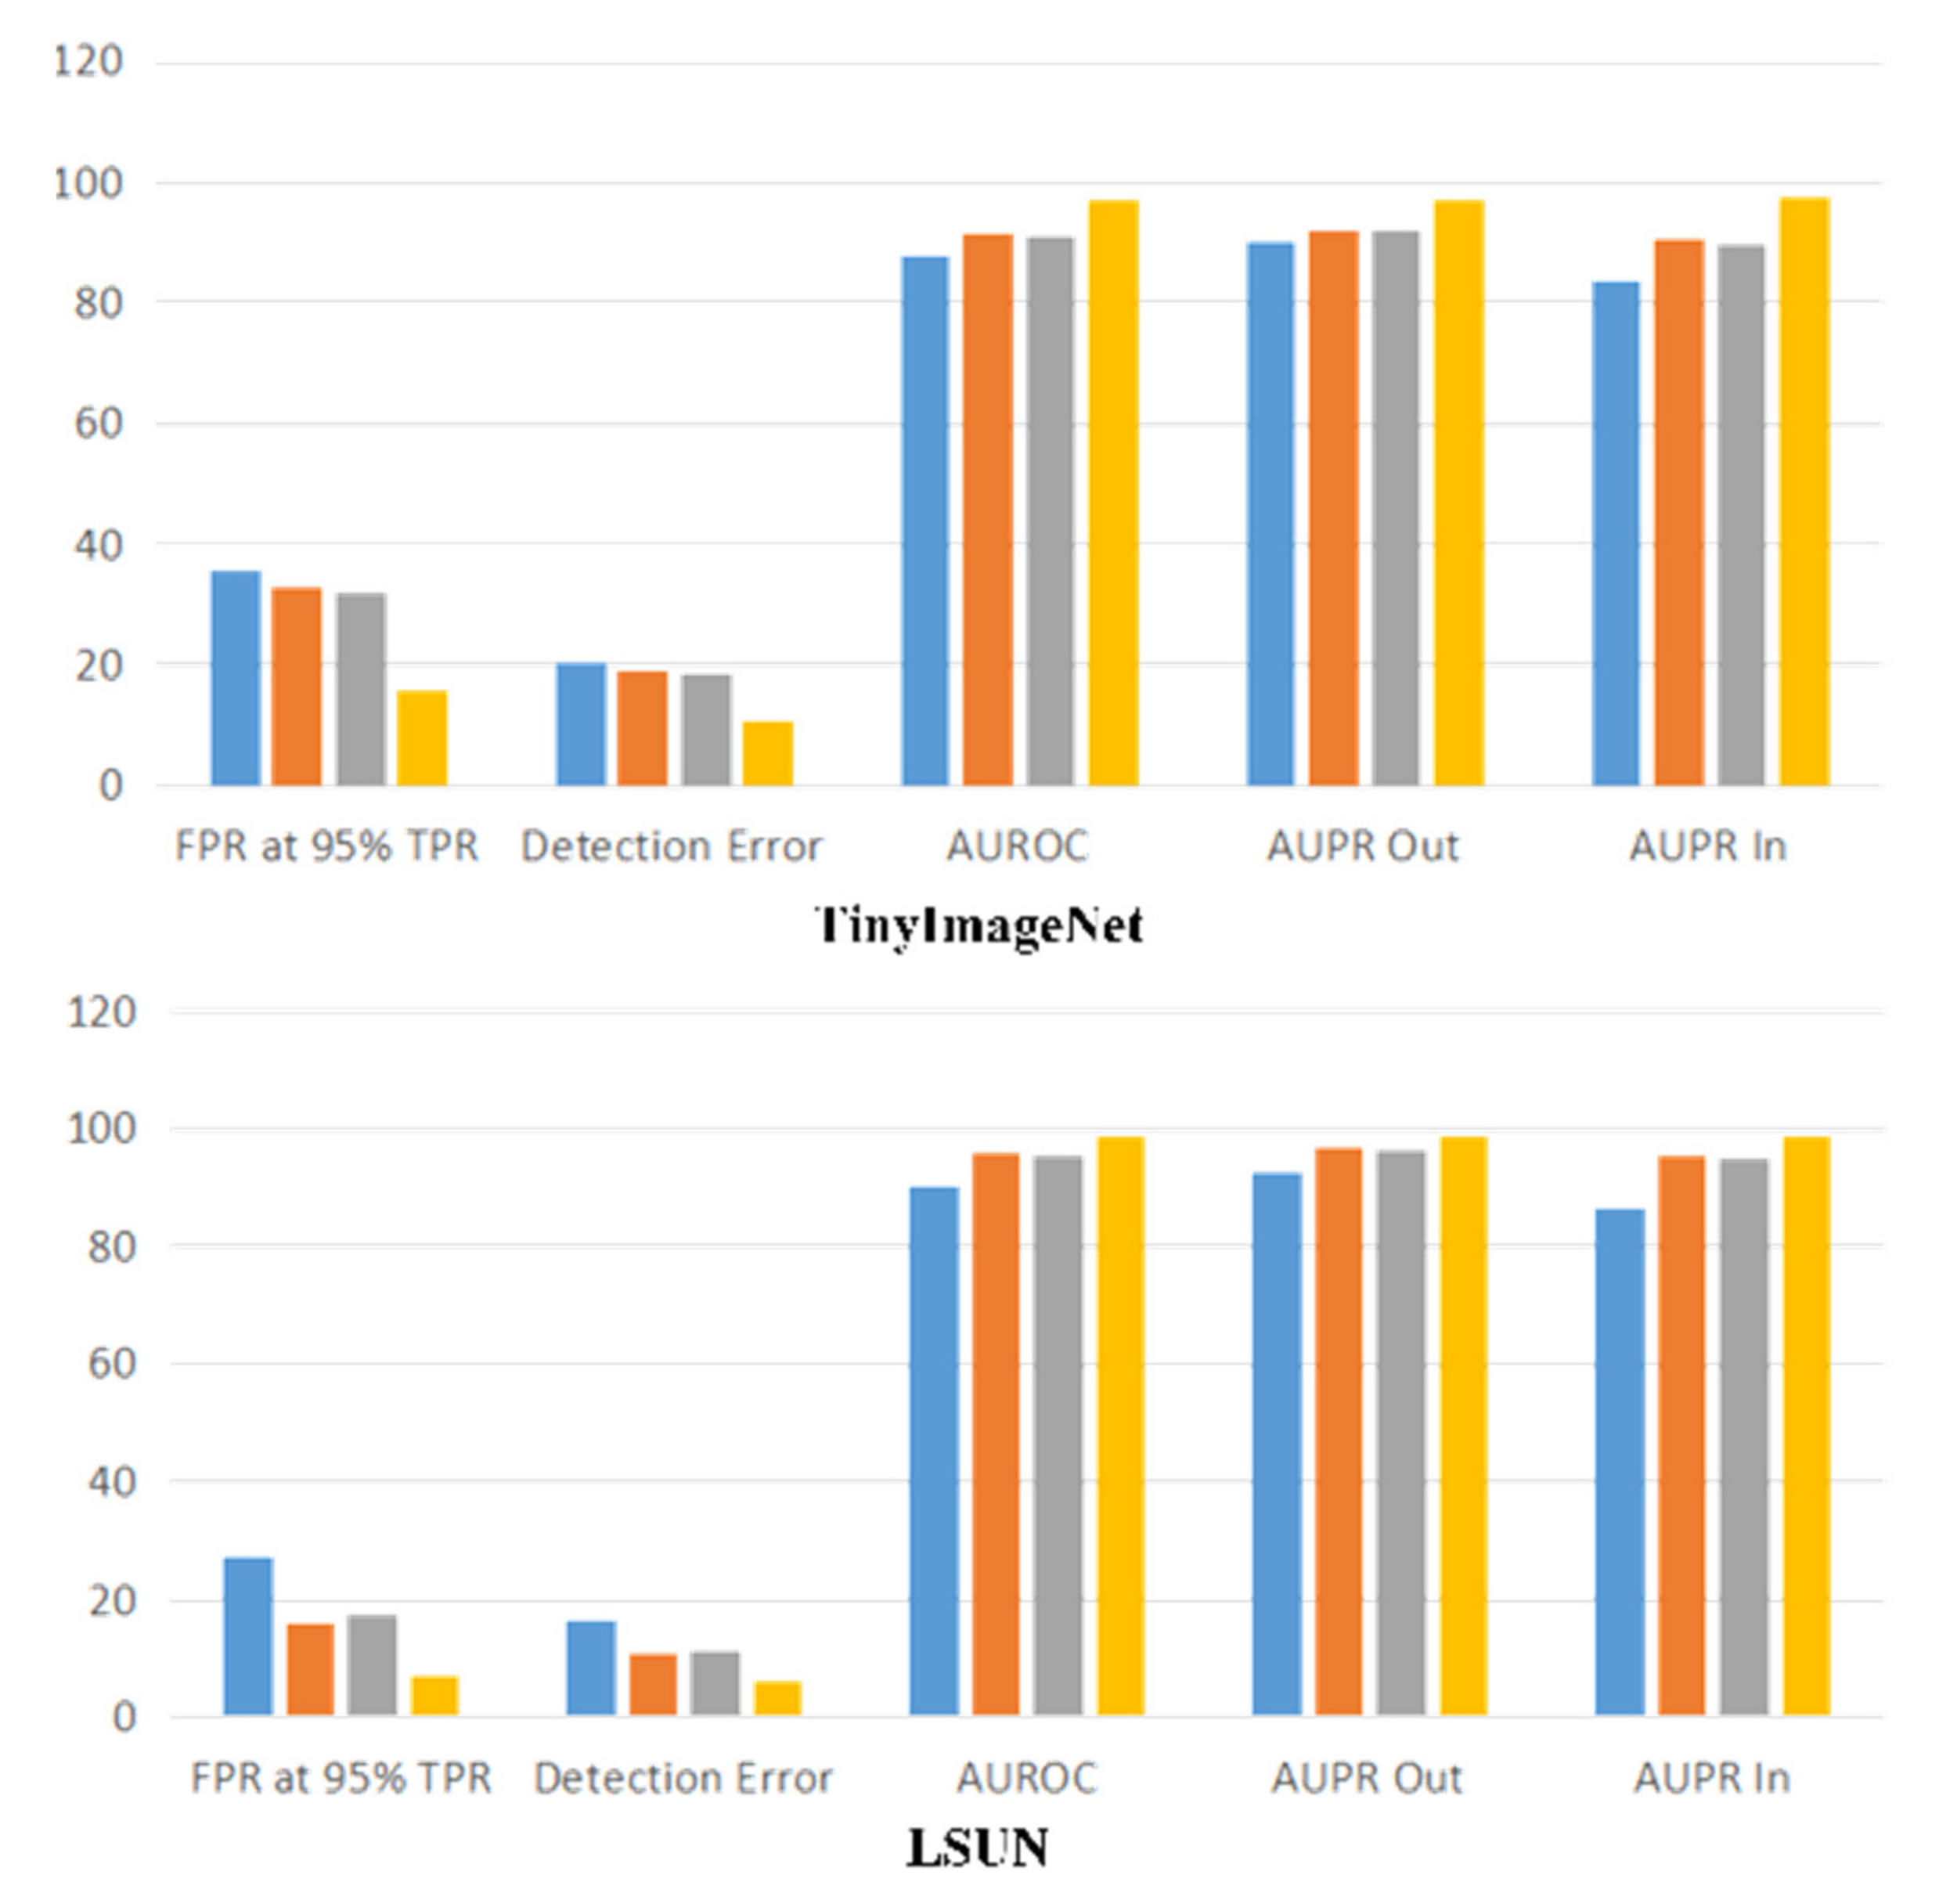
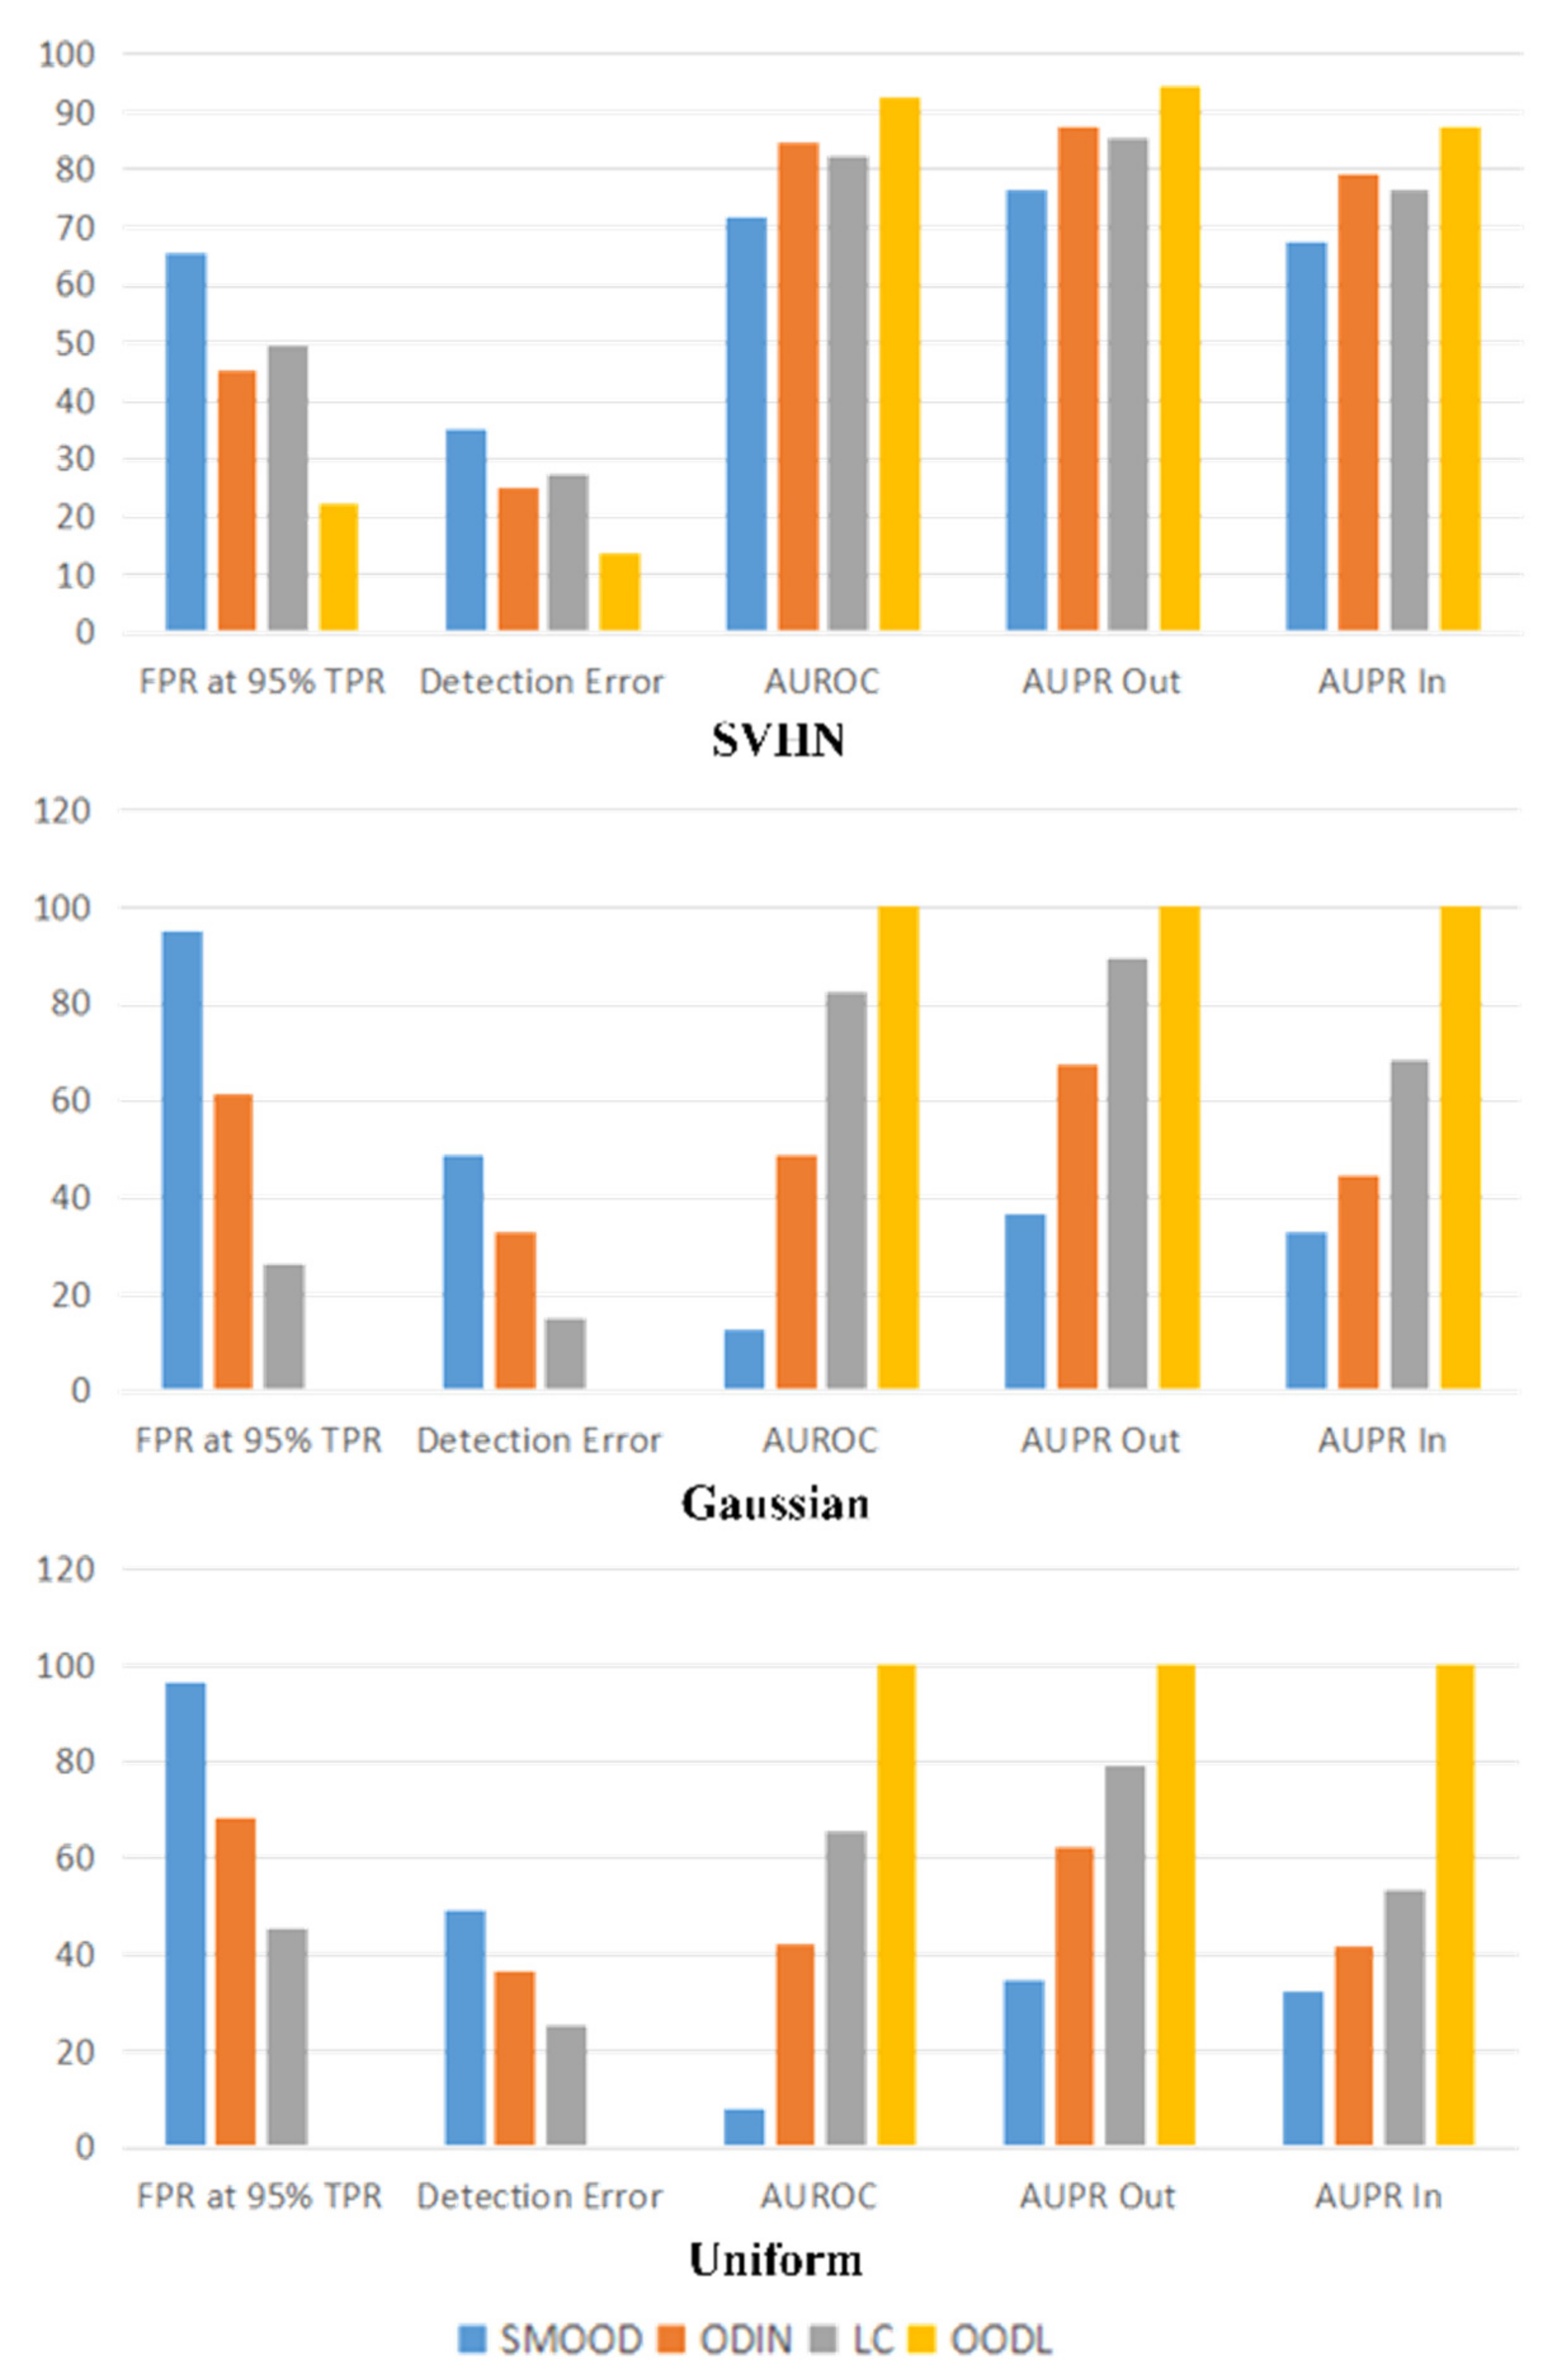
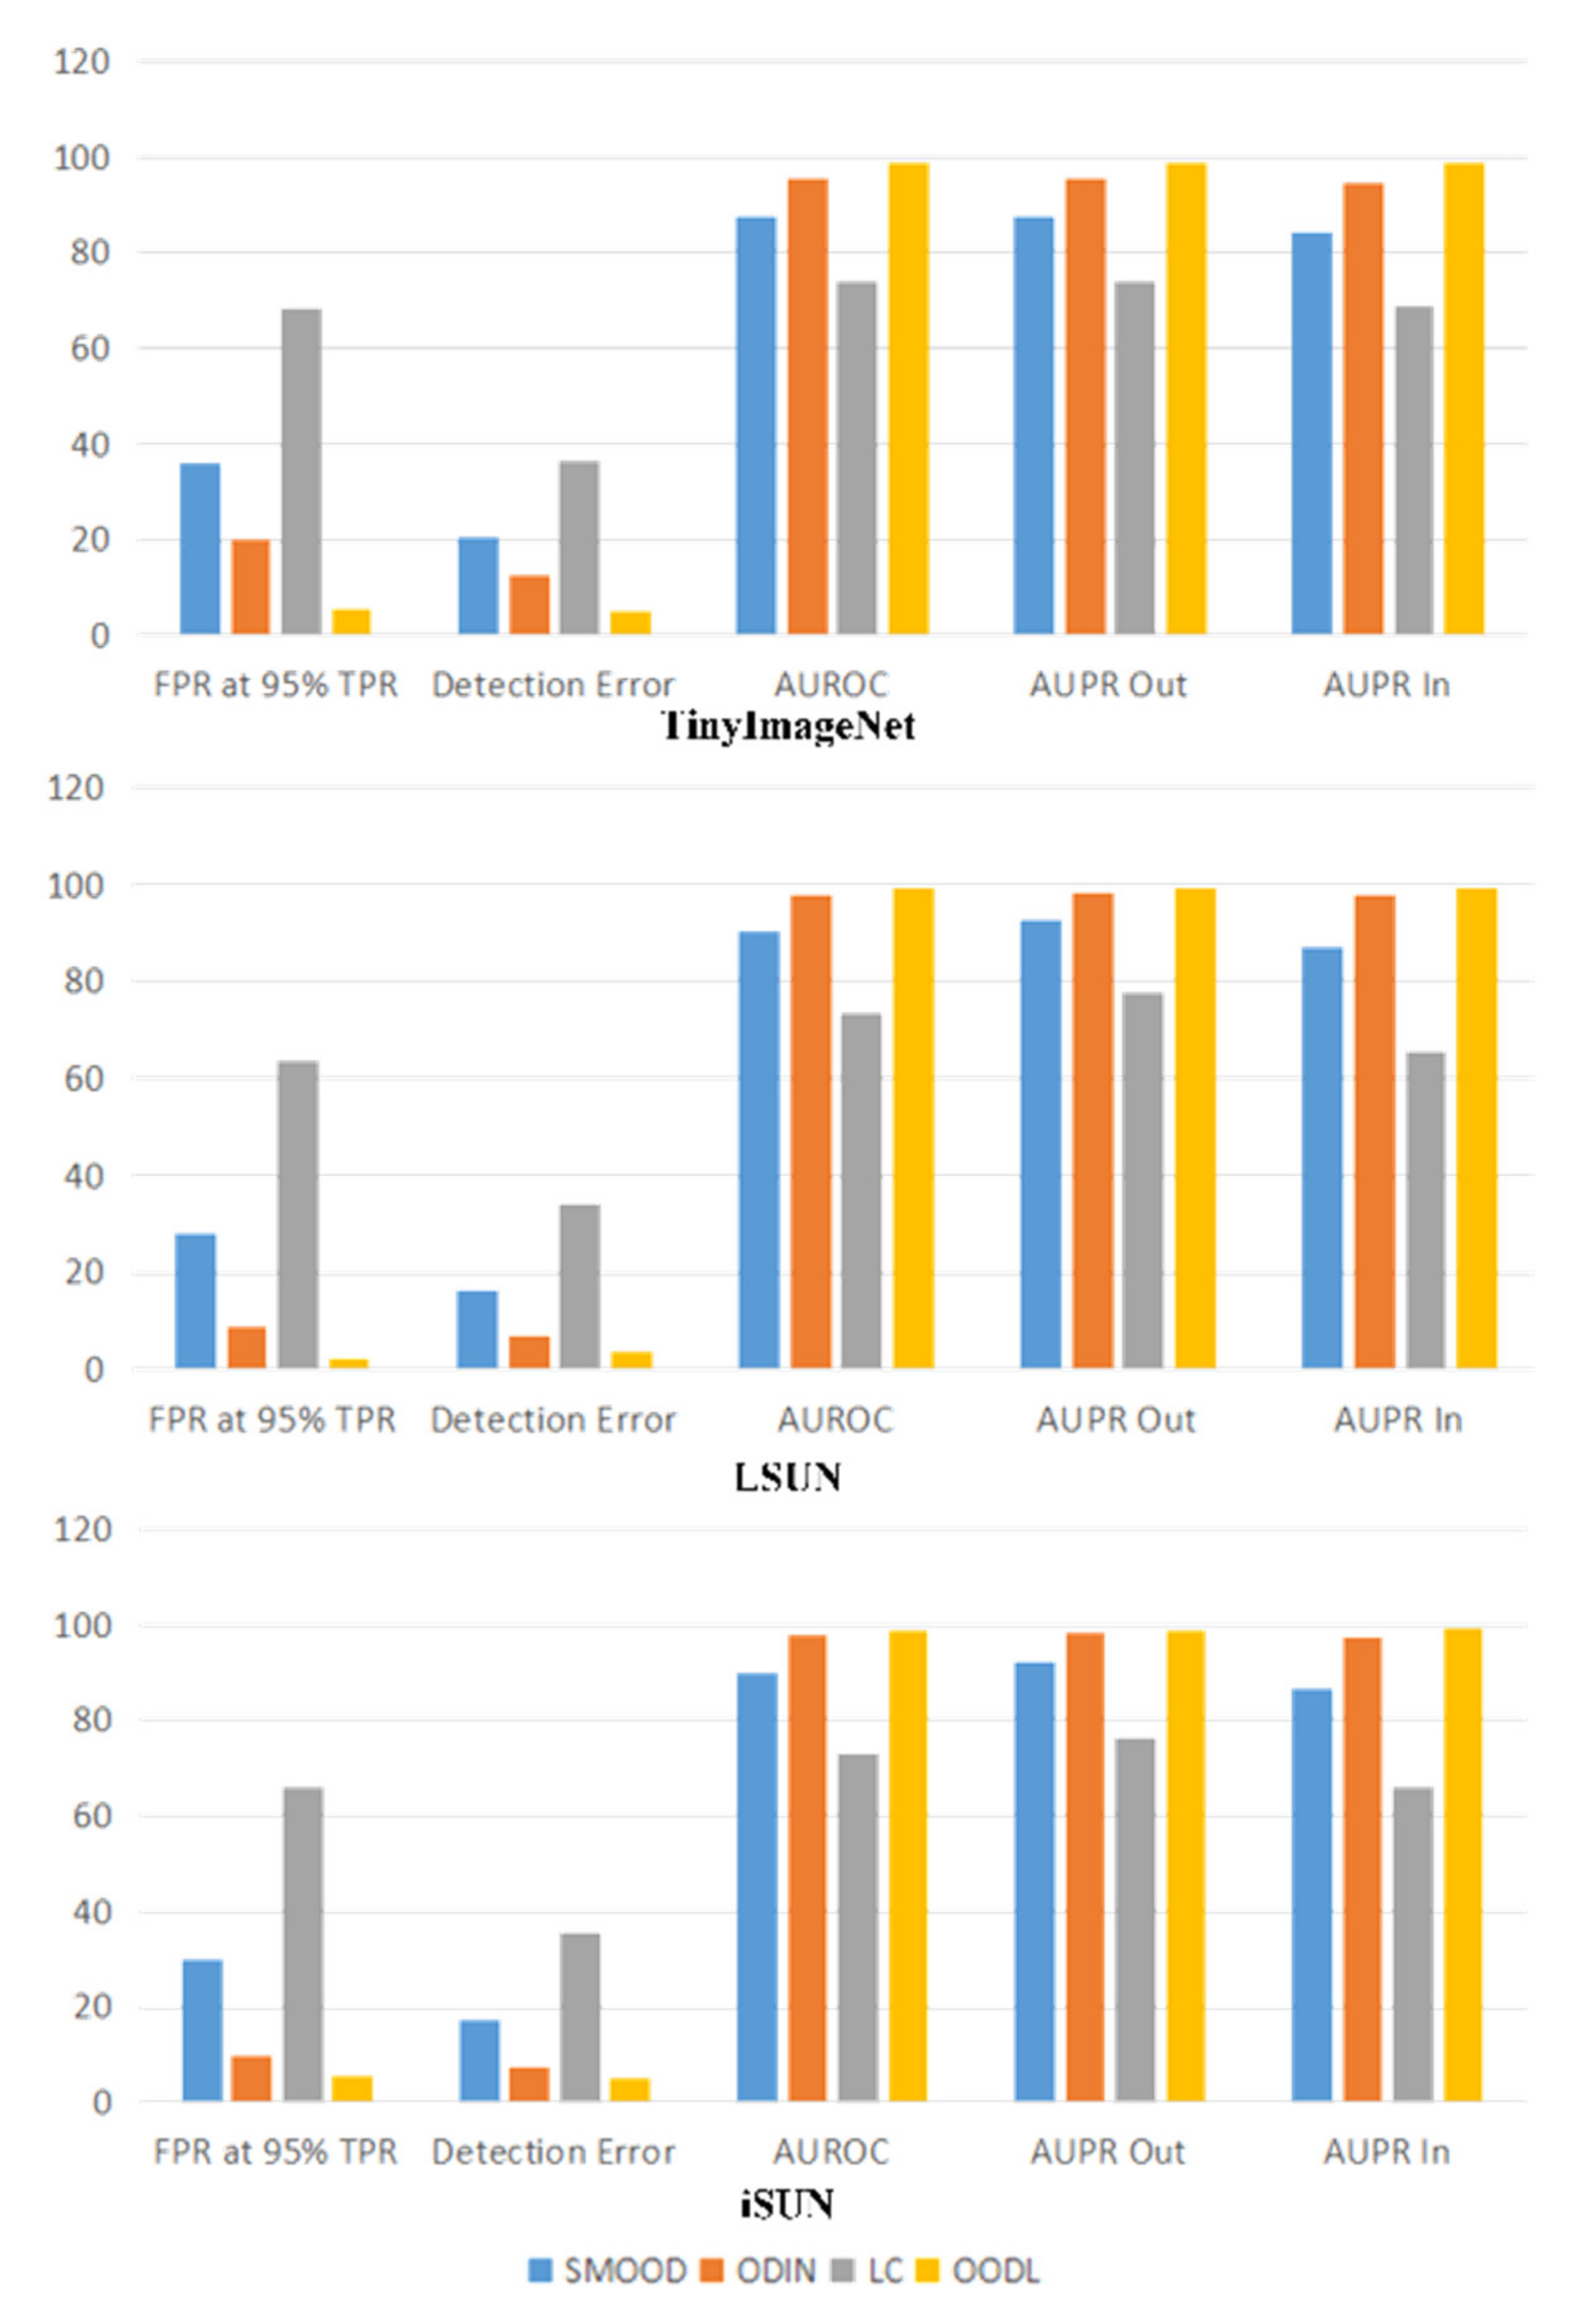
In this section, many representative models are based on the baseline system. In order to fully understand the performance, we used the same dataset for comparative experiments. Figure 3, Figure 4, Figure 5 and Figure 6 show the results of the representative methods of each classification under the CIFAR-10 and CIFAR-100 datasets. SMOOD is the OOD detection baseline, and ODIN, LC, and OODL are the representative models of Section 4.1.2, Section 4.1.1, and Section 4.2, respectively. The results show that the OODL effect of distinguishing the layer by finding the appropriate features is the best. Other methods with more classifications have a worse effect; the most they can reach is double the gap. OODL performance is very stable. The difference in the impact of the two datasets is about 10%, and OODL achieved a 100% correct effect on multiple projects. Two innovation modules increase the distance between ID data and OOD data, so the effect of ODIN is better in most cases (except Gaussian and Uniform). Although there is a gap with OODL, the structure is simpler and does not re-quire major changes to the original framework. LC focuses on the precise positioning of the decision boundary. The problem of the data near the classification boundary being difficult to distinguish has not been solved, so the effect of LC is only better than that of the baseline system. OODL inherits the advantages of ODIN and traverses all convolution layers to find the feature layer most suitable for ID and OOD data classification, so it has achieved the best results.

5. Semisupervised Methods

Background: This method mainly uses the reconstruction error of the autoencoder to determine whether it is an ID sample or an OOD sample. The latent space of the autoencoder can learn the obvious characteristics (silence vector) of ID data. Still, the OOD sample cannot, so the OOD sample will produce a higher reconstruction error. This type of method only focuses on OOD detection performance, without paying attention to the original task of ID data.
With the method based on VAE reconstruction, it is difficult to capture some specific abnormal samples. These samples are far from the known samples in the latent space, but they are very close to the hidden manifold.
The problem can be solved by increasing the dimension of the hidden space to capture more variation in the original data. However, this slowly deprives the model of the ability to distinguish between ID samples and OOD samples, because when the hidden space dimension is large enough, it can theoretically reconstruct any input.
Representative model: Denouden et al. [6] used the Mahalanobis distance to measure the distance between a sample x and the ID training data in the manifold space:
D M ( x ) = ( x μ ) T 1 ( x μ )
where μ ^ and Σ ^ are the mean and covariance matrices of the multivariate Gaussian distribution. The Mahalanobis distance is a constant scale and can consider the relationship between different dimensions. Finally, the reconstruction error and Mahalanobis distance can be used to detect OOD samples:
D m represents the Mahalanobis distance. α and β are mixing parameters that were determined using a validation set of samples.
n o v e l t y ( x ) = α D M ( E ( x ) ) + β ( x , D ( E ( x ) ) )
Application examples: In addition to methods based on reconstruction and distance, another method is to generate some samples to surround the entire ID data manifold, train a classifier to get the dividing line of the package ID data manifold, and finally detect the OOD samples through the dividing line. Victor et al. [77], inspired by the success of variational autoencoders (VAEs) in machine learning, proposed iterative extensions of VAEs (iVAEs). Ran et al. [78] proposed an improved noise contrast prior (INCP) method to obtain reliable uncertainty estimates of standard VAE. By combining INCP with VAE, the differences between OOD and ID input can be captured and distinguished.

6. Generalization Detection

Background: The generalization problem based on OOD detection has been raised in recent years. Yang et al. [25] have already conducted a review, so we only give a simple example to illustrate.
Application examples: Zhang et al. [79] articulated and demonstrated the functional lottery ticket hypothesis: a full network contains a subnetwork that can achieve better OOD performance. They provided Modular Risk Minimization (MRM) to find these “tickets”.
The MRM algorithm is divided into four steps:
(1)
Determine the logits π of the data, network, and subnetwork. Logit is a random distribution used to generate the mask. For example, if the network layer l has n l parameters, then π l R n i . The mask of this layer is obtained by sampling s i g m o d π l , and the mask m transforms the complete network into a subnetwork;
(2)
Initialize the model and then use the ERM target to train N 1 steps;
(3)
Sample subnetworks from the entire network, combining cross-entropy and sparse regularization as a loss function to learn an effective subnetwork structure;
(4)
It is only necessary to use the weights in the obtained subnet to re-train and fix the other weights to zero.
Discussion: The major finding of the study is that MRM and the current mainstream research direction (modifying the objective function) are orthogonal. No matter the objective function, MRM can find such subnetworks with stronger generalization ability.

7. Already Applied Fields

7.1. Data Migration

With the emergence of more and more machine learning application scenarios and the existing better-performing supervised learning requiring a large amount of labeled data, labeling data is a tedious and costly task, so transfer learning is receiving more and more attention. Transfer learning refers to transferring a neural network originally used for a specific task to another new field to perform a new task [80]. The difficulty is finding the characteristic points of the new task. Xu et al. [81] introduced a simple, robust estimation criterion—transfer risk—specifically geared towards optimizing transfer to new environments. The criterion amounts to finding a representation that minimizes the risk of applying any optimal predictor trained on one environment to another. This method performs well in various Out-of-Distribution generalization tasks.

7.2. Fault Detection

When a machine is working, abnormal vibration can be used as an important feature to diagnose the working state of the machine. Normally working machines’ vibrations are smooth and regular. If a machine fails, there will be obvious abnormal vibrations. It is difficult for us to collect abnormal vibration samples in actual situations. The main reasons are as follows: (1) The industry that uses large machinery does not allow the machine to stop suddenly. (2) Most machine failures occur slowly. The uncertainty causes us to be unable to correctly estimate the time when the fault occurred, making it extremely difficult to collect data. (3) The complexity of the production environment and the influence of noise make the results produced by different environments different. Based on the Monte Carlo dropout method, Jin et al. [82] proposed a novel approach to augmenting the classification model with an additional unsupervised learning task.

7.3. Medical Image Processing

In medical imaging, the accurate diagnosis and evaluation of diseases depend on the collection and interpretation of medical images. Image acquisition has significantly improved in recent years, with equipment acquiring data at a faster rate and higher resolution. However, the image interpretation process has only recently benefited from computer technology. Doctors mostly perform the interpretation of medical images. However, medical image interpretation is limited by physician subjectivity, cognitive differences, and fatigue. Muhammad et al. [83] proposed an approach to robustly classify OOD samples in skin and malaria images without accessing labeled OOD samples during training. This method has reached its most advanced level in detecting skin cancer and malaria.
In addition to the application areas listed, with the continuous maturity of OOD detection technology based on deep learning, it is being applied in more and more fields. We summarize these applications in recent years in Table 2.

8. Challenges

OOD detection has made great progress. However, some challenges still need to be addressed to make OOD detection more effective and widely used. As a result, both the research community and society will benefit.
OOD detection based on deep learning has solved many practical problems but still faces many challenges, especially in the detection of unsupervised data. How to reduce false positives and enhance detection recall rates is one of the most important yet difficult challenges. Unsupervised methods do not have any prior knowledge of true anomalies. They rely heavily on the assumption of the distribution of anomalies. Moreover, there are unlabeled data affected by noise in unsupervised data. They may be accurately detected or incorrectly labeled, and noisy instances may be irregularly distributed in the data space. In addition, OOD detection based on deep learning works well in low-dimensional space, but OOD features are not obvious in high-dimensional space, and most methods are for point features. The detection of conditional features and group features are problems that need to be solved.

9. Conclusions

This work focuses on three categories of OOD detection based on supervised data—the model method, the distance method, and the density method—showing how each technique can distinguish OOD data from original data. In addition, we discuss their performance under the same data and model. In general, approaches are more concerned with improving the recognition effect, while failing to address space costs and efficiency issues. In this final section, we will present open issues and future research opportunities.
With the rise of deep learning, there has been a breakthrough in the performance of many tasks. OOD detection based on a deep model is of great significance to the development of AI, especially in the field of AI security. We are in an era of big data, and simply relying on manual processing speed does not meet the needs of society. Because not all data are supervised data and identically distributed, OOD detection can identify OOD samples in the input data in advance, thus helping the model to detect anomalies in the data faster, greatly reducing the model’s error rate and reducing the loss caused by practical applications. In addition, OOD detection plays an irreplaceable role in banking, transportation, medical treatment, network, and other fields. The emerging field of OOD detection is worthy of further research. However, in reality, there are not many researchers engaged in this field, and the number of related papers published is small, which leads to the slow development of this field. We hope through this review to comprehensively introduce OOD detection and attract more people to devote themselves to research in this field.

Author Contributions

Supervision, Conceptualization, Review, J.W.; Formal analysis, Methodology, Writing, P.C.; Funding acquisition, P.C. All authors have read and agreed to the published version of the manuscript.

Funding

This research received no external funding.

Institutional Review Board Statement

Not applicable.

Informed Consent Statement

Not applicable.

Conflicts of Interest

The authors declare no conflict of interest.

References

  1. Geirhos, R.; Jacobsen, J.-H.; Michaelis, C.; Zemel, R.; Brendel, W.; Bethge, M.; Wichmann, F.A. Shortcut learning in deep neural networks. Nat. Mach. Intell. 2020, 2, 665–673. [Google Scholar] [CrossRef]
  2. Berend, D.; Xie, X.; Ma, L.; Zhou, L.; Liu, Y.; Xu, C.; Zhao, J. Cats Are Not Fish: Deep Learning Testing Calls for Out-Of-Distribution Awareness. In Proceedings of the 2020 35th IEEE/ACM International Conference on Automated Software Engineering (ASE), Melbourne, VIC, Australia, 24 December 2020; pp. 1041–1052. [Google Scholar] [CrossRef]
  3. Hsu, Y.C.; Shen, Y.; Jin, H.; Kira, Z. Generalized ODIN: Detecting Out-of-Distribution Image Without Learning from Out-of-Distribution Data. In Proceedings of the 2020 IEEE/CVF Conference on Computer Vision and Pattern Recognition (CVPR), Seattle, WA, USA, 13–19 June 2020; pp. 10948–10957. [Google Scholar] [CrossRef]
  4. Devries, T.; Taylor, G.W. Learning confidence for out-of-distribution detection in neural networks. arXiv 2018, arXiv:1802.04865. [Google Scholar] [CrossRef]
  5. Abdelzad, V.; Czarnecki, K.; Salay, R.; Denounden, T.; Vernekar, S.; Phan, B. Detecting Out-of-Distribution Inputs in Deep Neural Networks Using an Early-Layer Output. arXiv 2019, arXiv:1910.10307. [Google Scholar] [CrossRef]
  6. Denouden, T.; Salay, R.; Czarnecki, K.; Abdelzad, V.; Phan, B.; Vernekar, S. Improving reconstruction autoencoder out-of-distribution detection with mahalanobis distance. arXiv 2018, arXiv:1812.02765. [Google Scholar] [CrossRef]
  7. Dillon, B.M.; Favaro, L.; Plehn, T.; Sorrenson, P.; Krämer, M. A Normalized Autoencoder for LHC Triggers. arXiv 2022, arXiv:2206.14225. [Google Scholar] [CrossRef]
  8. Hoffman, S.C.; Wadhawan, K.; Das, P.; Sattigeri, P.; Shanmugam, K. Causal Graphs Underlying Generative Models: Path to Learning with Limited Data. arXiv 2022, arXiv:2207.07174. [Google Scholar] [CrossRef]
  9. Zhou, K.; Zhang, Y.; Zang, Y.; Yang, J.; Change Loy, C.; Liu, Z. On-Device Domain Generalization. arXiv 2022, arXiv:2209.07521. [Google Scholar] [CrossRef]
  10. Rosenfeld, E.; Ravikumar, P.; Risteski, A. Domain-Adjusted Regression or: ERM May Already Learn Features Sufficient for Out-of-Distribution Generalization. arXiv 2022, arXiv:2202.06856. [Google Scholar] [CrossRef]
  11. Krueger, D.; Caballero, E.; Jacobsen, J.-H.; Zhang, A.; Binas, J.; Zhang, D.; Le Priol, R.; Courville, A. Out-of-Distribution Generalization via Risk Extrapolation (REx). arXiv 2020, arXiv:2003.00688. [Google Scholar] [CrossRef]
  12. Arjovsky, M.; Bottou, L.; Gulrajani, I. Invariant Risk Minimization Games. In Proceedings of the International Conference on Machine Learning (ICML), Vienna, Austria, 12–18 July 2020. [Google Scholar] [CrossRef]
  13. Koyama, M.; Yamaguchi, S. When is invariance useful in an Out-of-Distribution Generalization problem? arXiv 2020, arXiv:2008.01883. [Google Scholar] [CrossRef]
  14. Adragna, R.; Creager, E.; Madras, D.; Zemel, R. Fairness and Robustness in Invariant Learning: A Case Study in Toxicity Classification. arXiv 2020, arXiv:2011.06485. [Google Scholar] [CrossRef]
  15. Auth, H.D.M. Identification of Outliers; Springer Dodrecht: Dodrecht, The Netherlands, 1980. [Google Scholar] [CrossRef]
  16. Wold, S.; Esbensen, K.; Geladi, P. Principal Component Analysis. In Chemometrics & Intelligent Laboratory Systems; Elsevier: Amsterdam, The Netherlands, 1987. [Google Scholar] [CrossRef]
  17. Cortes, C.; Vapnik, V.N. Support Vector Networks. Mach. Learn. 1995, 20, 273–297. [Google Scholar] [CrossRef]
  18. Liu, F.T.; Ting, K.M.; Zhou, Z.H. Isolation Forest. In Proceedings of the 2008 Eighth IEEE International Conference on Data Mining, Pisa, Italy, 15–19 December 2008. [Google Scholar] [CrossRef]
  19. Krizhevsky, A.; Sutskever, I.; Hinton, G. Imagenet classification with deep convolutional neural networks. Commun. ACM 2017, 60, 1097–1105. [Google Scholar] [CrossRef] [Green Version]
  20. Kim, Y. Convolutional Neural Networks for Sentence Classification. arXiv 2014, arXiv:1408.5882. [Google Scholar] [CrossRef]
  21. Schlegl, T.; Seebck, P.; Waldstein, S.M.; Langs, G.; Schmidt-Erfurth, U. f-AnoGAN: Fast Unsupervised Anomaly Detection with Generative Adversarial Networks. Med. Image Anal. 2019, 54, 30–44. [Google Scholar] [CrossRef]
  22. Hendrycks, D.; Gimple, K. A Baseline for Detecting Misclassified and Out-of-Distribution Examples in Neural Networks. ICLR. April arXiv 2016, arXiv:1610.02136. [Google Scholar] [CrossRef]
  23. Liang, S.; Li, Y.; Srikant, R. Principled detection of out-of-distribution examples in neural networks. arXiv 2017, arXiv:1706.02690. [Google Scholar] [CrossRef]
  24. Shalev, G.; Adi, Y.; Keshet, J. Out-of-distribution Detection using Multiple Semantic Label Representations. Adv. Neural Inf. Process. Syst 2018, 31, 7375–7385. [Google Scholar] [CrossRef]
  25. Yang, J.; Zhou, K.; Li, Y.; Liu, Z. Generalized Out-of-Distribution Detection: A Survey. arXiv 2021, arXiv:2110.11334. [Google Scholar] [CrossRef]
  26. Ye, H.; Xie, C.; Cai, T.; Li, R.; Li, Z.; Wang, L. Towards a Theoretical Framework of Out-of-Distribution Generalization. arXiv 2021, arXiv:2106.04496v2. [Google Scholar] [CrossRef]
  27. Liu, W.; Wang, X.; Owens, J.D.; Li, Y. Energy-based Out-of-distribution Detection. arXiv 2020, arXiv:2010.03759v4. [Google Scholar] [CrossRef]
  28. Chandola, V.; Banerjee, A.; Kumar, V. Anomaly Detection: A Survey. Acm Comput. Surv. 2009, 41, 1–58. [Google Scholar] [CrossRef]
  29. Atha, D.J.; Jahanshahi, M.R. Evaluation of deep learning approaches based on convolutional neural networks for corrosion detection. Struct. Health Monit. 2018, 17, 1110–1128. [Google Scholar] [CrossRef]
  30. Patel, K.; Han, H.; Jain, A.K. Secure face unlock: Spoof detection on smartphones. IEEE Trans. Inf. Forensics Secur. 2016, 10, 2268–2283. [Google Scholar] [CrossRef]
  31. Akcay, S.; Atapour-Abarghouei, A.; Breckon, T.P. GANomaly: Semi-supervised Anomaly Detection via Adversarial Training. In Proceedings of the 14th Asian Conference on Computer Vision (ACCV), Perth, Australia, 2–6 December 2018; pp. 622–637. [Google Scholar] [CrossRef] [Green Version]
  32. Zhao, Y.; Deng, B.; Shen, C.; Liu, Y.; Lu, H.; Hua, X.S. Spatio-temporal autoencoder for video anomaly detection. In Proceedings of the 25th ACM International Conference on Multimedia, Mountain View, CA, USA, 23–27 October 2017; pp. 1933–1941. [Google Scholar] [CrossRef]
  33. Hodge, V.J.; Austin, J. A survey of outlier detection methodologies. Artif. Intell. Rev. 2004, 22, 85–126. [Google Scholar] [CrossRef] [Green Version]
  34. Pimentel, M.A.F.; Clifton, D.A.; Clifton, L.; Tarassenko, L. A review of novelty detection. Signal Proces. 2014, 99, 215–249. [Google Scholar] [CrossRef]
  35. Idrees, H.; Shah, M.; Surette, R. Enhancing camera surveillance using computer vision: A research note. Polic. Int. J. 2018, 41, 292–307. [Google Scholar] [CrossRef] [Green Version]
  36. Kerner, H.R.; Wellington, D.F.; Wagstaff, K.L.; Bell, J.F.; Kwan, C.; Amor, H.B. Novelty detection for multispectral images with application to planetary exploration. In Proceedings of the AAAI Conference on Artificial Intelligence, Atlanta, GA, USA, 8–12 October 2019; Volume 33, pp. 9484–9491. [Google Scholar] [CrossRef] [Green Version]
  37. Al-Behadili, H.; Grumpe, A.; Wohler, C. Incremental learning and novelty detection of gestures in a multi-class system. In Proceedings of the AIMS, Kota Kinabalu, Malaysia, 2–4 December 2015. [Google Scholar] [CrossRef]
  38. Liu, H.; Shah, S.; Jiang, W. On-line outlier detection and data cleaning. Comput. Chem. Eng. 2004, 28, 1635–1647. [Google Scholar] [CrossRef]
  39. Basu, S.; Meckesheimer, M. Automatic outlier detection for time series: An application to sensor data. Knowl. Inf. Syst 2007, 11, 137–154. [Google Scholar] [CrossRef]
  40. Xiao, H.; Rasul, K.; Vollgraf, R. Fashion-mnist: A novel image dataset for benchmarking machine learning algorithms. arXiv 2017, arXiv:1708.07747. [Google Scholar] [CrossRef]
  41. Garitano, I.; Uribeetxeberria, R.; Zurutuza, U. A review of SCADA anomaly detection systems. In Proceedings of the 6th Springer International Conference on Soft Computing Models in Industrial and Environmental Applications, Berlin/Heidelberg, Germany, April 2011; pp. 357–366. [Google Scholar] [CrossRef]
  42. Pang, G.; Shen, C.; Cao, L.; Hengel, A.V.D. Deep learning for anomaly detection: A review. Acm Comput. Surv. 2021, 54, 1–38. [Google Scholar] [CrossRef]
  43. Vernekar, S.; Gaurav, A.; Abdelzad, V.; Denouden, T.; Salay, R.; Czarnecki, K. Out-of-distribution Detection in Classifiers via Generation. arXiv 2019, arXiv:1910.04241. [Google Scholar] [CrossRef]
  44. Guénais, T.; Vamvourellis, D.; Yacoby, Y.; Doshi-Velez, F.; Pan, W. BaCOUn: Bayesian Classifers with Out-of-Distribution Uncertainty. arXiv 2020, arXiv:2007.06096. [Google Scholar] [CrossRef]
  45. Sedlmeier, A.; Muller, R.; Illium, S.; Linnhoff-Popien, C. Policy Entropy for Out-of-Distribution Classification. In Proceedings of the 29th International Conference on Artificial Neural Networks (ICANN), Bratislava, Slovakia, 15–18 September 2020; pp. 420–431. [Google Scholar] [CrossRef]
  46. Zhou, K.; Yang, Y.; Qiao, Y.; Xiang, T. MixStyle Neural Networks for Domain Generalization and Adaptation. arXiv 2021, arXiv:2107.02053. [Google Scholar] [CrossRef]
  47. Dong, X.; Guo, J.; Li, A.; Ting, W.-T.; Liu, C.; Kung, H.T. Neural Mean Discrepancy for Efficient Out-of-Distribution Detection. arXiv 2021, arXiv:2104.11408v4. [Google Scholar]
  48. Moller, F.; Botache, D.; Huseljic, D.; Heidecker, F.; Bieshaar, M.; Sick, B. Out-of-distribution Detection and Generation using Soft Brownian Offset Sampling and Autoencoders. In Proceedings of the CVPRW, Electr Network, Virtual, 19–25 June 2021; pp. 46–55. [Google Scholar] [CrossRef]
  49. Lee, K.; Lee, H.; Lee, K.; Shin, J. Training Confidence-calibrated Classifiers for Detecting Out-of-Distribution Samples. arXiv 2017, arXiv:1711.09325. [Google Scholar] [CrossRef]
  50. Dong, X.; Guo, J.; Ting, W.T.; Kung, H.T. Lightweight Detection of Out-of-Distribution and Adversarial Samples via Channel Mean Discrepancy. arXiv 2021, arXiv:2104.11408v1. [Google Scholar]
  51. Zhang, X.; Cui, P.; Xu, R.; Zhou, L.; He, Y.; Shen, Z. Deep Stable Learning for Out-Of-Distribution Generalization. In Proceedings of the CVPR, Nashville, TN, USA, 20–25 June 2021; pp. 5368–5378. [Google Scholar] [CrossRef]
  52. Arjovsky, M. Out of Distribution Generalization in Machine Learning. arXiv 2021, arXiv:2103.02667. [Google Scholar] [CrossRef]
  53. Mundt, M.; Pliushch, I.; Majumder, S.; Ramesh, V. Open Set Recognition Through Deep Neural Network Uncertainty: Does Out-of-Distribution Detection Require Generative Classifiers? In Proceedings of the 2019 IEEE/CVF International Conference on Computer Vision Workshop (ICCVW), Seoul, Korea, 27–28 October 2019; pp. 753–757. [Google Scholar] [CrossRef] [Green Version]
  54. Zaman, S.; Khandaker, M.; Khan, R.T.; Tariq, F.; Wong, K.K. Thinking Out of the Blocks: Holochain for Distributed Security in IoT Healthcare. IEEE Access. 2022, 10, 37064–37081. [Google Scholar] [CrossRef]
  55. Kuijs, M.; Jutzeler, C.R.; Rieck, B.; Bruningk, S. Interpretability Aware Model Training to Improve Robustness against Out-of-Distribution Magnetic Resonance Images in Alzheimer’s Disease Classification. arXiv 2021, arXiv:2111.08701. [Google Scholar] [CrossRef]
  56. Chen, J.; Li, Y.; Wu, X.; Liang, Y.; Jha, S. ATOM: Robustifying Out-of-distribution Detection Using Outlier Mining. arXiv 2020, arXiv:2006.15207. [Google Scholar] [CrossRef]
  57. Antonello, N.; Garner, P.N. At-Distribution Based Operator for Enhancing Out of Distribution Robustness of Neural Network Classifiers. IEEE Signal Proce. Lett. 2020, 27, 1070–1074. [Google Scholar] [CrossRef]
  58. Henriksson, J.; Berger, C.; Borg, M.; Tornberg, L.; Sathyamoorthy, S.R.; Englund, C. Performance Analysis of Out-of-Distribution Detection on Various Trained Neural Networks. In Proceedings of the 45th Euromicro Conference on Software Engineering and Advanced Applications (SEAA)/22nd Euromicro Conference on Digital System Design (DSD), Kallithea, Greece, 28–30 August 2019; pp. 113–120. [Google Scholar] [CrossRef]
  59. Haroush, M.; Frostig, T.; Heller, R.; Soudry, D. Statistical Testing for Efficient Out of Distribution Detection in Deep Neural Networks. arXiv 2021, arXiv:2102.12967. [Google Scholar]
  60. Baranwal, A.; Fountoulakis, K.; Jagannath, A. Graph Convolution for Semi-Supervised Classification: Improved Linear Separability and Out-of-Distribution Generalization. In Proceedings of the ICML, Virtual, 18–24 July 2021. [Google Scholar] [CrossRef]
  61. Vyas, A.; Jammalamadaka, N.; Zhu, X.; Das, D.; Kaul, B.; Willke, T.L. Out-of-Distribution Detection Using an Ensemble of Self Supervised Leave-Out Classifiers. In Proceedings of the 15th European Conference on Computer Vision (ECCV), Munich, Germany, 8–14 September 2018; pp. 560–574. [Google Scholar] [CrossRef] [Green Version]
  62. Guo, R.; Zhang, P.; Liu, H.; Kiciman, E. Out-of-distribution Prediction with Invariant Risk Minimization: The Limitation and An Effective Fix. arXiv 2021, arXiv:2101.07732. [Google Scholar] [CrossRef]
  63. Techapanurak, E.; Okatani, T. Practical Evaluation of Out-of-Distribution Detection Methods for Image Classification. arXiv 2021, arXiv:2101.02447. [Google Scholar] [CrossRef]
  64. Sedlmeier, A.; Gabor, T.; Phan, T.; Belzner, L.; Linnhoff-Popien, C. Uncertainty-based Out-of-Distribution Classification in Deep Reinforcement Learning. In Proceedings of the 12th International Conference on Agents and Artificial Intelligence (ICAART), Valletta, Malta, 22–24 February 2020; pp. 522–529. [Google Scholar] [CrossRef]
  65. Xie, S.M.; Kumar, A.; Jones, R.; Khani, F.; Ma, T.; Liang, P. In-N-Out: Pre-Training and Self-Training using Auxiliary Information for Out-of-Distribution Robustness. arXiv 2020, arXiv:2012.04550. [Google Scholar] [CrossRef]
  66. Ahuja, K.; Shanmugam, K.; Dhurandhar, A. Linear Regression Games: Convergence Guarantees to Approximate Out-of-Distribution Solutions. In Proceedings of the International Conference on Artificial Intelligence and Statistics, Virtual, 13–15 April 2021; pp. 1270–1278. [Google Scholar] [CrossRef]
  67. Bitterwolf, J.; Meinke, A.; Hein, M. Certifiably Adversarially Robust Detection of Out-of-Distribution Data. arXiv 2020, arXiv:2007.08473. [Google Scholar] [CrossRef]
  68. Morningstar, W.; Ham, C.; Gallagher, A.; Lakshminarayanan, B.; Alemi, A.; Dillon, J. Density of States Estimation for Out-of-Distribution Detection. In Proceedings of the 24th International Conference on Artificial Intelligence and Statistics, Electr Network, Virtual, 13–15 April 2021; pp. 232–3240. [Google Scholar] [CrossRef]
  69. Shao, Z.; Yang, J.; Ren, S. Calibrating Deep Neural Network Classifiers on Out-of-Distribution Datasets. arXiv 2020, arXiv:2006.08914. [Google Scholar] [CrossRef]
  70. Zhang, Y.; Liu, W.; Chen, Z.; Wang, J.; Liu, Z.; Li, K.; Wei, H. Towards Out-of-Distribution Detection with Divergence Guarantee in Deep Generative Models. arXiv 2020, arXiv:2002.03328. [Google Scholar]
  71. Chen, C.; Yuan, J.; Lu, Y.; Liu, Z.; Su, H.; Yuan, S.; Liu, S. OoDAnalyzer: Interactive Analysis of Out-of-Distribution Samples. IEEE Trans. Vis. Comput. Graph. 2021, 27, 3335–3349. [Google Scholar] [CrossRef] [PubMed] [Green Version]
  72. Xu, J.; Zhu, S.; Li, Z.; Xu, C. Joint Distribution across Representation Space for Out-of-Distribution Detection. arXiv 2021, arXiv:2103.12344. [Google Scholar]
  73. Chen, X.; Lan, X.; Sun, F.; Zheng, N. A Boundary Based Out-of-Distribution Classifier for Generalized Zero-Shot Learning. In Proceedings of the Computer Vision—ECCV 2020, Lecture Notes in Computer Science, Glasgow, UK, 23–28 August 2020; Springer: Cham, Switzlerland, 2020; pp. 572–588. [Google Scholar] [CrossRef]
  74. Zisselman, E.; Tamar, A. Deep Residual Flow for Out of Distribution Detection. In Proceedings of the 2020 IEEE/CVF Conference on Computer Vision and Pattern Recognition (CVPR), Seattle, WA, USA, 13–19 June 2020; pp. 13991–14000. [Google Scholar] [CrossRef]
  75. Zong, B.; Song, Q.; Min, M.R.; Cheng, W.; Lumezanu, C.; Cho, D.; Chen, H. Deep Autoencoding Gaussian Mixture Model for Unsupervised Anomaly Detection. In Proceedings of the ICLR, Vancouver, BC, Canada, 30 April–3 May 2018. [Google Scholar]
  76. Ren, J.; Liu, P.J.; Fertig, E.A.; Snoek, J.R.; Poplin, R.; Depristo, M.; Dillon, J.; Lakshminarayanan, B. Likelihood Ratios for Out-of-Distribution Detection. In Proceedings of the Neural Information Processing Systems, Vancouver, BC, Canada, 8–14 December 2019. [Google Scholar]
  77. Boutin, V.; Zerroug, A.; Jung, M.; Serre, T. Iterative VAE as a predictive brain model for out-of-distribution generalization. arXiv 2020, arXiv:2012.00557. [Google Scholar] [CrossRef]
  78. Ran, X.; Xu, M.; Mei, L.; Xu, Q.; Liu, Q. Detecting Out-of-distribution Samples via Variational Auto-encoder with Reliable Uncertainty Estimation. arXiv 2020, arXiv:2007.08128. [Google Scholar] [CrossRef]
  79. Zhang, D.; Ahuja, K.; Xu, Y.; Wang, Y.; Courville, A. Can Subnetwork Structure be the Key to Out-of-Distribution Generalization? arXiv 2021, arXiv:2106.02890. [Google Scholar] [CrossRef]
  80. Pan, S.J.; Qiang, Y. A Survey on Transfer Learning. IEEE Trans. Knowl. Data Eng. 2010, 22, 1345–1359. [Google Scholar] [CrossRef]
  81. Xu, Y.; Jaakkola, T. Learning Representations that Support Robust Transfer of Predictors. arXiv 2021, arXiv:2110.09940. [Google Scholar] [CrossRef]
  82. Jin, B.; Tan, Y.; Chen, Y.; Sangiovanni-Vincentelli, A. Augmenting Monte Carlo Dropout Classification Models with Unsupervised Learning Tasks for Detecting and Diagnosing Out-of-Distribution Faults. arXiv 2019, arXiv:1909.04202. [Google Scholar] [CrossRef]
  83. Zaida, M.; Ali, S.; Ali, M.; Hussein, S.; Saadia, A.; Sultani, W. Out of distribution detection for skin and malaria images. arXiv 2021, arXiv:2111.01505. [Google Scholar] [CrossRef]
  84. Kalantari, L.; Principe, J.; Sieving, K.E. Uncertainty quantification for multiclass data description. arXiv 2021, arXiv:2108.12857. [Google Scholar] [CrossRef]
  85. Li, X.; Wang, C.; Tang, Y.; Tran, C.; Auli, M. Multilingual Speech Translation from Efficient Finetuning of Pretrained Models. In Proceedings of the 59th Annual Meeting of the Association for Computational Linguistics and the 11th International Joint Conference on Natural Language Processing (Volume 1: Long Papers), Virtual, 1–6 August 2021. [Google Scholar]
  86. Yao, M.; Gao, H.; Zhao, G.; Wang, D.; Lin, Y.; Yang, Z.; Li, G. Semantically Coherent Out-of-Distribution Detection. In Proceedings of the 2021 IEEE/CVF International Conference on Computer Vision (ICCV) Montreal, QC, Canada, 10–17 October 2021; pp. 8281–8289. [Google Scholar] [CrossRef]
  87. Oberdiek, P.; Rottmann, M.; Fink, G.A. Detection and Retrieval of Out-of-Distribution Objects in Semantic Segmentation. In Proceedings of the IEEE/CVF Conference on Computer Vision and Pattern Recognition (CVPR), Electr Network, Seattle, WA, USA, 14–19 June 2020; pp. 1331–1340. [Google Scholar] [CrossRef]
  88. Ramakrishna, S.; Rahiminasab, Z.; Karsai, G.; Easwaran, A.; Dubey, A. Efficient Out-of-Distribution Detection Using Latent Space of β-VAE for Cyber-Physical Systems. arXiv 2021, arXiv:2108.11800. [Google Scholar] [CrossRef]
  89. Feng, Y.; Easwaran, A. WiP. Abstract: Robust Out-of-distribution Motion Detection and Localization in Autonomous CPS. arXiv 2021, arXiv:2107.11736. [Google Scholar] [CrossRef]
  90. Dery, L.M.; Dauphin, Y.; Grangier, D. Auxiliary Task Update Decomposition: The Good, The Bad and The Neutral. arXiv 2021, arXiv:2108.11346. [Google Scholar] [CrossRef]
  91. Chen, J.; Asma, E.; Chan, C. Targeted Gradient Descent: A Novel Method for Convolutional Neural Networks Fine-tuning and Online-learning. arXiv 2021, arXiv:2109.14729. [Google Scholar] [CrossRef]
  92. Gawlikowski, J.; Saha, S.; Kruspe, A.; Zhu, X.X. Out-of-distribution detection in satellite image classification. arXiv 2021, arXiv:2104.05442. [Google Scholar] [CrossRef]
  93. Asami, T.; Masumura, R.; Aono, Y.; Shinoda, K. Recurrent out-of-vocabulary word detection based on distribution of features. In Comput. Speech Lang. 2019, 58, 247–259. [Google Scholar] [CrossRef]
  94. Bayer, J.; Münch, D.; Arens, M. Image-Based Out-of-Distribution-Detector Principles on Graph-Based Input Data in Human Action Recognition. In Pattern Recognition. ICPR International Workshops and Challenges. Lecture Notes in Computer Science; Springer: Cham, Switzerland, 2021; Volume 12661, pp. 26–40. [Google Scholar] [CrossRef]
  95. Kim, Y.; Cho, D.; Lee, J.H. Wafer Map Classifier using Deep Learning for Detecting Out-of-Distribution Failure Patterns. In Proceedings of the 2020 IEEE International Symposium on the Physical and Failure Analysis of Integrated Circuits (IPFA), Singapore, 20–23 July 2020; pp. 1–5. [Google Scholar] [CrossRef]
  96. Mensink, T.; Verbeek, J.; Perronnin, F.; Csurka, G. Distance-Based Image Classification: Generalizing to New Classes at Near-Zero Cost. Ieee Trans. Pattern Anal. Mach. Intell. 2013, 35, 2624–2637. [Google Scholar] [CrossRef] [Green Version]
  97. Yu, C.; Zhu, X.; Lei, Z.; Li, S.Z. Out-of-Distribution Detection for Reliable Face Recognition. IEEE Signal Process. Lett. 2020, 27, 710–714. [Google Scholar] [CrossRef]
  98. Dendorfer, P.; Elflein, S.; Leal-Taixé, L. MG-GAN: A Multi-Generator Model Preventing Out-of-Distribution Samples in Pedestrian Trajectory Prediction. arXiv 2021, arXiv:2108.09274. [Google Scholar] [CrossRef]
  99. Mandal, D.; Narayan, S.; Dwivedi, S.; Gupta, V.; Ahmed, S.; Khan, F.S.; Shao, L.; Soc, I.C. Out-of-Distribution Detection for Generalized Zero-Shot Action Recognition. In Proceedings of the IEEE/CVF Conference on Computer Vision and Pattern Recognition (CVPR), Long Beach, CA, USA, 16–20 June 2019; pp. 9977–9985. [Google Scholar] [CrossRef] [Green Version]
  100. Srinidhi, C.L.; Martel, A.L. Improving Self-supervised Learning with Hardness-aware Dynamic Curriculum Learning: An Application to Digital Pathology. In Proceedings of the 2021 IEEE/CVF International Conference on Computer Vision Workshops (ICCVW), Virtual, 11–17 October 2021; pp. 562–571. [Google Scholar] [CrossRef]
  101. Baltatzis, V.; Le Folgoc, L.; Ellis, S.; Manzanera, O.E.M.; Bintsi, K.-M.; Nair, A.; Desai, S.; Glocker, B.; Schnabel, J.A. The Effect of the Loss on Generalization: Empirical Study on Synthetic Lung Nodule Data; Springer: Cham, Switzerland, 2021; pp. 56–64. [Google Scholar] [CrossRef]
  102. Gao, L.; Wu, S.D. Response score of deep learning for out-of-distribution sample detection of medical images. J. Biomed. Inform. 2020, 107, 103442. [Google Scholar] [CrossRef]
  103. Martensson, G.; Ferreira, D.; Granberg, T.; Cavallin, L.; Oppedal, K.; Padovani, A.; Rektorova, I.; Bonanni, L.; Pardini, M.; Kramberger, M.G.; et al. The reliability of a deep learning model in clinical out-of-distribution MRI data: A multicohort study. Med. Image Anal. 2020, 66, 101714. [Google Scholar] [CrossRef]
  104. Nandy, J.; Hs, W.; Le, M.L. Distributional Shifts In Automated Diabetic Retinopathy Screening. In Proceedings of the 2021 IEEE International Conference on Image Processing (ICIP), Anchorage, AK, USA, 19–22 September 2021; pp. 255–259. [Google Scholar] [CrossRef]
  105. Gonzalez, C.; Gotkowski, K.; Bucher, A.; Fischbach, R.; Kaltenborn, I.; Mukhopadhyay, A. Detecting When Pre-trained nnU-Net Models Fail Silently for Covid-19 Lung Lesion Segmentation; Springer: Cham, Switzerland, 2021; pp. 304–314. [Google Scholar] [CrossRef]
  106. Yuhas, M.; Feng, Y.; Xian Ng, D.J.; Rahiminasab, Z.; Easwaran, A. Embedded out-of-distribution detection on an autonomous robot platform. arXiv 2021, arXiv:2106.15965. [Google Scholar] [CrossRef]
  107. Farid, A.; Veer, S.; Pachisia, D.; Majumdar, A. Task-Driven Detection of Distribution Shifts with Statistical Guarantees for Robot Learning. arXiv 2021, arXiv:2106.13703. [Google Scholar] [CrossRef]
  108. Caron, L.S.; Hendriks, L.; Verheyen, V. Rare and different: Anomaly scores from a combination of likelihood and out-of-distribution models to detect new physics at the LHC. SciPost Phys. 2022, 12, 77. [Google Scholar] [CrossRef]
  109. Jonmohamadi, Y.; Ali, S.; Liu, F.; Roberts, J.; Crawford, R.; Carneiro, G.; Pandey, A.K. 3D Semantic Mapping from Arthroscopy Using Out-of-Distribution Pose and Depth and In-Distribution Segmentation Training; Springer: Cham, Switzerland, 2021; pp. 383–393. [Google Scholar] [CrossRef]
  110. Lee, K.; Lee, K.; Lee, H.; Shin, J. A Simple Unified Framework for Detecting Out-of-Distribution Samples and Adversarial Attacks. In Proceedings of the 32nd Conference on Neural Information Processing Systems (NIPS), Montreal, QC, Canada, 2–8 December 2018. [Google Scholar]
  111. Li, X.; Lu, Y.; Desrosiers, C.; Liu, X. Out-of-Distribution Detection for Skin Lesion Images with Deep Isolation Forest; Springer: Cham, Switzerland, 2020; pp. 91–100. [Google Scholar] [CrossRef]
  112. Kim, H.; Tadesse, G.A.; Cintas, C.; Speakman, S.; Varshney, K. Out-of-Distribution Detection In Dermatology Using Input Perturbation and Subset Scanning. In Proceedings of the 19th IEEE International Symposium on Biomedical Imaging (IEEE ISBI), Kolkata, India, 28–31 March 2022. [Google Scholar] [CrossRef]
  113. Pacheco, A.G.C.; Sastry, C.S.; Trappenberg, T.; Oore, S.; Krohling, R.A. On Out-of-Distribution Detection Algorithms with Deep Neural Skin Cancer Classifiers. In Proceedings of the IEEE/CVF Conference on Computer Vision and Pattern Recognition (CVPR), Electr Network, Seattle, WA, USA, 14–19 June 2020; pp. 3152–3161. [Google Scholar] [CrossRef]
  114. Dohi, K.; Endo, T.; Purohit, H.; Tanabe, R.; Kawaguchi, Y. Flow-Based Self-Supervised Density Estimation for Anomalous Sound Detection. In Proceedings of the IEEE International Conference on Acoustics, Speech and Signal Processing (ICASSP), Electr Network, Toronto, ON, Canada, 6–11 June 2021; pp. 336–340. [Google Scholar] [CrossRef]
  115. Iqbal, T.; Cao, Y.; Kong, Q.Q.; Plumbley, M.D.; Wang, W.W. Learning with Out-Of-Distribution data For Audio Classification. In Proceedings of the IEEE International Conference on Acoustics, Speech, and Signal Processing (ICASSP), Barcelona, Spain, 4–8 May 2020; pp. 636–640. [Google Scholar] [CrossRef] [Green Version]
  116. Williams, D.S.W.; Gadd, M.; De Martini, D.; Newman, P. Fool Me Once: Robust Selective Segmentation via Out-of-Distribution Detection with Contrastive Learning. In Proceedings of the IEEE International Conference on Robotics and Automation (ICRA), Xian, China, 30 May–5 June 2021; pp. 9536–9542. [Google Scholar] [CrossRef]
  117. Liu, H.; Lai, V.; Tan, C. Understanding the Effect of Out-of-distribution Examples and Interactive Explanations on Human-AI Decision Making. arXiv 2021, arXiv:2101.05303. [Google Scholar] [CrossRef]
  118. Cai, F.; Koutsoukos, X. Real-time Out-of-distribution Detection in Learning-Enabled Cyber- Physical Systems. In Proceedings of the 2020 ACM/IEEE 11th International Conference on Cyber-Physical Systems (ICCPS), ACM, Sydney, NSW, Australia, 21–25 April 2020; pp. 174–183. [Google Scholar] [CrossRef]
  119. Kim, S.; Nam, H.; Kim, J.; Jung, K.; Association for the Advancement of Artificial Intelligence. Neural Sequence-to-grid Module for Learning Symbolic Rules. In Proceedings of the 35th AAAI Conference on Artificial Intelligence, Electr Network, 2–9 February 2021; pp. 8163–8171. [Google Scholar] [CrossRef]
  120. Chen, J.; Zhu, C.; Dai, B. Understanding the Role of Self-Supervised Learning in Out-of-Distribution Detection Task. arXiv 2021, arXiv:2110.13435. [Google Scholar] [CrossRef]
  121. Nitsch, J.; Itkina, M.; Senanayake, R.; Nieto, J.; Schmidt, M.; Siegwart, R.; Kochenderfer, M.J.; Cadena, C. Out-of-Distribution Detection for Automotive Perception. In Proceedings of the 2021 IEEE International Intelligent Transportation Systems Conference (ITSC), Indianapolis, IN, USA, 19–22 September 2021; pp. 2938–2943. [Google Scholar] [CrossRef]
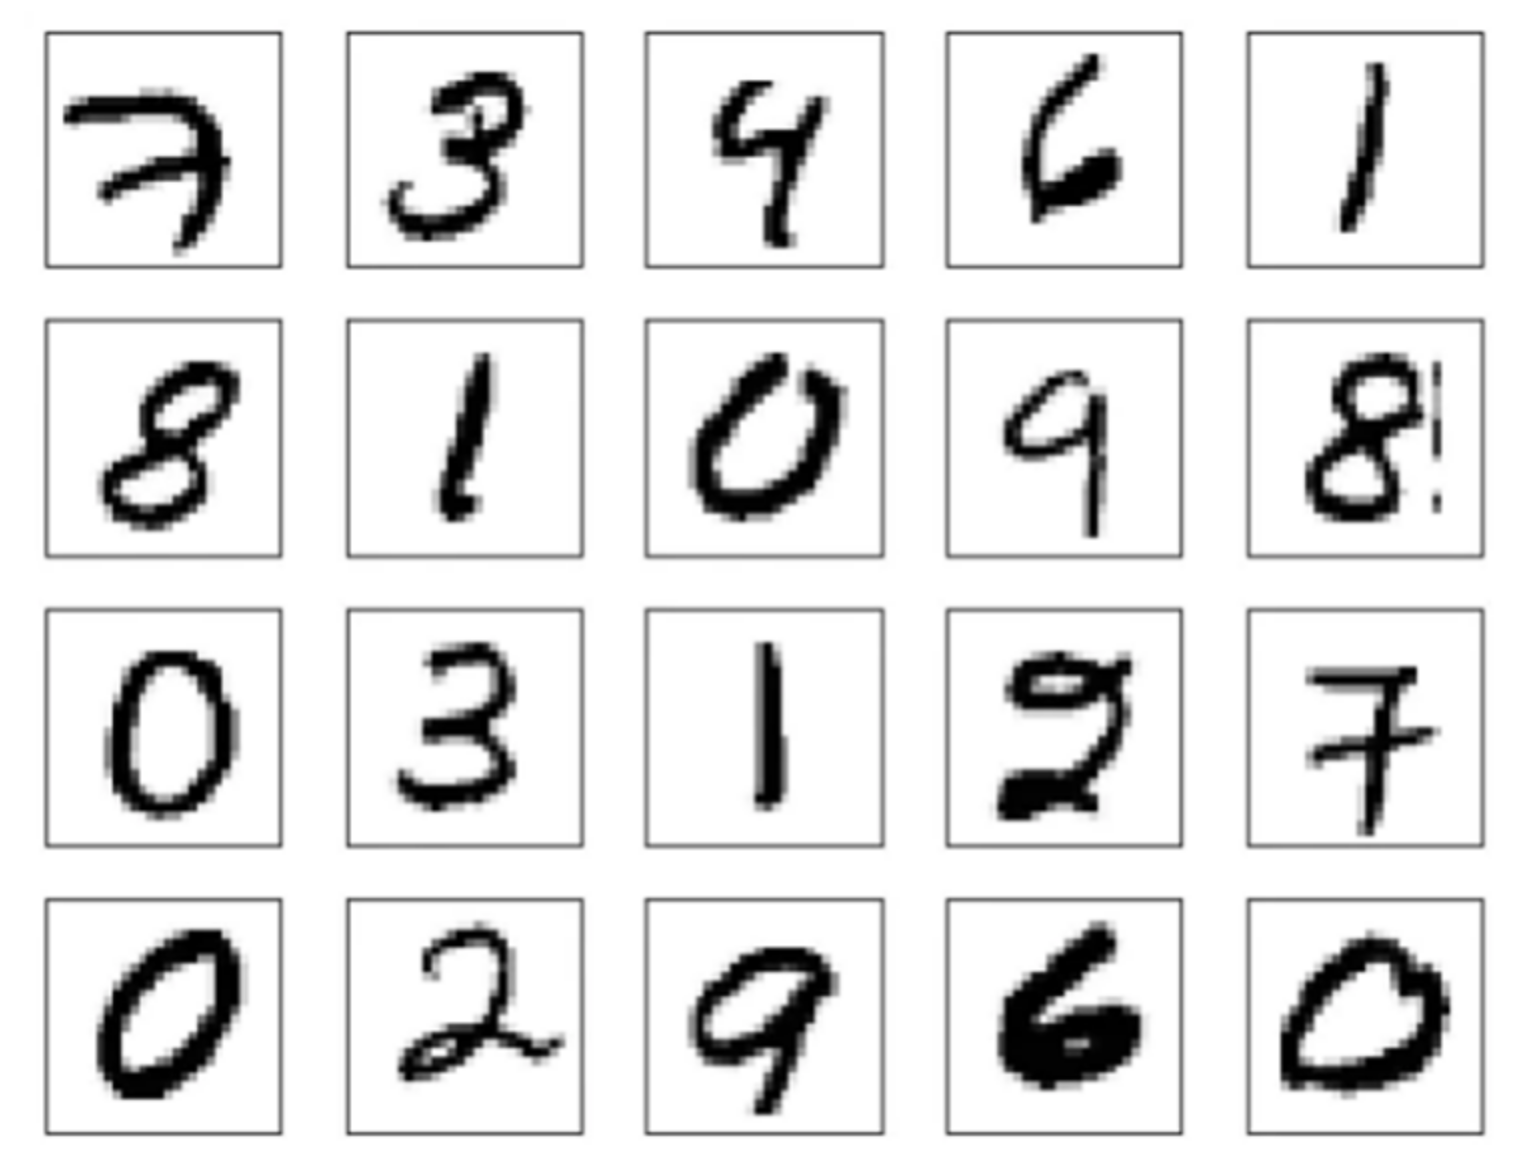
Figure 1. MNIST data set sample image.
Electronics 11 03500 g001
Figure 2. CIFAR-10 data set sample image.
Electronics 11 03500 g002
Figure 3. Comparison of results. The ID data are CIFAR-10, the OOD data are TinyImageNet, LSUN, and iSUN, and the model is VGG16.
Electronics 11 03500 g003aElectronics 11 03500 g003b
Figure 4. Comparison of results. The ID data are CIFAR-100, the OOD data are SVHN, Gaussian, and Uniform, and the model is VGG16.
Electronics 11 03500 g004
Figure 5. Comparison of results. The ID data are CIFAR-10, the OOD data are TinyImageNet, LSUN, and iSUN, and the model is Resnet.
Electronics 11 03500 g005
Figure 6. Comparison of results. The ID data are CIFAR-100, the OOD data are SVHN, Gaussian, and Uniform, and the model is Resnet.
Electronics 11 03500 g006aElectronics 11 03500 g006b
Table 1. Paper summary (2020–2021).
NumberMethodologyReferences
1Generate OOD data by using ID data[48,49]
2Lightweight Detection of Out-of-Distribution and Adversarial Samples via Channel Mean Discrepancy[50]
3Learn the weights of training samples to eliminate the dependence between features and false correlations[51]
4The strong link between discovering the causal structure of the data and finding reliable features[52,53]
5Holochain-based security and privacy-preserving framework[54]
6Enhance robustness of Out-of-Distribution[55,56,57,58]
7The (OOD) detection problem in DNN as a statistical hypothesis testing problem[59]
8The linear classifier obtained by minimizing the cross-entropy loss after the graph convolution generalizes to out-of-distribution data[45,60,61]
9Invariant risk minimization (IRM) solves the prediction problem[62]
10The differences between scenarios and data sets will change the relative performance of the methods[63,64]
11pre-trains a model on OOD auxiliary outputs and fine-tunes this model with the pseudolabels[65]
12Nash equilibria of these games are closer to the ideal OOD solutions than the standard empirical risk minimization (ERM)[66]
13Interval bound propagation (IBP) is used to upper bound the maximal confidence in the l∞-ball and minimize this upper bound during training time[67]
14The density of states estimator is proposed[68]
15A new post-doc confidence calibration method is proposed, called CCAC (Confidence Calibration with an Auxiliary Class), for DNN classifiers on OOD datasets[69]
16The author proposes an easy-to-perform method both for group and point-wise anomaly detection via estimating the total correlation of representations in DGM[70]
17The author proposes OOD Analyzer, a visual analysis approach for interactively identifying OOD samples and explaining them in context[71]
Table 2. Application Summary (2020–2021).
NumberApplication FieldReferences
1Avian note classification[84]
2Natural language processing (NLP)[85,86,87]
3Autonomous Vehicle[88,89]
4Text and Image classification[90,91,92,93]
[94,95,96,97]
5Pedestrian trajectory prediction[98,99]
6Digital Pathology[100]
7Medical imaging[101,102,103]
8Automated Diabetic Retinopathy Screening[104]
9Lung lesion segmentation[105]
10Autonomous robot platform[106]
11Drone performing vision-based obstacle avoidance[107]
12Particle physics collider events[108]
13Minimally invasive surgery (MIS)[109]
14Adversarial attacks (AA)[110]
15Automated skin disease classification[111,112,113]
16Machine sound monitoring system[114,115]
17Scene segmentation[116]
18AI assistance[117,118]
19Logical reasoning over symbols[119]
20Self-supervised learning (SSL)[120]
21Automotive perception[121]
Publisher’s Note: MDPI stays neutral with regard to jurisdictional claims in published maps and institutional affiliations.