Article

Fast Self-Attention Deep Detection Network Based on Weakly Differentiated Plant Nematodess

1
Ningbo Institute of Industrial Technology, Chinese Academy of Sciences, Ningbo 315201, China
2
Technical Centre, Ningbo Entry-Exit Inspection and Quarantine Bureau, Ningbo 315012, China
3
School of Geographic and Biologic Information, Nanjing University of Posts and Telecommunications, Nanjing 210023, China
*
Author to whom correspondence should be addressed.
Electronics 2022, 11(21), 3497; https://doi.org/10.3390/electronics11213497
Submission received: 14 September 2022 / Revised: 12 October 2022 / Accepted: 20 October 2022 / Published: 28 October 2022

Abstract

:
High-precision, high-speed detection and classification of weakly differentiated targets has always been a difficult problem in the field of image vision. In this paper, the detection of phytopathogenic Bursaphelenchus xylophilus with small size and very weak inter-species differences is taken as an example. Our work is aimed at the current problem of weakly differentiated target detection: We propose a lightweight self attention network. Experiments show that the key feature recognition areas of plant nematodes found by our Self Attention network are in good agreement with the experience and knowledge of customs experts, and the feature areas found by this method can obtain higher detection accuracy than expert knowledge; In order to optimize the computing power brought by the whole image input, we use low resolution images to quickly obtain the location coordinates of key features, and then obtain the information of high resolution feature regions based on the coordinates; The adaptive weighted multi feature joint detection method based on heat map brightness is adopted to further improve the detection accuracy; We have constructed a more complete high-resolution training data set, involving 24 species of Equisetum and other common hybrids, with a total data volume of more than 10,000. The algorithm proposed in this paper replaces the tedious extensive manual labelling in the training process, improves the average training time of the model by more than 50%, reduces the testing time of a single sample by about 27%, optimizes the model storage size by 65%, improves the detection accuracy of the ImageNet pre-trained model by 12.6%, and improves the detection accuracy of the no-ImageNet pre-trained model by more than 48%.

1. Introduction

Bursaphelenchus xylophilus (B. xylophilus) is one of the most important harmful organisms to be detected in the entry–exit phytosanitary work. The annual economic losses caused by plant nematodes are more than 80 billion worldwide [1]. B. xylophilus is small, widely distributed, and harmful. The difference between B. xylophilus and other plant nematodes is very small, which is very difficult to distinguish [2]. Currently, the manual detection is still the main method [3]. As shown in Figure 1, the left is B. xylophilus which is harmful to vegetation, the right is Bursaphelenchus mucronatus (B. mucronatus) which is harmless to the vegetation. It can be found that the overall morphology and characteristics of these two nematodes are very similar and difficult to distinguish.
Although in general, plant nematodes have a very high similarity between different species, there are still distinguishable traits present in some fine-grained characteristic parts. According to expert experience, as shown in Figure 2, different types of plant nematodes still have weak differences in their anus position, length of their tail spikes, and other characteristics [4].
From Figure 2, it can be found that the key parts of different species of plant nematodes have some variability, but the degree of differentiation is very small [5]. The accuracy does not meet the requirements if traditional morphological identification methods are used [6]. In contrast, manual identification or molecular biology methods such as PCR, SVM and Naive Bayes classifiers have the problems of low identification efficiency or huge cost [7,8].
Huang J [9,10] and Doshi, R.A [11,12] Using the influence of nematodes on plants and the changes of plant spectra, remote sensing information is used to identify nematodes. However, this method is indirect and cannot be applied to our scene. The study referenced in [13] used a custom computer vision algorithm (CCVA) and a convolutional neural network (CNN) to identify nematode species, it is proven that both methods can accurately identify two types of nematodes, G. pallida and G. rostochiensis; for Globodera mexicana, the accuracy is low, but it still proves the feasibility of computer-based identification. The author of study [14] used his own cultivated nematode dataset to divide the nematode dataset into juveniles dataset and adult dataset. The neural network method is used to verify its effect on the dataset. The author explores the effectiveness of the volume and neural network on their dataset, as well as the best training process and super parameters suitable for their dataset.
In recent years, with the rapid development of deep learning technology, convolutional neural networks have significantly improved their effectiveness compared with traditional image detection methods [15]. By the method based on the attention mechanism, it is easier for the neural network to focus on the fine-grained detail information, improve the accuracy of image recognition classification under weak differences [6].
For weakly differentiated image classification often requires two steps: step 1. Manually label a large amount of data combined with expert empirical knowledge and train a key attention feature model based on Faster R-CNN [16], YOLO [17] and other general-purpose neural networks; step 2. Based on the fine-grained feature information obtained from the key attention feature model, then further training and testing of classification are performed to obtain the final result [18]. There are several problems in this operation: 1. The industry expert experience knowledge is difficult to obtain, and there is also a certain error in the expert experience, which will have an impact on the detection accuracy [19]; 2. The attention feature model trained by manual annotation of the original high-resolution image and based on networks such as Faster R-CNN will lead to a substantial increase in the model storage size, testing time, training time, which seriously affects the training and testing efficiency [20].
To address the above problems, this paper takes the detection of phytopathogenic B. xylophilus with small size and very weak inter-species differences as an example [5]. Our work has been carried out to focus on the weak inter-species differences and the problems in the process of achieving high-precision and high-speed targets:
a. An open-source plant nematodes high-resolution microscopic image dataset taken by a Zeiss professional microscope was constructed. The dataset image uniform image resolution of 1388 × 1040, involving 24 species of conventional plant nematodes, with a total of 11,237 images. To the best of our knowledge, this is the largest and most diverse plant nematodes dataset that can be found.
b. Construction of a Self-Attention feature network based on low-resolution images, which is capable of quickly and adaptively finding the key feature locations of plant nematodes to be detected in low-resolution images without relying on expert empirical knowledge. Experimentally verifying that the key feature identification areas of B. xylophilus found by this network match extremely well with the empirical knowledge provided by the customs experts.
c. The high-resolution feature information obtained by the Self-Attention feature network adopted a multi-feature joint recognition method based on adaptive weights of the heatmap.
The final detection accuracy is improved from 90% to 99% compared with the expert empirical knowledge input method, the detect model storage size is optimized by 65%, the testing time is reduced by 27%. Compared with other mainstream convolutional neural networks, the algorithm model proposed in this paper not only eliminates the complicated expert prior knowledge input, but also achieves the optimal model size, testing speed, accuracy simultaneously.

2. Materials and Methods
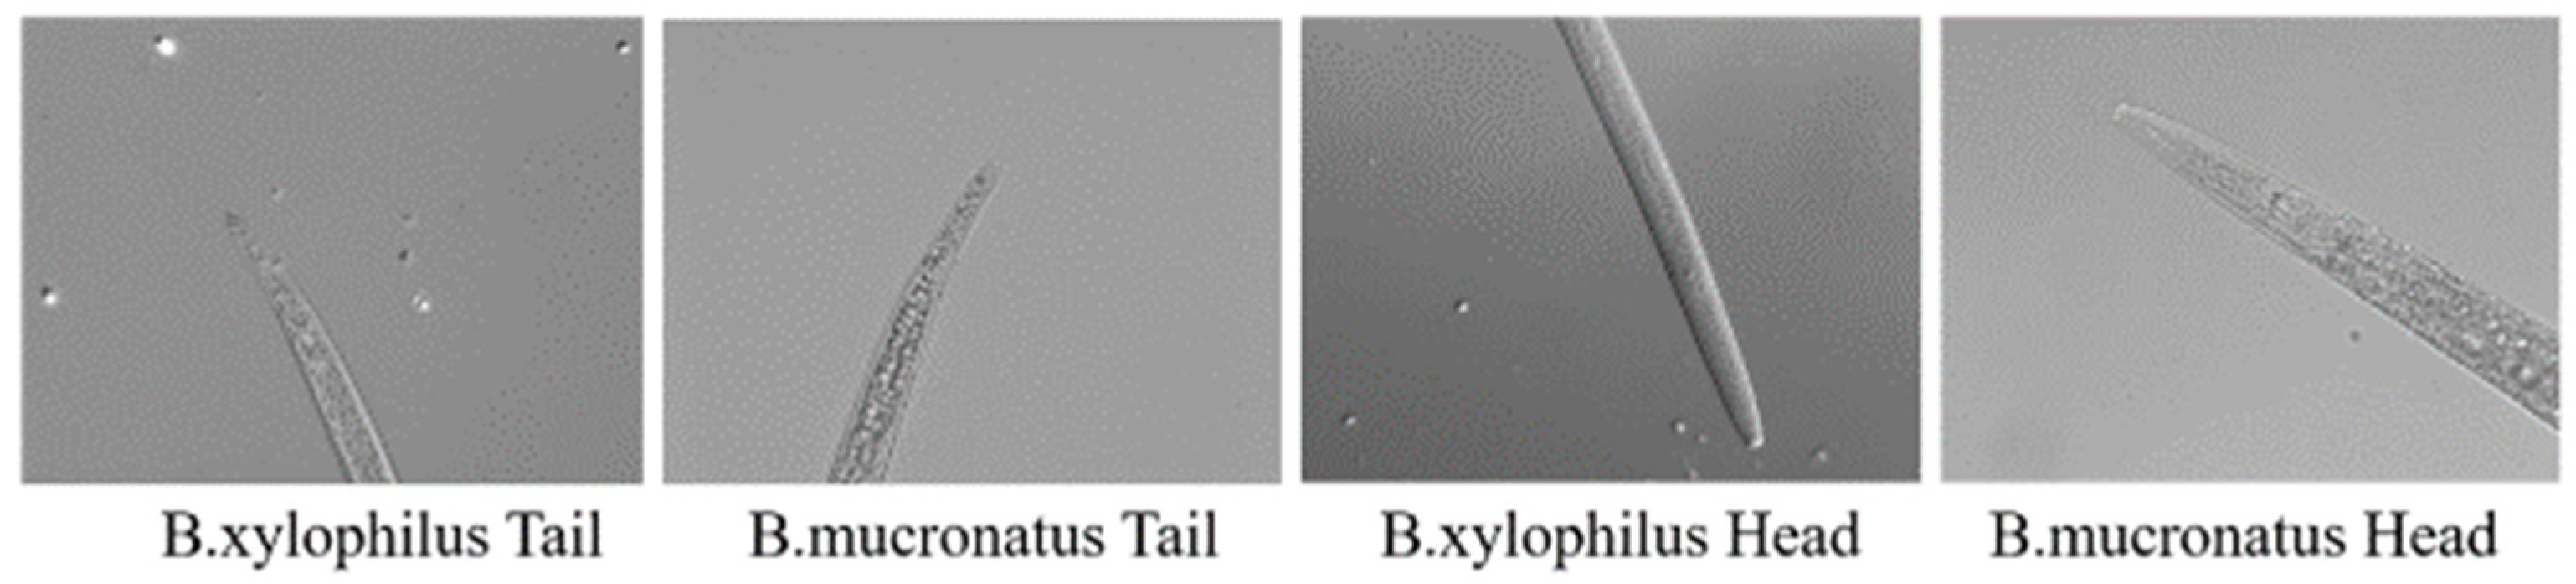
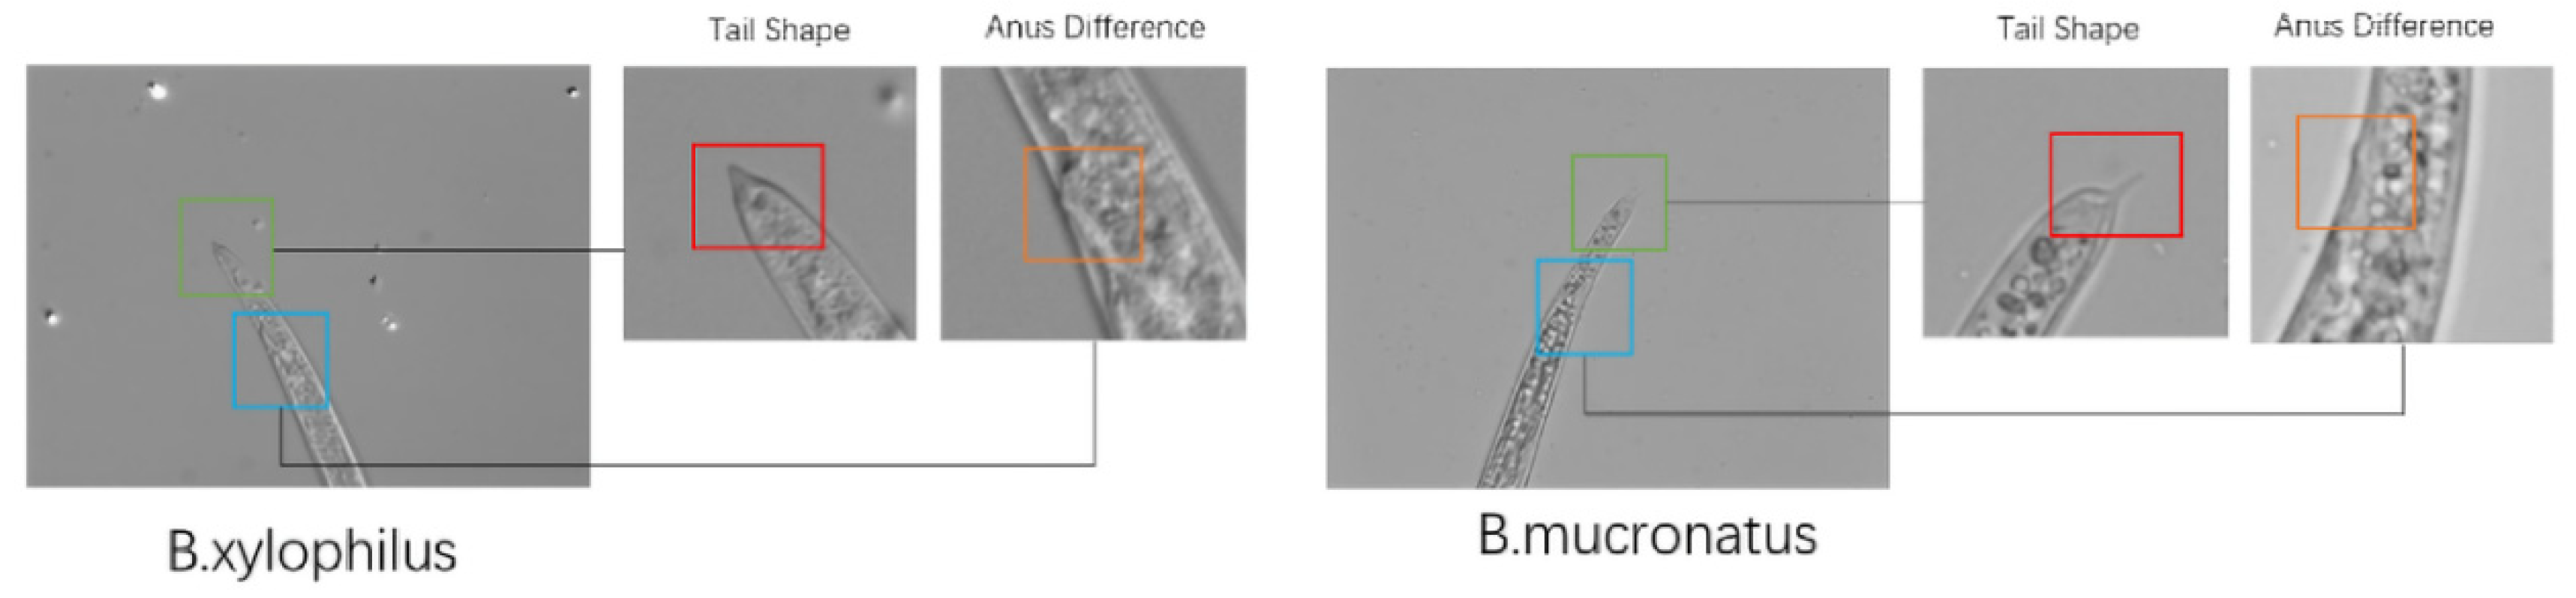
2.1. Dataset

2.1.1. Dataset

In this paper, we constructed the most abundant and diverse plant nematodes dataset that could be found. The dataset involves 24 species of nematodes that are easily confused with B. xylophilus. The total number of dataset images reaches 11,237. All images were taken uniformly with a Zeiss professional microscope Axio Imager Z1 with an objective magnification of 40× and a uniform image resolution of 1388 × 1040 [21]. As shown in Figure 3, it is a schematic diagram of the collected common different kinds of plant nematodes.

2.1.2. Traditional Detection Methods

The process of the traditional detection method is shown in Figure 4 below, which has the following problems: 1. There is too much non-critical redundant information when the entire image is input, which affects the extraction and judgment of key features by the neural network, and then affects the detection accuracy [22]; 2. The computation is time-consuming.
To address the above problems, researchers have made improvements. They combine expert empirical knowledge to construct a neural network based on feature areas attention mechanism through extensive labelling as well as training [23], so as to extract key feature areas to improve the detection accuracy of the neural network. The following Figure 5 shows the combined neural network architecture of the joint Faster R-CNN feature extraction network and the VGG19 [24] classification network.
The above method can eliminate redundant information in non-critical areas of the image to a large extent, improve the detection accuracy. However, there are still the following problems: 1. Based on expert empirical knowledge, a large amount of manual annotation is required in the early stage, and the input of the feature network is still high-resolution entire image, which is very time-consuming in labelling and computation; 2. It is not easy to obtain expert experience, and there is a possibility of misjudgement of expert experience, which leads to inaccurate detection accuracy in part.
Therefore, in order to find a better method that can simultaneously solve the problems of manual labelling, long calculation time, large model complexity, and lack of expert knowledge in the network, the following method is proposed in this paper.

2.2. Methods

In this paper, a deep neural network based on the fast Self-Attention inference is proposed, as shown in Figure 6. The overall network mainly contains three improved parts compared with the traditional method: Firstly, we construct a search network based on the Self-Attention features to replace the tedious labelling and training based on expert empirical knowledge, as shown in Part A below; secondly, the computational overhead of finding key features of the whole image is reduced by fast down-sampling of the high-resolution input, as shown in Figure 6 Part B below. Finally, through the key feature areas coordinates obtained by Part B, we obtain the high-resolution information of the feature areas. Based on the multi-feature areas joint input with adaptive weights, the goal of high-precision and high-speed classification is achieved, as shown in Figure 6 Part C below.

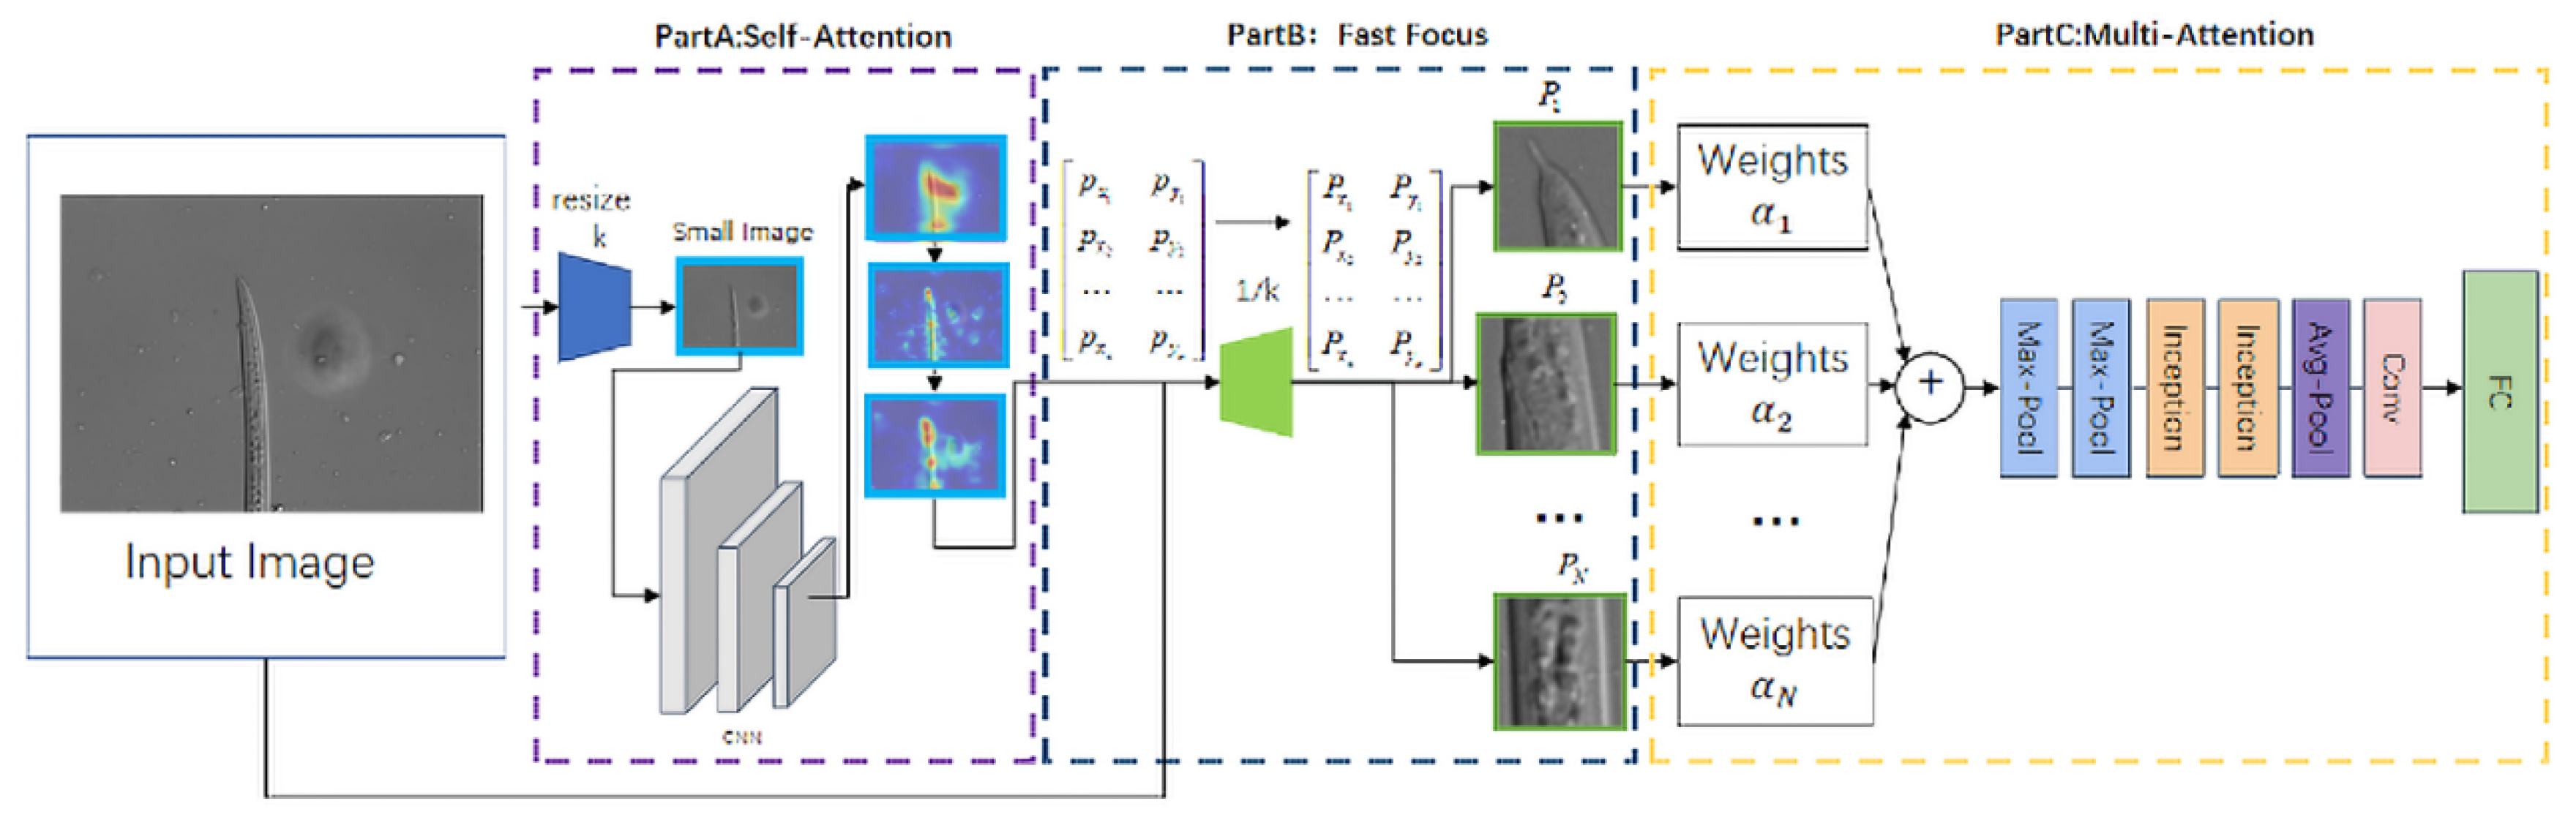
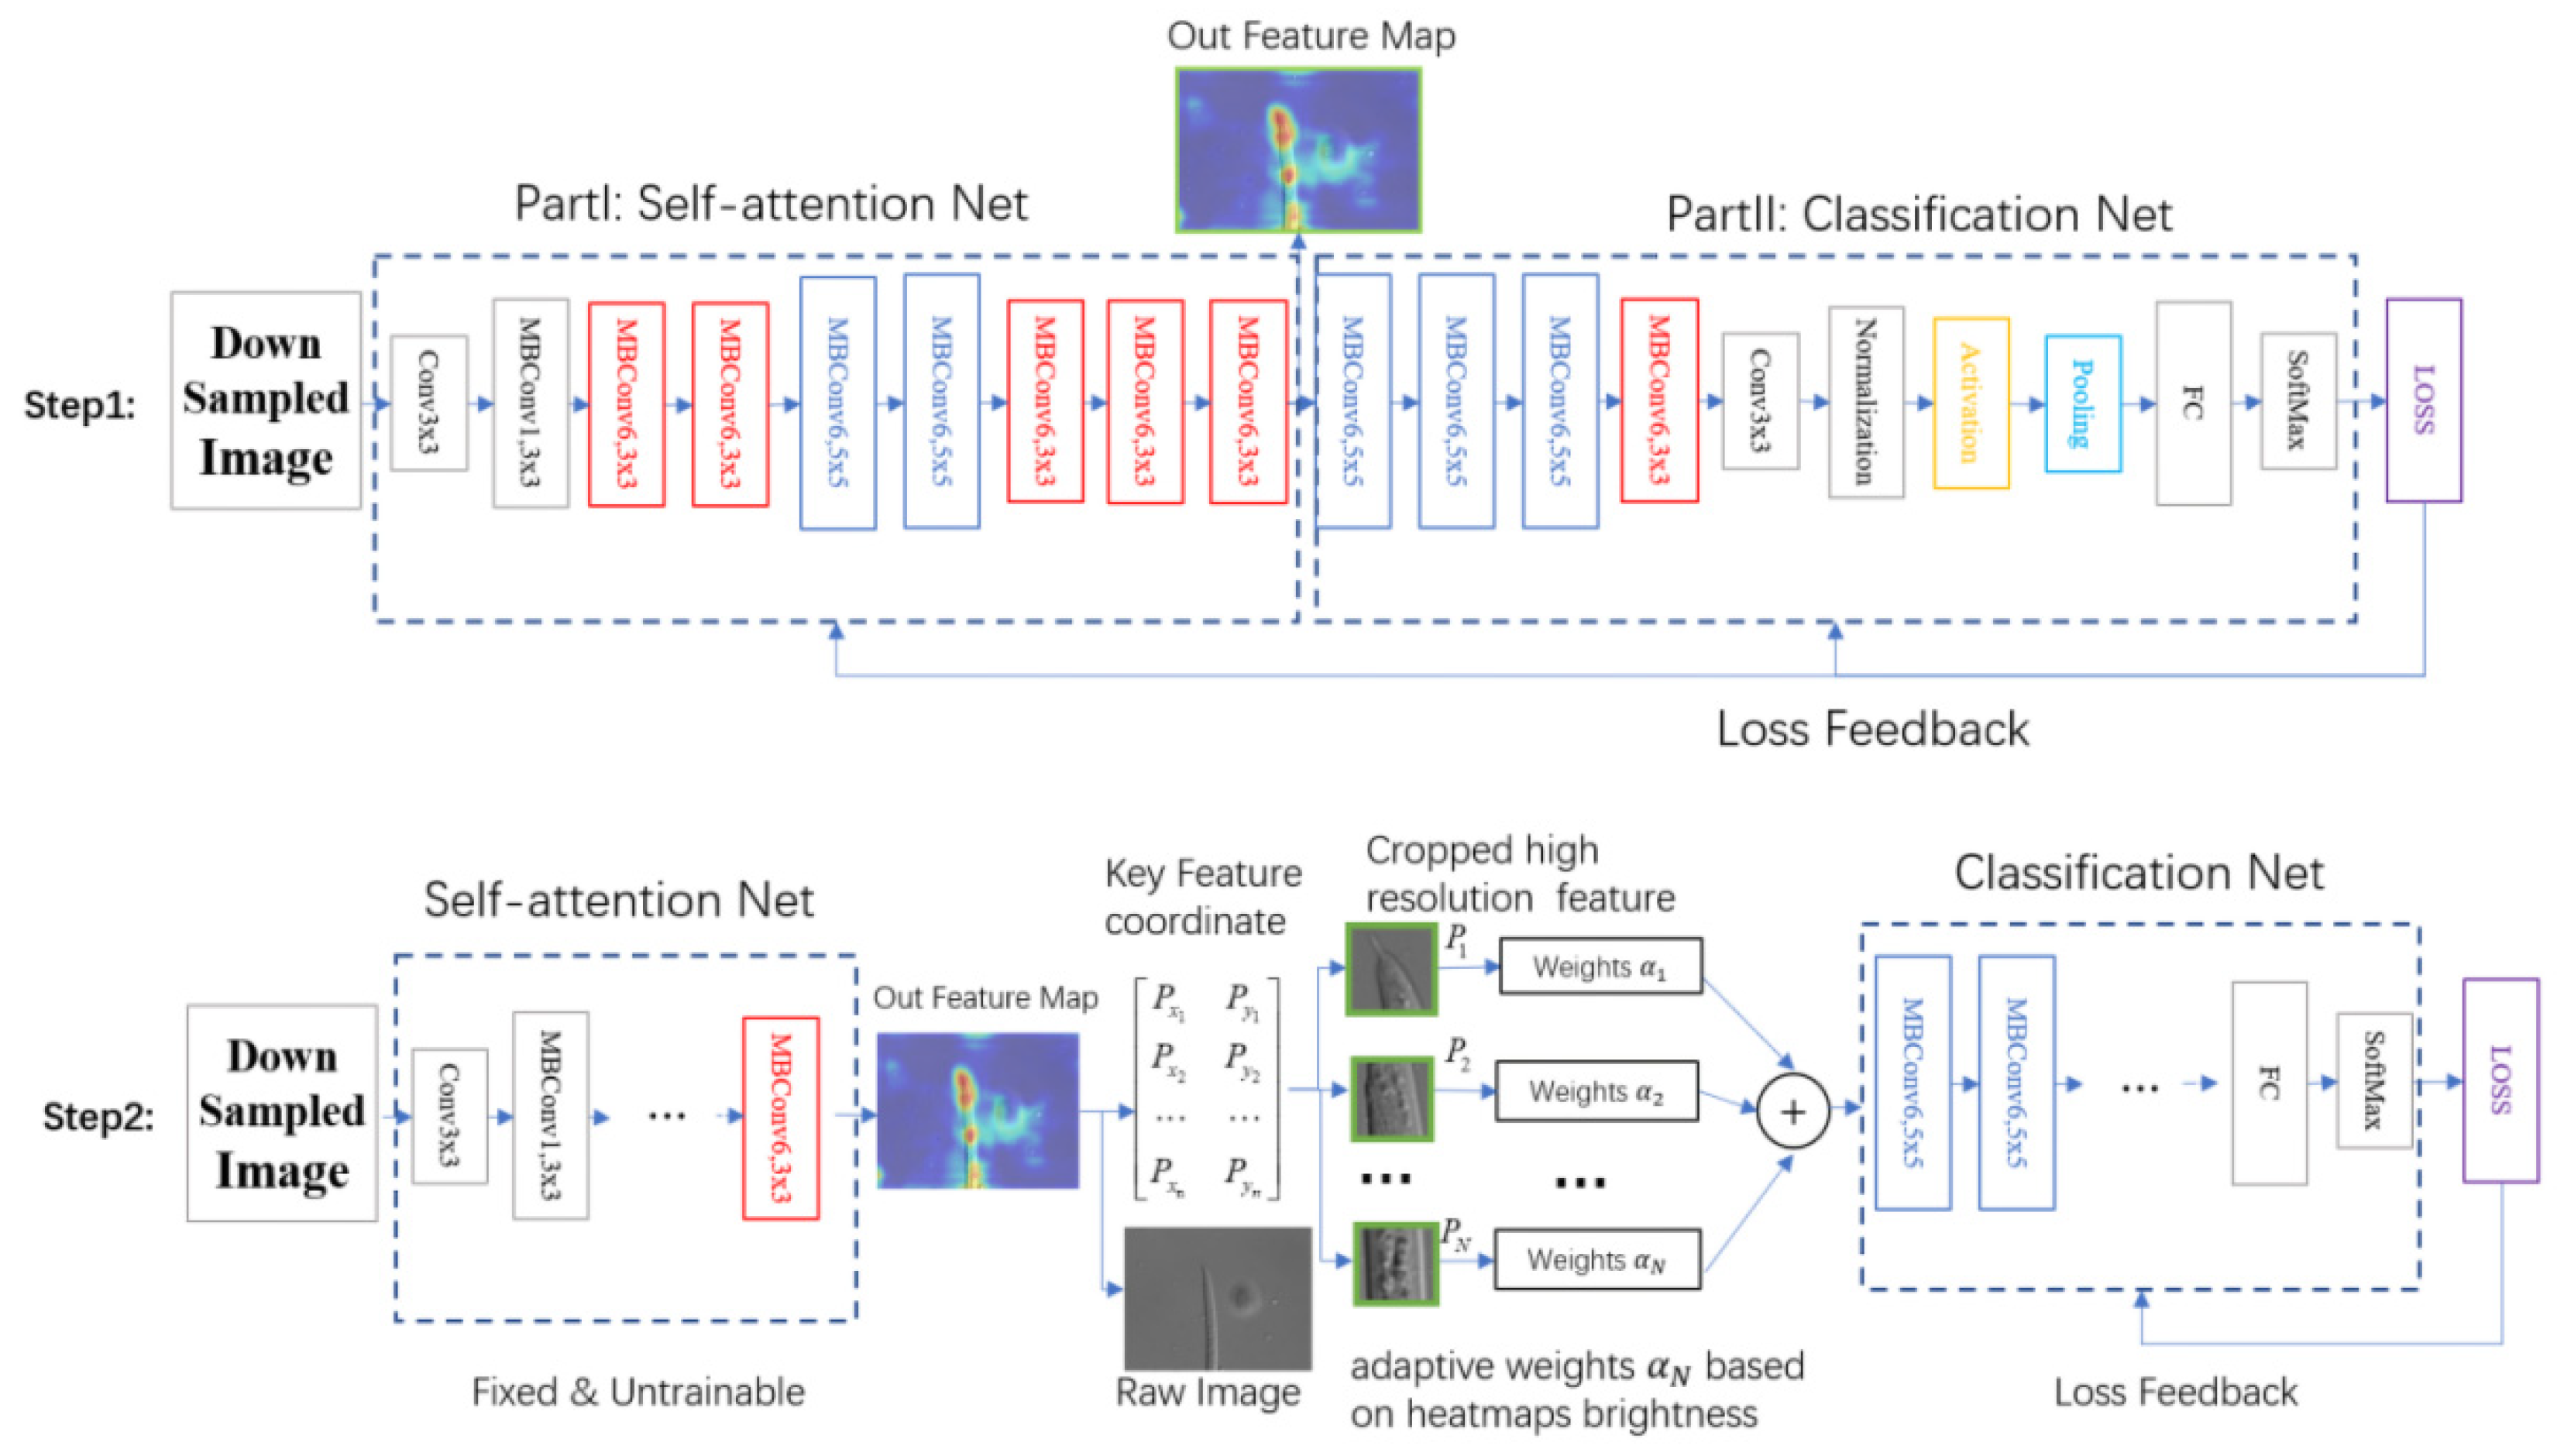
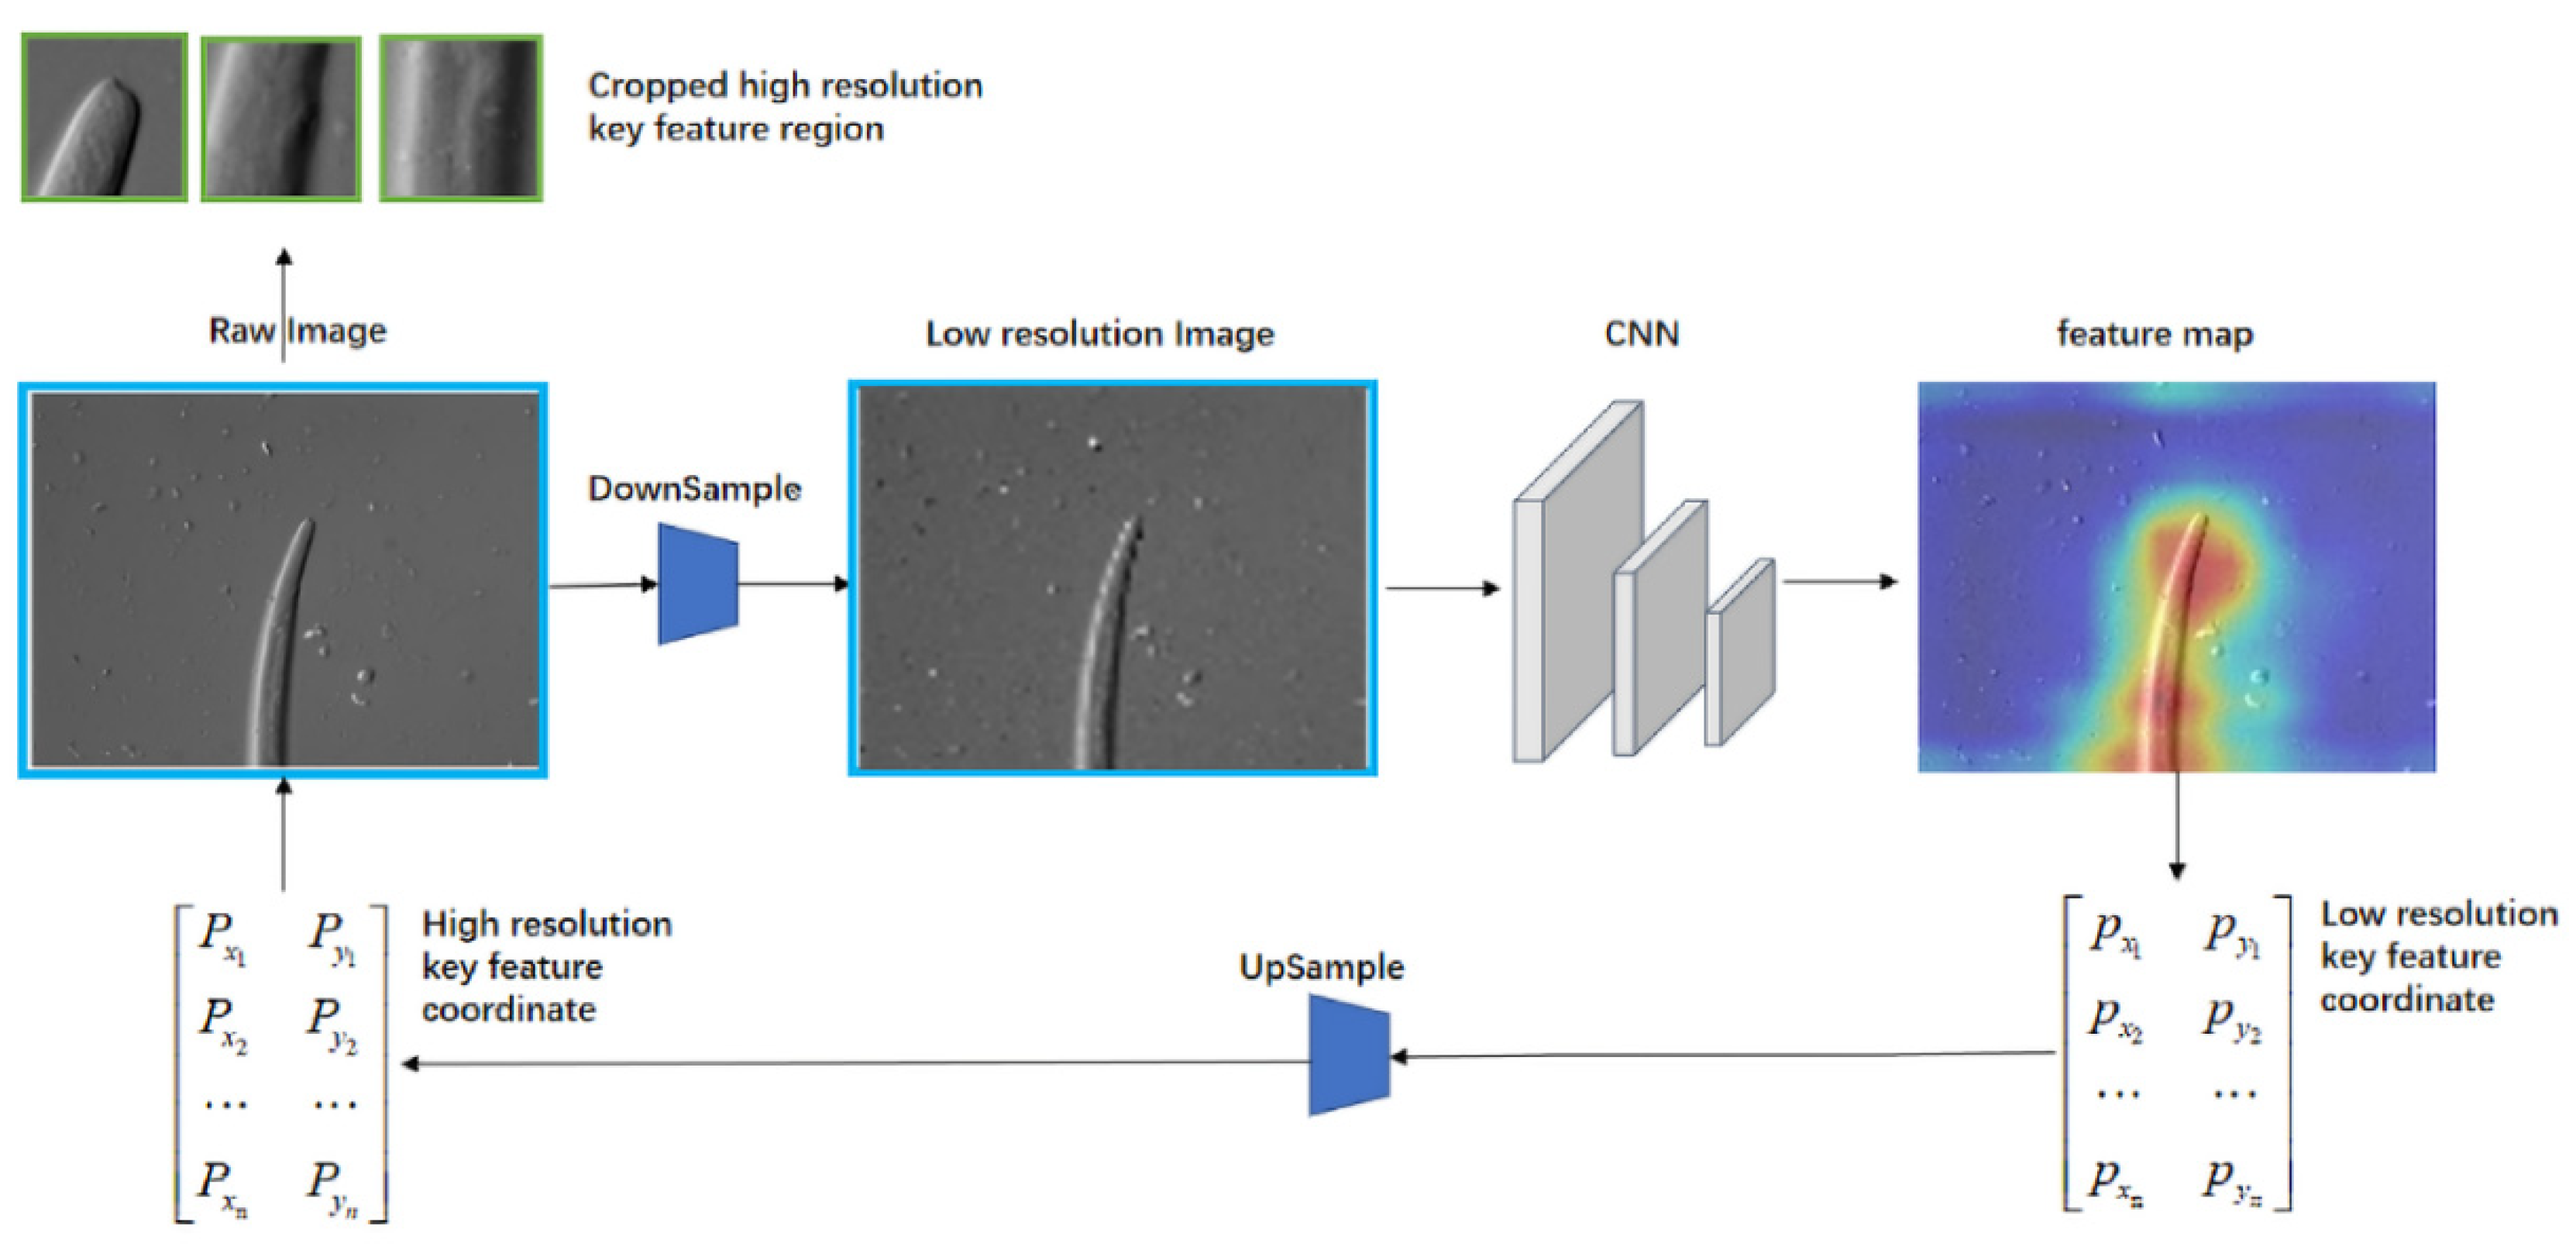
2.2.1. Part A: Self-Attention Feature Network

For any given high-resolution plant nematodes image, to better help the neural network to classify, we need to assist it in eliminating the influence of non-critical redundant information as much as possible.
Generally, we train additional attentional feature recognition networks based on general-purpose neural networks such as Faster R-CNN, with the help of expert empirical knowledge and through extensive time-consuming labelling. Figure 7 (green box detect correctly/red box detect incorrectly) shows the result of the attention network trained based on the labelled data to identify key features. It can be found that the detection network has a certain recognition error. As the network model complexity increases, its false detection rate has decreased, but it also brings the disadvantages of a large model, complex networks, and increased computational time-consuming.
In order to better save labelling time and reduce the cost of storage and computation time consuming by using networks such as Faster R-CNN, a Self-Attention feature network is proposed in this paper. The following figure shows the process of the neural network. As shown in Figure 8 above, the training based on the Self-Attention neural network is divided into two main parts. Step 1: Through the joint training of the Self-Attention Net and Classification Net, the high-precision feature heatmap of the Self-Attention Net is obtained. At this time, both parameters of the Self-Attention Net and Classification Net are trainable. Step 2: Fix the Self-attention Netparameters, find the key feature center coordinates (Px, Py) through the output heatmap to obtain the original high-resolution image information, then calculate the feature areas adaptive weights according to the average brightness of the heatmap areas to input to the classification network train again until loss converges.
The following figure shows the key feature regions obtained from the Self-Attention feature network with different iteration times compared with the features based on the expert knowledge network:
According to Figure 9, it can be found that as the iteration times increases, the key feature areas of the output of the Self-Attention feature network become closer and closer to the expert manual output. When the loss is fully converged, the attention areas obtained according to the method in this paper obtains higher classification accuracy than the expert knowledge. In a sense, the method in this paper finds the feature areas that is better than the expert experience, and there is also a significant improvement in the network complexity and training time consumption. The results are shown as follows Table 1.

2.2.2. Small-Scale Fast Focus Method

Based on the Self-Attention feature network in Section 3.1, we can find the attention feature areas of interest, but this method uses high-resolution images as input, which has serious redundancy of image information and leads to high testing time consumption. In this paper, we use multiple down-sampled low-resolution images to find key feature areas, and maps the coordinates of the found key feature areas to high-resolution images to obtain high-resolution key feature areas, which further saves and optimizes the network computational power, as shown in the picture below.
As shown in Figure 10, for the input high-resolution original image, the scaling is first performed as follows:
I = k I
where I is the low-resolution image obtained after image scaling, k is the scaling parameter. Then, the features are extracted from the low-resolution images as follows:
F M ( I ) = f ( P * I )
where the extracted features are denoted as P * I , * denotes the set of operations of convolution, pooling and activation, P denotes the overall parameters, F M denotes the generated attention map, f ( ) denotes the fully connected layer that maps the convolution feature to the feature vectors that can be matched with the plant nematodes category. The coordinates of the centers of key feature areas are obtained by finding the key points in the attention map where the feature values are most obvious, thus guiding the deep learning network to learn the key feature part of plant nematodes adaptively.
{ p x , p y } = M max ( F M )
where px and py represent the x and y axis coordinates of the key points with the most obvious feature values, which are obtained by calculating the feature heatmap Mmax(·). By the above process, we can get the key areas coordinates on the low-resolution image.
Afterwards, for the coordinates obtained in the low-resolution image, the scaling is reversed according to the scaling parameter:
{ P x , P y } = { 1 k p x , 1 k p y }
where Px and Py denote the x and y axis coordinates of the center point of the key areas obtained by the low-resolution image on the high-resolution image. Expanding outwards with Px and Py as the center, we can get the rectangular box coordinates of the key areas on the original image.
A re a = [ ( P x a , P y + b ) ( P x + a , P y + b ) ( P x a , P y b ) ( P x + a , P y b ) ]
where A re a represents the whole rectangular box, a and b are custom variable parameter. The experimental results with different area sizes and down-sampling times are shown in Figure 11A below. It is verified that the best recognition results are obtained when a = 50 and b = 50 , that is when the feature area of 100 × 100 is intercepted on the original high-resolution image. At the same time, we gradually increase the down-sampling times. When down-sampling once, both accuracy and efficiency can be taken into consideration. Then, the accuracy will decrease significantly as the down-sampling times increases. The following picture shows the comparison results of detection accuracy under different down-sampling times and feature areas sizes.

2.2.3. Multi-Feature Joint Classification Network Based on Adaptive Weights of Heatmap Brightness

Based on Section 2.2.1 and Section 2.2.2, the original plant nematodes image is input, the image block {P1, P2,..., PN} containing the key feature areas of the plant nematodes are obtained by the Self-Attention feature network and the small-scale fast focus module, where N is the number of blocks. For different areas blocks, the matrix weight αn is related to the average brightness ratio of the corresponding heatmap areas. After multiplying the obtained feature areas block PN with the corresponding weight αn, they are fed into the classification convolutional neural network. The specific process is shown as follows Figure 12.
The loss function used for the neural network is the cross-entropy loss function [9], its expression is as follows:
L o s s = 1 N i L i = 1 N i i M y i c log ( p i c )  
where M is the number of categories, yic denotes the variable, which is 1 if the predicted category of the sample i is the same as the true category (equal to c), otherwise it is 0, Pic is the predicted probability of the observed sample i belonging to category c.
The following Table 2 and Figure 13 shows the comparison result of the comparison of detection accuracy and weights ratio using heatmap adaptive and equal ratio weights. It can be found using the adaptive ratio weights based on the average brightness of the heatmap can further improve the detection accuracy compared to the equal ratio method for different number of joint feature input experiments.

3. Results

3.1. Experiment Environment Match

The experimental environment in this paper is an Intel Core i7-8700k 3.70 GHZ 12-core CPU, NVIDIA RTX2080 Ti GPU with 11 GB display memory, 32 GB RAM, configured with the TensorFlow open-source deep learning framework on Linux16.04 system [10].
In measuring the model performance, the accuracy rated was selected as the main evaluation metric in this paper [25].
A c c u r a c y = T P + T N T P + F P + F N + T N
Among them, TP (True Positive) is actually positive and predicted as positive; FP (False Positive) is actually negative but predicted as positive; TN (True Negative) is actually negative and predicted as negative; FN (False Negative) is actually a positive class but predicted to be a negative class. The performance of different models can be measured by comparing the accuracy.
The experiments test the algorithm proposed in this paper and also compare it with traditional neural network models such as Faster R-CNN and YOLO. The experiments not only compare the accuracy rate of the models, but also the training and testing time of the models.
For the training hyperparameters, we choose the adaptive iterative learning rate, the kinetic energy is set to 0.9, the weight decay is set to 0.0005.

3.2. Dataset

The plant nematodes dataset for training and testing in this paper includes 24 species of plant nematodes, with a total of 11,237 images, the image resolution is unified to 1388 × 1040, of which 9126 are used for training and 2111 are used for testing.

3.3. Performance Comparison

3.3.1. Results of Self-Attention Network

The Self-Attention network used in this paper further improves the detection accuracy while effectively saving the size of the network model, and the key feature locations output by the neural network match well with the expert experience. As shown in the Figure 14 below, the deviations of the coordinate positions calibrated according to the expert experience are compared with the coordinate positions of the key feature centers output by the Self-Attention network. It can be seen that the key feature positions judged by the Self-Attention network are in good agreement with the expert experience, and the average error rate of the calibrated x and y axis coordinates is only 0.552%.

3.3.2. Efficiency and Accuracy Improvement

The method in this paper avoids a lot of manual labelling and reduces the time cost required for data labelling. Meanwhile, the Self-Attention network in this paper is more lightweight, coupled with the fast search of low-resolution images and the multi-feature joint detection with adaptive weights, it further reduces the model size, training, and testing time, while ensuring the final accuracy of the algorithm.
From the experimental results in Figure 15 and Table 3 above, it can be concluded that based on the method in this paper, we avoid the tedious processes of extensive manual labelling. We improve the average training time of the model by more than 50%, reduce the testing time of a single sample by about 27%, optimize the model size by 65%. The detection accuracy of the ImageNet pre-trained model is improved by 12.6%, and the detection accuracy of the no-ImageNet pre-trained model is improved by more than 48%.

4. Conclusions

In this paper, the detection of phytopathogenic Bursaphelenchus xylophilus with small size and very weak inter-species differences is taken as an example. Our work has been carried out in response to the current weakly differentiated target detection problems. Its advantages can be summarized as follows:
  • The detection accuracy of our proposed method reaches 99%.
  • Compared with other methods, our method is the fastest.
  • We constructed a more complete high-resolution training dataset involving 24 species of Bursaphelenchus xylophilus and other common hybrid species with a total amount of data exceeded 10,000.

Author Contributions

Conceptualization, J.Z.; formal analysis and data curation, Y.L., N.X. and Y.Z.; supervision, J.X., J.G. and T.M. All authors have read and agreed to the published version of the manuscript.

Funding

This work was supported by the Ningbo Science and Technology Innovation Project (NO. 2020Z019), by Scientific Research Project of the General Administration of Customs (NO. 2020HK161), by National Natural Science Foundations of China (NO. 62005128).

Data Availability Statement

The data presented in this study are available on request from the author.

Acknowledgments

Thanks to the editors and reviewers for their careful review, constructive suggestion and reminding.

Conflicts of Interest

The authors declare no conflict of interest.

References

  1. Nicol, J.M.; Turner, S.J.; Coyne, D.L.; den Nijs, L.; Hockland, S.; Maafi, Z.T. Current nematode threats to world agriculture. Genom. Mol. Genet. Plant-Nematode Interact. 2011, 21–43. [Google Scholar] [CrossRef]
  2. Bernard, G.C.; Egnin, M.; Bonsi, C. The impact of plant-parasitic nematodes on agriculture and methods of control. Nematol. -Concepts Diagn. Control. 2017, 10, 121–151. [Google Scholar]
  3. Hallmann, J.; Subbotin, S.A. Methods for extraction, processing and detection of plant and soil nematodes. Plant Parasit. Nematodes Subtrop. Trop. Agric. 2018, 87–119. [Google Scholar]
  4. Liu, M.; Wang, X.; Liu, X. Classification of multi-focal nematode image stacks using a projection based multilinear approach. In Proceedings of the 2017 IEEE International Conference on Image Processing (ICIP), Beijing, China, 17–20 September 2017; IEEE: New York, NY, USA, 2018; pp. 595–599. [Google Scholar]
  5. Chou, Y.; Lee, D.J.; Zhang, D. Edge Detection Using Convolutional Neural Networks for Nematode Development and Adaptation Analysis. In Proceedings of the International Conference on Computer Vision Systems; Springer: Cham, Switzerland, 2017; pp. 228–238. Available online: https://books.google.com.hk/books?hl=zh-CN&lr=&id=rHg5DwAAQBAJ&oi=fnd&pg=PA228&ots=IXnEZSxKS7&sig=wvjgp3c9kWq58ZEiIGUZoDTT6Qs&redir_esc=y#v=onepage&q&f=false (accessed on 19 October 2022).
  6. Liu, M.; Wang, X.; Zhang, H. Taxonomy of multi-focal nematode image stacks by a CNN based image fusion approach. Comput. Methods Programs Biomed. 2018, 156, 209–215. [Google Scholar] [CrossRef] [PubMed]
  7. Braun-Kiewnick, A.; Kiewnick, S. Real-time PCR, a great tool for fast identification, sensitive detection and quantification of important plant-parasitic nematodes. Eur. J. Plant Pathol. 2018, 152, 271–283. [Google Scholar] [CrossRef]
  8. Kurmi, Y.; Gangwar, S.; Agrawal, D.; Kumar, S.; Srivastava, H.S. Leaf image analysis-based crop diseases classification. Signal Image Video Process. 2021, 15, 589–597. [Google Scholar] [CrossRef]
  9. Li, X.; Yu, L.; Chang, D.; Ma, Z.; Cao, J. Dual cross-entropy loss for small-sample fine-grained vehicle classification. IEEE Trans. Veh. Technol. 2019, 8, 4204–4212. [Google Scholar] [CrossRef]
  10. Abadi, M.; Agarwal, A.; Barham, P. Tensorflow: Large-scale machine learning on heterogeneous distributed systems. arXiv 2016, arXiv:1603.04467. [Google Scholar]
  11. Huang, J.; Lu, X.; Chen, L.; Sun, H.; Wang, S.; Fang, G. Accurate Identification of Pine Wood Nematode Disease with a Deep Convolution Neural Network. Remote Sens. 2022, 14, 913. [Google Scholar] [CrossRef]
  12. Doshi, R.A.; King, R.L.; Lawrence, G.W. Wavelet-SOM in feature extraction of hyperspectral data for classification of nematode species. In Proceedings of the International Geoscience and Remote Sensing Symposium, Barcelona, Spain, 23–28 July 2007; IEEE: New York, NY, USA, 2008; pp. 2818–2821. [Google Scholar] [CrossRef]
  13. Romain, T.; Van Linh, L.E.; Heloïse, V.; Alain, B.; Marie, B.; Eric, G.; Laurent, F.; Nicolas, P. Image based species identification of Globodera quarantine nematodes using computer vision and deep learning. Comput. Electron. Agric. 2021, 186, 106058. [Google Scholar]
  14. Uhlemann, J.; Cawley, O.; Kakouli-Duarte, T. Nematode Identification using Artificial Neural Networks. In Proceedings of the 1st International Conference on Deep Learning Theory and Applications-DeLTA, Paris, France, 8–10 July 2020; pp. 13–22. [Google Scholar] [CrossRef]
  15. Carneiro, R.; de Oliveira Lima, F.S.; Correia, V.R. Methods and tools currently used for the identification of plant parasitic nematodes. Nematol. -Concepts Diagn. Control 2017, 19. [Google Scholar]
  16. Ren, S.; He, K.; Girshick, R.B.; Sun, J. R-CNN: Towards real-time object detection with region proposal networks. Adv. Neural Inf. Process. Syst. 2015, 28, 91–99. [Google Scholar] [CrossRef] [PubMed] [Green Version]
  17. Redmon, J.; Divvala, S.; Girshick, R. You only look once: Unified, real-time object detection. In Proceedings of the Conference on Computer Vision and Pattern Recognition, Las Vegas, NV, USA, 27–30 June 2016; IEEE: New York, NY, USA, 2016; pp. 779–788. [Google Scholar]
  18. Schandry, N.; Becker, C. Allelopathic plants: Models for studying plant–interkingdom interactions. Trends Plant Sci. 2020, 25, 176–185. [Google Scholar] [CrossRef]
  19. Holladay, B.H.; Willett, D.S.; Stelinski, L.L. High throughput nematode counting with automated image processing. BioControl 2016, 61, 177–183. [Google Scholar] [CrossRef]
  20. Chen, Y.; Li, W.; Sakaridis, C. Domain adaptive faster r-cnn for object detection in the wild. In Proceedings of the Conference on Computer Vision and Pattern Recognition, Salt Lake City, UT, USA, 18–23 June 2018; IEEE: New York, NY, USA, 2018; pp. 3339–3348. [Google Scholar]
  21. Qin, J.; Wang, B.; Wu, Y. Identifying Pine Wood Nematode Disease Using UAV Images and Deep Learning Algorithms. Remote Sens. 2021, 13, 162. [Google Scholar] [CrossRef]
  22. Lee, S.; Park, S.; Baek, G. Detection of damaged pine tree by the pine wilt disease using UAV Image. Korean J. Remote Sens. 2019, 35, 359–373. [Google Scholar]
  23. Chen, L.; Strauch, M.; Daub, M. A CNN framework based on line annotations for detecting nematodes in microscopic images. In Proceedings of the 17th International Symposium on Biomedical Imaging (ISBI), Iowa City, IA, USA, 3–7 April 2020; IEEE: New York, NY, USA, 2020; pp. 508–512. [Google Scholar]
  24. Simonyan, K.; Zisserman, A. Very Deep Convolutional Networks for Large-Scale Image Recognition. Computer Science. airXiv 2014, arXiv:1409.1556. [Google Scholar]
  25. Wu, J.; Zhang, Q.; Liu, M.; Xiao, Z.; Zhang, F.; Geng, L.; Liu, Y.; Wang, W. Diabetic macular edema grading based on improved Faster R-CNN and MD-ResNet. Signal Image Video Processing 2021, 15, 743–751. [Google Scholar] [CrossRef]
Figure 1. Bursaphelenchus xylophilus and Bursaphelenchus mucronatus.
Electronics 11 03497 g001
Figure 2. Bursaphelenchus key features.
Electronics 11 03497 g002
Figure 3. Types of plant nematodes.
Electronics 11 03497 g003
Figure 4. Entire image input process.
Electronics 11 03497 g004
Figure 5. Detection method based on attention map.
Electronics 11 03497 g005
Figure 6. Overall network structure.
Electronics 11 03497 g006
Figure 7. Effect of neural network recognition of different model sizes.
Electronics 11 03497 g007
Figure 8. Self-Attention feature network architecture.
Electronics 11 03497 g008
Figure 9. Comparison of output results between the Self-Attention features.
Electronics 11 03497 g009
Figure 10. Multi-feature area joint detection method based on low-resolution fast focusing network.
Electronics 11 03497 g010
Figure 11. Experimental results of different down-sampling times and different feature areas size. (A) Feature Area Size; (B) Input Image Size.
Electronics 11 03497 g011
Figure 12. Classification network.
Electronics 11 03497 g012
Figure 13. Comparison results of detection accuracy of different weights ratio.
Electronics 11 03497 g013
Figure 14. Comparison of expert annotation and feature map.
Electronics 11 03497 g014
Figure 15. Comparison of training, detection, model size, and accuracy.
Electronics 11 03497 g015aElectronics 11 03497 g015b
Table 1. Detection comparison network and expert knowledge feature network.
MethodsAnnotation TimeModel ParametersTraining TimeDetect TimeAccuracy
Expert Network2 Day44 M7.5 h1.8 s0.93
Ours011 M3 h1.1 s0.995
Table 2. Experimental parameter table of different weights ratio and detection accuracy.
Areas Number1234
Ratio--1:10.54:0.461:1:10.42:0.36:0.221:1:1:10.37:0.32:0.20:0.11
Accuracy0.98950.98950.99500.99530.99220.99340.99050.992
Table 3. Comprehensive comparison of training, detection, model size, and accuracy of specific parameters.
MethodTraining MethodModel ParametersAnnotation TimeTraining TimeDetect TimeAcctracy
TOLOImageNet20.8 M2 Day5 h1.3 s0.84
No-ImageNet0.62
Faster RCNNImageNet30 M2 Day6 h1.5 s0.88
No-ImageNet0.64
Expert NetworkImageNet44 M2 Day7.5 h1.8 s0.93
No-ImageNet0.72
OursImageNet11 M03 h1.12 s0.995
No-ImageNet0.98
Publisher’s Note: MDPI stays neutral with regard to jurisdictional claims in published maps and institutional affiliations.

