Article

Optimum of Grain Loss Sensors by Analyzing Effects of Grain Collision Attitude on Signal Characteristics

1
Key Laboratory of Modern Agricultural Equipment and Technology, Ministry of Education, Jiangsu University, Zhenjiang 212013, China
2
Cimc Safeway Technologies Co., Ltd., Nantong 226003, China
*
Author to whom correspondence should be addressed.
Electronics 2022, 11(19), 3187; https://doi.org/10.3390/electronics11193187
Submission received: 16 August 2022 / Revised: 19 September 2022 / Accepted: 26 September 2022 / Published: 4 October 2022

Abstract

:
Grain loss rate is an important indicator to evaluate the performance of combine harvesters. It is indicted that signal voltage amplitude and signal frequency are the key factors for designing a grain loss sensor. In this work, the high-speed photography and signal high-speed acquisition technique were utilized to capture grain collision attitude and the corresponding collision signal characteristics and the effect of grain moisture content and collision angle on signal voltage amplitude and signal frequency was studied in detail, which lays a good foundation for optimizing grain loss signal processing circuit parameters. Then, monitoring resolution of the grain loss sensor was improved by adding constrained damping layer to the sensitive plate under the instruction of experimental modal analysis. At last, a field experiment was carried out; the field experiment results indicate that the monitoring performance improved.

1. Introduction

The grain loss rate is an important index to evaluate the performance of combine harvesters and it is also the main basis for combined harvesters to adjust the working parameters [1]. At present, the grain loss in combine harvesters made by Chinese companies mainly depends on manual sampling measurement, which is low in efficiency and high in labor intensity. On the other hand, grain loss sensors have already been indispensable accessories in combine harvesters made by the Europe and US companies. The principle of grain loss sensors is mainly based on the piezoelectric effect; that is, when grain or the MOG (materials other than grain) collide with the sensitive plate, the attached piezoelectric element will convert the vibration force into corresponding voltage signal. The grain collision signal was figured out by the signal processing circuit after amplification, filtering processing. To improve the monitoring performance of the grain loss sensor, researchers have conducted a lot of relevant research. The representative research is described as follows: Strubbe, G et al. identified grain loss according to collision sound signal characteristics and extracting the sieve loss signal through amplification and filtering processing [2]. Ni designed a grain loss monitoring system with an amplifying and filtering circuit by selecting piezoelectric crystals as a sensing element [3]. Zhao et al., using piezoelectric polyvinylidene fluoride (PVDF) film as a sensing element for monitoring grain losses, a floating raft damping structure was used to construct the sensor to suppress the influence of vibrations. The measurement errors of grain cleaning loss recorded by the sensor, relative to the loss checked manually, were less than 15% [4]. Wei et al. designed a new seed sorting and monitoring system using Kalman filtering to shorten the decay time of the impact plate grain collision signal, which can effectively reduce the interference problem between signal codes [5]. Wang et al., using piezoelectric film as a sensitive material and adopting the support vector machine multi-classification algorithm to extract corn grain collision signals, realized real-time monitoring of corn grain loss [6]. Nie solved the monitoring error caused by multi-particle collision at the same time by identifying the particle position information on the sensor surface using the PVDF piezoelectric film as a sensing element [7]. Through the above studies, the monitoring accuracy was improved to a certain extent. Most of the research mainly concentrated on the sensor signal processing method and the voltage amplitude and signal frequency are the key parameters for designing a high-performance grain loss sensor. Therefore, obtaining these two parameters more accurately is the key to ensure the grain loss sensor performance. In this study, based on high-speed photography technology, the physical experiment of grain impact was carried out to analyze the signal data generated by the grain impact sensor at different angles. The frequency and amplitude of the signal generated by the grain impact loss sensor under different operating conditions of the combined harvester were studied and the parameters of the related signal conditioning circuit were successively improved to make the count of the grain loss sensor more accurate, so as to provide a guarantee for the design of an adaptive control system to reduce the clearance loss of the combined harvester.
Existing research on grain collision signal characteristics under different collision attitudes is usually through the discrete element method (DEM). Zhang and Loc simulated the impacts between a sphere and a frictionless rigid planar surface using the nonlinear finite-element method and the dependence of the restitution coefficient on the impact velocity was modeled [8]. Wojtkowski et al. conducted laboratory tests and numerical DEM simulations to evaluate regions of validity for two basic contact models to describe the impact behavior of rapeseed at four moisture contents [9]. Yigit, et al. established a visco-elastoplastic model for the impact between a compact body and a composite target and the model is a combination of a nonlinear contact law that includes energy loss due to plastic deformation and a viscous element that accounts for energy losses due to wave propagation and/or damping [10]. Zhao et al. established a triaxial ellipsoidal particle model according to the physical properties of rice seed and its impact behavior against a grain loss sensor was simulated using the discrete element method (DEM) [11]. Xu, et al. developed an array structure rapeseed grain loss sensor and analyzed the contact mechanical properties of each component of rape threshing mixture with the sensitive plate, which verified the feasibility of applying piezoelectric effect principle to monitor small seed loss. However, the established grain and straw models cannot accurately reflect the real physical and mechanical characteristics as rice grain and straw are organisms and the DEM simulation results can only be considered accurate on the bulk level as the individual interactions are averaged and this will lead to inaccurate calculation results [12].
As the mechanical behavior of materials of biological origin is strongly influenced by the moisture content, which changes the surface and mechanical properties of seed endosperm and influences the bulk behavior [9] to design a grain cleaning loss monitoring device with a higher measuring precision, selecting rice grains with different moisture content as experimental samples, collision signal characteristics were studied in detail by using the established grain collision test bench, which includes a high-speed photography device and a high-speed signal acquisition system. By analyzing grain movement trajectory and the corresponding collision signal characteristics, more reasonable signal processing circuit parameters were designed. Then, detection resolution of the grain loss sensor was improved though experimental modal analysis. At last, a field experiment was conducted to check the grain loss monitoring performance.

2. Materials and Methods

2.1. Grain Sample Preparation

The collision signal voltage is proportional to the maximum collision normal force; that is, the larger the normal collision force, the larger the signal voltage amplitude (Vmax). The signal rise time (tr) is a quarter of the collision signal period. Grain moisture content has a larger influence on the rise time and voltage amplitude as the moisture content will change the rice grain physical and mechanical characteristics. On the other hand, as the grain moisture content has an apparent fluctuation under different area and different harvesting time, it is necessary to study the effect of grain moisture content on collision signal characteristics under different collision angles, respectively. In this study, selecting rice grains with a moisture content of 17% (one thousand grain mass was 31.2 g), 22% (one thousand grain mass was 38.1 g) and 25% (one thousand grain mass was 43.6 g) as samples, grain collision experiment was carried out.

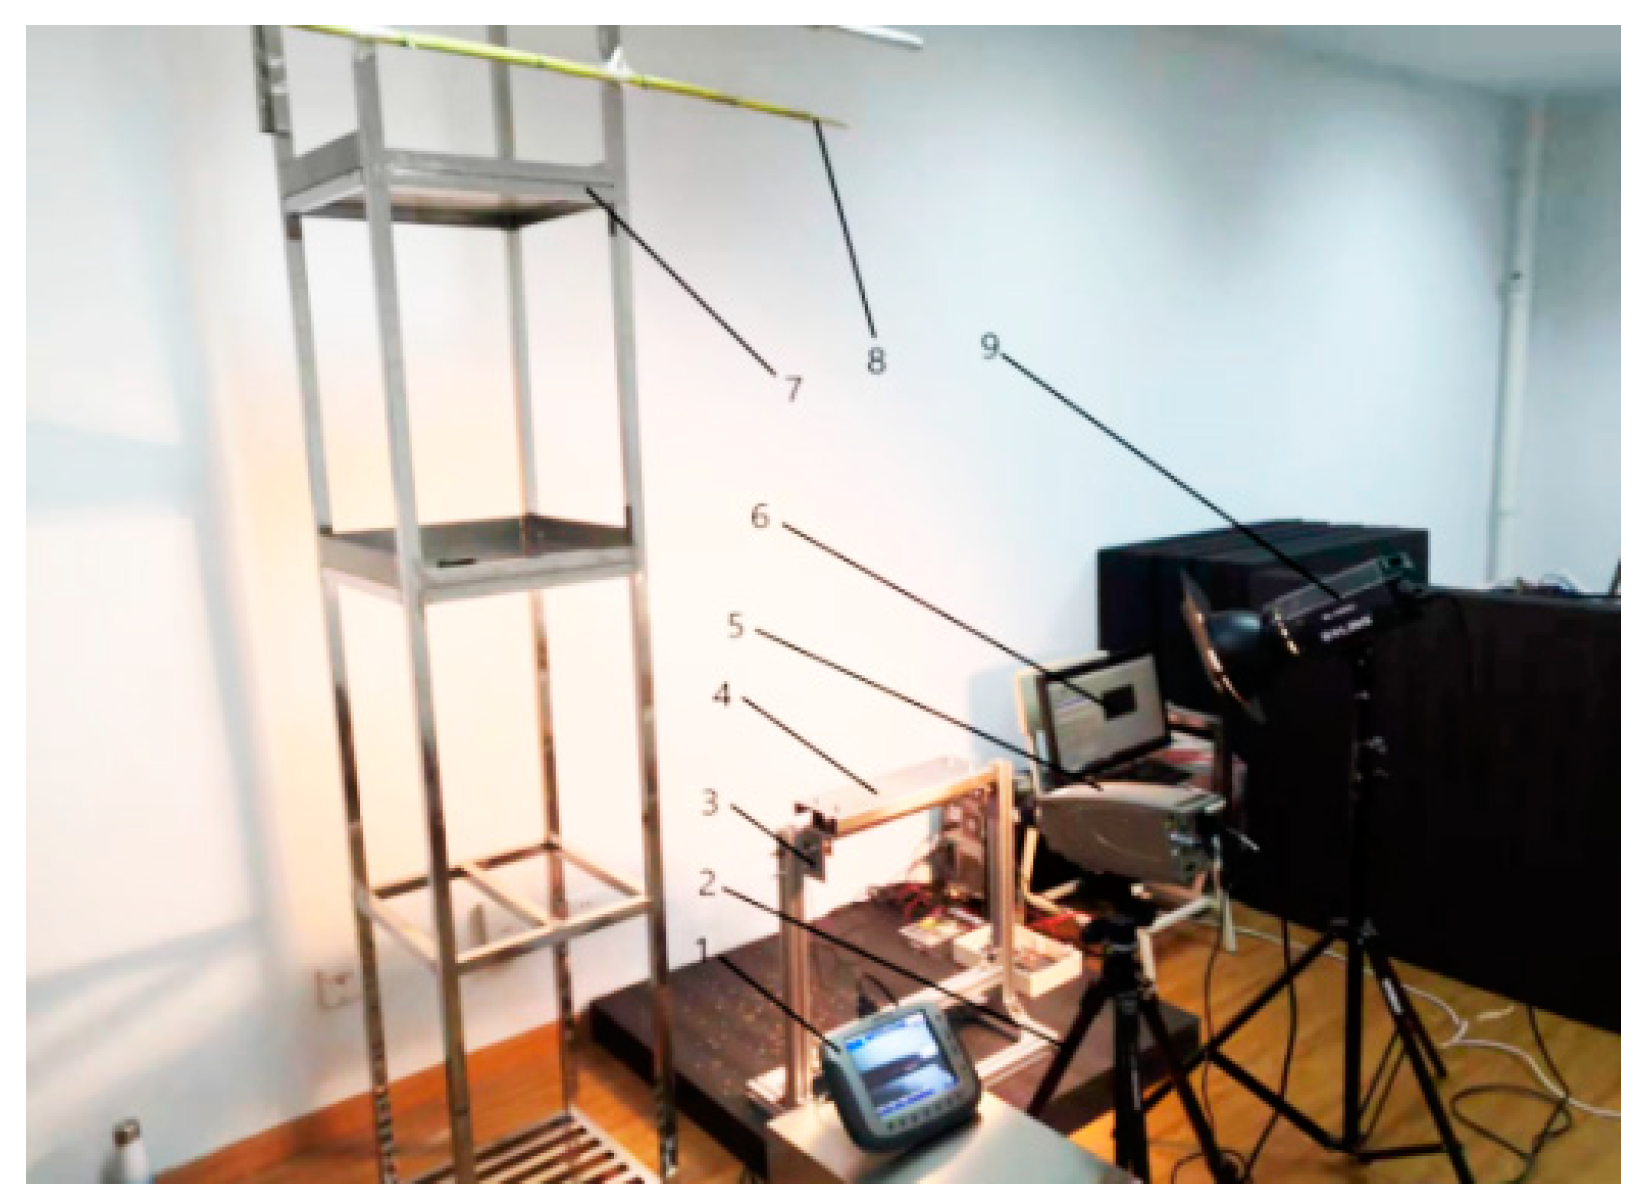
2.2. Grain Collision Information Collection

With the development of technology high-speed photography has been widely used in agricultural machinery optimization [13]. In this work, high-speed photography and signal high-speed acquisition technique were utilized to capture grain collision attitude and the corresponding collision signal characteristics under different collision angle, which lays a good foundation for optimizing the collision signal processing circuit parameters. The high-speed photography system was mainly composed of Olympus I-speed high-speed camera, high-speed photography display screen, support tripod, sensor mounting bracket, the grain loss sensor, high-speed collision information acquisition software, height-fixing frame and light supplement lamp, etc. The grain collision information high-speed acquisition system is mainly composed of FPGA AX7103 processor, voltage amplifier module AD620, signal acquisition module AN706, Ethernet communication module and the host software developed based on LabView15.0 software. When the grains collide with the sensitive plate in different angles, the generated voltage signal will be amplified by the AD620 voltage amplifier. Then, the amplified signal is processed by the AN706 signal acquisition module and the FIFO (first in first out) function is used to achieve data buffer. The information interaction was achieved through Ethernet communication between the host software and the processor. At last, the collected data were stored in the computer for subsequent signal observation and analysis. The AD7606 chip has an 8-channel 16-bit AD acquisition module, an input range ± 10 V, the maximum sampling rate is 200 ks/s and the sampling rate can be adjusted by software frequency division. The designed host software mainly consists of four subroutine programs: AD7606 data acquisition program, parallel serial conversion program, gigabit Ethernet asynchronous reset program and gigabit Ethernet communication program. Under the parallel execution of each subroutine, the sampling system completes signal collecting, processing, communicating and other tasks. Grain collision attitude and the corresponding grain collision signal capturing system are shown in Figure 1 and the composition of the collision signal data acquisition system is shown in Figure 2.
The experimental process was introduced as follows: after opening high-speed camera, setting the control mode as “μs”, the trigger position is set to trigger, frame rate was set to 500 frames per second, exposure time was set to 1500 μs, adjusting the high-speed camera aperture, focal length and light intensity based on the experimental environment until a clear image can be obtained at the collision moment, which was convenient for analyzing the instantaneous collision angle between grains and sensitive plate and its corresponding impact signal characteristics. Then, tap the “Start” button on the display to start shooting. The high-speed camera captures the whole grain falling process, after taking the picture, viewing the playback and clicking “Label” to save the grain collision process. Then, analyzing the saved synchronized video files through the high-speed camera-supporting software i-SPEED suite, calibrating the reference coordinate system using Calibrate function and obtaining the motion tracks of subsequent markers were based on this reference coordinate system. The software sets the video to play frame by frame and the rice grain collision trajectory was marked with different color tag using Analyze function. The marked position coordinates information was exported into Matlab 16.0 to draw the grain collision trajectory curve. Annotations were used to mark the grain collision angle in i-SPEED Suite software and the corresponding signal data collected by high-speed signal sampling system were imported into Matlab 16.0 to analyze the variation in signal voltage amplitude and signal rise time under different angles.
The angle between grain long axis and the sensitive plate at the collision moment was defined as collision angle θ, as shown in Figure 3a. Collision angles were marked in i-SPEED Suite, as shown in Figure 3b. The grain collision information was analyzed when the collision angle was at 0°, 15°, 30°, 45°, 60°, 75° and 90°, respectively.

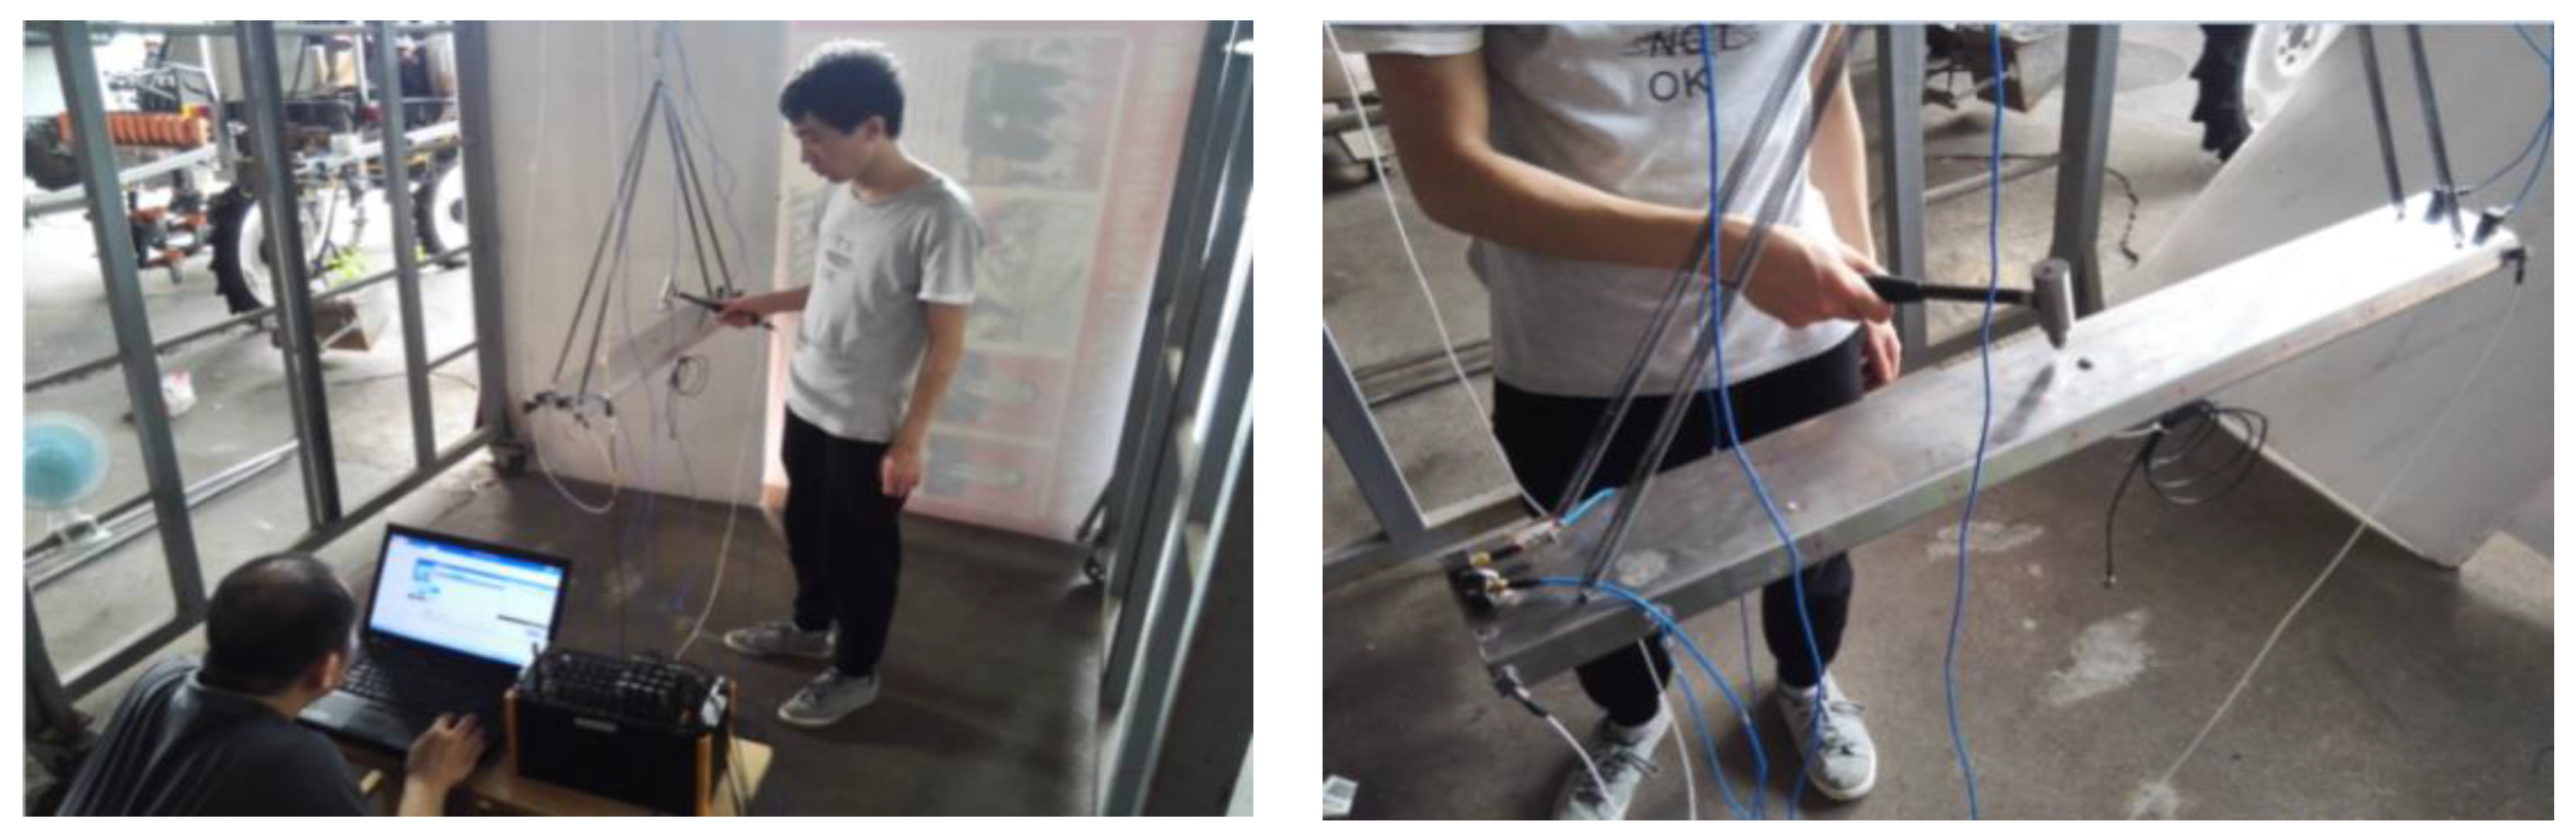
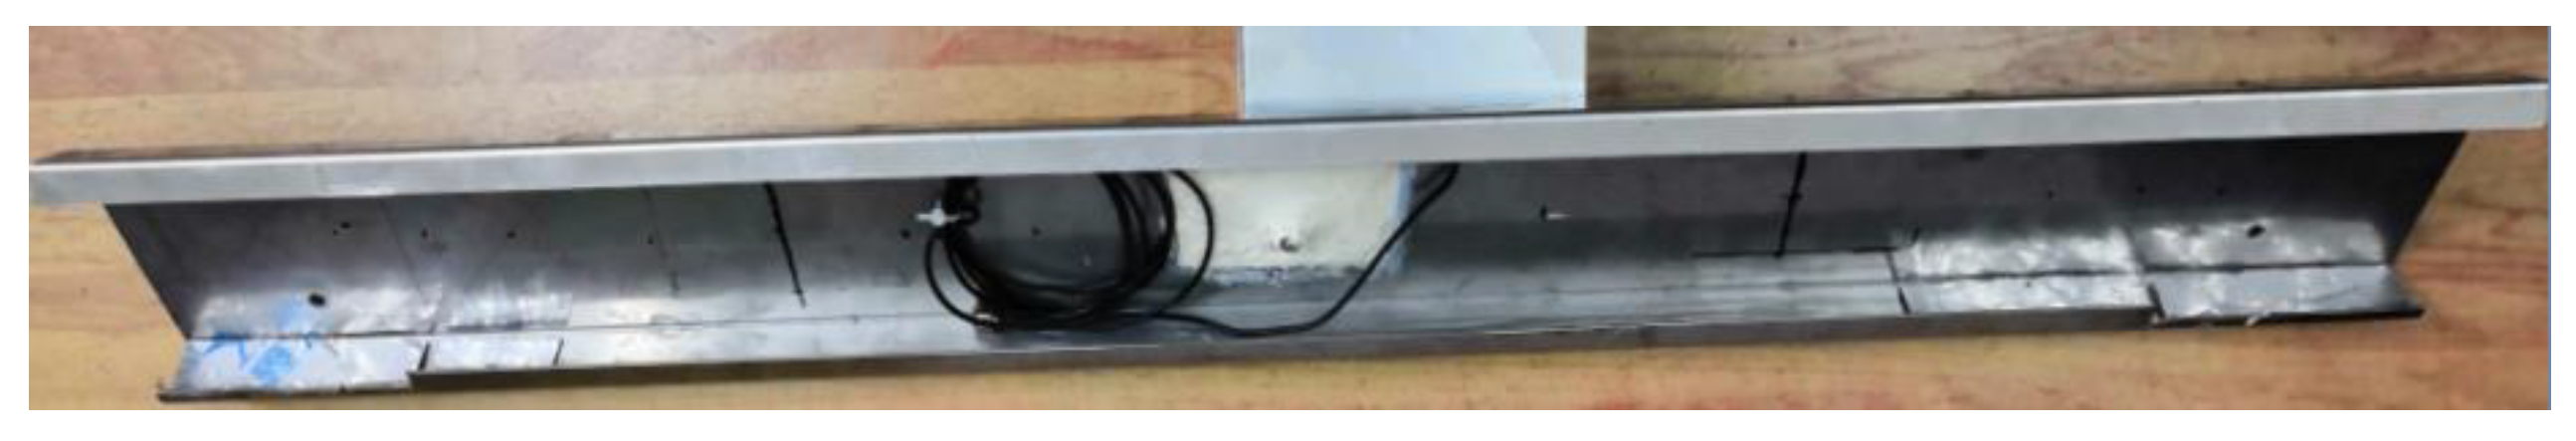
2.3. Partially Constrained Damping Design of the Sensor

The sensor structure has a paramount influence on signal attenuation time and voltage amplitude. It is indicated that the signal attenuation time is over 40 ms when a sensing element is attached to the sensitive plate without further treatment. Pasting the viscoelastic material onto the sensitive plate under the guidance of modal analysis results is an effective way to improve the sensor resolution [14]. A signal attenuation chart is shown in Figures 12 and 13. To obtain structure relative deformation rate, experimental modal analysis was carried out through vibration signal acquisition system (DH5902 dynamic signal acquisition instrument, Donghua testing company, Jinjiang, China). Parameters of the DH5902 dynamic signal acquisition system are shown in Table 1.
Single-point excitation method and frequency response analysis were used in experiment modal analysis to obtain the sensitive vibration mode. The test procedure was as follows: first, the measuring point in the sensitive plate was marked by a marker and the sensor was suspended in the air with 4 springs to simulate free support state. Then, six acceleration sensors (356A16, PCB, Depew, NY, USA) were adhered to 6 measurement points at two ends of the sensitive plate [15]. The exciting hammer (086D05, PCB, USA) was used to generate vibration in the centre of the sensitive plate, then the acceleration sensors convert the vibration signal into voltage signal and transfer the voltage signal into the DH5902 dynamic signal acquisition system through bidirectional connecting lines. Sampling mode is transient sampling with a sampling frequency of 2.56 kHz and frequency resolution of 0.625 Hz. The maximum hammer force is 113 N and signal trigger order is 10%. Negative delay point is 200. Frequency response type was H1. The window function was the rectangular window. Signals from 6 measuring points were measured at each strike, striking 4 times at each point. Linear average was carried out on the obtained signal after manual confirmation to improve the accuracy of the modal analysis results, repeating above steps until all the testing points were measured.
The modal parameters can be obtained by inputting the collected frequency response function into DHMA modal analysis software for peak search and parameter identification. First, we chose the force measurement algorithm as the modal analysis algorithm, then input the frequency response function of the signal analysis system into the modal analysis software and matched it with 43 measuring points. At last, peak search method was used to search modal peaks and admittance circle method was used to calculate modal parameters such as natural frequency and modal shape in parameter identification process. Measurement point location is shown in Figure 4. Modal test process is shown in Figure 5.

2.4. Field Experiment

To check the performance of the grain loss sensor, field experiment was carried out in 2021. The tested rice was Wuyun 0175, with average plant height of 876 mm and average spike length of 20 mm. The ear length was 21 mm, the average one-thousand kernel weight was 30 g and the average grain yield was 9585 kg ha−1; the averaged moisture content of the straw and the grains was 50.25% and 10.72%, respectively. The header width of the combine harvester was 2 m. During field experiments, the forward velocity of the combine harvester varied between 0.8 and 1.5 m s−1 to maintain a feed rate around 7 kg s−1 (Grain + MOG). The total test length is 58 m and the perforated bags were attached to the rear of the combine harvester to collect all the sieve outputs. Rice grains were isolated from the collected mixture using a re-cleaner (Agriculex ASC-3 Seed Cleaner, Guelph, ON, Canada) and weight to quantify the sieve losses. The grains detected by grain loss sensor were converted into mass according to thousand grain mass. Inputting the obtained ratio between the detected grain loss and total grain loss into the display screen, the sensor can reflect the grain sieve loss in real time when harvesting a specific type of crop in the field. Installation of the grain loss sensor in combine harvesters and field experiment is shown in Figure 6.

3. Results and Discussion

3.1. Grain Trajectory Analysis

When θ = 0°or 90°, the grain is only affected by the normal force and the grain rotation moment is zero, so the grain will rebound in the vertical direction after colliding with the sensitive plate. This process is called orthogonal collision. When 0°< θ < 90°, the grain collides with the sensitive plate obliquely, so the grain will rebound obliquely and is accompanied by rotational movement. The grain collision process is shown in Figure 7.
As the grain is only subjected to its own gravity in free fall processing, the change in falling height during the grain fall phase is almost the same before grain collision with the sensitive plate in both the orthogonal collision condition and oblique collision condition. Further, 0.01 s represents the moment when the grain first contacts the sensitive plate, as shown in Figure 8. The grains in the orthogonal collision process only rebound along the vertical direction and the grains in oblique collision process will rebound along the oblique upper part, accompanied by rotational movement. After the rebound, the grains will rise to nearly the same height for both modes, but the time required for the grains in the orthogonal collision process is shorter than that in oblique collision process. Δt represents the time difference between the two modes.

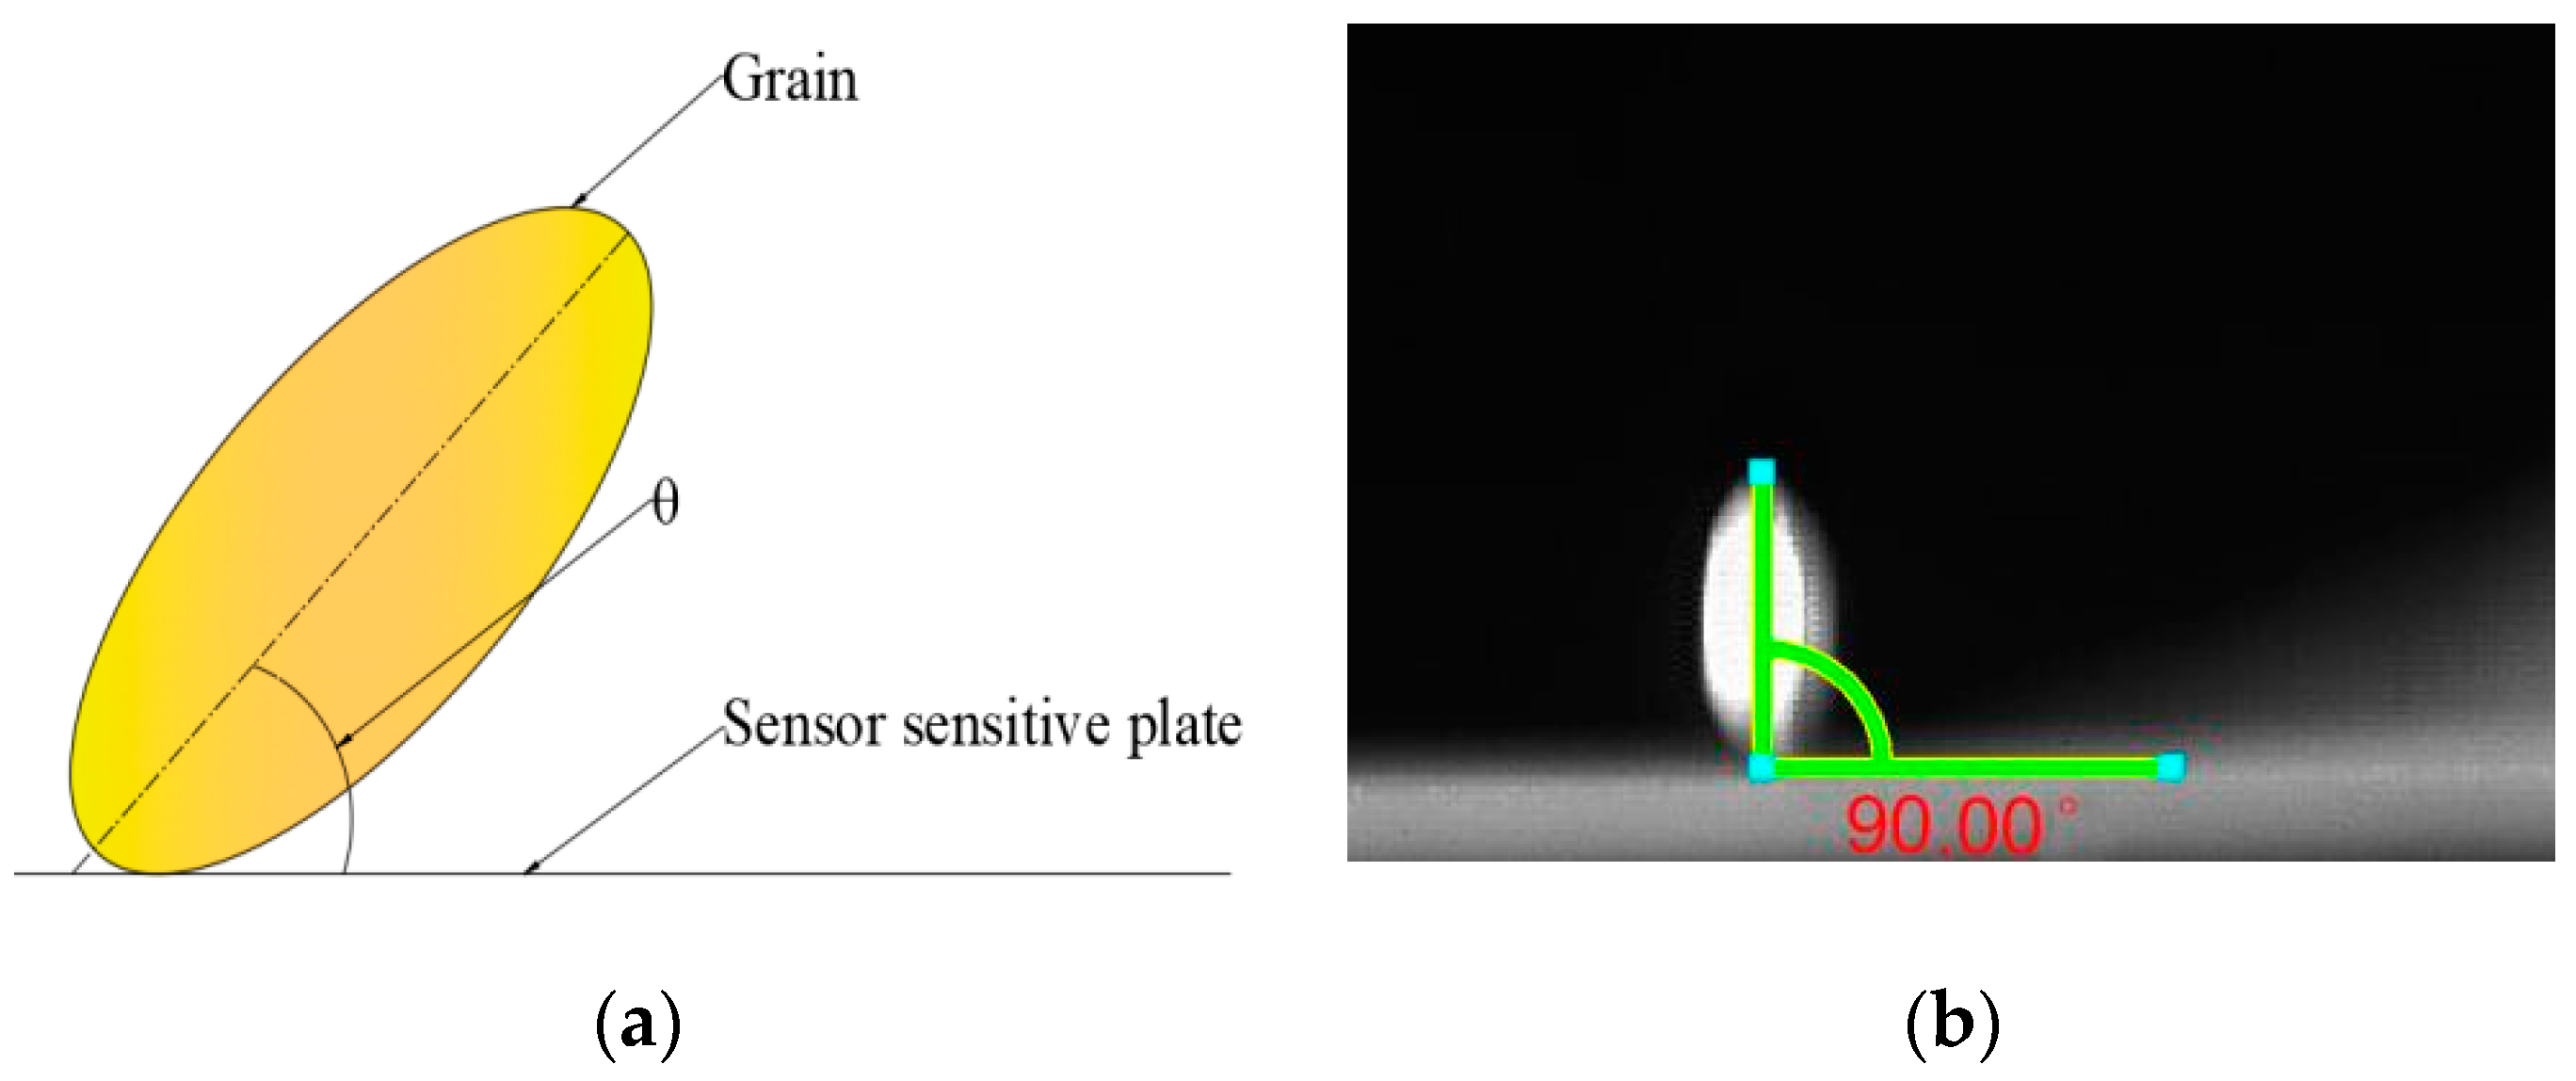
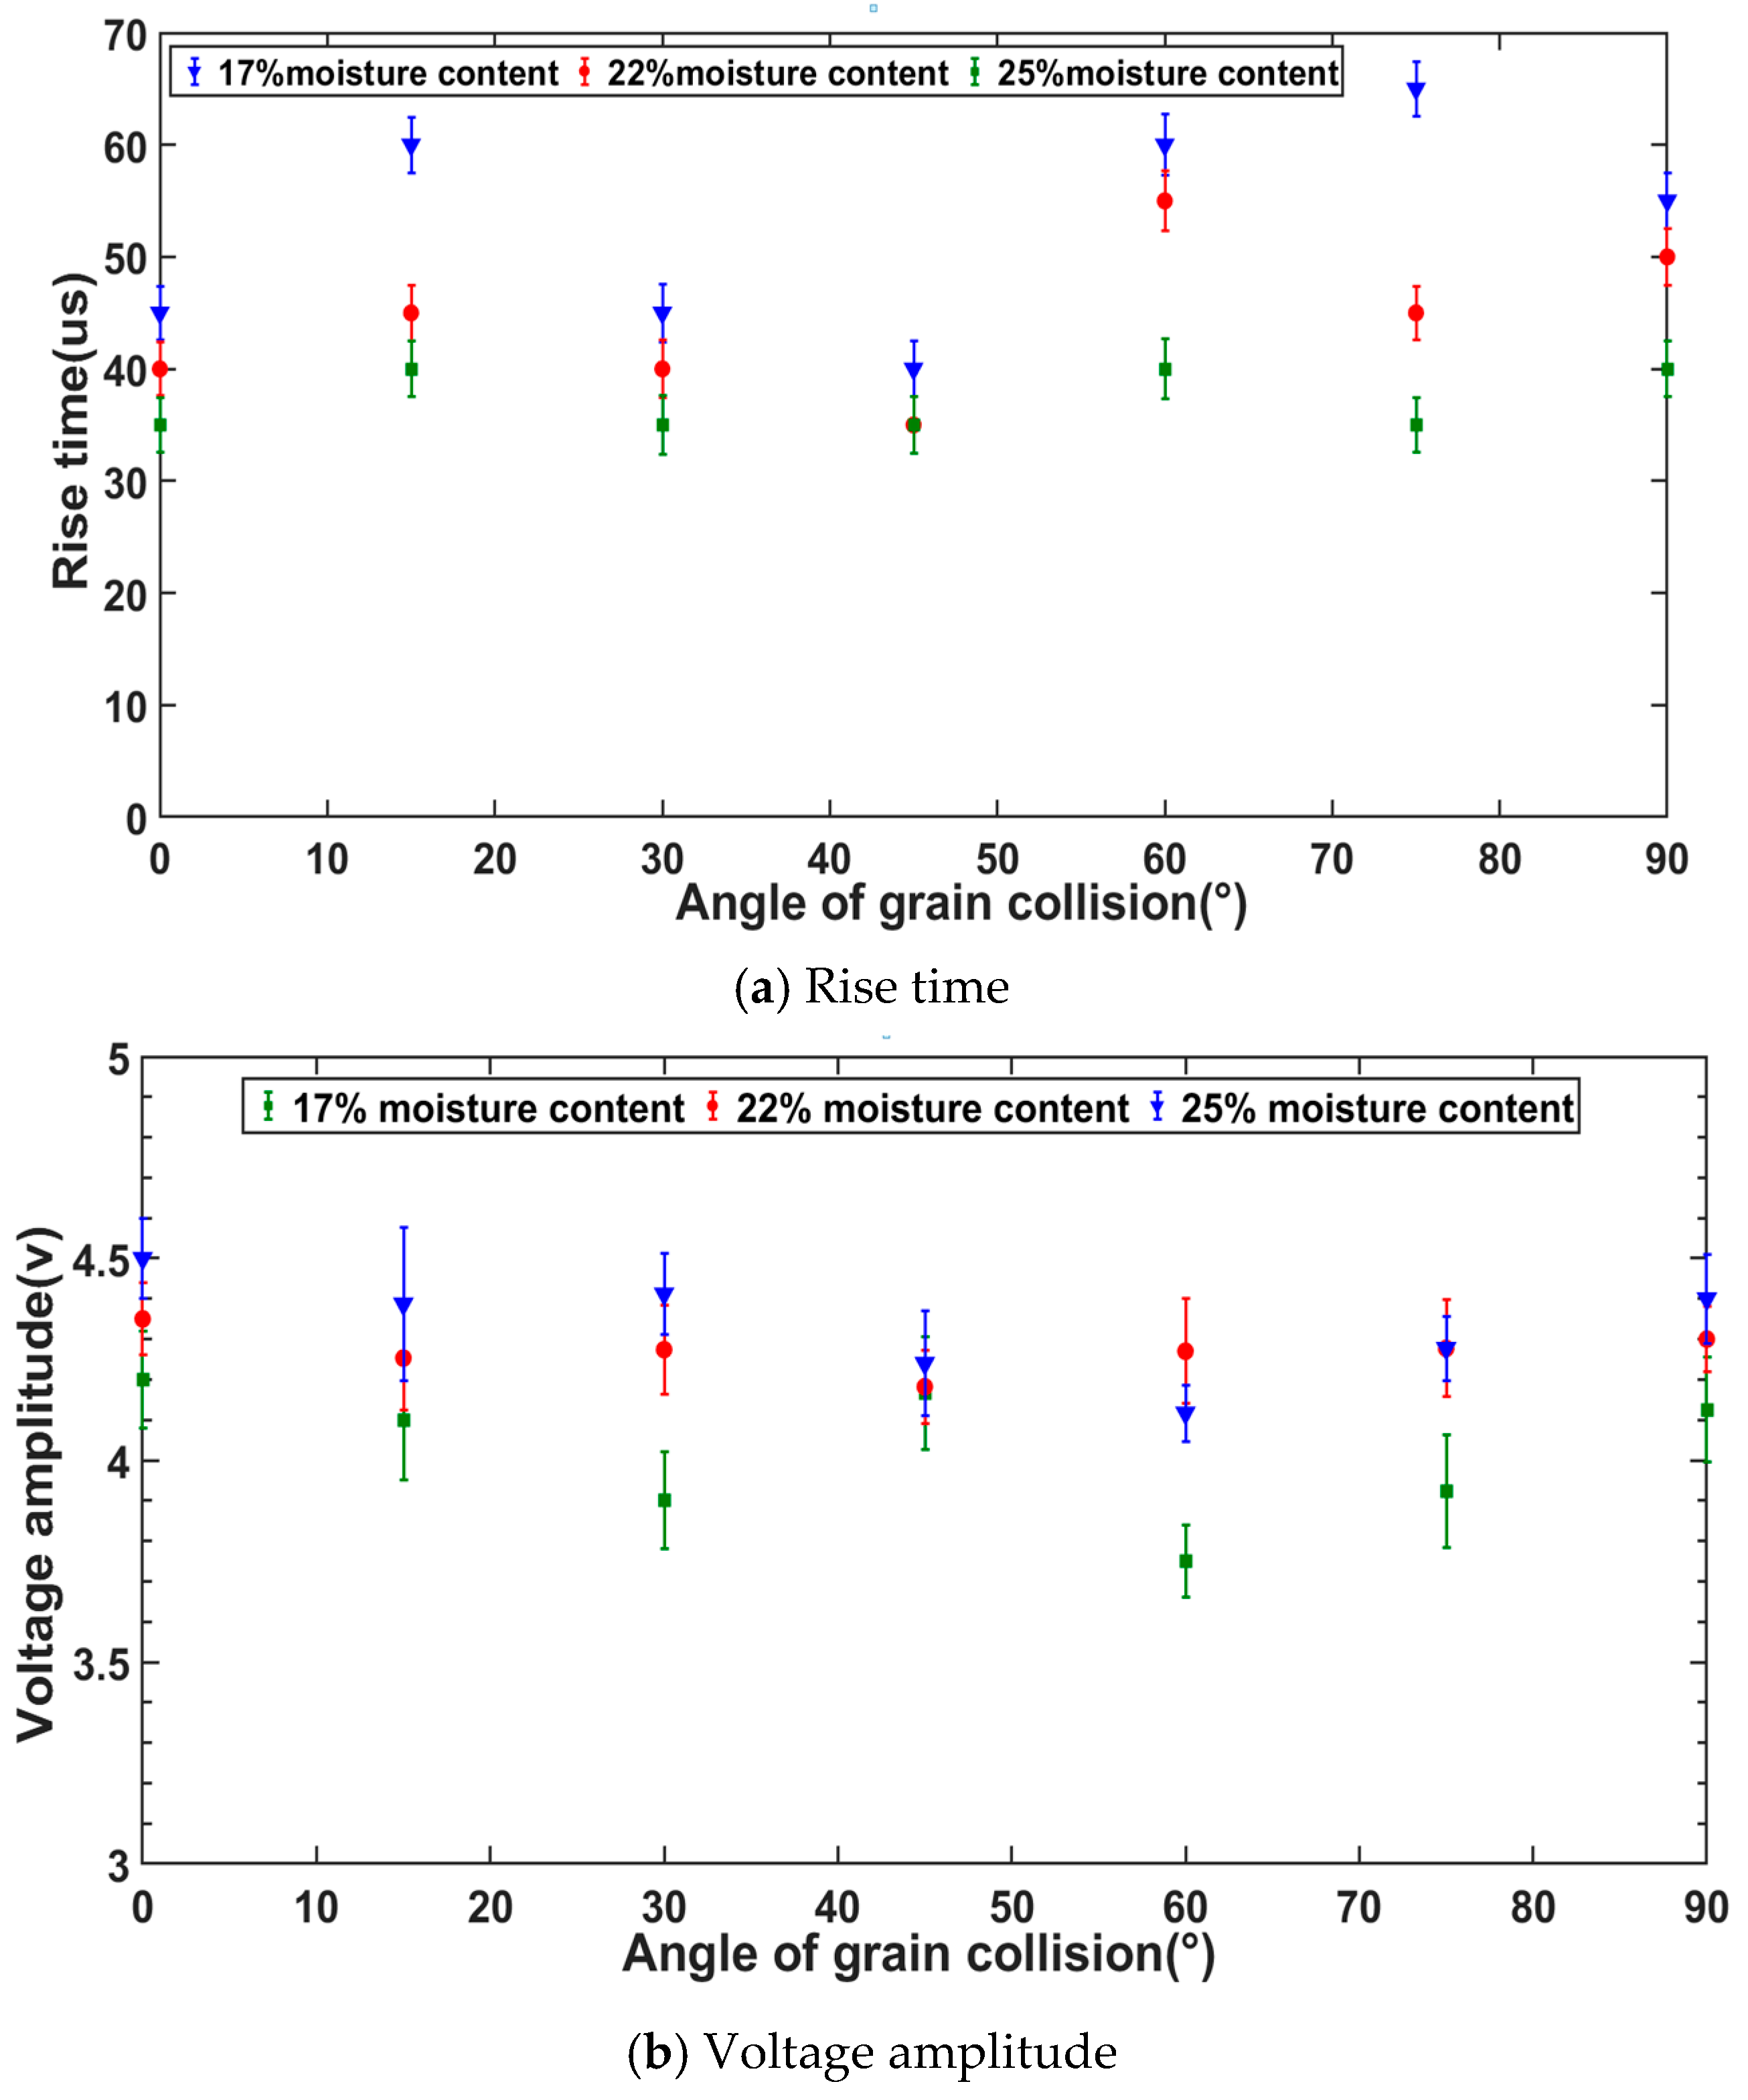
3.2. Grain Collision Signal Characteristics Analysis

As shown in Figure 9a, rice grains with moisture content of 17% colliding with the sensitive plate have the longest rise time and, with the increase in grain moisture content, the collision signal rise time decreased. The collision signal rise time is much shorter in the orthogonal collision condition than in the oblique collision process. The rise time is larger when the collision angle is at 40° < θ < 60° in the oblique collision process. In general, the collision signal rising time was distributed within 40–65 μs for grains with a moisture content of 17%, 40–55 μs for grains with a moisture content of 22% and 30–40 μs for grains with a moisture content of 25%.
It is found that the grain moisture content also has a pronounced effect on collision signal voltage amplitude. The higher the grain moisture content, the larger the rice grain mass. The corresponding signal voltage amplitude also increased with an increase in grain moisture content due to the piezoelectric effect. From Figure 9b, it can be seen that rice grains with moisture content of 25% colliding with the sensitive plate have the largest signal voltage amplitude and with a decrease in grain moisture content, the signal voltage amplitude decreased. The collision signal voltage amplitude is much larger in the orthogonal collision condition than in the oblique collision process. When the collision angle is within 0 < θ < 40°, due to the increase in collision angle, collision velocity along the tangential direction increased gradually, while normal force Fnmax decreased, leading to a trend of decreases in signal voltage amplitude. When 60° < θ < 90°, with an increase in collision angle, the maximum normal force Fnmax increases gradually. In general, the signals voltage amplitude was distributed within 4.1–4.5 V for grains with a moisture content of 25%, 4.18–4.35 V for grains with moisture content of 22% and 3.9–4.2 V for grains with a moisture content of 17%.

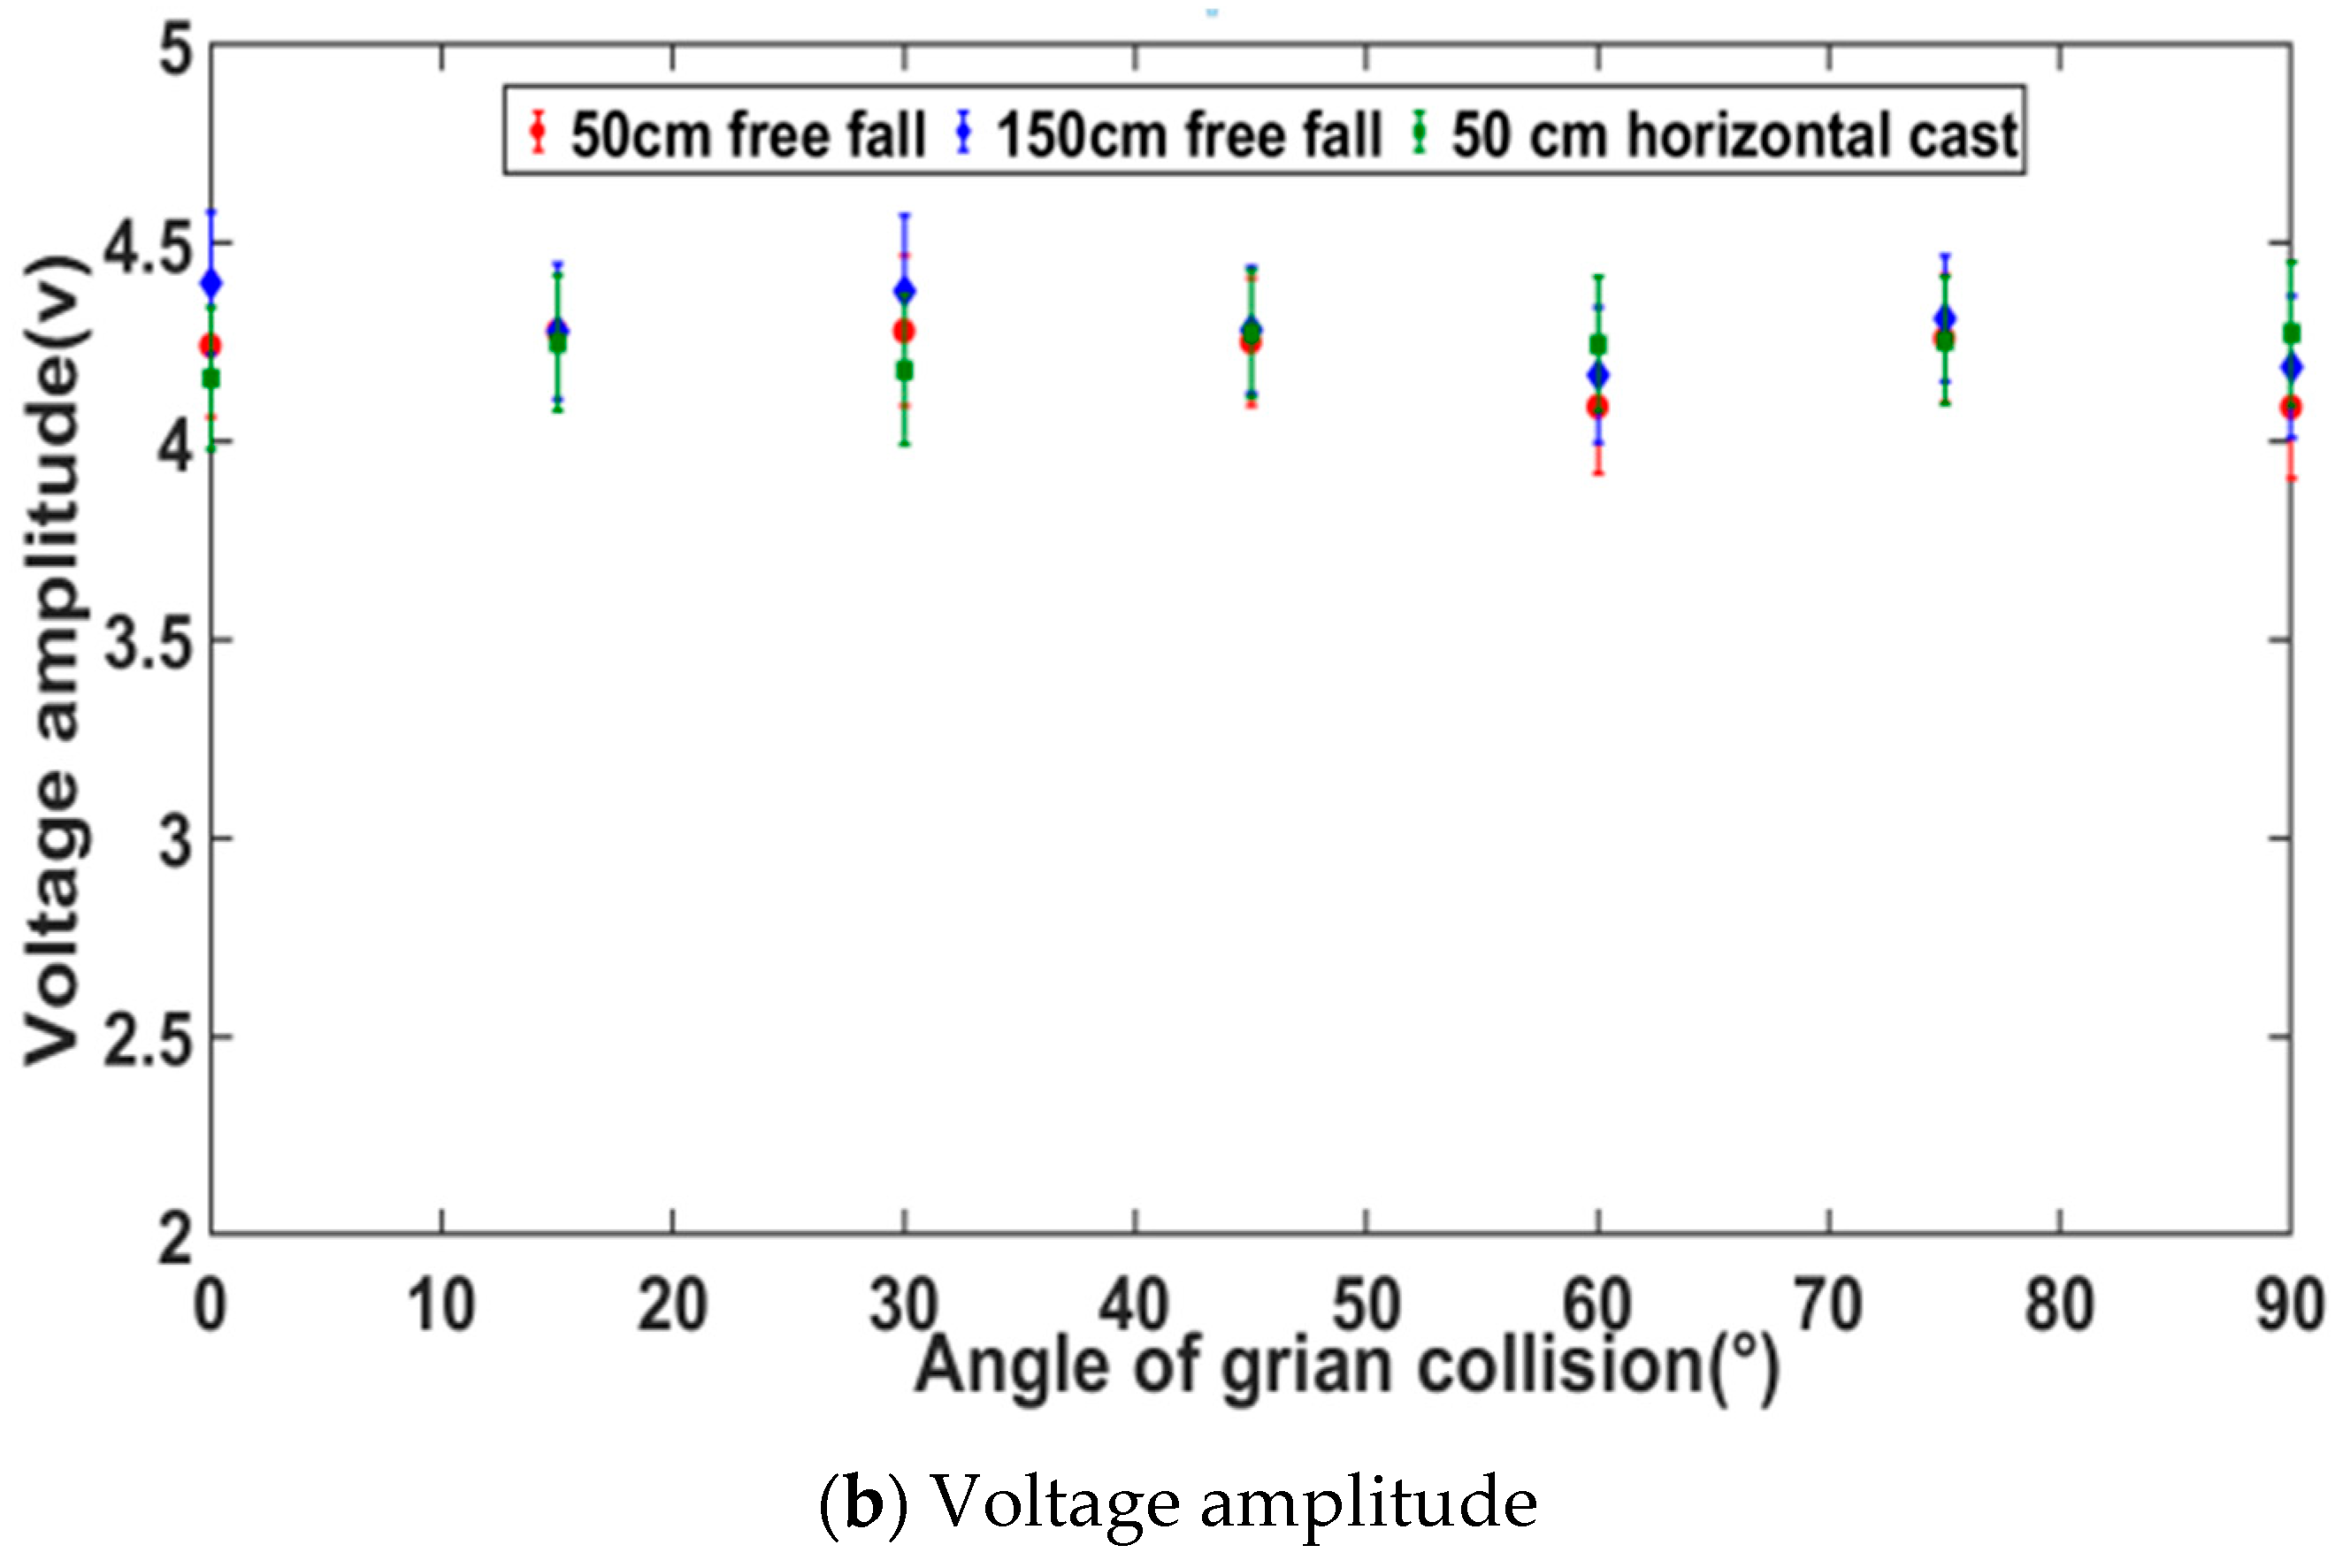
3.3. Effects of Collision Velocity on Signal Rise Time and Voltage Amplitude

Figure 10 shows the effects of collision velocity on collision signal rise time and voltage amplitude for rice grain with a moisture content of 25%. ① vn = 3.16 m/s, vt = 0; ② vn = 5.48 m/s, vt = 0; ③ vn = 3.16 m/s, vt = 1.5 m/s; the falling velocity values were calculated according to their falling height by kinetic theory. It can be seen that the difference in rise time under three different collision velocities varies within ±5 μs with the same collision angle and the variation in the collision signal voltage amplitude is also ≤0.5 v. Therefore, collision velocity has minor effects on rising time and voltage amplitude.

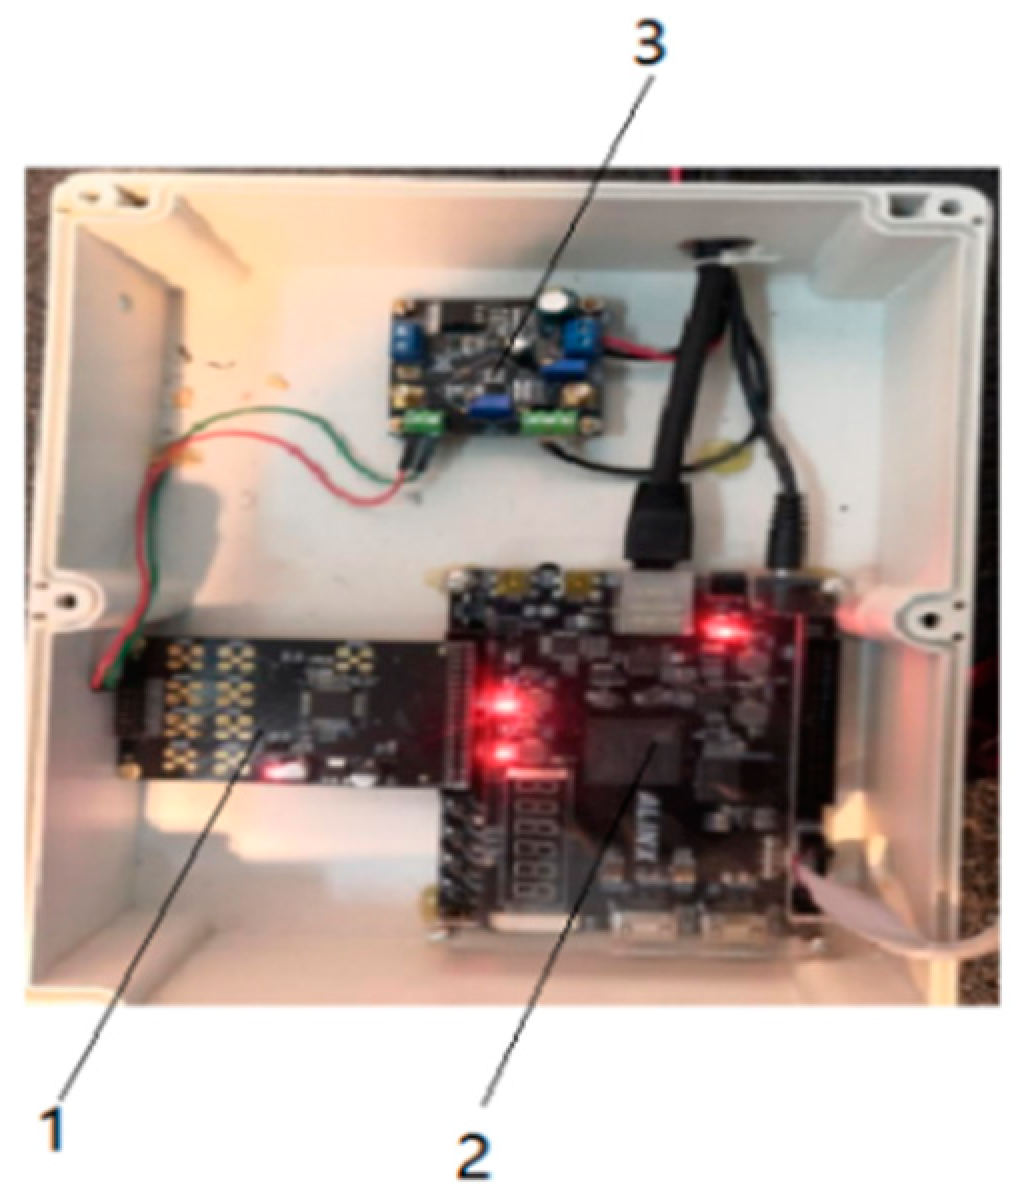
3.4. Design of Signal Process Circuit

The designed signal processing circuit includes a voltage amplifier circuit, a band pass filter circuit, an absolute value amplifier circuit, a signal pulse shaping and square wave generator circuit. The electric charge output from sensing element cannot be measured directly. A charge amplifier is designed to convert the electric charge to a voltage signal. The output voltage of the charge amplifier included the collision signal of the grain, material other than grain (MOG) and vibration interference. According to their different frequency characteristics, the grain collision signal is distinguished by using a band-pass filter. From the above analysis, it can be observed that the collision signal rising time was distributed within 40–65 μs, setting the critical frequency of the band pass filter as 4–6 kHz, which can discriminate the loss grains out effectively. Peak voltage is another crucial index for identifying grain impact signal. Due to the stochastic attitude of grains impacting on the sensor, the generated peak voltage may be a positive or negative value. In order to acquire the peak voltage accurately, an absolute value amplifier consisting of a precision detector and an adder was designed. Then, to avoid the influence of impact resonance wave, an envelope detector was added to extract signal envelope curve. Finally, the signal is transmitted to a voltage comparator to shape the wave. This indicates that the threshold value of the comparator is set to 1.5 V and the grains can be identified effectively. At last, the signal process circuit will output a square voltage signal while grain collision occurs. Standard square voltage pulse signals were sent to MCU to count the number of grains and the results are shown using a display screen.

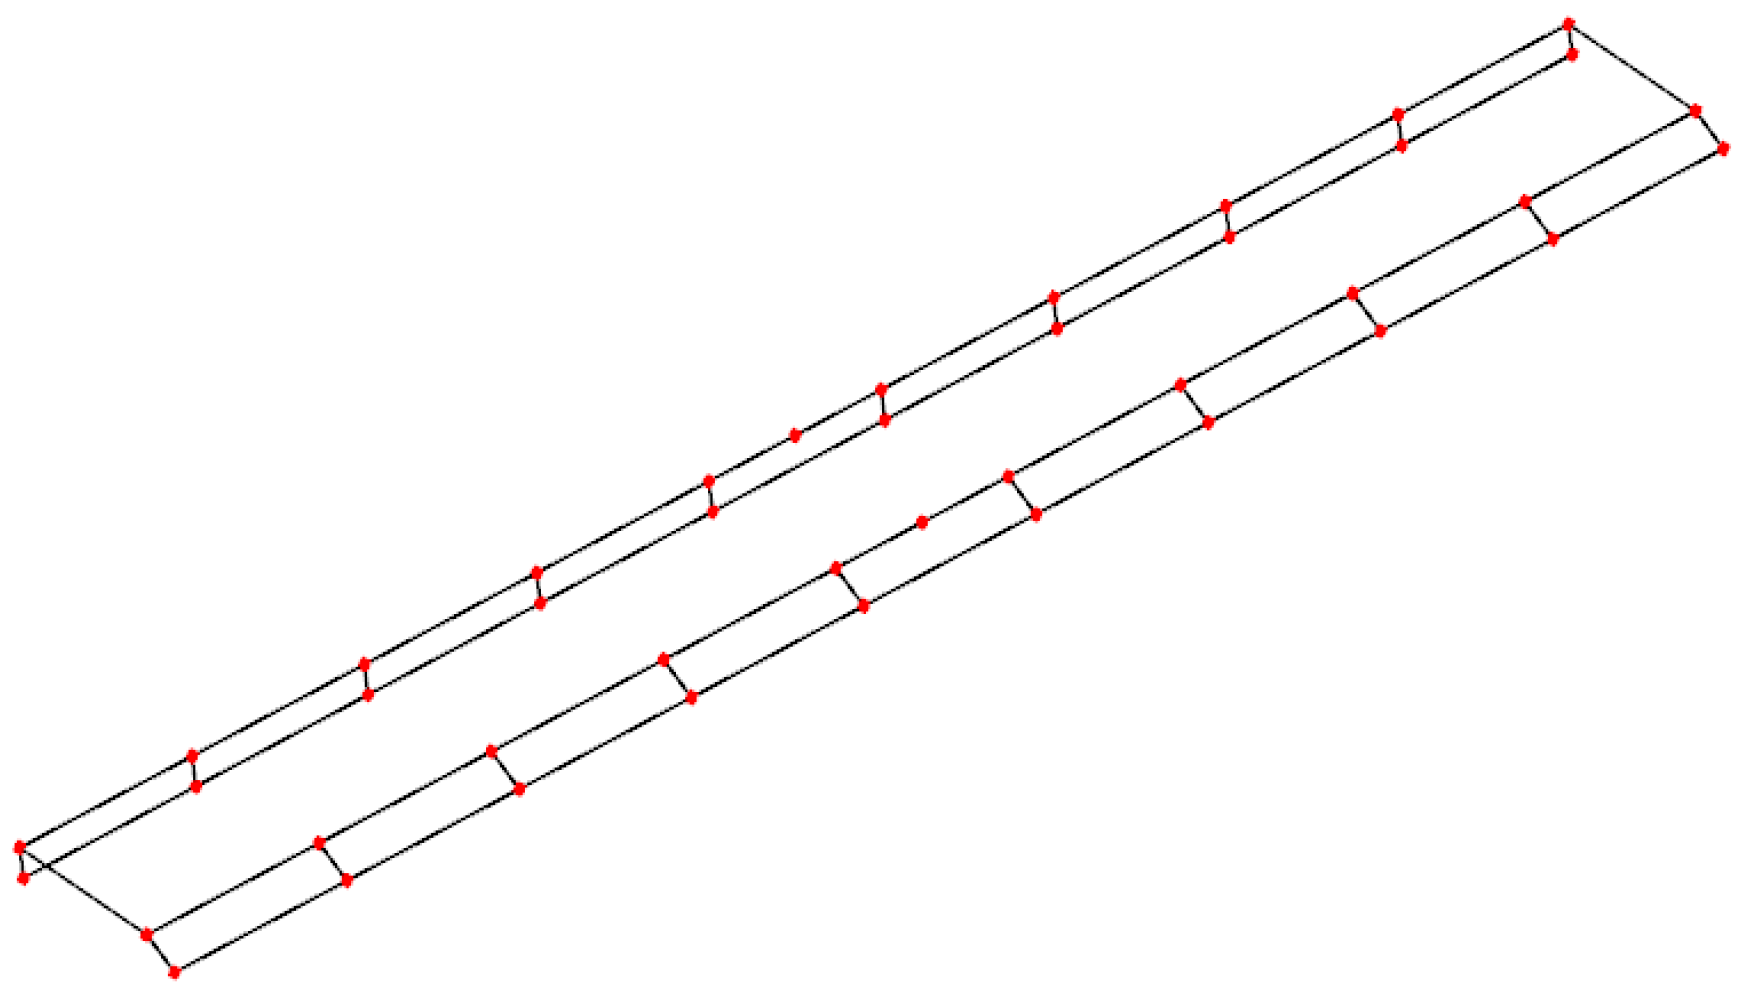
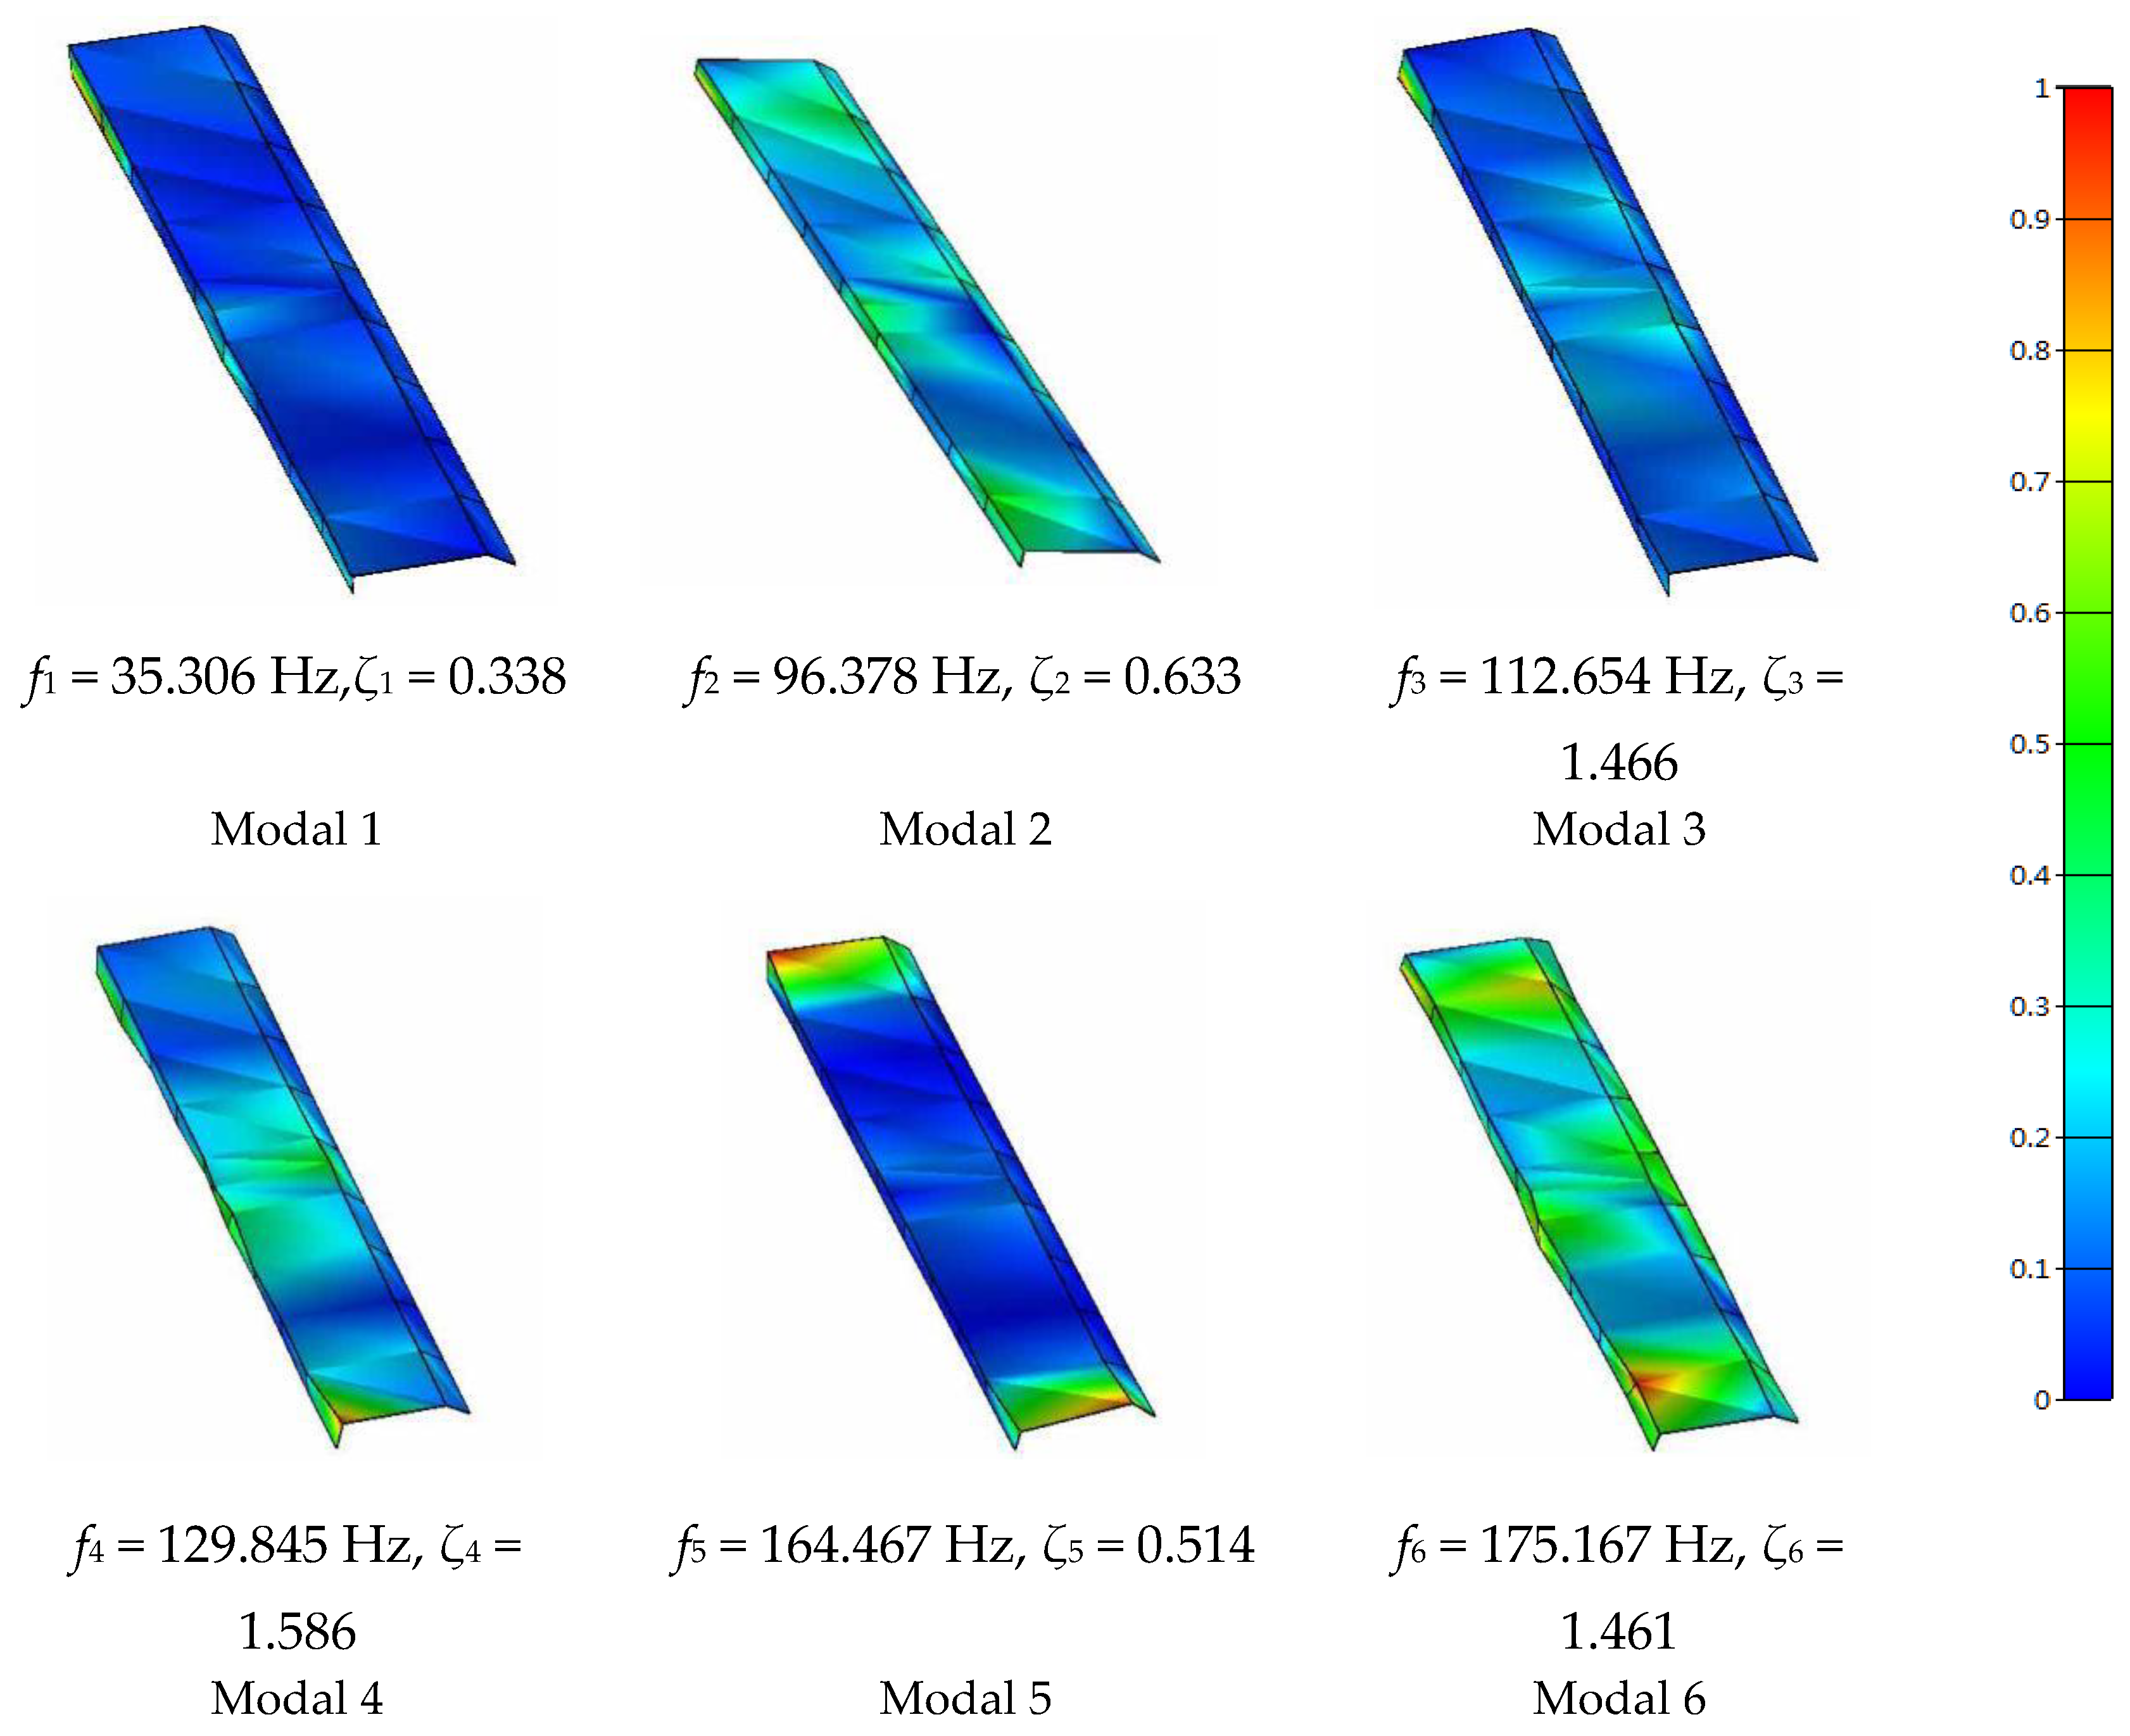
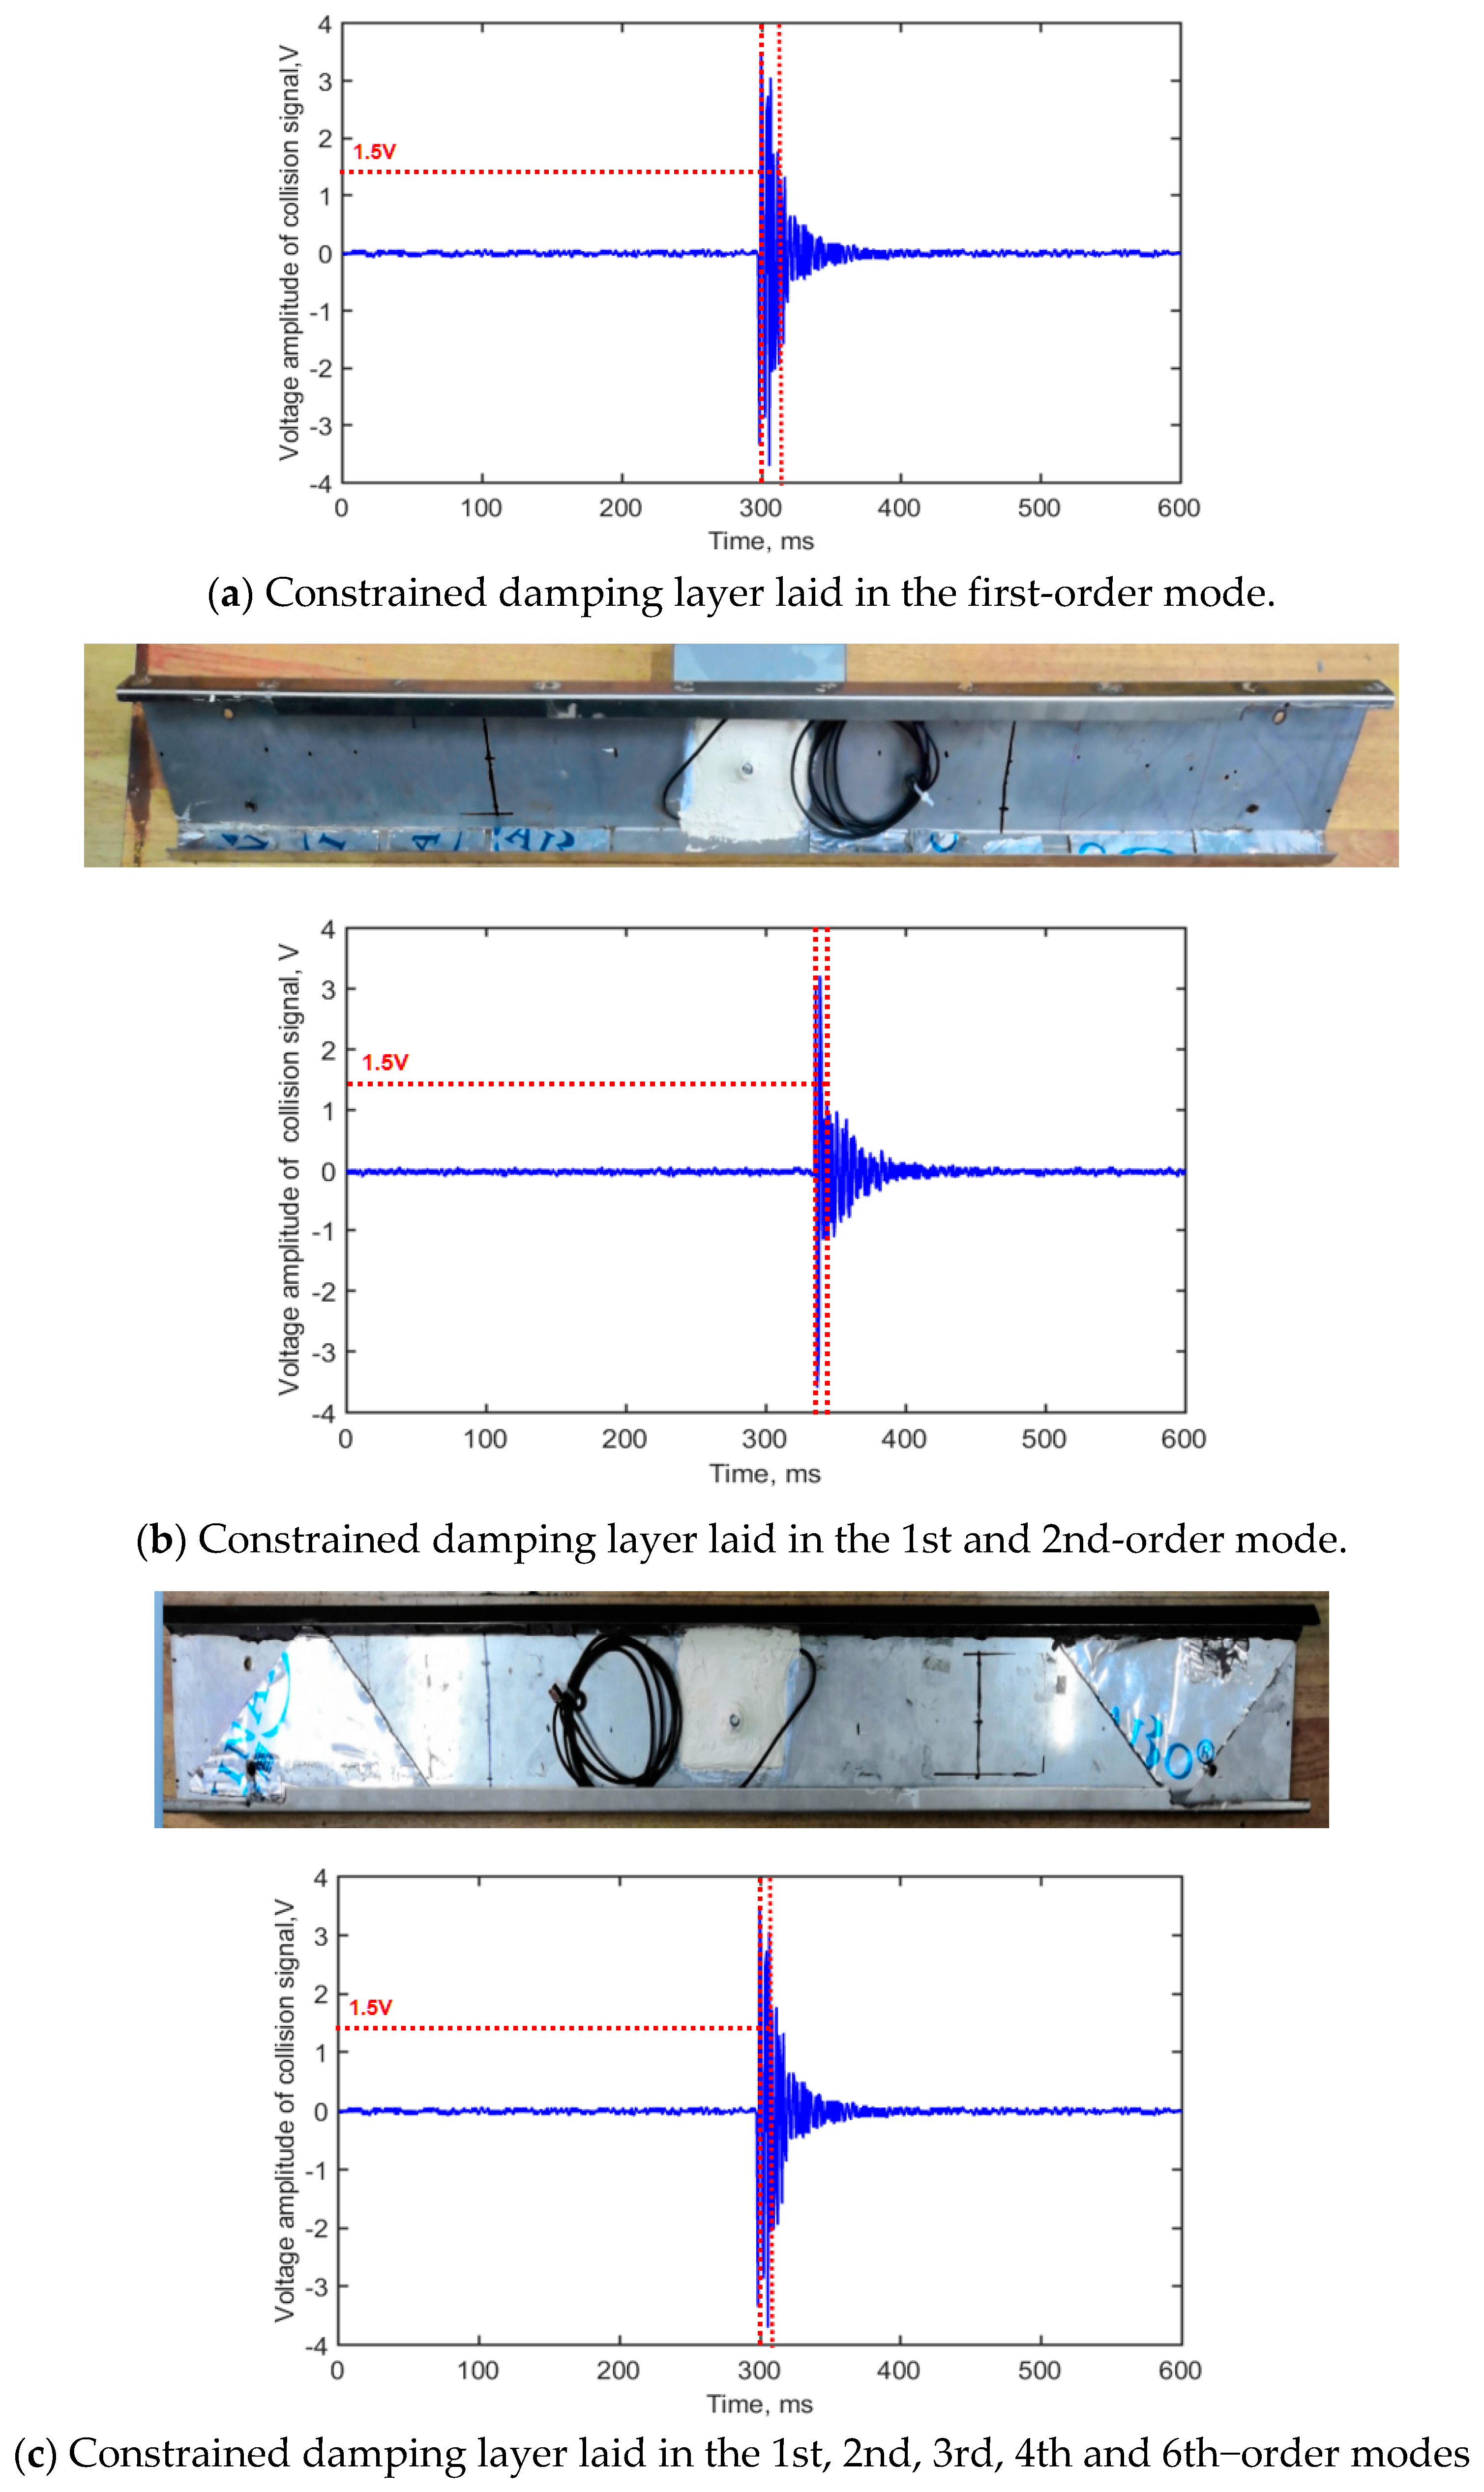
3.5. Determination of the Location of the Viscomaterial Damping Layer

Operational mode has a larger effect on structure dynamic performance. In this work, the first six vibration modes were selected to evaluate sensor structure dynamic performance [16,17]. The research extracted the first six order natural frequencies and mode shapes, as shown in Figure 11.
From Figure 11, it can be seen that the response of the different parts to the vibration is significantly varied. To optimize the laying position of constrained damping layer and gain an idea of the grain collision signal waveform, according to the first 6-order modal shape contour plot and principle of minimizing the area of the constrained damping layer as far as possible, the constrained damping layer was placed in all places with the maximum deformation value of each vibration modal [18]. The viscoelastic material of the sandwich was isobutylene isoprene rubber (IIR) and was of 2 mm thickness. The properties of each layer in the viscoelastic material were as follows: for constraining plate, the material is T6 aluminum, the corresponding damping loss factor is 0.002; for IIR, elastic modulus is 3.5 MPa, Poisson’s ratio is 0.499, density is 1000 kg·m−3, damping loss factor is 0.500. Grain collision signal waveform under different conditions is shown in Figure 12.
As can be seen from Figure 12a, when the constrained damping layer was laid in positions with maximum deformation values in the 1st-order modes, grain collision signal voltage amplitude is about 4.0 V, but the signal attenuation time is still long; on the basis of Figure 12a, we laid the constrained damping layer in the position with maximum deformation values in the 2nd and 3rd-order mode shape. Grain collision signal waveform is shown in Figure 12b; in this condition, the signal attenuation time was shortened, but the signal voltage amplitude also declined. When the constrained damping layer was laid in position with maximum deformation values in the 1st, 2nd, 3rd, 4th and 6th-order mode shape, the grain collision signal waveform is shown in Figure 12c. Since the damping layer around the piezoelectric ceramic weakened the vibration displacement of the piezoelectric ceramic, voltage amplitude of grain impact signal dropped significantly. Those results show that specific placement of the damping materials have important effects on signal attenuation time.
Based on grain collision experiment results and further treatment based on the 5th mode shape, the ideal location of the damping layer was determined and the corresponding grain collision signal characteristic shown in Figure 13 indicates that the signal attenuation time was greatly shortened to about 2 ms.

3.6. Field Experiment Result Analysis

Table 2, below, shows that the maximum monitoring relative error was ≤4.85%. With an increase in the forward speed of the combine harvester, the grain loss monitoring error increased accordingly. The reason is that the feed rate of the combine harvester is larger with the increase in forward speed. A large amount of to-be-cleaned materials are gathered on the cleaning sieve surface. The airflow cannot penetrate the material layer and a larger static pressure will be produced under the sieve, so the threshed material cannot be effectively loosened and the grain penetration is hampered [19]. However, the monitoring error of the optimized grain loss sensor declined significantly compared with the monitored results reported by Wang et al., in which the averaged monitoring relative error was 12.98% and the maximum relative error was 17.64% [6].

4. Conclusions

It is indicted that signal voltage amplitude and signal frequency are the key factors for designing a grain loss sensor. To grasp the variation in signal voltage amplitude and signal frequency under different conditions, the high-speed photography and signal high-speed acquisition technique were utilized to capture grain collision attitude and the corresponding collision signal characteristics. It is indicated that the rise time is much shorter in the orthogonal collision condition, while the collision signal voltage amplitude is much larger in the orthogonal collision process. The higher the grain moisture content, the smaller the rise time and the higher signal voltage amplitude. The signal voltage amplitude shows a positive correlation with the collision angle. In general, the collision signal rising time was distributed within 40–65 μs for grains with a moisture content in a range of 17–25%. Collision velocity has minor effects on signal rise time and voltage amplitude and the difference in rise time under three different collision velocities varies within ±5 μs under the same collision angle and the variation in signal voltage amplitude is ≤0.5 V. Under the instruction of the above analysis, a band-pass filter with a corner frequency of 4–6 kHz was designed. The attenuation time was shortened from 40 ms to 2 ms and the resolution of the sensor was improved significantly by adding a constrained damping layer to the sensitive plate under the instruction of experimental modal analysis. Field experiment results indicate that the monitoring error of the optimized grain loss sensor declined significantly compared with the monitored results reported by Wang et al. (2018), in which the averaged monitoring relative error was 12.98% and the maximum relative error was 17.64%.

Author Contributions

Conceptualization, Z.L. methodology, J.L.; software, F.Z.; validation, J.L.; formal analysis, J.L.; writing—original draft preparation, F.Z.; writing—review and editing, Z.L. & C.L.; supervision, Z.L.; funding acquisition, Z.L. All authors have read and agreed to the published version of the manuscript.

Funding

This research was supported by the National Natural Science Foundation of China (51905221); the Natural Science Foundation of Jiangsu Province (BK20190859), China; Project funded by China Postdoctoral Science Foundation (2019M651746 & 2020T130260), China; a project for postdoctoral researchers in Jiangsu Province, China (2019Z106), Jiangsu Association of Science and Technology Young Talent Support Project (2020-21), the Key R&D projects in Zhenjiang, China(NY2021009); a project funded by the Key Laboratory of Modern Agricultural Equipment and Technology, Jiangsu University (MAET202124); Young Talents Cultivation Program of Jiangsu University (2022) and a Project Funded by the Priority Academic Program Development of Jiangsu Higher Education Institutions (No. PAPD-2018-87), China. We thank these bodies for their support.

Data Availability Statement

Not applicable.

Conflicts of Interest

The authors declare no conflict of interest.

References

  1. Liang, Z.W.; Li, Y.M.; De Baerdemaeke, J.; Xu, L.Z.; Saeys, W. Development and testing of a multi- duct cleaning device for tangential- longitudinal flow rice combine harvesters. Biosyst. Eng. 2019, 182, 95–106. [Google Scholar] [CrossRef]
  2. Strubbe, G.J.I. Grain Loss Monitors for Harvesting Machines. U.S. Patent 5,046,362, 10 September 1991. [Google Scholar]
  3. Ni, J.; Mao, H.P.; Tian, Y.C. Design and experimentation of sensitive element of piezoelectric crystal sensor array for grain cleaning loss. Afr. J. Biotechnol. 2011, 36, 6913–6919. [Google Scholar]
  4. Zhao, Z.; Li, Y.M.; Liang, Z.W. Optimum design of grain impact sensor utilising polyvinylidene fluoride films and a floating raft damping structure. Biosyst. Eng. 2012, 112, 227–235. [Google Scholar] [CrossRef]
  5. Wei, C.; Li, M.; Yu, L.J. Study on grain cleaning loss monitoring of combine harvester based on Kalman Filter. Agric. Mech. Res. 2016, 38, 23–27. [Google Scholar]
  6. Wang, Z.; Che, D.; Bai, X.P. Design and experiment of cleaning loss monitoring device for corn combined harvester. Trans. Chin. Soc. Agric. Mach. 2018, 49, 100–108. [Google Scholar]
  7. Nie, X. Design and Implementation of On-Line Detection Software System for Harvest Loss of Rice and Wheat Combine Harvester. Master’s Thesis, Zhejiang University, Hangzhou, China, 1 June 2021; pp. 90–91. [Google Scholar]
  8. Zhang, X.; Loc, V.Q. Modeling the dependence of the coefficient of restitution on the impact velocity in elasto-plastic collisions. Int. J. Impact Eng. 2002, 27, 317–341. [Google Scholar] [CrossRef]
  9. Wojtkowski, M.; Pecen, J.; Horabik, J.; Molenda, M. Rapeseed impact against a flat surface: Physical testing and DEM simulation with two contact models. Powder Technol. 2010, 198, 61–68. [Google Scholar] [CrossRef]
  10. Yigit, A.S.; Christoforou, A.P.; Majeed, M.A. A nonlinear visco-elastoplastic impact model and the coefficient of restitution. Nonlinear Dyn. 2011, 66, 509–521. [Google Scholar] [CrossRef]
  11. Zhao, Z.; Li, Y.M.; Liang, Z.W.; Gong, Z.Q. DEM simulation and physical testing of rice seed impact against a grain loss sensor. Biosyst. Eng. 2013, 116, 410–419. [Google Scholar]
  12. Xu, L.Z.; Wei, C.C.; Liang, Z.W. Development of rapeseed cleaning loss monitoring system and experiments in a combine harvester. Biosyst. Eng. 2019, 178, 118–130. [Google Scholar] [CrossRef]
  13. Du, X.W.; Ji, J.T.; Jin, X.; Li, C.; Yang, X.L. Research on divider losses with high-speed photography for foxtail millet harvesting. Future Gener. Comput. Syst. 2018, 88, 55–60. [Google Scholar] [CrossRef]
  14. Nakra, B.C. Vibration control in machines and structures using viscoelastic damping. J. Sound Vib. 1998, 211, 449–466. [Google Scholar] [CrossRef]
  15. Kessissoglou, N.J. Active attenuation of the wave transmission through an L-plate junction. J. Acoust. Soc. Am. 2000, 110, 267–277. [Google Scholar] [CrossRef]
  16. Cao, Z.Y. Vibration Theory of Plates and Shells; China Railway Press: Beijing, China, 1989; pp. 154–196. [Google Scholar]
  17. Feng, Y.C.; Zhan, H.; Tang, S.M. Design for vibration control with constrained partial damping based on modal analysis. Ship Sci. Technol. 2011, 33, 22–26. [Google Scholar]
  18. Aumjaud, P.; Smith, C.W.; Evans, K.E. A novel viscoelastic damping treatment for honeycomb sandwich structures. Compos. Struct. 2015, 119, 322–332. [Google Scholar] [CrossRef]
  19. Liang, Z.W.; Xu, L.Z.; De Baerdemaeke, J.; Li, Y.M.; Saeys, W. Optimisation of a multi-duct cleaning device for rice combine harvesters utilising CFD and experiments. Biosyst. Eng. 2020, 190, 25–40. [Google Scholar] [CrossRef]
Figure 1. High-speed photographic collection of grain collision information. 1—High-speed camera display, 2—support tripod, 3—sensor mounting bracket, 4—grain loss sensor, 5—high-speed camera, 6—signal acquisition program, 7—height-fixing frame, 8—grain falling height position, 9—fill-in light.
Electronics 11 03187 g001
Figure 2. Hardware diagram of on-line monitoring system for grain impact test. 1—AD620 voltage amplifier, 2—FPGA AX7103, 3—AN706 Signal acquisition module.
Electronics 11 03187 g002
Figure 3. Collision angle between grain and sensitive plate.
Electronics 11 03187 g003
Figure 4. Location of the measurement points on the sensitive plate.
Electronics 11 03187 g004
Figure 5. Experimental modal analysis process and method.
Electronics 11 03187 g005
Figure 6. Installation of the grain loss sensor in combine harvesters and field experiment. (a) Installation of the grain loss sensor, (b) perforated bags (c) field experiment. 1—grain loss sensor, 2—perforated bags.
Electronics 11 03187 g006
Figure 7. Grain falling collision process.
Electronics 11 03187 g007
Figure 8. Grain movement trajectory.
Electronics 11 03187 g008
Figure 9. Variation in rise time and voltage amplitude under different collision angles for grains with different moisture content.
Electronics 11 03187 g009
Figure 10. Effects of collision velocity on signal rise time and voltage amplitude.
Electronics 11 03187 g010aElectronics 11 03187 g010b
Figure 11. The first 6 order modal analysis results.
Electronics 11 03187 g011
Figure 12. Grain collision signal waveform when damping layer on different locations.
Electronics 11 03187 g012aElectronics 11 03187 g012b
Figure 13. Collision signal when damping layer laid on the optimal position.
Electronics 11 03187 g013
Table 1. Main parameters of vibration signal acquisition and processing system.
ComponentsParametersRangeManufacturer
Acceleration sensor of 356A16 (3-directional)Sensitivity100 mv/gPCB, USA
Response frequency range0.3–6 000 Hz
Range±50 g pk
Lateral sensitivity<5%
DH5902 vibration signal acquisition and processing systemSignal channel32Donghua testing company, China
Sampling bandwidth100 k Hz
Distortion factor<0.5%
AD resolution16 bit
086D05 exciting hammer Sensitivity
Range
0.23 mV N1
±22,000 N pk
PCB, USA
Table 2. Error analysis of sieve losses obtained by the sensor compared to manual measurement.
Tests
No.
Forward Speed, m/sGrain Cleaning LossesRelative Error/%
SensorManual
Total Amount/gRatio/%Total Mass/gRatio/%
11.331225.70.1101288.21.164.85
21.21956.50.086997.80.904.12
31.04484.00.043503.80.453.94
40.96408.30.037423.80.383.56
50.87366.60.033379.20.343.32
Publisher’s Note: MDPI stays neutral with regard to jurisdictional claims in published maps and institutional affiliations.

