Article

Analysis of Optimal Operation of Charging Stations Based on Dynamic Target Tracking of Electric Vehicles

1
School of Electronic Science & Engineering, Southeast University, Nanjing 210096, China
2
NARI Technology Co., Ltd., Nanjing 211106, China
3
State Grid Ningxia Electric Power Co., Ltd., Ningxia 750001, China
*
Author to whom correspondence should be addressed.
Electronics 2022, 11(19), 3175; https://doi.org/10.3390/electronics11193175
Submission received: 29 August 2022 / Revised: 23 September 2022 / Accepted: 26 September 2022 / Published: 2 October 2022
(This article belongs to the Special Issue Recent Advances in Unmanned System Navigation and Control)

Abstract

:
In view of the large impact of traditional charging stations on the power grid and the investment in the construction of charging stations for electric vehicle infrastructure services, this paper considers the configuration of optical storage equipment in charging stations from a practical point of view and proposes an economic operation strategy for charging stations to meet the economically optimal requirements of different scenarios. First, we analyze the behavioral characteristics of multiple types of electric vehicles, consider the influence of charging queues, and establish a daily load model of charging stations by taking into account the daily monitoring load and nighttime lighting load of charging stations. Then, considering the electric vehicle (EV) charging demand, photovoltaic (PV) output and energy storage charging and discharging power, the daily economic optimal operation problem based on the dynamic target tracking of charging stations is established; the objective is to maximize the daily operating revenue of charging stations under the condition of satisfying the EV charging demand and PV consumption. Secondly, the objective function is linearized, and the economic operation model is transformed into a mixed integer linear programming model for solving, and the simulation is verified under different scenarios. The results show that the economic optimal operation strategy can adapt to the economic operation requirements of charging stations in different scenarios and maximize the charging station revenue.

1. Introduction

In recent years, electric vehicles have been widely promoted and used by virtue of their environmental protection and pollution-free advantages, and the access of large-scale electric vehicle charging loads has produced new challenges for the power grid [1,2]. In the traditional slow charging mode, the charging load of EVs overlaps with the peak period of residential electricity consumption, which easily causes problems such as the overloading of grid components, voltage fluctuation, increase in line loss, and the aggravation of three-phase imbalance in the distribution network; in the fast charging mode, the randomness of EV access, the strong impact of the aggregation effect of fast charging piles on the grid, and the limitation of the current distribution capacity will affect the safety of the distribution network [3,4,5]. Therefore, in the actual operation of charging stations, it is generally necessary to carry “economic optimization”, “peak shaving”, “planned power tracking”, “power leveling”, etc. The economic operation mode is the main mode of daily operation [6,7].
Many scholars have studied the dynamic target tracking and economic operation of charging stations, and the literature [8,9] uses the Monte Carlo method to extract the driving characteristics of electric vehicles, considering the autonomy of the user in terms of driving time. The literature [10] proposes a bi-directional alternating current-direct current (AC-DC) buck rectifier topology for a charging station interface that can operate in grid-to-vehicle (G2V) and vehicle-to-grid (V2G) modes, including single-phase and three-phase versions. The literature [11] also proposes an optimal EV charging regulation method to analyze the impact of PV charging stations on the economic operation of the grid, as well as carbon emissions, by comparing the disorderly charging situation. Also proposed in the literature [12] is a multi-objective optimization method based on the combination of non-dominated ranking genetic algorithm and fuzzy clustering and used for the optimal operation of energy storage system, using a genetic algorithm to solve the multi-objective model and fuzzy clustering method to screen the Pareto optimal solution set, which improves the charging station economy and grid load level while meeting the charging station load demand. Another proposal in the literature [13] is an intra-day rolling optimization strategy for optical storage charging stations with the objective of minimizing the operating cost of charging stations by considering the influence of ambient temperature during the charging process of electric buses. Another study [14] proposes a multi-objective planning model for distribution networks considering the impact of a distributed energy storage optimization strategy and electric vehicle charging network, which can effectively improve the relevant indexes and increase the benefits of distribution network planning. In the literature [15,16], corresponding energy interaction strategies for light storage charging stations are proposed for different time periods, and the economic advantages in terms of the peak-valley difference of the power grid are fully utilized by reducing the power purchase cost of charging stations through peak-shaving and peak-valley arbitrage measures. The literature [17] also introduces aggregation agents according to the electric bus light-storage charging station power-trading problem, establishes a bilateral trading model with a station daily operation optimization strategy, and reduces the deviation loss of monthly contract by controlling the charging and discharging strategy of the energy storage system. In [18], an electric vehicle charging station charging and discharging control strategy based on the maximum PV output and storage charge state is proposed, which achieves the coordinated operation of PV equipment, energy storage system, station load and power grid. The study of [19] establishes an optimal control platform based on dynamic planning and a stochastic optimization model, and the platform constructs a stochastic optimization model consisting of PV, energy storage system and electric vehicle load. The literature [20] also integrates the degradation of the energy storage system, the price uncertainty of the electricity market, and the stochastic charging demand of electric vehicles, and proposes a bidding optimization strategy for storage charging stations in the day-ahead electricity market, which maximizes the profit of investors while mitigating the impact on the grid. Also considered in the literature [21] is the influence of grid demand response and time scale, establishing a stochastic optimal scheduling model for electric vehicle charging stations, which can effectively reduce the operating cost of charging stations.
The above-mentioned literature includes studies on the operation of EV charging stations with PV and energy storage equipment, but these have not fully considered the impact of EV travel pattern on the charging station load, while in the actual configuration planning of charging stations with energy storage and PV, the EV travel pattern will greatly affect the fluctuation of charging station load and, thus, affect the capacity plan of energy storage and PV equipment. In addition, the above literature does not consider the influence of monitoring load and nighttime lighting load on the fluctuation of charging station load.
This paper addresses the uncertainty of electric vehicle access to the grid and the uncertainty of charging load and photovoltaic equipment output; fully considers the influence of electric vehicle travel pattern on charging station load modeling, incorporates the monitoring load and night lighting load in charging stations into the model construction; and proposes an economic operation strategy for charging stations that meets the economically optimal demand of different scenarios and optimizes the output of photovoltaic and energy storage equipment to maximize the charging station revenue while meeting the charging demand of electric vehicles.
The rest of this paper is structured as follows. Section 2 analyzes the charging station load characteristics, Section 3 proposes an economic operation model for charging stations considering PV output uncertainty and energy storage device output, Section 4 considers the arithmetic analysis under different PV output scenarios to verify the adaptability of the economic optimal operation strategy under different scenarios, and finally, the corresponding conclusions are drawn in Section 5.

2. Charging Station Load Characteristics Analysis

In order to accelerate the process of electrification in the automotive field and help achieve the goal of “3060”, it has become an industry trend to promote the development of electric vehicles and charging facilities industry. The factors that restrict vehicle owners to switch to electric vehicles include vehicle range and charging time, etc. Solving the problem of charging queues at charging stations can effectively relieve vehicle owners’ charging anxiety, improve the utilization rate of charging facilities, enhance the satisfaction of electric vehicle owners in charging and accelerate the promotion of electric vehicles.

2.1. Analysis of Travel Behavior of Different Types of Electric Vehicles

At present, electric vehicles are mainly developing rapidly in multiple fields such as family passenger cars, cabs and special vehicles, and there are two ways of charging and power exchange in the way of electric energy supplement. From the comparative analysis of charging and switching modes, due to the unified power battery standard, rapid battery technology iteration and upgrade, and large investment in switching stations, the current switching mode is more applied in the field of public transportation, logistics and other special vehicles, while other areas of electric vehicles are more suitable for charging mode. Electric vehicle charging behavior is affected by vehicle type, driving habits, charging methods and other factors, and there are two main methods of DC fast charging and AC slow charging for vehicle owners to choose from. Among them, DC charging piles are fast, which can significantly shorten the charging time and reduce the waiting time for vehicle owners to charge; AC charging piles have a long charging time but have charging load regulation potential, which can effectively avoid the impact of the large-scale charging of EVs on the regional power grid, as well as provide scenario support for the application of the orderly charging of EVs [22]. A comparison of typical vehicle parameters of different types of electric vehicles is shown in Table 1.
(1)
Electric passenger vehicle charging behavior analysis
Family passenger cars are mainly used for commuting or short-distance entertainment, so the starting point of travel is mainly located in residential areas, entertainment areas and industrial areas. According to the influence of the user’s occupation and living habits, the electric passenger car mainly travels to and from work during peak hours; the driving route is relatively fixed; the average daily mileage is 32 km; the charging method is generally AC slow charging, showing a certain degree of stability; and the vehicles do not have any influence on each other’s travel and return. Combined with the vehicle parameters and daily driving mileage in Table 1, users generally choose to recharge at night in residential parking lots or public charging stations [23].
(2)
Analysis of electric cab charging behavior
Cabs are characterized by a high daily mileage, long running time and short rest time, and their daily mileage and charging time are less affected by the electricity price factor. Cabs generally implement a two-shifts (day shift, night shift) operation, including a handover system. According to market research, the average cab day shift runs 200 km, while the night shift runs about 150 km, in order to achieve “people off the car does not rest”. Due to the 24-h operation of cabs and the random operation of the line, the layout of the construction of a dedicated cab exchange station generates difficulties; cabs do not have a dedicated parking lot, only a short period of time parked on both sides of the road or in the community parking lot. To avoid morning and evening peaks and reduce non-operating hours, combined with Table 1 electric cab vehicle parameters, owners generally choose the daytime meal break time of 11:30–14:30 and the night meal break time of 17:00–19:00, opting for a single period of fast replenishment to meet the day’s operating needs.
(3)
Analysis of charging behavior of electric special vehicles
Dedicated vehicles mainly include buses, logistics vehicles, sanitation vehicles, public service vehicles, etc. The action track is distributed in industrial areas, commercial areas or public service areas. Take the bus as an example: the bus takes the daytime cycle operation mode with a fixed departure route and departure time, and the average daily mileage is about 250 km. After market research, considering 10~13 m of pure electric bus battery capacity of 300 kWh or more and a working range between 250 and 350 km, combined with the parameters in Table 1, electric bus night vehicles, once full, can meet the bus all-day mileage range demand. If we take electric public service vehicles as an example, public service vehicles refer to the vehicles that are equipped by government finance for the staff of party and government organs and institutions at all levels, in order for them to carry out their official needs. These vehicles are mainly divided into two major categories: fixed vehicles for leading cadres of party and government organs and institutions at all levels, and vehicles for the official activities of public servants, which are mainly used for the official travel of each unit. Most public service vehicles run during the day and rest at night with sufficient time for charging.

2.2. Monte Carlo-Based Load Forecasting for Electric Vehicles

The current analysis methods for electric vehicle travel behavior can be divided into the following types: direct limited exercise time; travel simulation using Monte Carlo and statistical data-based travel chain analysis and control. The Monte Carlo method is an ideological approach to simulate the exact logic with massive random data, and although the travel behavior characteristics of a single EV are stochastic, studies have shown that the charging behavior characteristics of a large number of EV clusters in a fixed area show a certain probability distribution, and different EVs are distributed among each other [23]. Therefore, in this paper, a Monte Carlo stochastic simulation method is adopted to extract the travel behavior of individual EVs, in order to determine the required parameters in the model for EV charging load prediction calculation. The specific simulation calculation steps are as follows.
Step 1. Initialize parameters such as the number of three types of electric vehicles, charging power, electric vehicle battery capacity and the number of simulations according to the electric vehicle research data of a city.
Step 2. Generates the starting charging moment and starting state of charge (SOC) according to the starting charging moment and daily driving mileage probability function; pre-set the target SOC to 1.0; calculate the electric vehicle charging duration according to Equation (1); and derive the electric vehicle charging end moment.
Step 3. Set the target SOC for the target peak-to-valley tariff period according to the peak-to-valley tariff dynamic correction method in Figure 1; update the charging duration.
Step 4. Calculate the single EV charging load and superimpose to obtain the total charging load, i.e.,
P = j = 1 96 i = 1 N P c i j
where P is the total charging load, kW; N is the number of EVs, units; 96 is the number of periods divided into 24 h with an interval of 15 min; and Pcij is the charging power of the ith EV at moment j, kW.
Step 5. Convergence judgment. Use the coefficient of variance β to determine the accuracy of the calculation, i.e.,
β i = σ i ( L ¯ ) N L ¯ i
where βi is the coefficient of variance of the charging load for time period i, i = 1, 2, …, 96; σ i ( L ¯ ) is the standard deviation of the load at time i; L ¯ i is the expected value of the load at time i. If Max {βi} < 0.05%, then the simulation results are convergent.
The flow of the simulation calculation using the Monte Carlo stochastic simulation method [24] is shown in Figure 2.

2.3. Electric Vehicle Charging Load Characteristics Analysis

Since dedicated vehicles have specific parking and charging locations, the main analysis is on the charging load of electric passenger cars and electric cabs. In this paper, the probability distribution function of the return moments and travel moments of electric passenger cars is obtained based on statistical methods with reference to the results of the 2021 U.S. household travel survey [25,26]. The probability density function of the return moments of electric vehicles is:
f s ( x ) = { 1 σ s 2 π exp ( ( x μ s ) 2 2 σ s 2 ) ( μ s 12 ) < x 24 1 σ s 2 π exp ( ( x + 24 μ s ) 2 2 σ s 2 ) 0 < x ( μ s 12 )
where σ s is the standard deviation; μ s is the expected value.
The probability density function of electric vehicle travel moments is:
f e ( x ) = { 1 σ e 2 π exp ( ( x μ e ) 2 2 σ e 2 ) 0 < x ( μ e + 12 ) 1 σ e 2 π exp ( ( x 24 μ e ) 2 2 σ e 2 ) ( μ e + 12 ) < x 24
where σ e is the standard deviation; μ e is the expected value.
If the owner’s desired SOC at the end of each charge is 1 and one charge per day, the minimum charge time for each EV is:
t min = L W P c _ max η c
where L is the daily mileage of the electric vehicle; W is the electricity consumption of the electric vehicle, taken as 0.15 kWh/km; Pc_max is the maximum charging power of the electric vehicle; and η c is the charging efficiency of the electric vehicle.
For the above electric vehicle travel analysis and charging load forecast, the charging load of 80 cabs and 60 passenger cars for one month is simulated without considering the charging capacity, and the following conditions are satisfied.
(1)
The arrival time (return time) of all electric vehicles is the charging time: for electric passenger cars, σ s = 3.4, μ s = 17.41, σ e = 3.2, μ e = 8; for electric cabs, σ s = 3.4, μ s = 13.4.
(2)
According to the electric vehicle parameters and the EV average daily mileage, the daily mileage of each vehicle is simulated using Gaussian distribution, and the mileage of passenger cars and cabs are, respectively N (32, 52) and N (300, 502).
(3)
The charging process is approximated as constant power charging, in which the electric cab adopts DC fast charging mode with a charging power of 60 kW, and the electric passenger car adopts AC slow charging mode with a charging power of 7 kW.
The above conditions can simulate the charging moment and daily driving distance of each EV with a step of 15 min, and the charging load curve of 140 EVs for one month is calculated and superimposed, as shown in Figure 3.
The small window in Figure 3 shows the charging load curve of electric vehicles on the first day. According to Figure 3, the peak charging load of electric vehicles is basically distributed around 12:00 noon and 17:00 without considering the charging capacity of the region, which coincides with the peak moment of electric vehicle return. Combined with the number of electric vehicles being charged at each moment of the first day in the region in Figure 4, it can be seen that there are up to 24 vehicles charging together in one day.

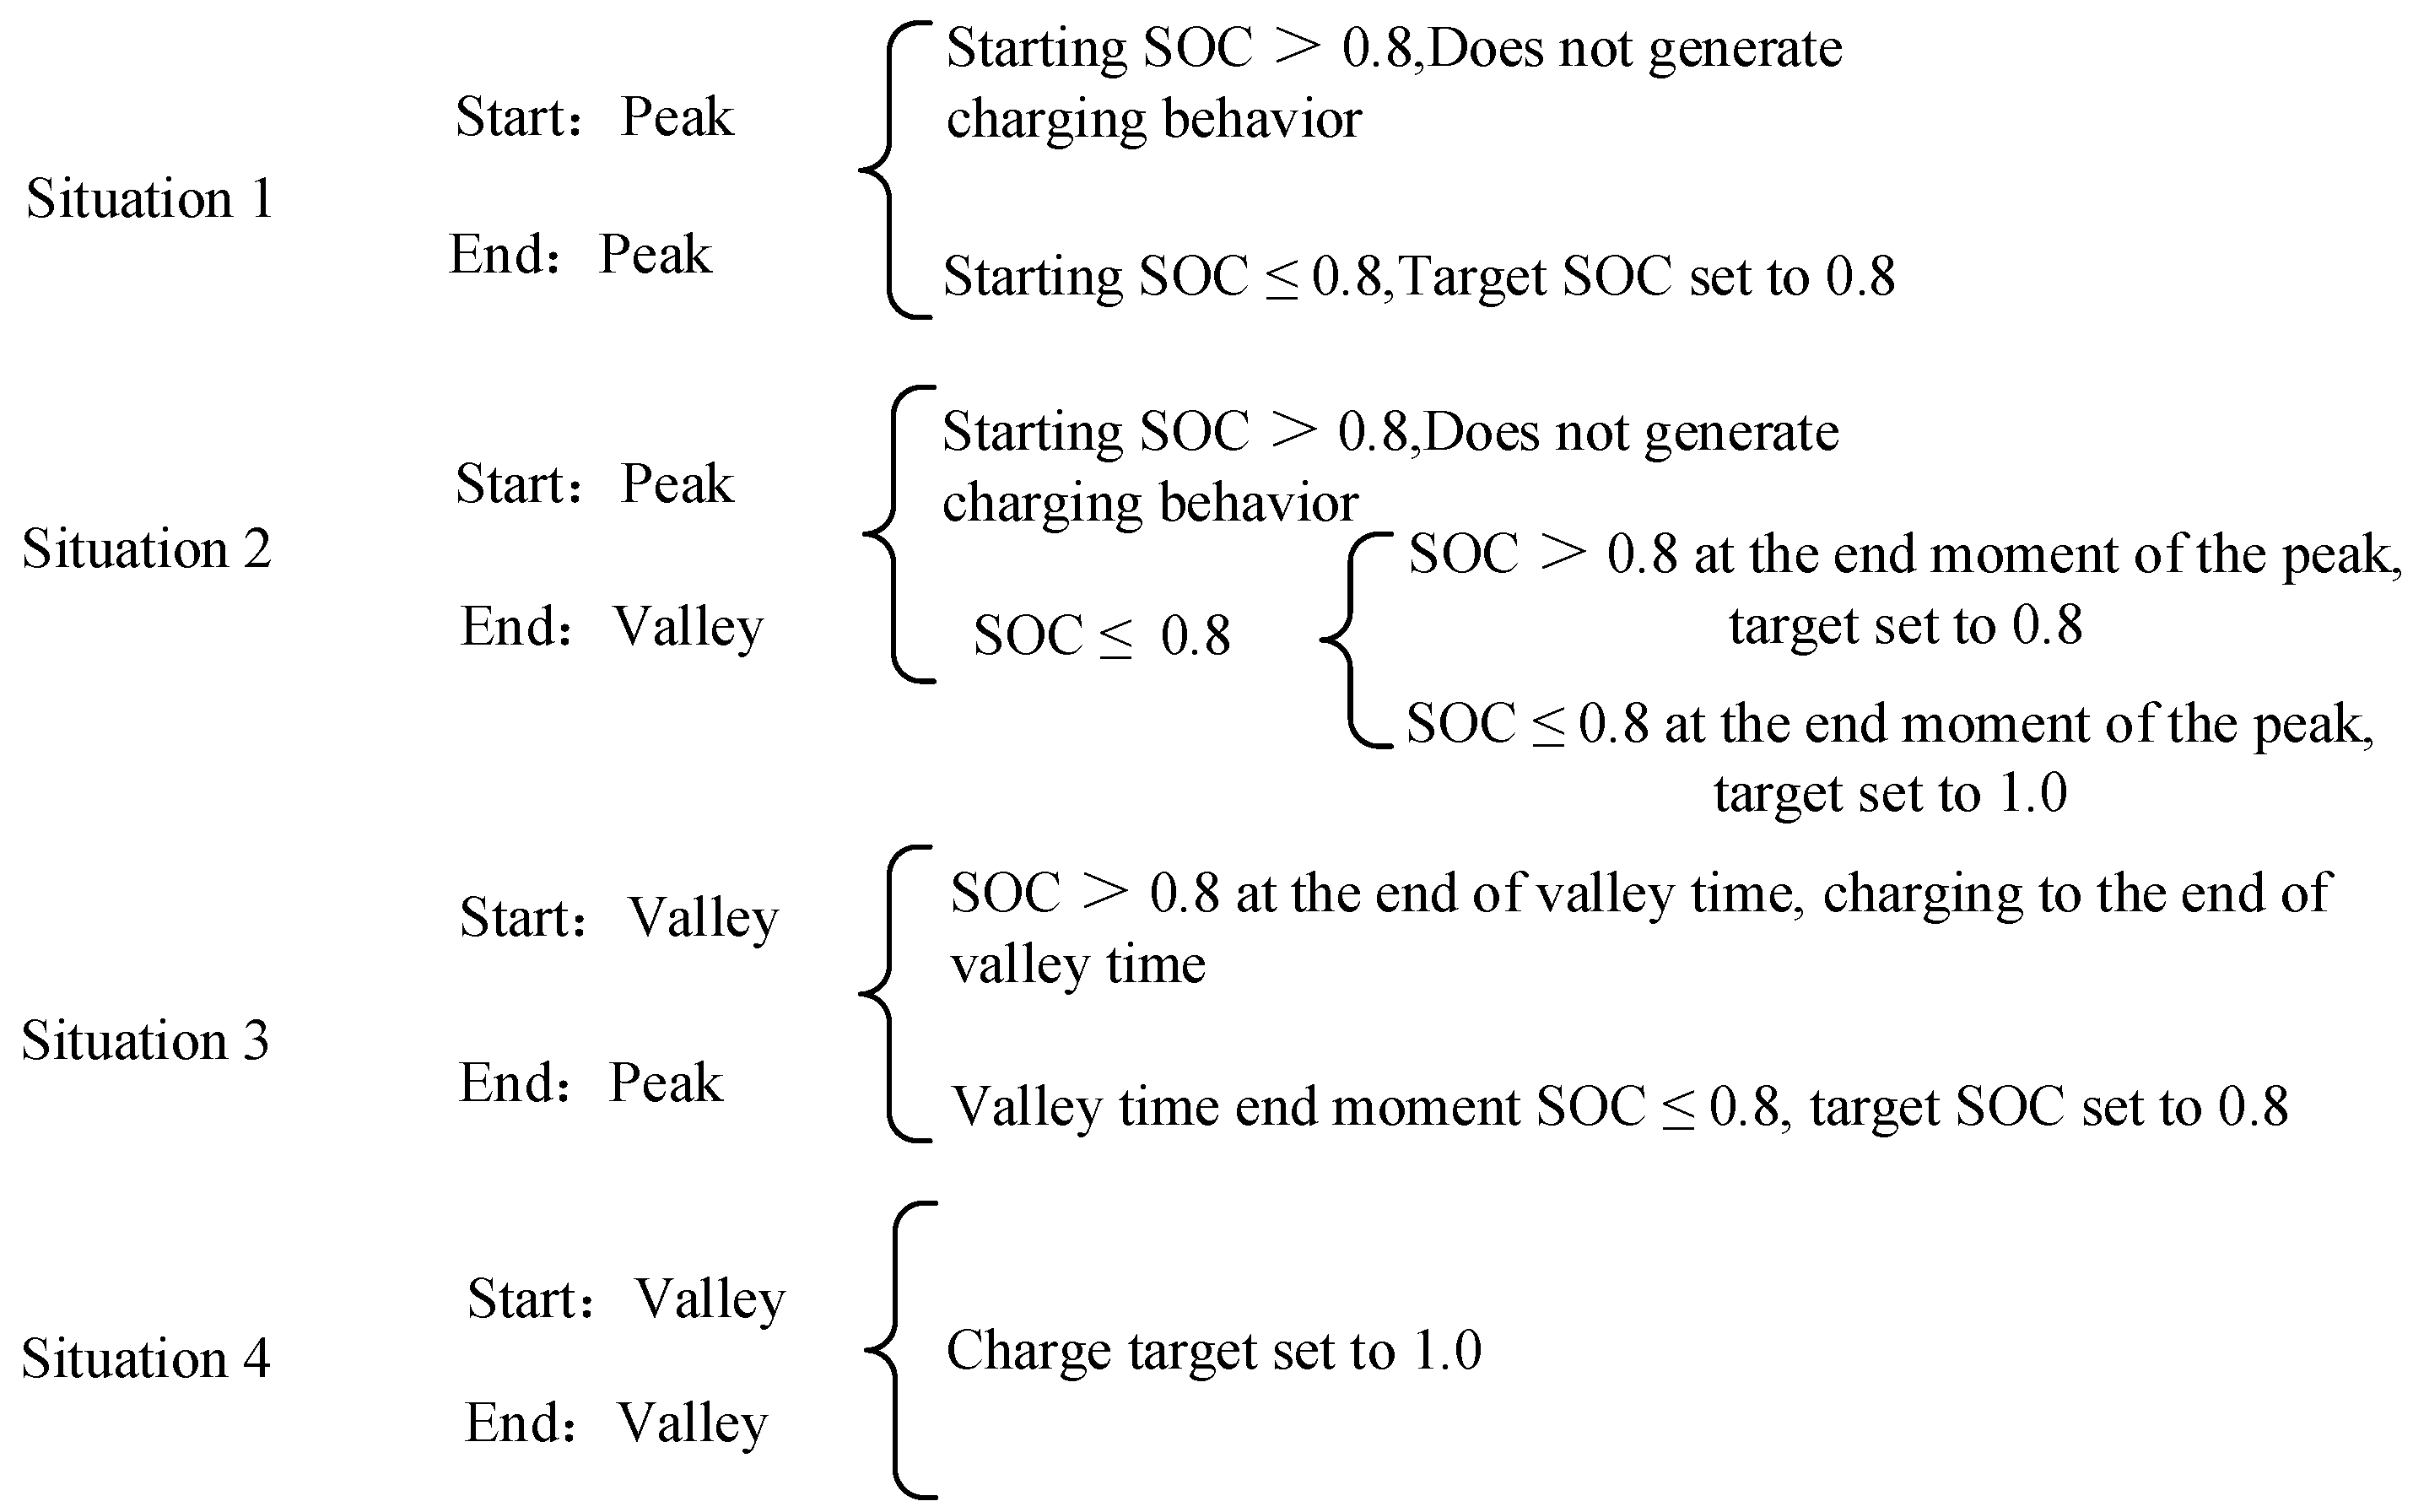
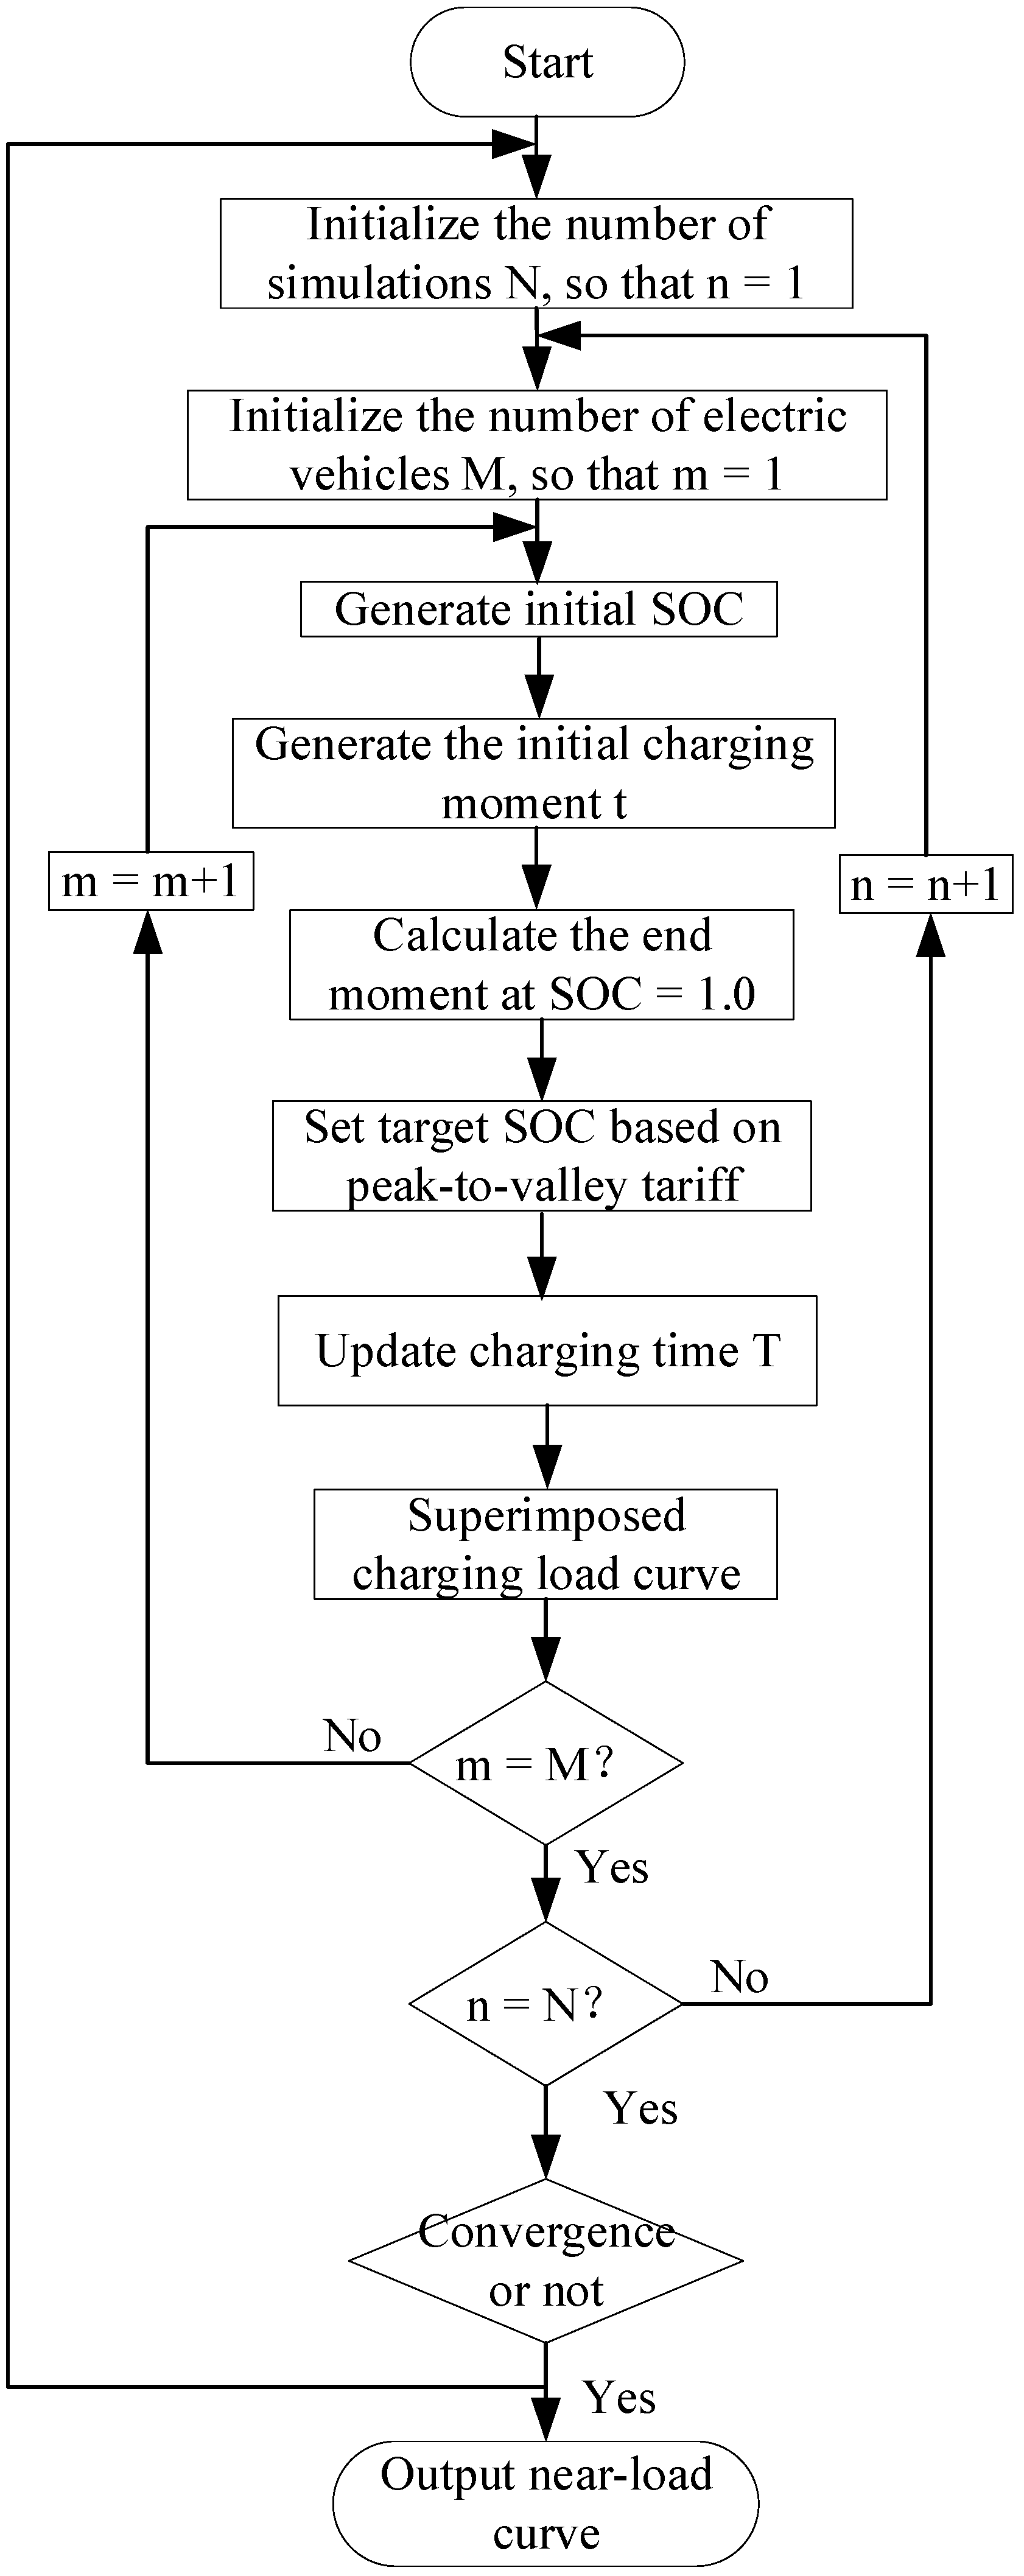
2.4. Typical Charging Station Load Model

In order to meet the charging demands of different users, the typical charging station studied in this paper is equipped with both DC charging piles and AC charging piles. Considering the EV charging queuing problem, a daily charging station load model is established by statistically superimposing the daily EV charging load and taking into account the daily monitoring load and night lighting load based on the EV charging load [27] characteristics and charging queuing method, and the charging station load construction method is shown in Figure 5 with a time step of 15 min.
(1)
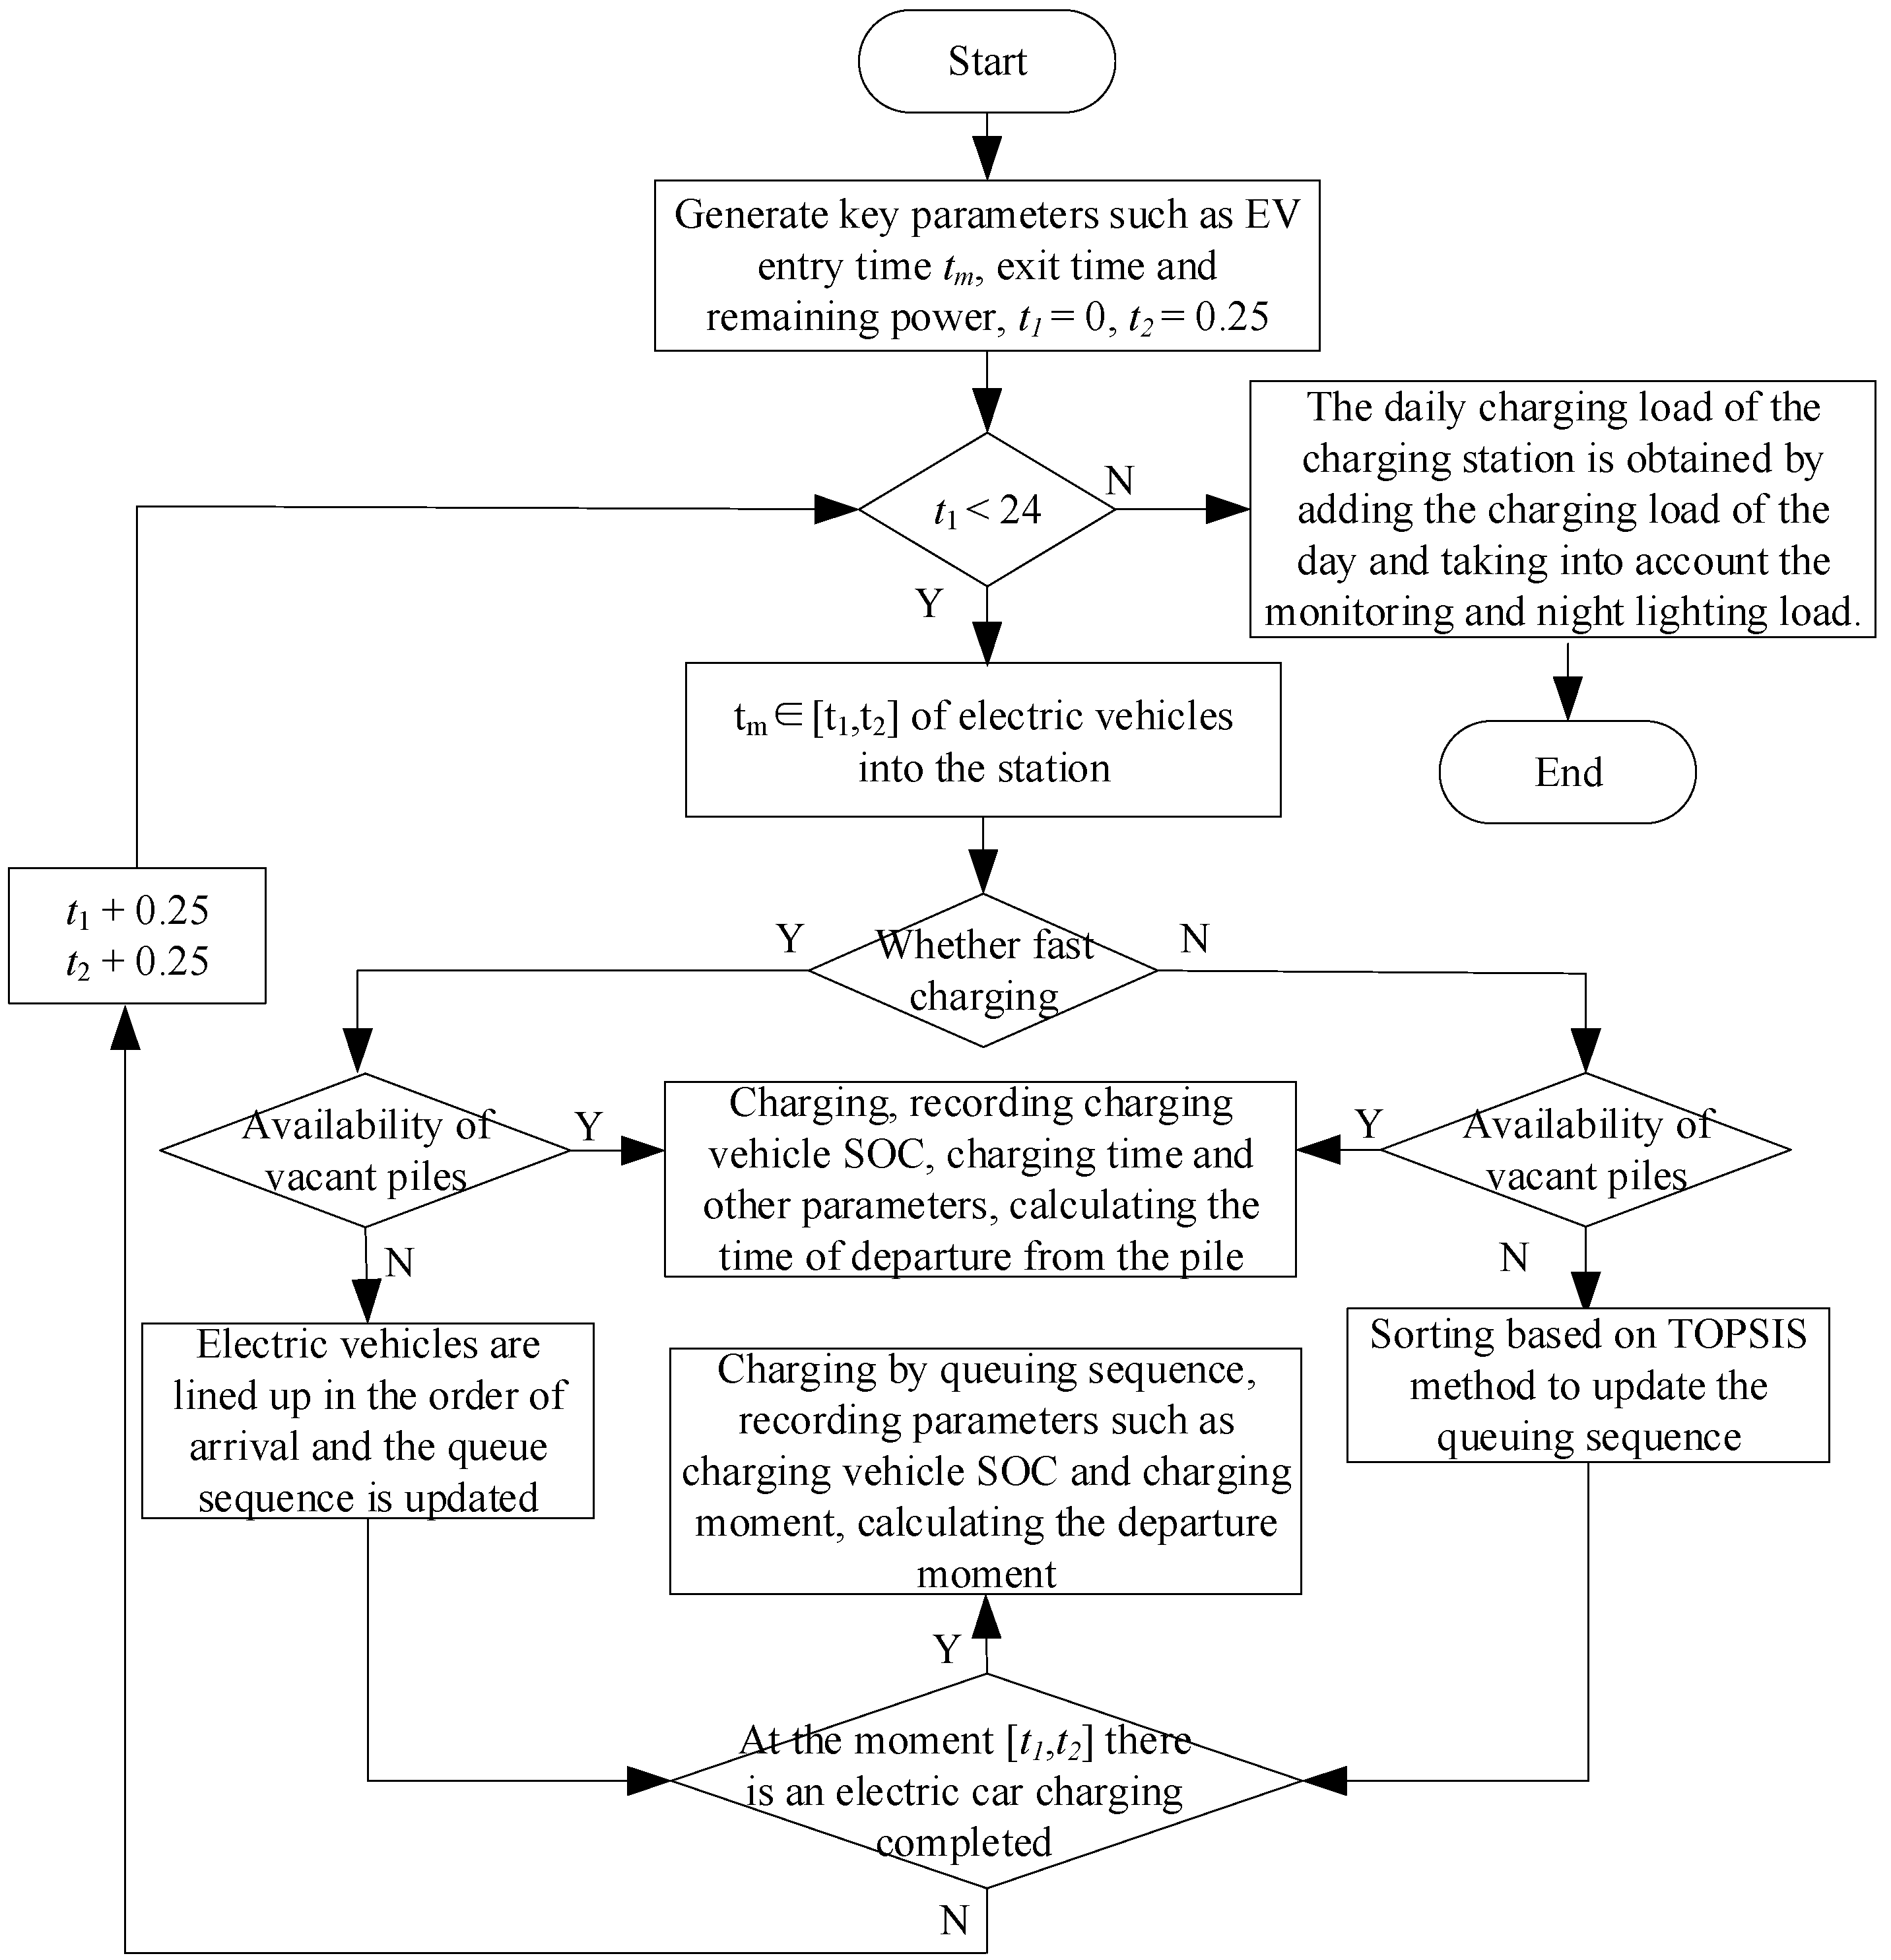
Based on Section 2.3, use the EV charging load characteristics to generate EV information, vehicle arrival time, vehicle mileage, vehicle departure moment and other key parameters, and the current moment t1 = 0, t2 = 0.25.
(2)
Judge whether the day is over or not; if the day is not over, select the time [t1, t2] when the electric vehicle enters the station according to the vehicle arrival time, and select the charging mode according to the vehicle charging demand. If DC fast charging is selected, move to Step (3); otherwise, move to Step (4). If the day has ended, skip to Step (7).
(3)
If there is an idle DC charging pile at this time, the electric vehicle will be charged directly, and parameters such as charging vehicle SOC and charging moment will be recorded to calculate the departure moment; if the DC charging piles are all in working condition, the electric vehicles will be queued in the order of arrival, the queuing sequence will be updated, and it will be judged whether there is an electric vehicle charging finished at the moment [t1, t2]. If an electric vehicle has finished charging, move to Step (5); otherwise, move to Step (6). If an EV has finished charging, enter Step (5); otherwise, enter Step (6).
(4)
If there is an idle pile at the AC charging pile at this time, the EV will charge directly and record parameters such as charging vehicle SOC and charging moment to calculate the departure moment; if the AC charging piles are all in a working state, the EV will sort based on the TOPSIS method, update the queuing sequence and determine whether an EV has finished charging at the moment [t1, t2]. If an EV has finished charging, move to Step (5); otherwise, move to Step (6).
(5)
Electric vehicles with the same replenishment demand are charged according to the queuing sequence, and parameters such as charging vehicle SOC and charging moment are recorded to calculate the moment of departure from the pile.
(6)
Make the current moment t1 and t2, add 15 min, then move to Step (2).
(7)
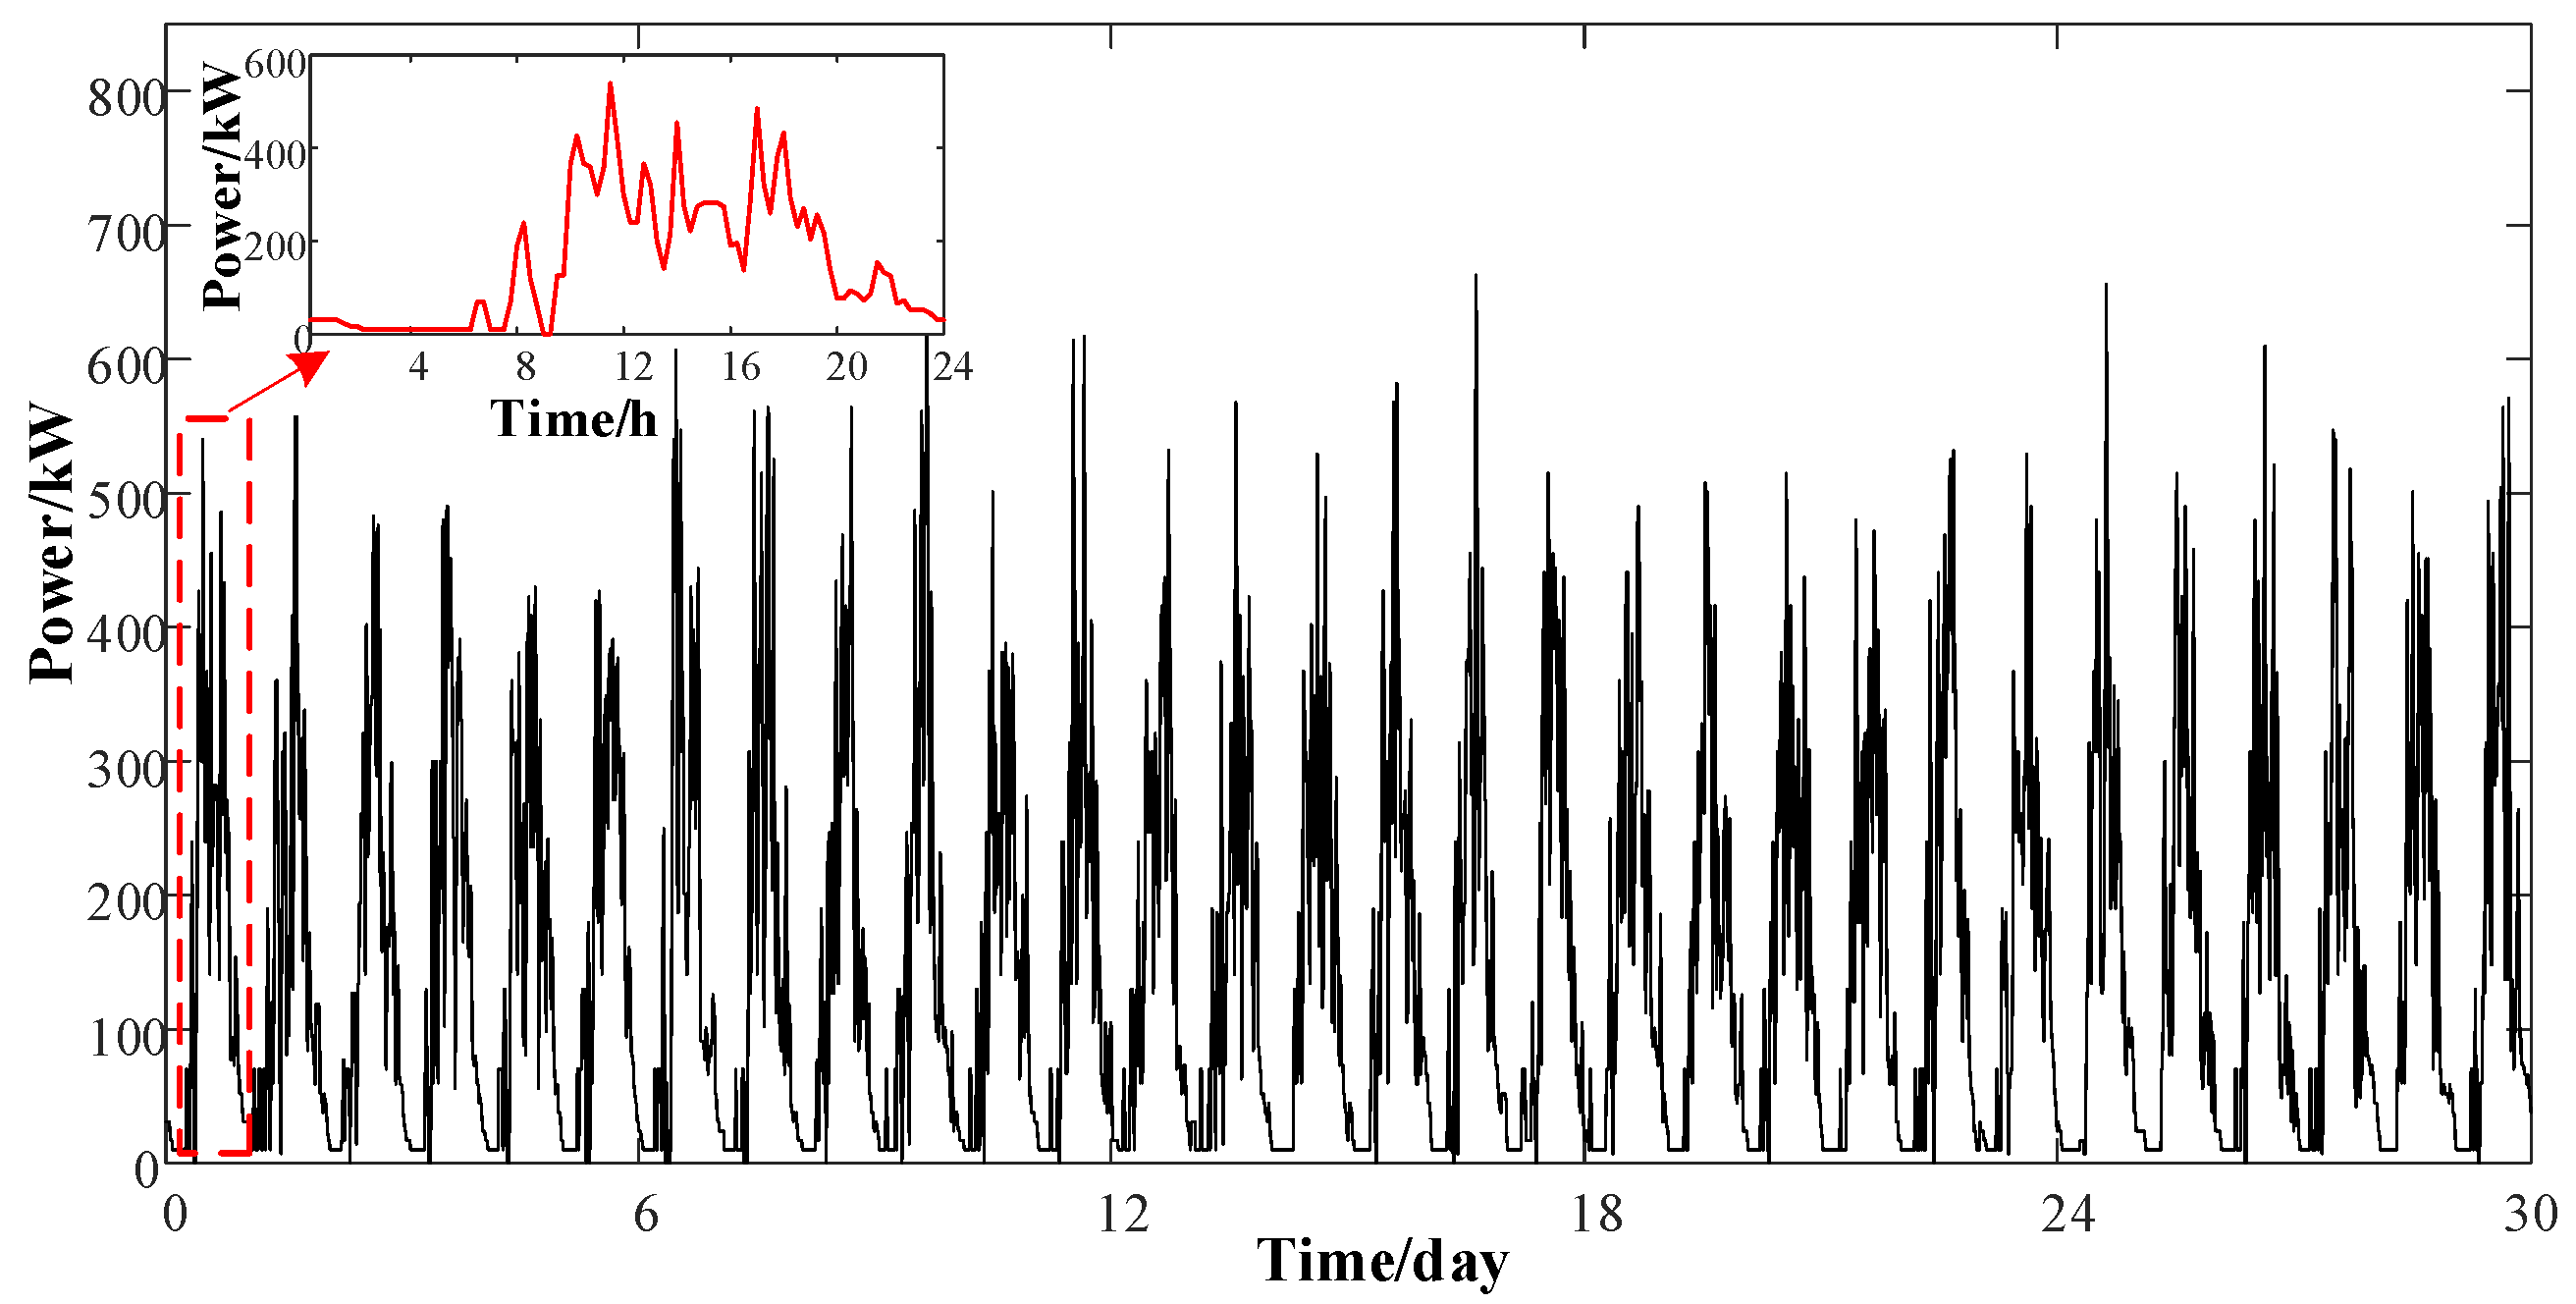
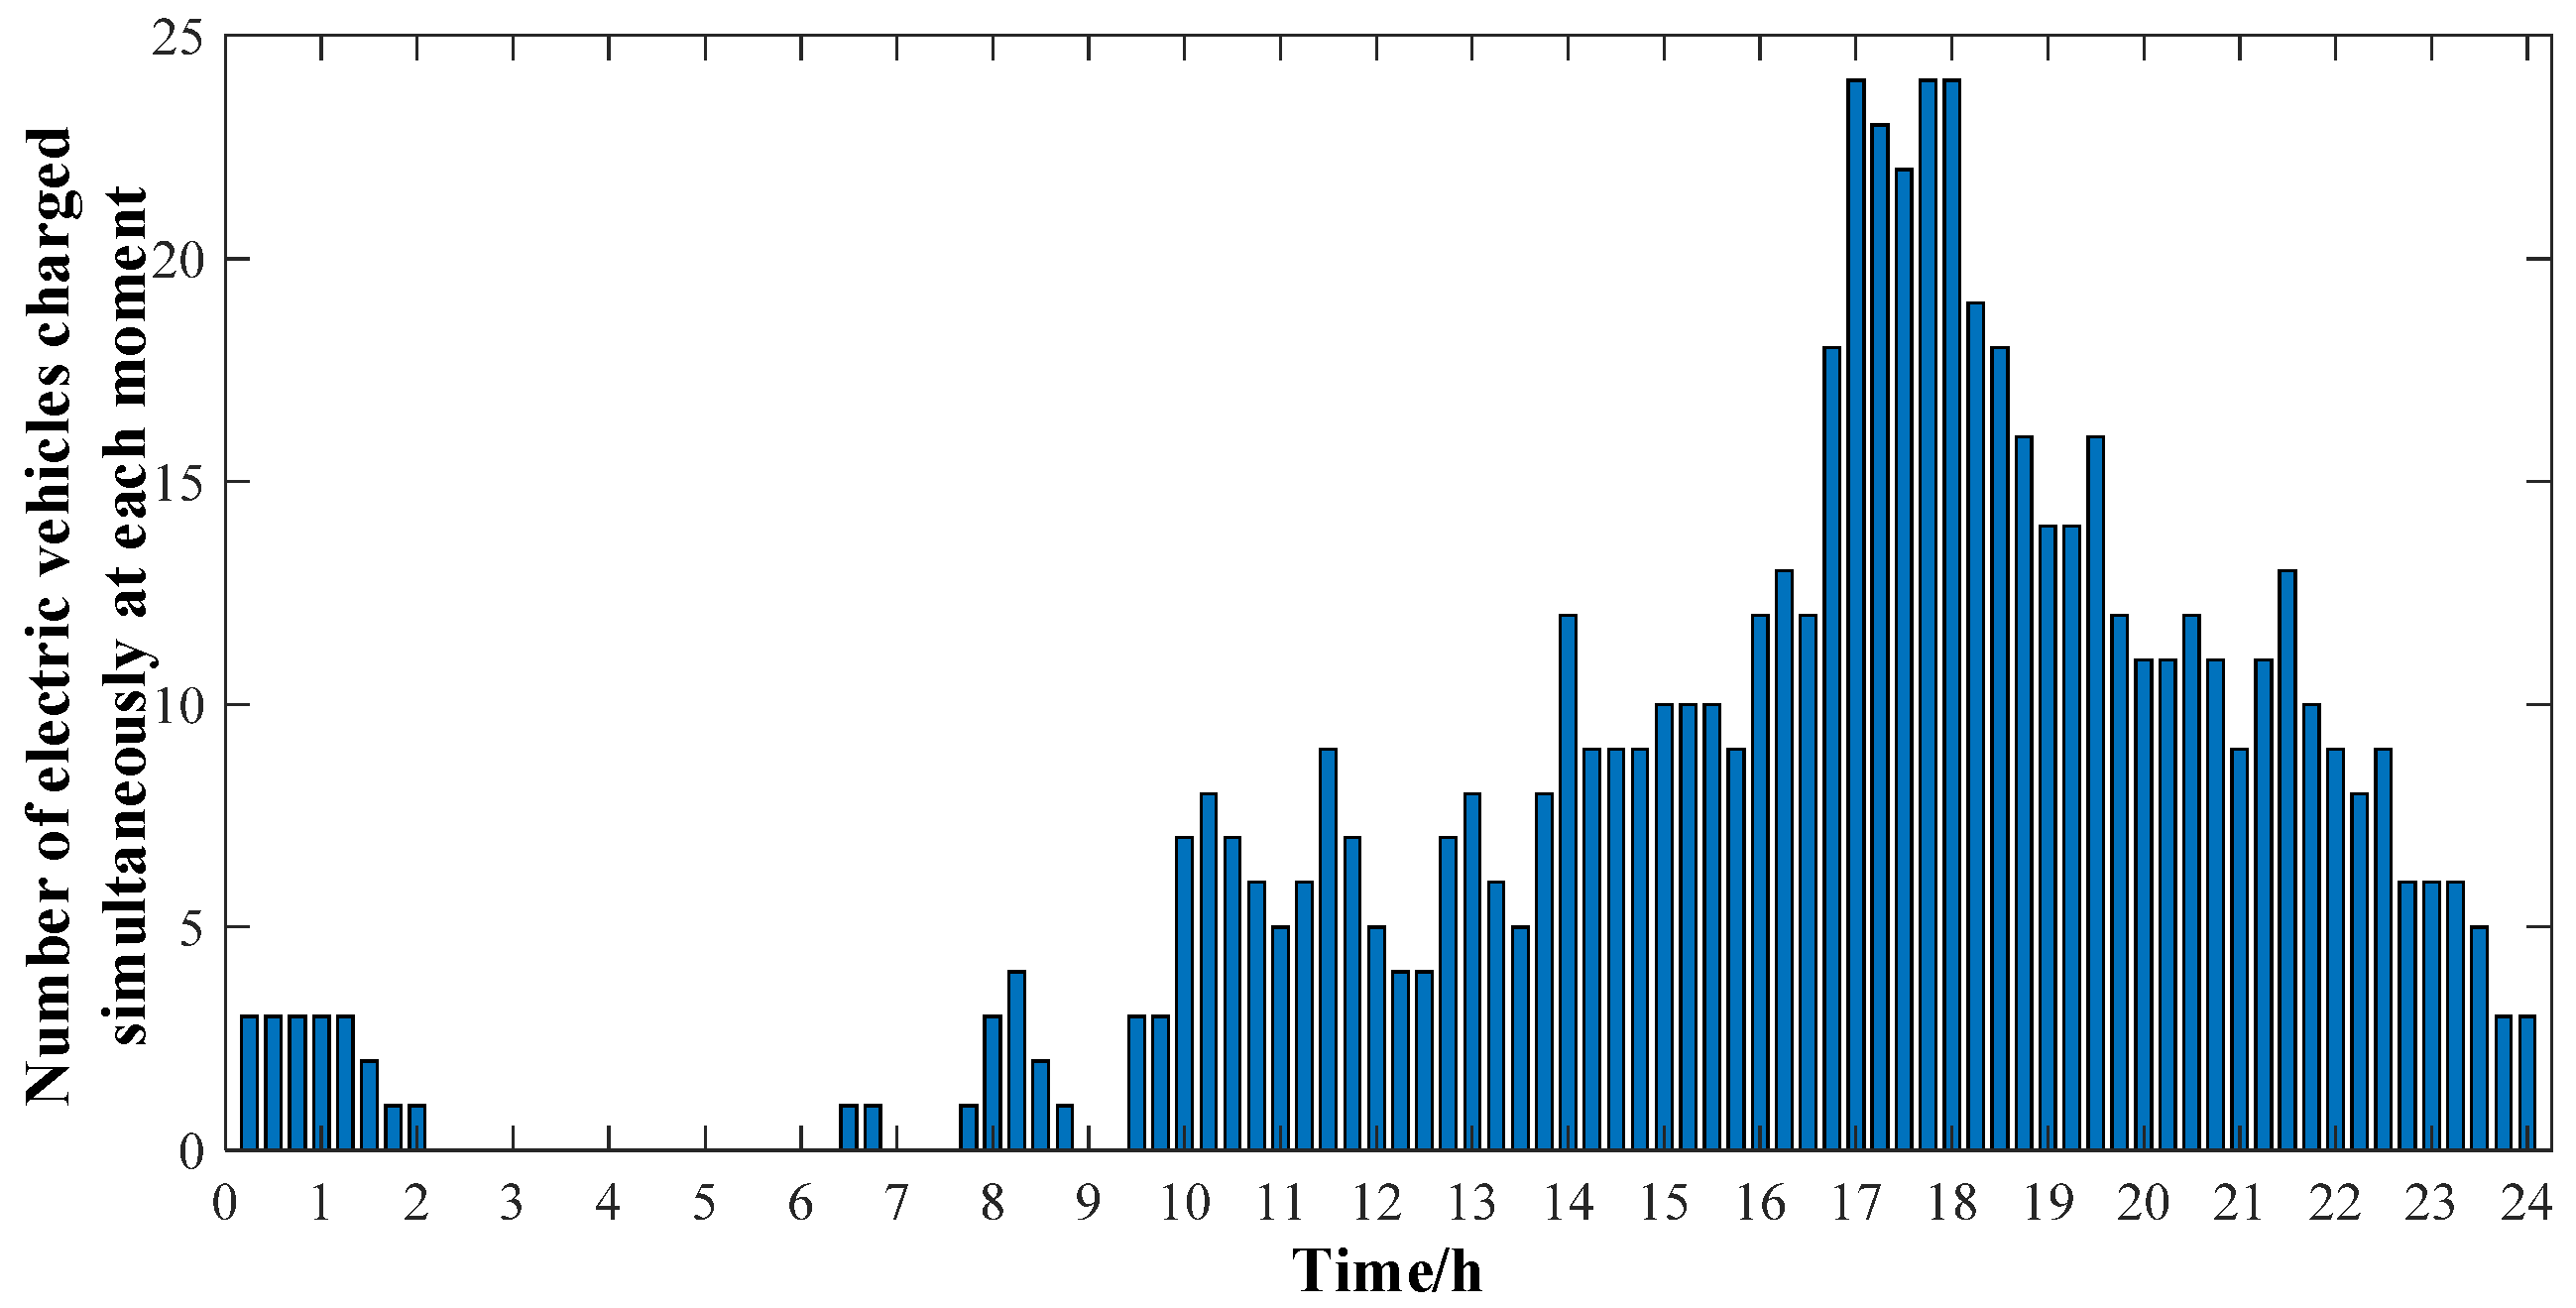
At the end of the day, the charging load of the day’s electric vehicles is statistically superimposed, and the monitoring and night lighting loads are taken into account to obtain the daily charging load of the charging station, so as to obtain the daily charging station load model.

3. Economic Operation Model

After the charging station is equipped with optical storage equipment and entered into operation, the charging load of electric vehicles and the power generation characteristics of the photovoltaic equipment in the actual operation will be more complex. Further, the operation mode of the station energy storage system will be adjusted accordingly. In order to meet the different PV generation characteristics and diversified charging demands, explore the “economically optimal” operation strategy of charging stations and improve the charging station operation revenue [27], this paper establishes a charging station daily operation revenue maximization based on the three-dimensional mapping of charging stations, the predicted values of PV and charging loads before the day, the initial SOC of energy storage and the safety constraints. Based on the three-dimensional mapping of charging stations, the day-ahead forecast of PV and charging load, the initial SOC of energy storage and the safety constraint information, this paper establishes a daily economically optimal operation model with the objective of maximizing the daily operating revenue of charging stations.

3.1. Objective Function

Charging station daily operating revenue includes charging station daily charging revenue and daily power purchase cost.
(1)
Charging station daily charging revenue
C c b _ d a y = t = 1 96 ( C e l e ( t ) + C s ) P e v ( t ) η e v Δ t
where Ccb_day is the daily charging revenue of the charging station; Cele (t) is the electricity price at time t; Cs is the charging service fee. Take CNY 0.8/kWh: Pev (t)′ is the charging load of the charging station at time t, excluding the monitoring and lighting load of the station at this time; Pev (t)′ is the charging efficiency of the charging post.
(2)
Charging station daily power purchase cost
C e c _ d a y = t = 1 96 ( P e v ( t ) η e v P b _ b e s t ( t ) η b P p v ( t ) η p v ) C e l e ( t ) Δ t
where Cec_day is the daily power purchase cost of the charging station; Pev (t) is the charging station load at time t, including the monitoring and lighting load of the station; Pb_best (t) is the optimal energy storage charging and discharging power at time t obtained by solving in the economically optimal mode; η b is the charging and discharging efficiency of the energy storage system (take 1 η b _ c when charging and η b _ d when discharging); Ppv (t) is the power dissipation of the PV equipment output at moment t; and η p v is the efficiency of the PV equipment output. This can be expressed as:
P b _ b e s t ( t ) η b = l o _ c ( t ) P b _ c ( t ) η b _ c l o _ d ( t ) P b _ d ( t ) η b
where lo_c(t) is the decision variable of charging the energy storage system at the moment (1 when charging, 0 otherwise) and lo_d(t) is the decision variable of discharging the energy storage system at the moment (1 when discharging, 0 otherwise).
(3)
The daily operating income was:
C o c _ d a y = C c b _ d a y C e c _ d a y
where Coc_day is the daily operating revenue of the charging station.

3.2. Binding Conditions

(1)
System safety operation constraint
Once the external power grid fails, the charging station system will enter into island operation. In order to ensure that the important local load can still operate normally in this state, the new energy generation load ratio must be required when the charging station is running on the grid, and the new energy generation-to-load ratio must not be lower than a certain value in any hour.
P r e p ( t ) α P t o t a l ( t )
where Prep is the new energy generation power at moment t; Ptotal is the total demand load of the charging station at moment t; and a is the minimum self-generation rate of the charging station system.
(2)
Energy balance constraint
At any point in the day, the charging station needs to meet the power balance.
P g r i d ( t ) + P p v ( t ) η p v = P e v ( t ) η e v + P b _ b e s t ( t ) η b
where Pgrid (t) is the power supply from the grid to the charging station at time t.
(3)
Energy storage system power and power constraints
P b _ max P b ( t ) P b _ max
S O C min S O C ( t ) S O C max
where Pb_max is the maximum charge/discharge power of the energy storage; SOCmin is the minimum value of the charge state of the energy storage system; and SOCmax is the maximum value of the charge state of the energy storage system [28].
(4)
Energy storage battery output power constraint
P B , min P B ( t ) P B , max
where PB,min is the minimum charge/discharge power of the energy storage battery and PB,max is the maximum charge/discharge power of the energy storage battery.
(5)
Energy storage battery capacity constraints
According to the rated capacity and depth of discharge of the energy storage battery, the range of the energy storage’s power variation needs to meet:
E B , min E B ( t ) E B , max
where EB,max and EB,min are the upper and lower limits of the energy storage battery power, respectively; set the rated capacity of the energy storage battery as EB,max, while EB,min depends on the maximum depth of discharge of the energy storage battery.
(6)
Photovoltaic power output constraint
P p v ( t ) < P p v _ max ( t )
where Ppv_max (t) is the PV power generation at time t.

3.3. System Model and Solution

(1)
Energy storage operation model
The operation model of the energy storage nodes in the distribution network is established, and the energy storage nodes are PQ type nodes. Considering the energy storage with the ability of active and reactive power scheduling, the operation constraints shown in Equations (17) and (18) are established [29,30].
P b a i ( t ) 2 + Q b a i ( t ) 2 S b a i ( t ) 2 Q b a max ( t ) 2 Q b a i ( t ) 2 Q b a max ( t ) 2
where P b a i ( t ) and Q b a i ( t ) are the active and reactive power of energy storage at node i at time t; S b a i is the apparent power of energy storage at node i; and Q b a max is the upper limit of the reactive power of energy storage [31].
The charge state of the energy storage is bounded by:
P b a i ( t ) η / E max = S O C b a i ( t ) S O C b a i ( t 1 ) ( P b a i ( t ) 0 ) P b a i ( t ) / η = E max ( S O C b a i ( t ) S O C b a i ( t 1 ) ) ( P b a i ( t ) < 0 ) 0.2 S O C b a i ( t ) 0.9 S O C b a i ( 0 ) = S O C b a i ( T )
where P b a i ( t ) and S O C b a i ( t ) are the active power and charge state of energy storage at node i at time t, respectively; Emax is the rated energy of energy storage; η is the operating efficiency of energy storage. The first two equations indicate the dynamic transfer equation of the charge state of energy storage, and the inequality indicates the upper and lower charge limit constraint of the energy storage operation. In order to ensure the stable operation and prolonged service life of energy storage, the charge amount should be controlled within a certain range, and it is usually considered that the charge state is located at 0.2~0.9 as the safe working range of energy storage. The last equation constraint indicates that the daily charge of the energy storage is kept constant, and in order to ensure the long-time cycle work of the energy storage, the charge state at the end of its dispatch should be equal to the initial charge state [32,33].
(2)
Photovoltaic operation model
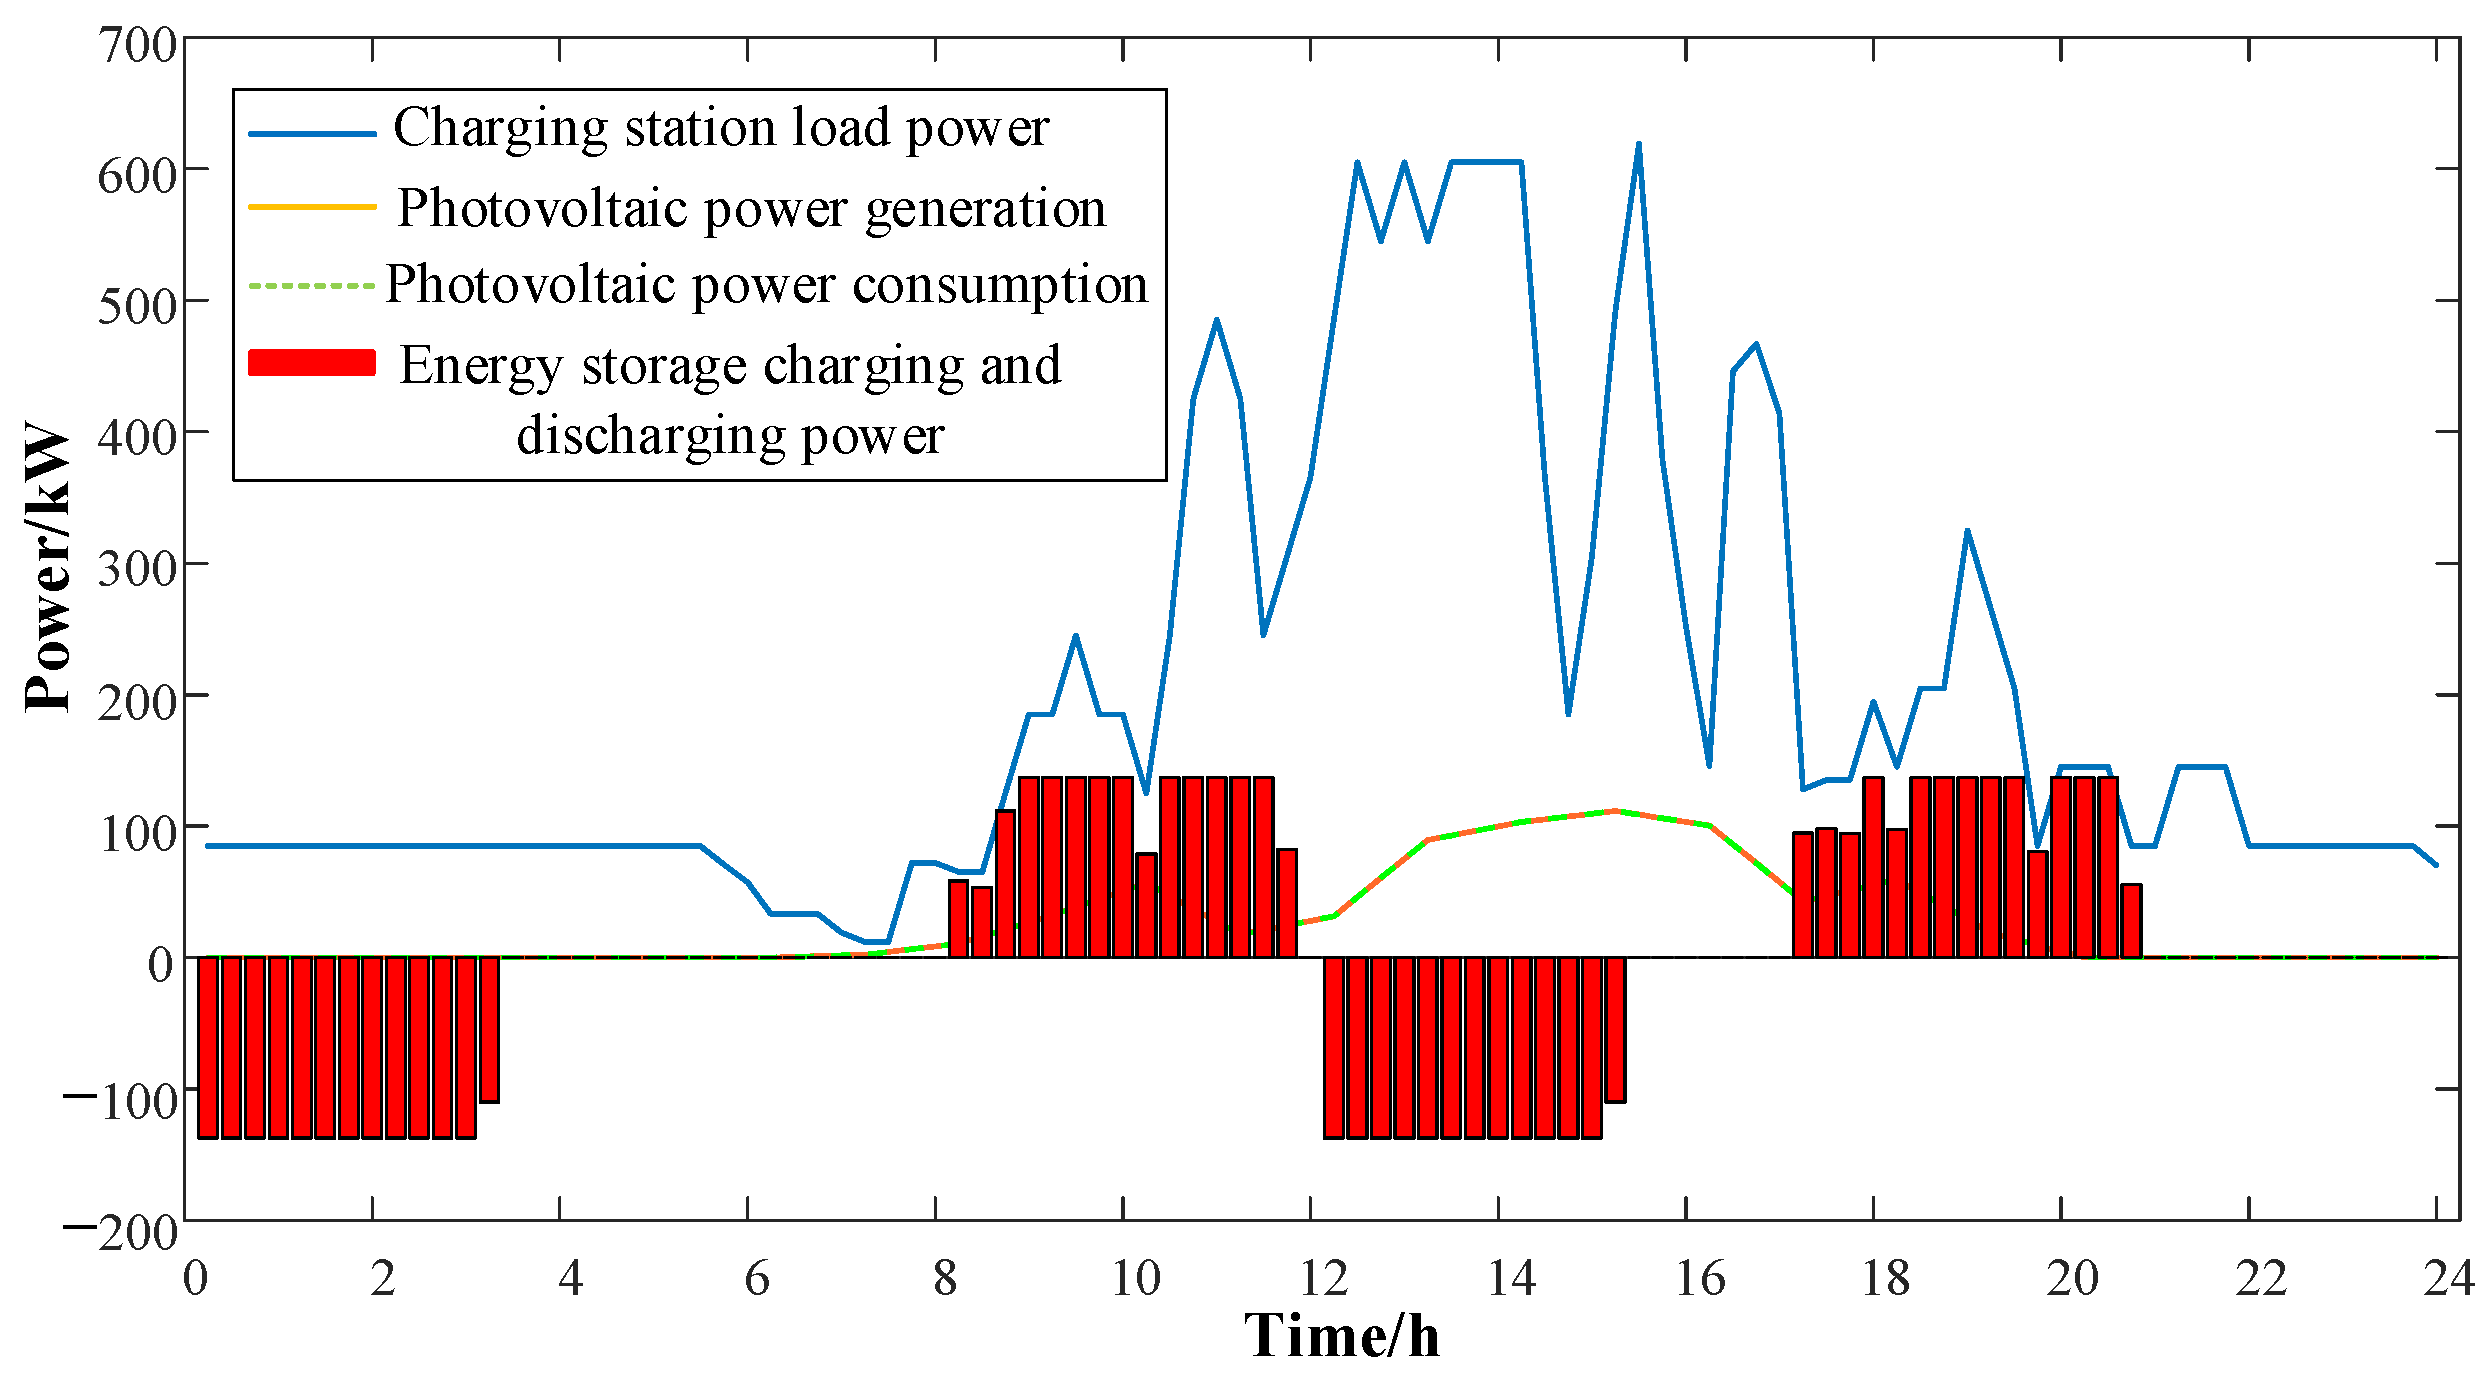
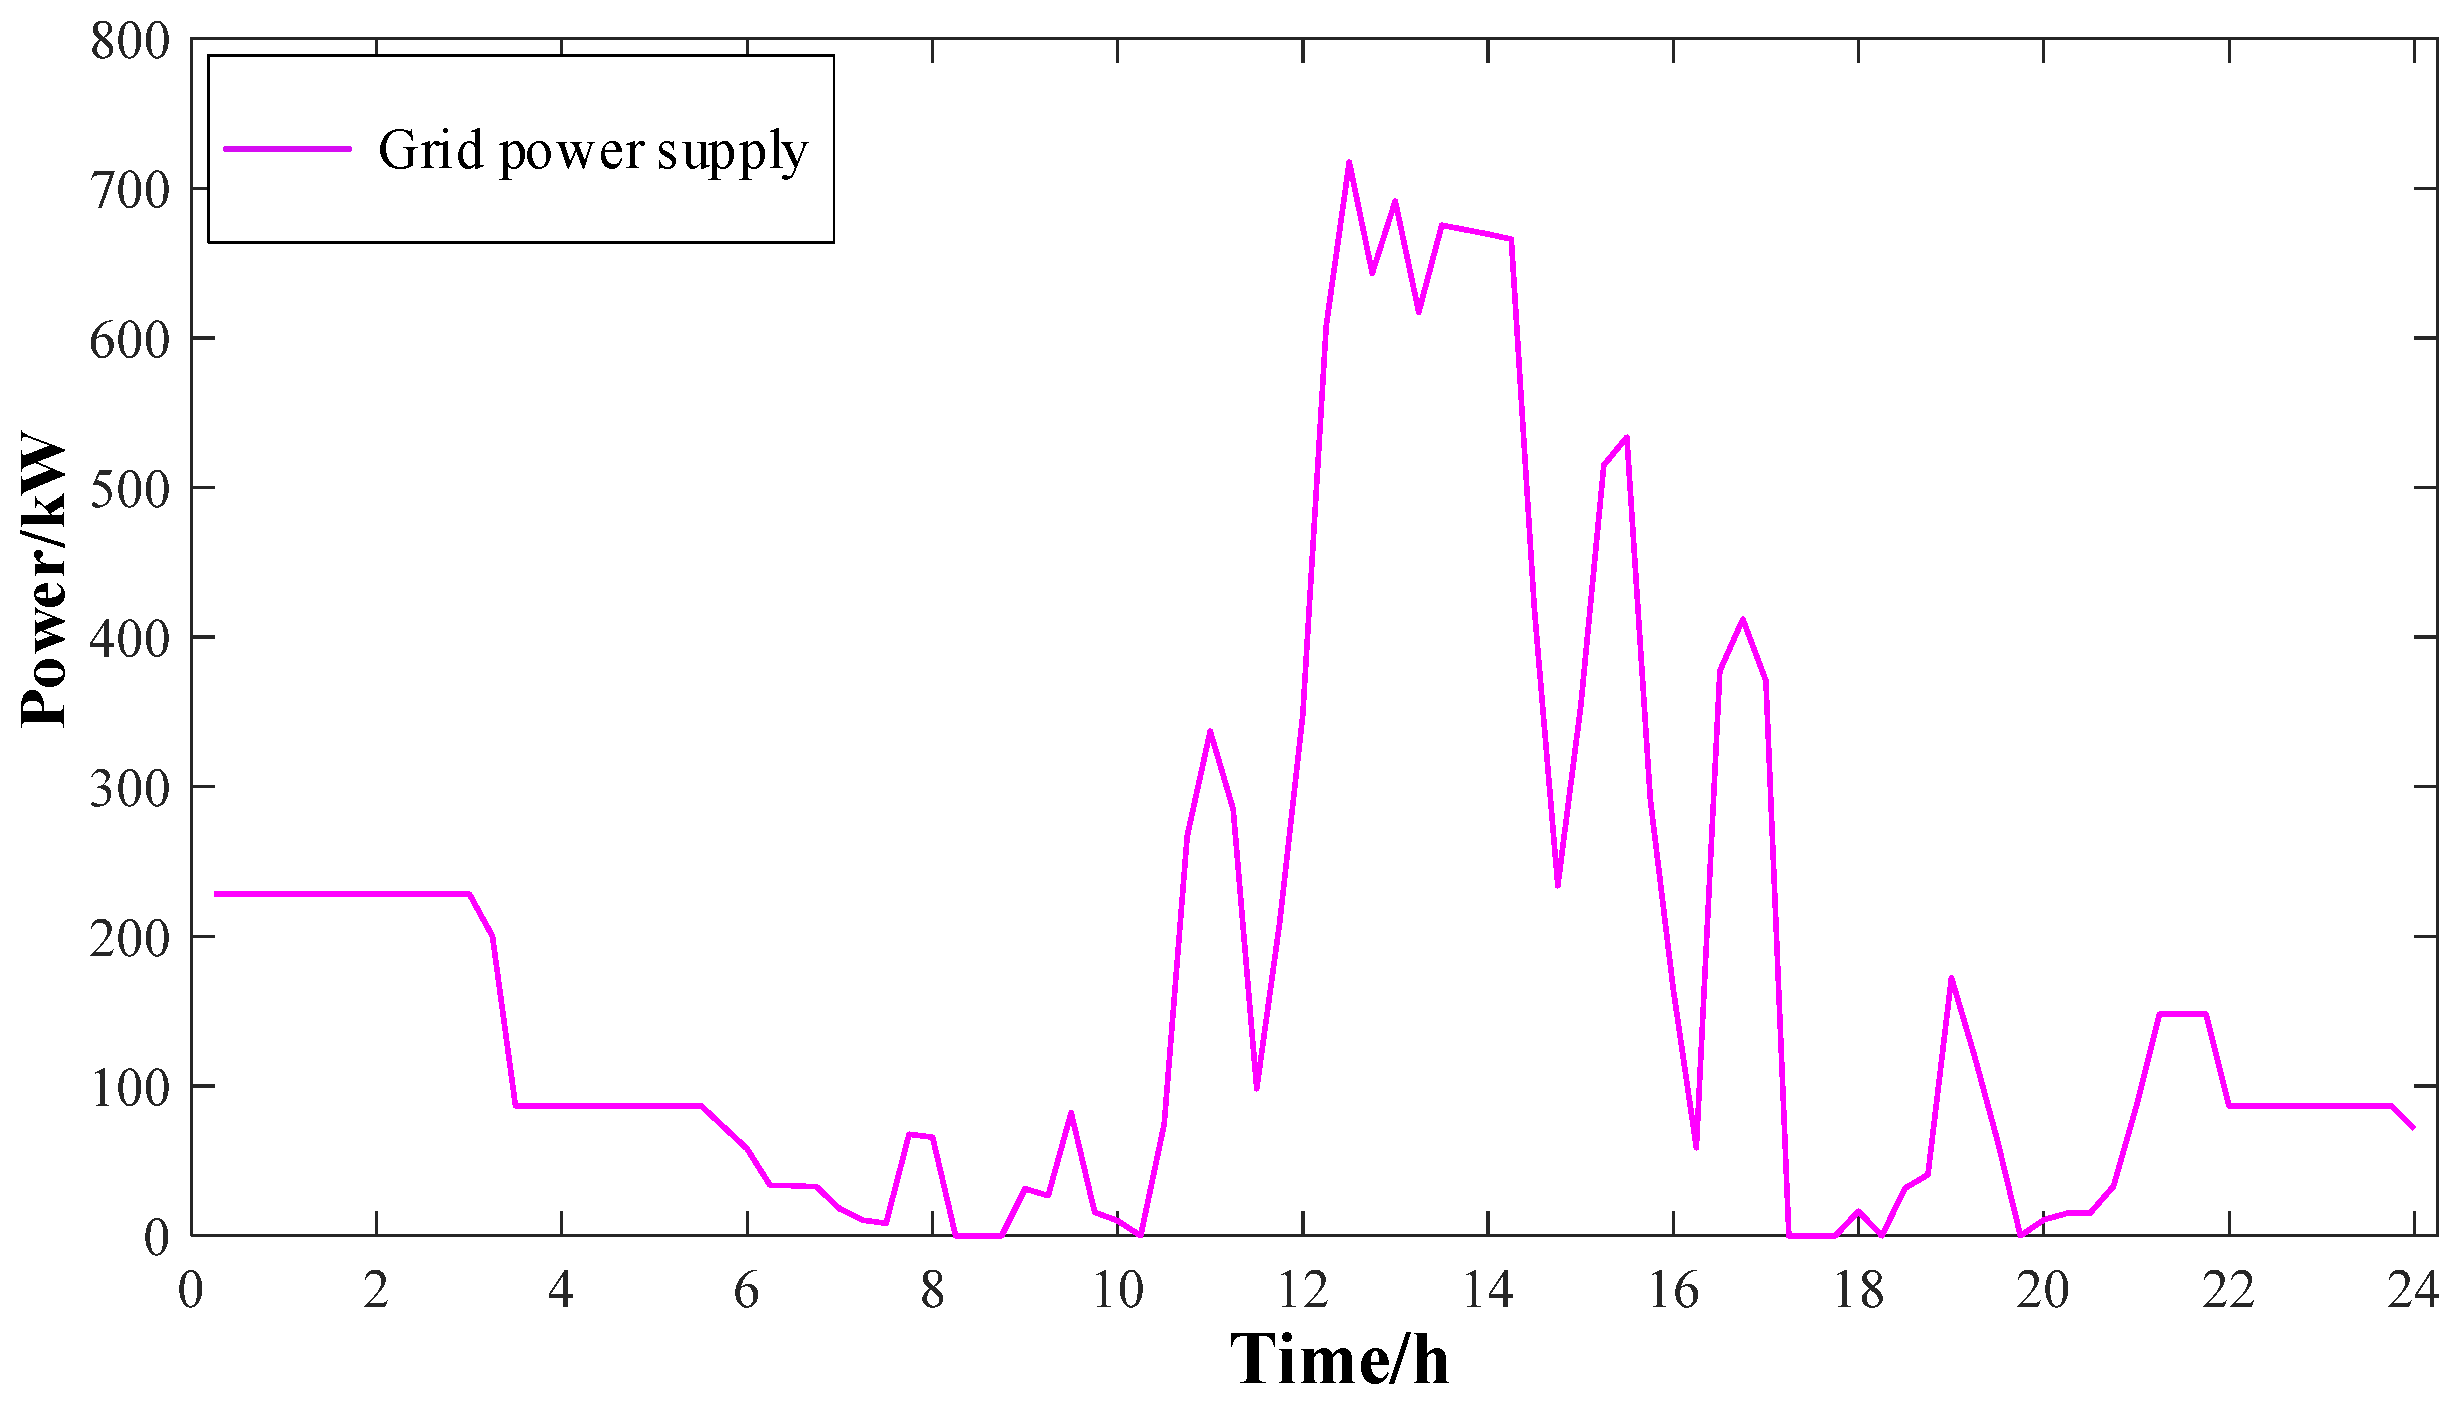
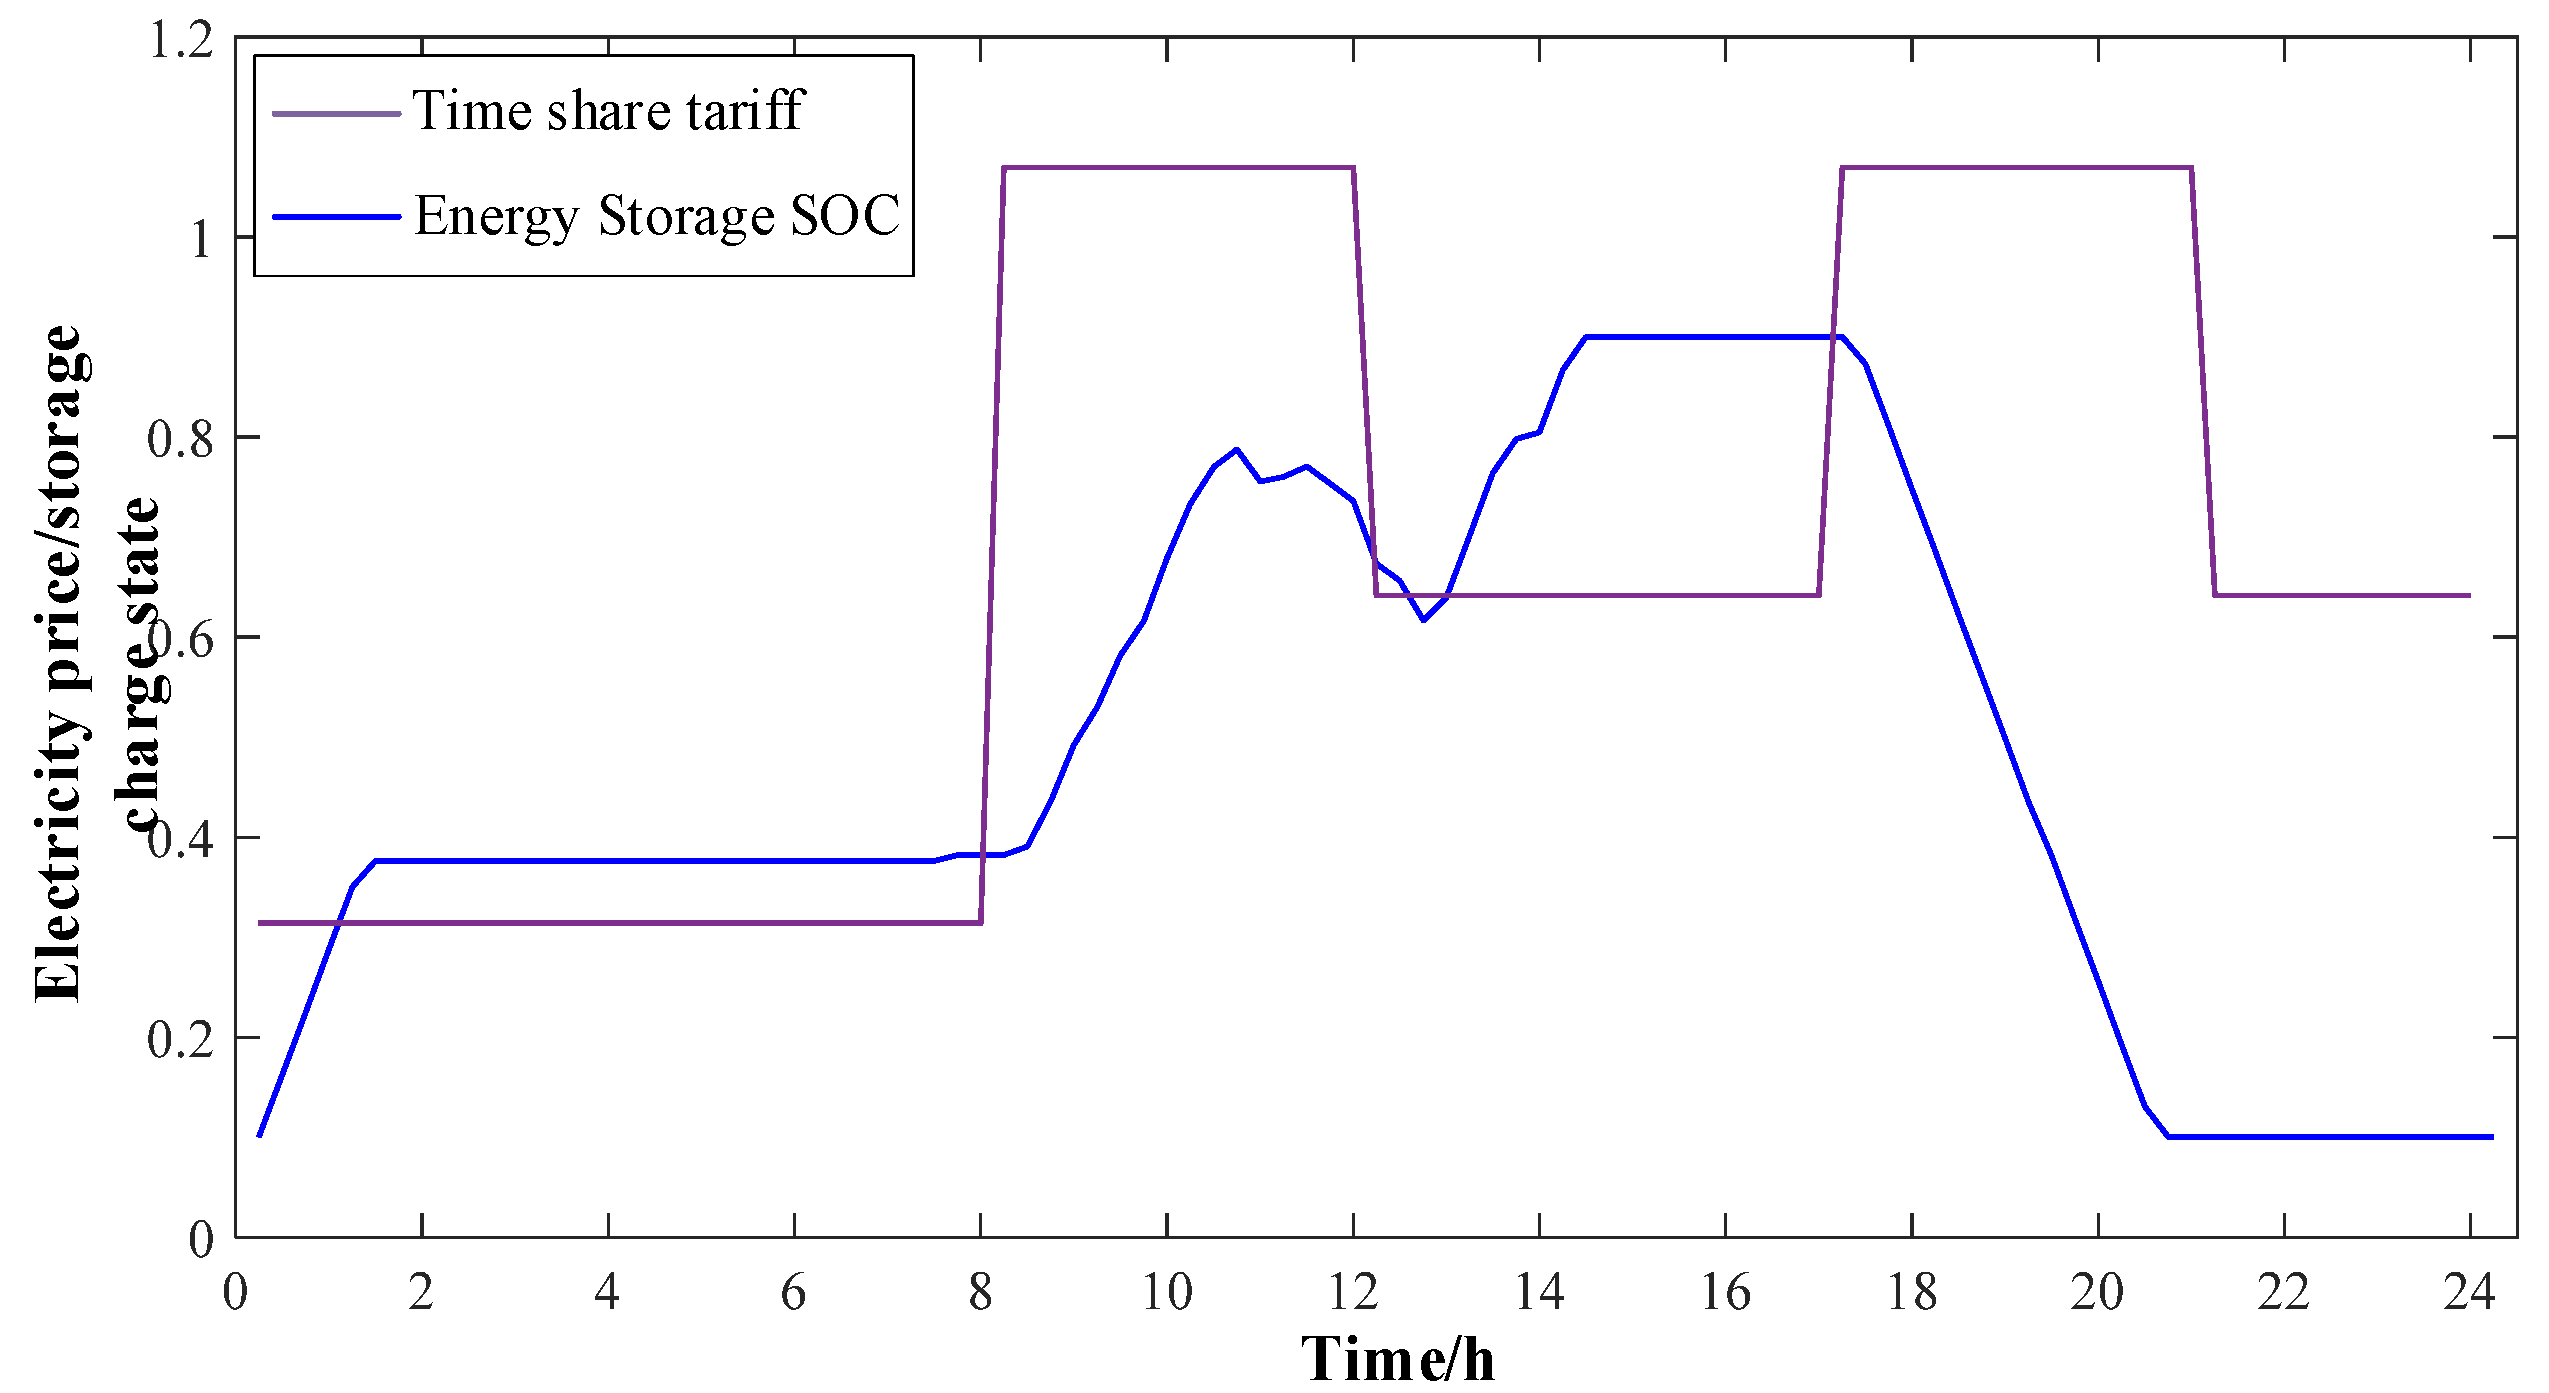
Considering PV access, the PV generation unit is set as an uncontrollable resource that always provides its own maximum supply to the system. The PV operation model can be expressed as:
P P V ( t ) = P P V M P P T ( t )
where P P V M P P T ( t ) is the maximum output of photovoltaic power generation at time t.
When solving the above model, if the optimization algorithms such as particle swarm are used, the results of each solution are inconsistent and difficult to apply to the actual decision of charging and discharging energy storage days. In order to obtain the best storage charging and discharging power in the economically optimal mode, this paper transforms the economic operation model into a mixed integer linear programming model to solve [34].
First, it is necessary to linearize Equation (8), making ω c ( t ) = l o _ c ( t ) P b _ c ( t ) and ω d ( t ) = l o _ d ( t ) P b _ d ( t ) and satisfies ω c ( t ) ω d ( t ) [ 0 , P b _ max ] . Introduce the following auxiliary constraints:
{ ω U x ω z ω z U ( 1 x )
where ω is the auxiliary variable, U represents the maximum charge/discharge power of energy storage; x represents the shaping decision variable; and z represents the charge/discharge power of energy storage. Therefore, the original model can be equivalent to the model in Appendix A.
In order to reduce the number of times that the energy storage system is charged and discharged so that it has charging and discharging priority on a continuous time scale, a penalty is superimposed on the time-sharing tariff, a set of increasing minima is superimposed on the tariff during the valley period, and a set of decreasing minima is superimposed on the peak period. Further, a unique solution is generated without changing the final target value [35].
The specific implementation process is as follows: by reading the day-ahead forecast value of PV and charging load, time-of-day tariff, initial SOC and the safety constraint information of energy storage, and importing this information into Equations (A1)–(A3) for the optimization calculation, the optimized charging and discharging plan value of 96 moments before the energy storage day can finally be obtained.

4. Case Study

The article selects the typical daily load and PV output of the charging station as the day-ahead prediction and uses the MATLAB toolbox YALMIP + CPLEX to solve Equations (A1)–(A3), in order to obtain the optimal charging and discharging of energy storage under different scenarios and propose the optimal operation strategy of the charging station.
(1)
Scenario I
In Scenario I, the PV power generation is low, and the energy storage does not need to consider the PV dissipation problem. The solved charging station load power, PV power, PV power consumption, solved optimal storage charge/discharge power, grid power supply and energy storage system SOC variation curve in Scenario I are shown in Figure 6, Figure 7 and Figure 8.
As shown in Figure 7, in Scenario I, the energy storage system first selects the 0:00~8:00 valley price period to continuously charge from initial capacity 0.1 to maximum power 0.9, and discharges to the minimum power during the 8:00~12:00 peak price period to supplement the power shortage by the grid. In order to maximize the benefits of the charging station, the charging station is continuously charged to the maximum power during the parity period from 12:00 to 17:00 and discharges all the power during the subsequent peak period to obtain the “peak-valley” and “peak-parity” price difference revenue. This is in order to realize the charging station revenue and maximize the revenue of charging stations.
(2)
Scenario II
With the construction of a new power system that is mainly based on new energy, and with increasing distributed photovoltaic access to the distribution network, the realization of energy green low-carbon transformation at the same time causes a series of problems such as serious tide return and voltage over the limit. Therefore, there is an urgent need to analyze the higher PV generation and the need to consider the storage charging and discharging in the case of PV consumption, as shown in Scenario II. Solving for the charging station load power, PV power, PV power consumption, solved optimal storage charging and discharging power, grid power supply and energy storage system SOC variation curve in Scenario II is shown in Figure 9, Figure 10 and Figure 11.
As shown in Figure 9, Figure 10 and Figure 11, the initial capacity of the energy storage system is 0.1, which is continuously charged to meet the maximum capacity under the demand of the day during the low tariff period, and to consume the excess PV power; at the 8:00~12:00 tariff peak section, the PV equipment power supply is first considered, and the excess PV power is consumed by the energy storage to fill the shortage at the same time, as can be seen from Figure 10, except for the 12:00 moment when the maximum discharge power of the storage system cannot. In addition to 12:00, when the maximum discharge power of the storage system cannot meet the load demand, the power supply from the grid is 0 at other times in the peak section of the tariff. The energy storage is used to consume excess PV power, while releasing the consumed PV power if the capacity is full before the next peak period and releasing all the power in the subsequent peak period. In addition, except for 13:00 and 14:00 when the maximum charging power of the energy storage system cannot meet the PV power consumption, the PV power is completely consumed at other times.
In order to verify the economics of the current charging and discharging strategy of the energy storage system, the daily operating revenue of the charging station under the economically optimal operation strategy is compared with that of the optical storage capacity configuration operation strategy, and the comparison results are shown in Table 2.
In Scenario I, the PV power generation is small, so there is no need to consider the PV consumption problem. Further, solving for the optimal charging and discharging power of the energy storage system shows that the economically optimal operation strategy maximizes the revenue by obtaining the price difference between “peak-valley” and “peak-even” hours and the daily operating. In Scenario II, the PV power generation is large, and solving for the optimal charging and discharging power of the storage system shows that the economically optimal operation strategy takes into account the subsequent PV power consumption during the valley hours, as well as keeps the charging margin while ensuring the maximum PV consumption, which finally maximizes the revenue and increases the daily operation revenue by CNY 94.9.
According to the comparison results of charging station daily operation revenue under two operation strategies in Table 2, the economically optimal operation strategy can significantly reduce the power purchase cost of the charging station, improve the charging station’s daily operation revenue and adapt to the economically optimal operation demand under different scenarios. Moreover, the utilization rate of energy storage is greatly improved. If the energy storage life loss cost is considered, the energy storage charging and discharging cycle life is predicted according to the energy storage charging and discharging SOC–time curves in different scenarios. It is then converted to the charging station daily investment, operation and maintenance costs. The final results indicate that the economically optimal operation strategy can maximize the charging station revenue.

5. Conclusions

This paper proposes an economic operation strategy for charging stations to meet the economically optimal demand of different scenarios. The strategy considers the behavioral characteristics of multiple types of electric vehicles and establishes a daily economically optimal operation model for charging station dynamic objective tracking based on the results of optical storage capacity allocation, with the objective of maximizing the daily operating revenue of charging stations. Further, it analytically constructs energy balance constraints, storage system power, power and capacity constraints, and PV output constraints. Then, the economic operation model is transformed into a mixed-integer linear programming model by linearizing the objective function and solving it. The economics of the economically optimal operation strategy are verified by comparing the daily operating revenue of charging stations under different scenarios. The final results show that the economically optimal operation strategy can adapt to the economic operation requirements of charging stations under different scenarios and maximize the charging station revenue. This paper investigates the problem of the optimal allocation of light storage capacity and daily economic operation strategy for a typical charging station, which has certain practical significance and can provide a reference for charging station investment construction and operation mode.

Author Contributions

Conceptualization, K.H., J.Z. and X.S.; Funding acquisition, K.H.; Investigation, K.H., J.Z. and W.L.; Software, W.L.; Validation, S.Z.; Writing—original draft, K.H. and J.Z.; Writing—review and editing, K.H., X.S. and S.Z. All authors have read and agreed to the published version of the manuscript.

Funding

This research was funded by the water port-ship multi-energy integration technology and integrated application, grant number [2021YFB2601600].

Institutional Review Board Statement

Not applicable.

Informed Consent Statement

Not applicable.

Data Availability Statement

The raw data supporting the conclusions of this article will be made available by the authors, without undue reservation.

Conflicts of Interest

The authors declare no conflict of interest.

Appendix A

In this paper, the economic operation model is transformed into a mixed integer linear programming model for solving. The original model can be equated as follows.
max   C c b _ d a y P v C e l e ( t ) Δ t P v = t = 1 96 ( P e v ( t ) η e v ω ) s . t .   0 P b _ c ( t ) P b _ max     0 P b _ d ( t ) P b _ max     0 ω d ( t ) P b _ max     ω d ( t ) P b _ max l o _ d ( t )     ω d ( t ) P b _ d ( t )     ω d ( t ) P b _ d ( t ) P b _ max ( 1 l o _ d ( t ) )     0.1 S O C ( t ) 0.9     S O C ( t + 1 ) = S O C ( t ) + ( ω c ( t ) ω d ( t ) ) Δ t E b _ max
ω = ( ω c ( t ) η b _ c ω d ( t ) η b _ d ) P p v ( t ) s . t .   0 ω c ( t ) P b _ max     ω c ( t ) P b _ max l o _ c ( t )     ω c ( t ) P b _ max l o _ c ( t )     ω c ( t ) P b _ c ( t )     ω c ( t ) P b _ c ( t ) P b _ max ( 1 l o _ c ( t ) )
P p v ( t ) = P p v ( t ) η p v s . t .   P g r i d ( t ) + P p v ( t ) η p v     = P e v ( t ) η e v + ( ω c ( t ) η b _ c ω d ( t ) η b _ d )     0 P p v ( t ) < P p v _ max ( t )     0 P g r i d ( t )

References

  1. Sheik, M.S.; Titus, F.; Thanikanti, S.B. Charge Scheduling Optimization of Plug-In Electric Vehicle in a PV Powered Grid-Connected Charging Station Based on Day-Ahead Solar Energy Forecasting in Australia. Sustainability 2022, 14, 3498–3518. [Google Scholar]
  2. Wang, J.; Guo, C.; Yu, C. Virtual power plant containing electric vehicles scheduling strategies based on deep reinforcement learning. Electr. Power Syst. Res. 2022, 205, 107714. [Google Scholar] [CrossRef]
  3. Niu, M.T.; Liao, K.; Yang, J.W.; Xiang, Y.P. Multi-time scale load forecasting model for electric vehicles considering seasonal characteristics. Power System Protection and Control 2022, 50, 74–85. [Google Scholar]
  4. Liu, X. A new method to generate daily load scenario of electric vehicle charging station considering time correlation. Int. J. Emerg. Electr. Power Syst. 2020, 21, 20190252. [Google Scholar] [CrossRef]
  5. Zhao, J.; Meng, R.Q.; Wei, B.; Wang, L.; Han, X.Q. Economic dispatching strategy of DC microgrid considering the demand of electric vehicle users. Electr. Power Constr. 2021, 42, 39–47. [Google Scholar]
  6. Patil, H.; Kalkhambkar, V.N. Grid Integration of Electric Vehicles for Economic Benefits: A Review. J. Mod. Power Syst. Clean Energy 2021, 9, 13–26. [Google Scholar] [CrossRef]
  7. Li, Y. Multi-objective Optimal Operation of Centralized Battery Swap Charging System with Photovoltaic. J. Mod. Power Syst. Clean Energy 2022, 10, 149–162. [Google Scholar] [CrossRef]
  8. Qian, K.; Xie, Y.; Zhang, X. Fuzzy multi-objective optimization of electric vehicle charging network with considering stochastic characters of charging 1oad. Power Syst. Technol. 2020, 44, 44044414. [Google Scholar]
  9. Ma, X.F.; Li, Y.; Wang, H. Research on demand of charging piles based on stochastic simulation of EV trip chain. Trans. China Electrotech. Soc. 2017, 32, 190–202. [Google Scholar]
  10. Jain, A.; Gupta, K.K.; Jain, S.K. A V2G Enabled Bidirectional Single/Three-Phase EV Charging Interface Using Modular Multilevel Buck PFC Rectifier. Electronics 2022, 11, 1891. [Google Scholar] [CrossRef]
  11. Welzel, F.; Klinck, C.F.; Pohlmann, Y. Grid and user-optimized planning of charging processes of an electric vehicle fleet using a quantitative optimization model. Appl. Energy 2021, 290, 116717. [Google Scholar] [CrossRef]
  12. Sun, B. A multi-objective optimization model for fast electric vehicle charging stations with wind, PV power and energy storage. J. Clean. Prod. 2020, 288, 125564. [Google Scholar] [CrossRef]
  13. Li, R.H.; Hu, Z.C. Stochastic Optimization Strategy for Daily Operation of Electric Bus Charging Station With PV and Energy Storage. Power Syst. Technol. 2017, 41, 3772–3780. [Google Scholar]
  14. Wang, S.; Yang, X.; Lin, Q. Research on Multi-objective Planning of Active Distribution Network Considering Energy Storage Operation Strategy. In Proceedings of the 2019 IEEE Innovative Smart Grid Technologies-Asia, Chengdu, China, 21–24 May 2019. [Google Scholar]
  15. Hui, H.G.; Lian, Z.; Zhang, D. Orderly Charging Strategy Based on Optimal Time of Use Price Demand Response of Electric Vehicles in Distribution Network. Energies 2022, 15, 1869. [Google Scholar]
  16. Li, J.L.; Shi, Y.K.; Zhang, L.J.; Yang, X.C.; Wang, L.L.; Chen, X. Energy storage capacity optimization strategy of optical storage charging station considering orderly charging of electric vehicles. Power Syst. Prot. Control. 2021, 49, 94–102. [Google Scholar]
  17. Liu, X.Y.; Feng, T.Y. Energy-storage configuration for EV fast charging stations considering characteristics of charging load and wind-power fluctuation. Glob. Energy Interconnect. 2021, 4, 48–57. [Google Scholar] [CrossRef]
  18. Li, D.Q.; Zheng, J.Y.; Shi, M.M.; Li, T.R.; Hao, Y.; Liang, X.Y. Spatial and temporal distribution prediction of electric vehicle charging load. Power Eng. Technol. 2019, 38, 75–83. [Google Scholar]
  19. Aragón, G.; Werner-Kytl, O.; Gümrükcü, E. Stochastic optimization framework for online scheduling of an EV charging station in a residential place with photovoltaics and energy storage system. In Proceedings of the IEEE Milan PowerTech, Milan, Italy, 23–27 June 2019. [Google Scholar]
  20. Sarker, M.R.; Pandzic, H.; Sun, K. Optimal operation of aggregated electric vehicle charging stations coupled with energy storage. IET Gener. Transm. Distrib. 2018, 12, 1127–1136. [Google Scholar] [CrossRef]
  21. Zhang, Y.T.; Chen, Z.; Duan, R.; Huang, X.L. Electric vehicle charging station-distribution grid synergistic planning considering active response. Power Eng. Technol. 2019, 38, 71–77. [Google Scholar]
  22. Liu, W.; Shi, X.; Zhao, J.; Xue, Y. Electric Vehicle Charging Simulation Framework Considering Traffic, User, and Power Grid. J. Mod. Power Syst. Clean Energy 2021, 9, 602–611. [Google Scholar] [CrossRef]
  23. Zhang, M.X.; Sun, Q.J.; Yang, X. Electric vehicle charging load prediction considering multi-source information real-time interaction and user regret psychology. Power Syst. Technol. 2022, 46, 632–645. [Google Scholar]
  24. Behnam, R.; Mohammad, J.S.; Wang, J.; Gang, K. Optimal Day-Ahead Scheduling of a Smart Micro-Grid via a Probabilistic Model for Considering the Uncertainty of Electric Vehicles’ Load. Appl. Sci. 2019, 9, 4872. [Google Scholar]
  25. Jerome, J.M.; Jurjen, R.H.; Robert, H. Estimating the Charging Profile of Individual Charge Sessions of Electric Vehicles in The Netherlands. World Electr. Veh. J. 2018, 9, 17. [Google Scholar]
  26. Ma, Y.Z.; Ma, Z.X. Optimization and benefit analysis of orderly charging of electric vehicles based on game algorithm. Power Eng. Technol. 2021, 40, 10–16. [Google Scholar]
  27. Chandio, Y.; Mishra, A.; Seetharam, A. GridPeaks: Employing Distributed Energy Storage for Grid Peak Reduction. In Proceedings of the Tenth International Green and Sustainable Computing Conference, Alexandria, VA, USA, 21–24 October 2019. [Google Scholar]
  28. Hussain, A.; Bui, V.H.; Kim, H.M. Optimal Sizing of Battery Energy Storage System in a Fast EV Charging Station Considering Power Outages. IEEE Trans. Transp. Electrif. 2020, 6, 453–463. [Google Scholar] [CrossRef]
  29. Nizam, M.; Wicaksono, F. Design and Optimization of Solar, Wind, and Distributed Energy Resource (DER) Hybrid Power Plant for Electric Vehicle (EV) Charging Station in Rural Area. In Proceedings of the 2018 5th International Conference on Electric Vehicular Technology, Surakarta, Indonesia, 30–31 October 2018. [Google Scholar]
  30. Zheng, Z.; Yang, S. Particle Swarm Optimisation for Scheduling Electric Vehicles with Microgrids. In Proceedings of the 2020 IEEE Congress on Evolutionary Computation, Glasgow, UK, 19–24 July 2020. [Google Scholar]
  31. Wu, J.W.; Qiu, X.Y.; Pan, Y.J.; Xiao, L.K. Research on orderly charging strategy of electric vehicles based on improved chicken swarm algorith. Electr. Meas. Instrum. 2019, 56, 97–103. [Google Scholar]
  32. Tang, Y.W.; Gao, C.B. Research on optimal configuration of microgrid considering energy storage characteristics of electric vehicles. Sci. Technol. Innov. 2018, 20, 36–37. [Google Scholar]
  33. Gan, W.; Guo, J.B.; Li, X.J. Distributed energy storage optimization scheduling for multiple application requirements. Power Syst. Technol. 2019, 43, 1504–1511. [Google Scholar]
  34. Giambattista, G.; Giancarlo, S.G.; Fredy, R.; Juan, D.V.; Diego, P. A Virtual Sensor for Electric Vehicles’ State of Charge Estimation. Electronics 2020, 9, 278. [Google Scholar]
  35. Moschella, M.; Ferraro, P.; Crisostomi, E.; Shorten, R. Decentralized Assignment of Electric Vehicles at Charging Stations Based on Personalized Cost Functions and Distributed Ledger Technologies. IEEE Internet Things J. 2021, 8, 11112–11122. [Google Scholar] [CrossRef]
Figure 1. Dynamic correction method of electric vehicle charging target under peak-to-valley electricity price.
Electronics 11 03175 g001
Figure 2. Monte Carlo stochastic simulation flow.
Electronics 11 03175 g002
Figure 3. Monthly charging load curve for 140 electric vehicles.
Electronics 11 03175 g003
Figure 4. Number of EVs charged by moment on a typical day for 140 EVs.
Electronics 11 03175 g004
Figure 5. Flowchart of charging station daily load model construction.
Electronics 11 03175 g005
Figure 6. Load power, PV power, PV power consumption and optimal charge/discharge power curves for energy storage in Scenario I.
Electronics 11 03175 g006
Figure 7. Power curve of grid supply in Scenario I.
Electronics 11 03175 g007
Figure 8. Time-share tariff and SOC change curve of energy storage system in Scenario I.
Electronics 11 03175 g008
Figure 9. Load power, PV power, PV power consumption and optimal charge/discharge power curves for energy storage in Scenario II.
Electronics 11 03175 g009
Figure 10. Power curve of grid supply in scenario II.
Electronics 11 03175 g010
Figure 11. Time-sharing tariff and SOC change curve of energy storage system in Scenario II.
Electronics 11 03175 g011
Table 1. Comparison of electric vehicle parameters.
CategoryManufacturerVehicle NumberVehicle TypeBattery TypeBattery Capacity (kWh)Service Range (km)
Passenger CarsRongweiEi5Compact CarsSankyo52.5420
BYDQinpro500Compact CarsSankyo56.4420
GeelyDihao GseCompact CarsSankyo52353
CabsBYDe5Compact CarsSankyo51.2405
GeelyDihao EV500Compact CarsSankyo52400
Chang’anEaton EV460Compact CarsSankyo52.56405
BusesBYDK912 m passenger carLiFePO4324350
YutongE10i10.5 m passenger carLiFePO4300.8255
Xiamen Golden DragonXMQ610
5AGBEVL
10.5 m passenger carLiFePO4326.73330
Table 2. Comparison result analysis under two operation strategies.
Running StrategyCharging Revenue (RMB)Electricity Purchase Cost (RMB)Daily Running Revenue (RMB)Energy Storage Commutation Life (year)Charging Station Day Investment and O&M Costs (RMB)Charging Station Daily Net Income (RMB)
scenario ICapacity configuration operation policy7098.12917.44180.7151856.52324.2
Economic optimal operation strategy7098.12710.84387.37.121987.92399.4
scenario IICapacity configuration operation policy7189.81462.25727.66.981993.13734.5
Economic optimal operation strategy7189.81367.35822.56.871997.33825.2
Publisher’s Note: MDPI stays neutral with regard to jurisdictional claims in published maps and institutional affiliations.

