Article

Prediction of Bucket Fill Factor of Loader Based on Three-Dimensional Information of Material Surface

1
Department of Mechanical and Electrical Engineering, Xiamen University, Xiamen 361000, China
2
Shenzhen Research Institute, Xiamen University, Shenzhen 518057, China
*
Author to whom correspondence should be addressed.
Electronics 2022, 11(18), 2841; https://doi.org/10.3390/electronics11182841
Submission received: 9 August 2022 / Revised: 7 September 2022 / Accepted: 7 September 2022 / Published: 8 September 2022

Abstract

:
The bucket fill factor is a core evaluation indicator for the optimization of the loader’s autonomous shoveling operation. Accurately predicting the bucket fill factor of the loader after different excavation trajectories is fundamental for optimizing the loader’s efficiency and energy cost. Therefore, this paper proposes a method for predicting the bucket fill factor of the loader based on the three-dimensional information of the material surface. Firstly, the co-simulation model of loader shoveling material is established based on the multi-body dynamics software RecurDyn and the discrete element method software (DEMS) EDEM, and the co-simulation is conducted under different excavation trajectories. Then, the three-dimensional material surface information before shovel excavation is obtained from DEMS, and the surface function of the material contour is fitted based on the corresponding shovel excavation trajectory information. Meanwhile, the volume of the material excavated by the loader is obtained by the numerical integration method, and it is divided by the rated bucket volume to obtain the estimated bucket fill factor. Finally, the actual volume of the material after the shovel excavation is divided by the rated bucket volume to obtain the accurate bucket fill factor. Based on this, the prediction model of the bucket fill factor is built. The experimental results show that the proposed method is feasible, with a maximum error of 4.3%, a root mean square error of 0.025 and an average absolute error of 0.021. The research work lays the foundation for predicting the bucket fill factor of construction machinery such as loaders and excavators under real working conditions, which is conducive to promoting the development of autonomous, unmanned, and intelligent construction machinery.

1. Introduction

A loader is a piece of earth and stone construction machinery and equipment widely used in mining, construction, water conservancy, urban construction, among other contexts. Its main function is to shovel and transport bulk materials such as soil, sand, and gravel and complete engineering tasks such as bulldozing and lifting. It can not only reduce the labor intensity of construction personnel but also improve the construction speed and the project quality.
The related research on loaders can be divided into two major directions. The first is system control optimization, performance optimization of parts and components, electrification, etc., which are carried out to improve the economy of the loader, save energy, and protect the environment. Jun G et al. [1] proposed a new energy alternate recovery and utilization system to recover the potential energy generated in the lifting and lowering of excavators, Yang Y et al. [2] used an objective optimization algorithm to optimize the parameters of a new continuously variable transmission system for a loader to obtain better power transmission performance, and He X et al. [3] mentioned the importance of hybrid (HES) construction machinery to protect the environment and introduced the control strategies and challenges of hybrid construction machinery. The second is online fault diagnosis, intelligent shifting, vibration and noise reduction, etc., which are carried out to improve the intelligence of the loader and improve the operational efficiency, safety, and driver comfort of the loader. Chen Z et al. [4] extracted the signs of loader gear noise and made fault diagnosis of the loader gearbox based on ICA and SVM algorithms, Wu G [5] used a neural network approach to determine the complex mapping relationship between loader gears and the current operating conditions, which improved the shift response speed and shift quality, Zhao H et al. [6] optimized the parameters of the loader suspension to improve the driving comfort of the loader driver. Therefore, compared with the early loaders, the current loaders have been greatly improved in economy, safety, and comfort. In recent years, the electrification, intelligence, and unmanned operation of loaders have become a new research hotspot. Dadhich et al. [7] gave a detailed introduction to the prospects and challenges faced by the intelligent and unmanned construction machinery. when the loader is unmanned, the bucket fill factor becomes an important optimization objective of the autonomous excavation strategy of the loader, and its importance is self-evident. Therefore, this paper focuses on how to effectively predict the bucket fill factor of a loader.
Bucket fill factor prediction is a prerequisite for unmanned construction machinery and has attracted the attention of scholars. In recent years, Chen Yu et al. [8] proposed the SPC (Statistical Process Control) method to judge whether the test process of the loader bucket fill factor is stable and whether the test data are available. This method helps to ensure the validity of the loader bucket fill rate test data and correctly evaluate the bucket performance. Pengpeng Huang et al. [9] tried to mathematize the shoveling process to establish a mathematical model of the bucket fill factor of the loader during the shovel loading process. However, many idealistic assumptions were made during the study, so the applicability of the model is not good. Dadhich Set al. [7] mentioned in their previous work that the pressure in the loader cylinder can be used to represent the mass of the material in the bucket, but if the density information of the material to be excavated is unknown in advance, it is not possible to obtain the volume of the material in the bucket and the corresponding value of the bucket fill factor. To address this issue, Anwar H et al. [10] proposed to use a camera to photograph the bucket and estimate the volume of the material inside the bucket based on an image processing algorithm. However, the accuracy of the algorithm heavily depends on the bucket at the exact constraint position. Therefore, Guevara Jet al. [11] proposed to estimate the volume of the material in the bucket through segmentation, matching, and volume calculation based on the three-dimensional point cloud data of the material in the bucket. However, when the bucket full rate is high, this method cannot accurately extract the edge contour of the bucket, and the prediction error of the bucket fill factor increases up to 20%. Similarly, Lu J et al. [12] proposed to identify the bucket fill factor of a loader based on machine vision and bucket position information, but the method is not robust to environmental changes. Subsequently, Lu J et al. [13] proposed a neural-network-based method for predicting bucket fill factor, which relies on the classification of environmental factors to improve the robustness of the model to the environment. It is worth noting that all the previously mentioned methods for identifying bucket fill factor can only work after the loader has completed the shoveling action. R.J. Sandzimier R J et al. [14] used statistical methods to find the relationship between the excavator shovel trajectory and the bucket fill factor and tried to obtain the optimal excavator trajectory planning based on this. However, this method requires a lot of experimental data, and the experiment needs to be repeated when the size of the attachment changes. Filla R [
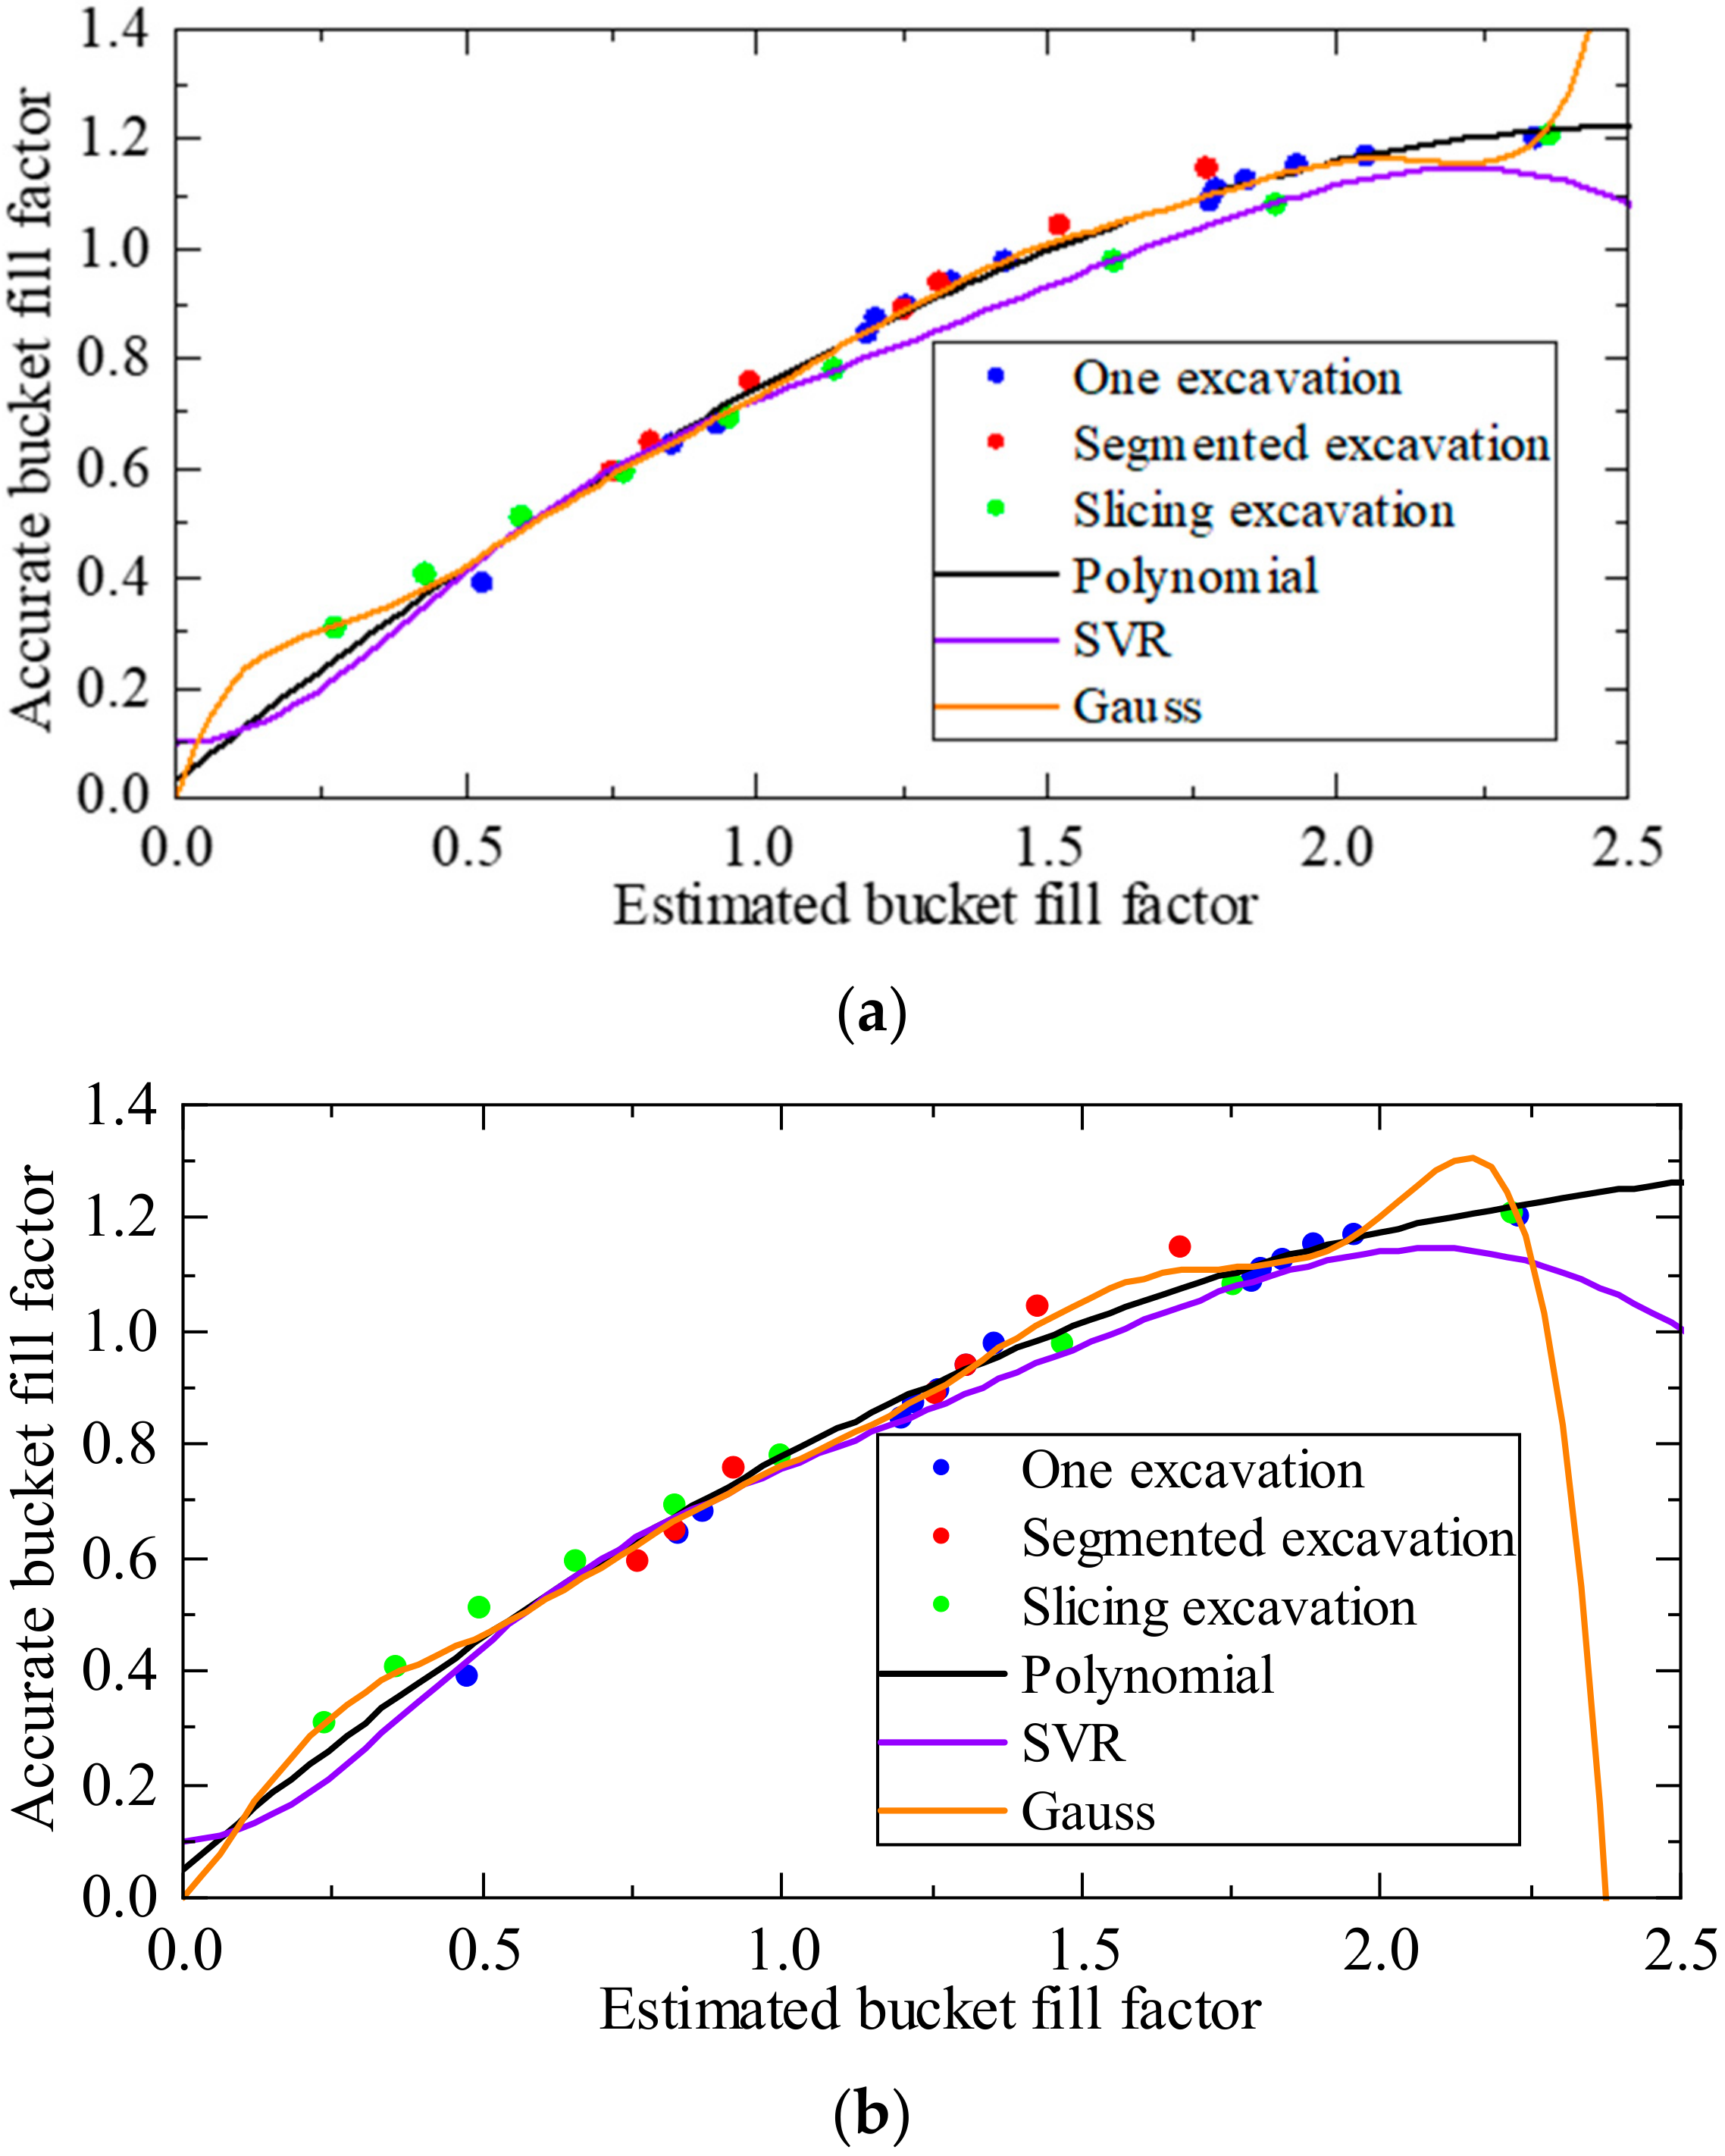
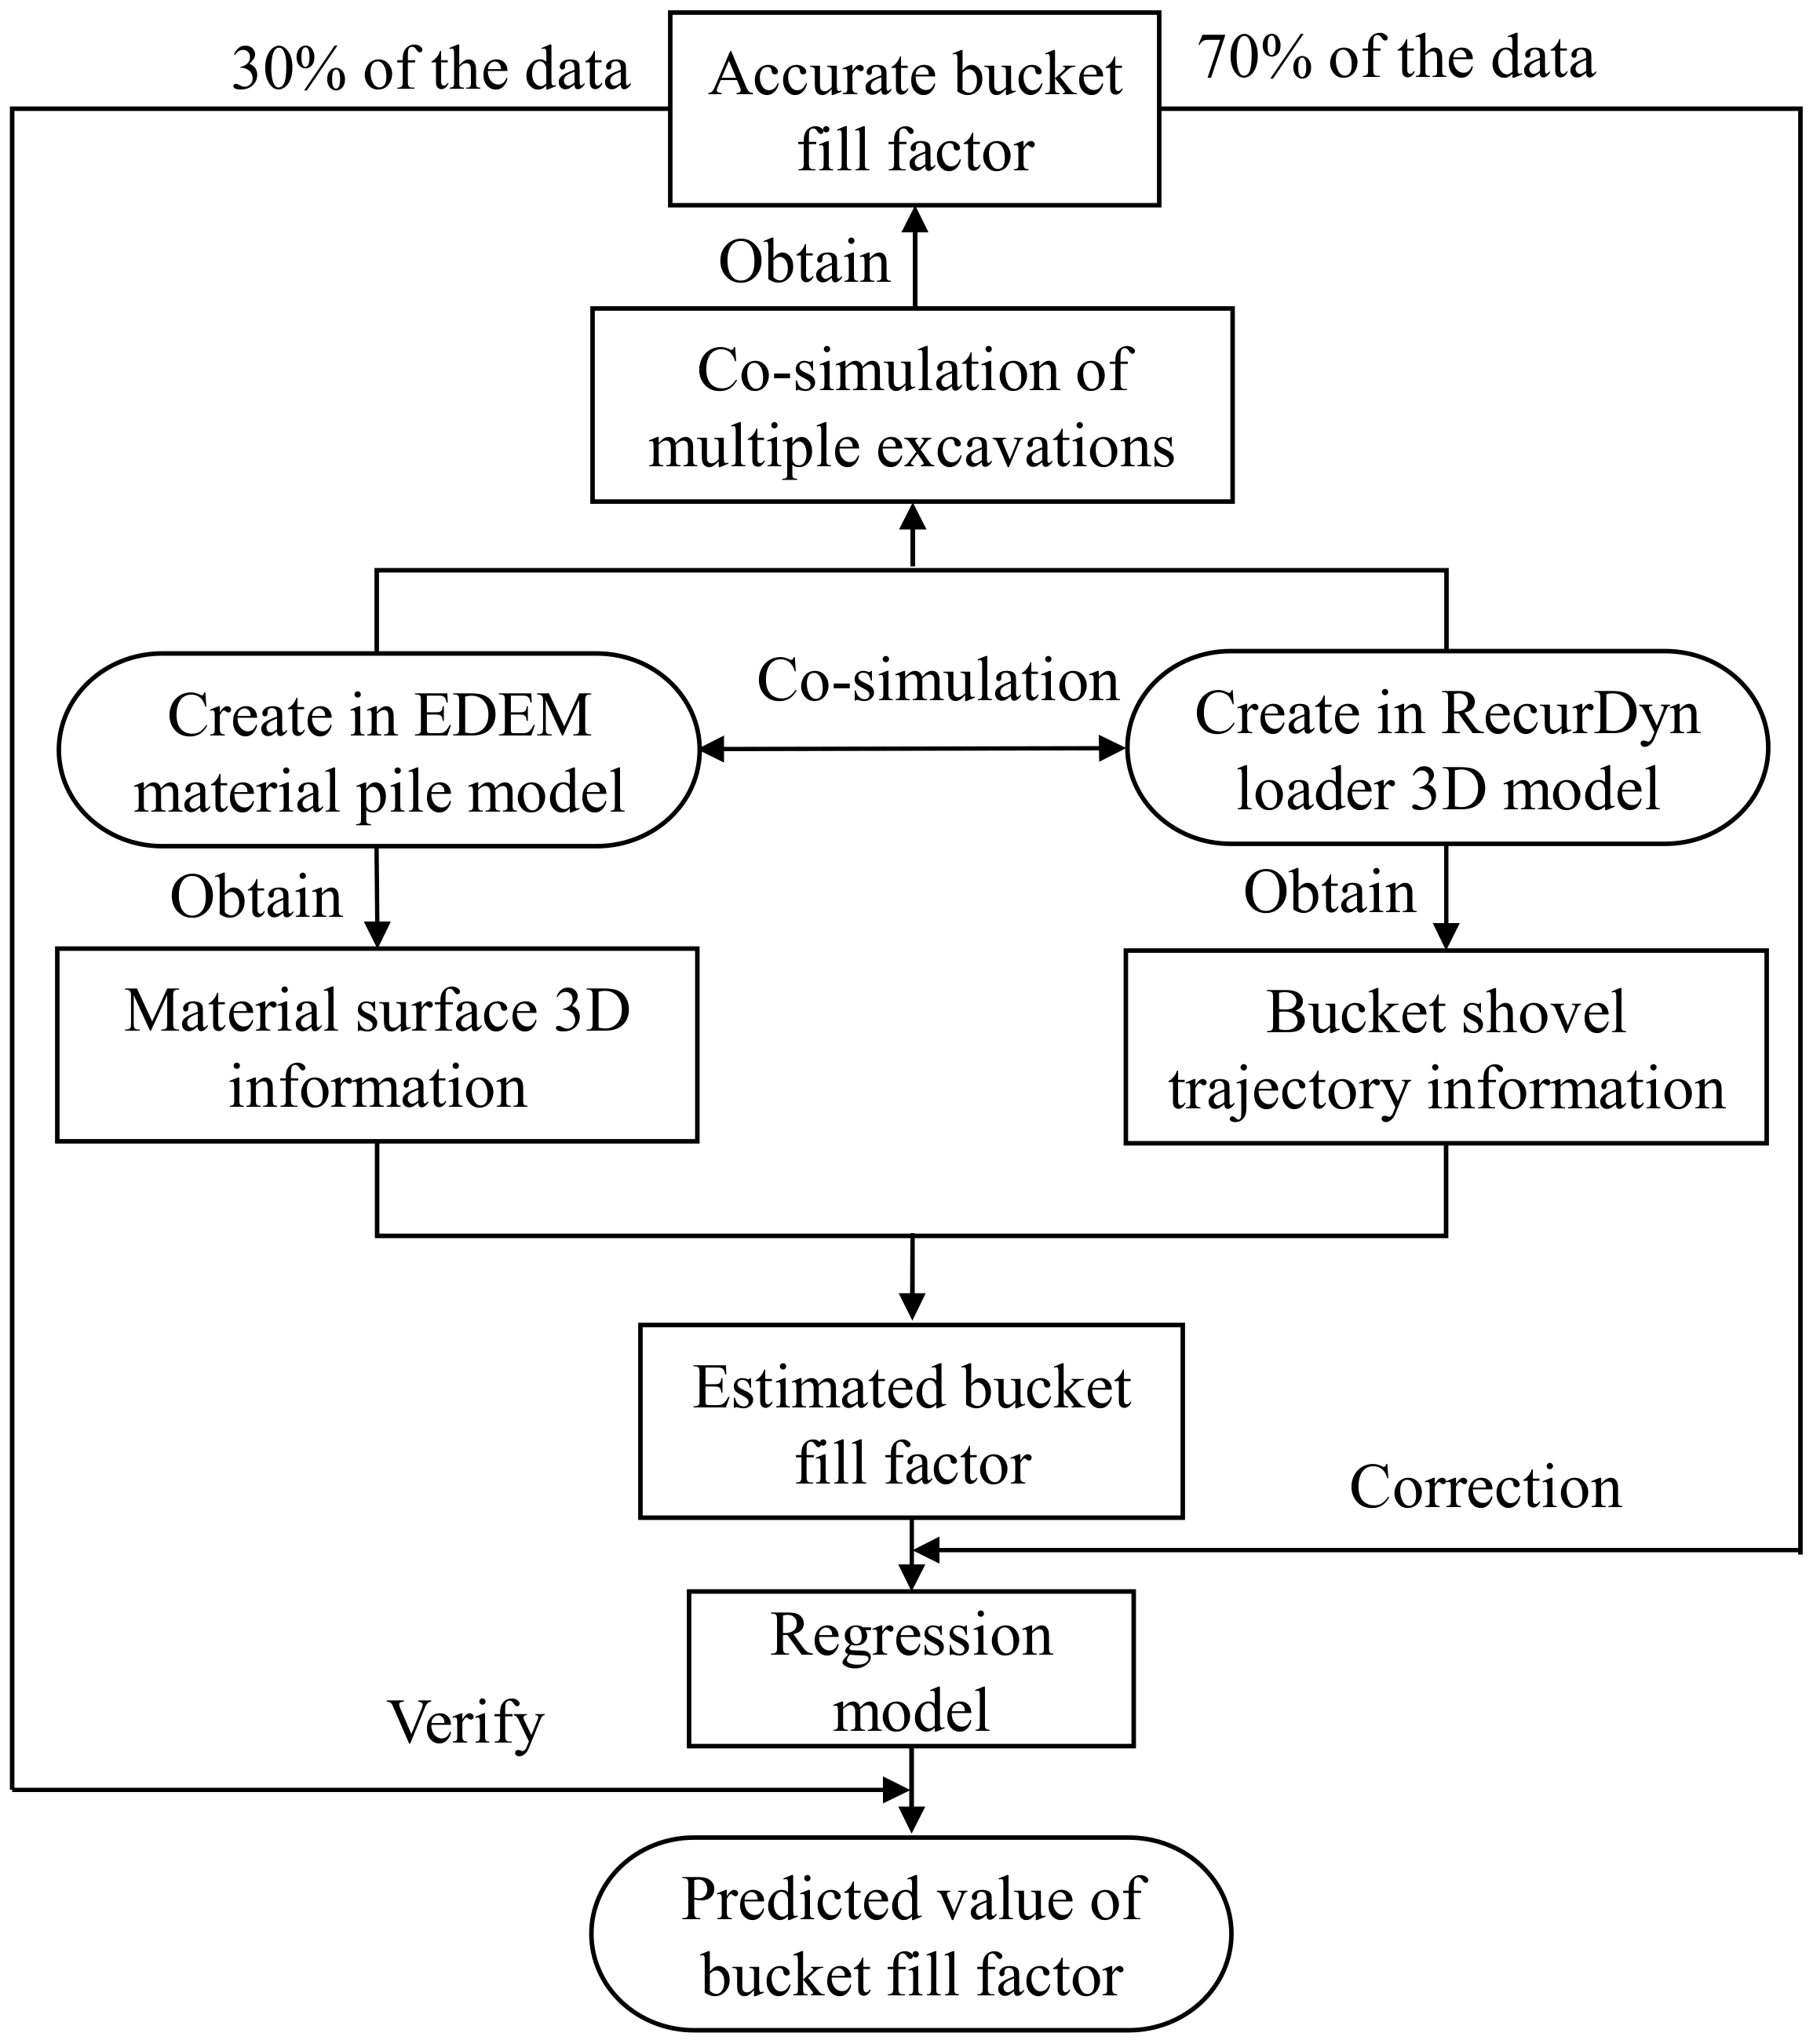
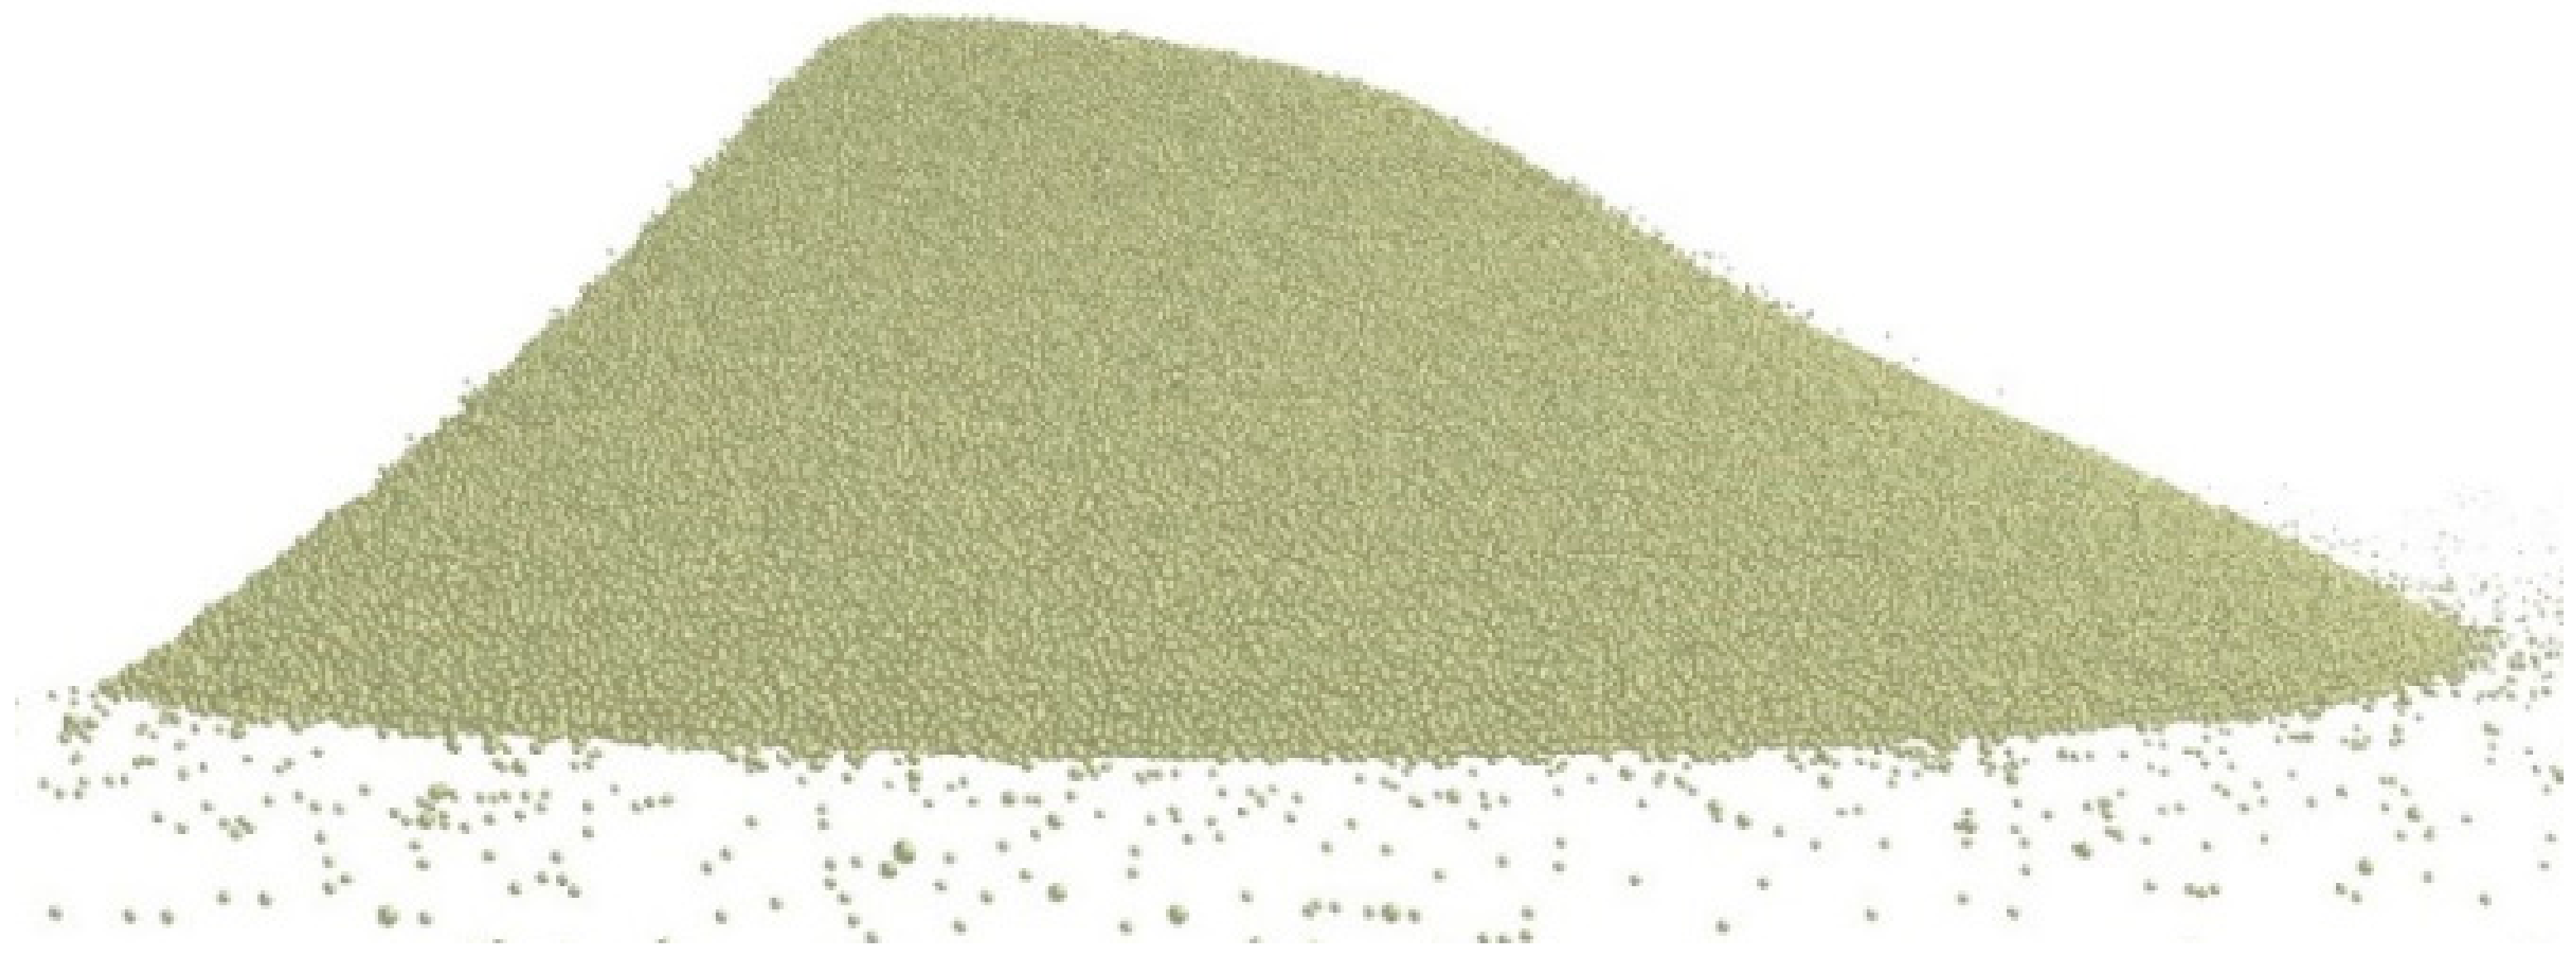
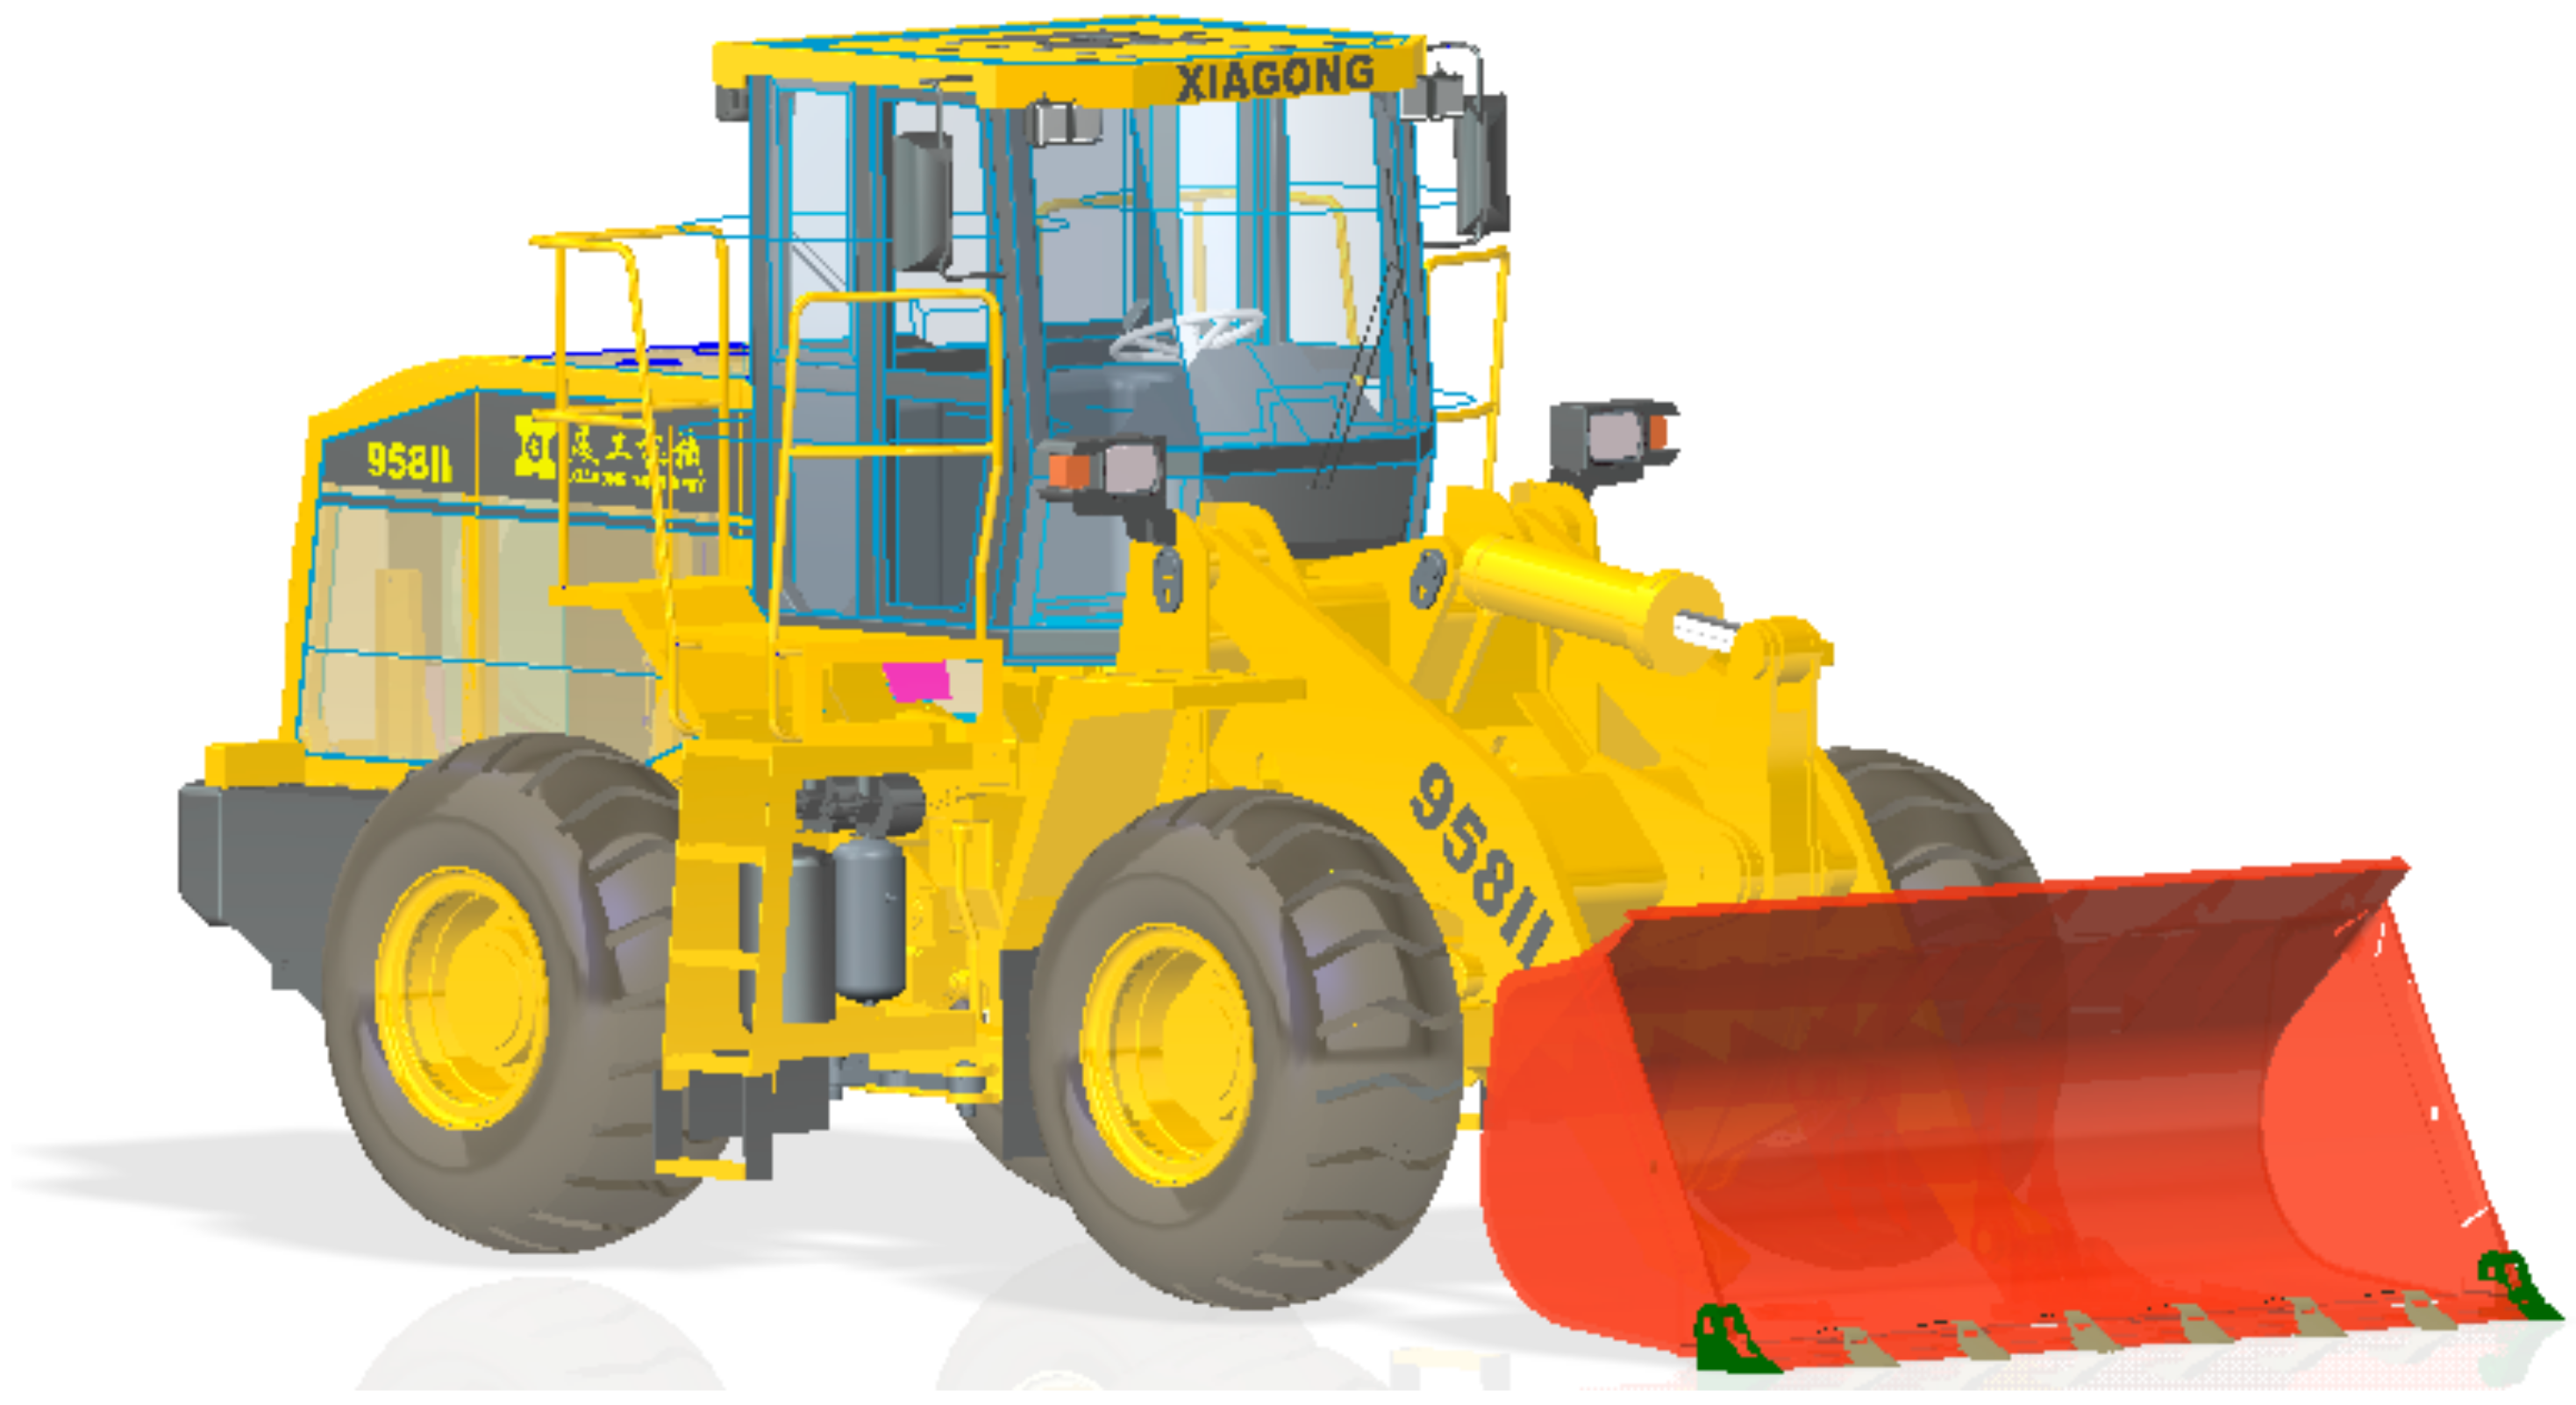
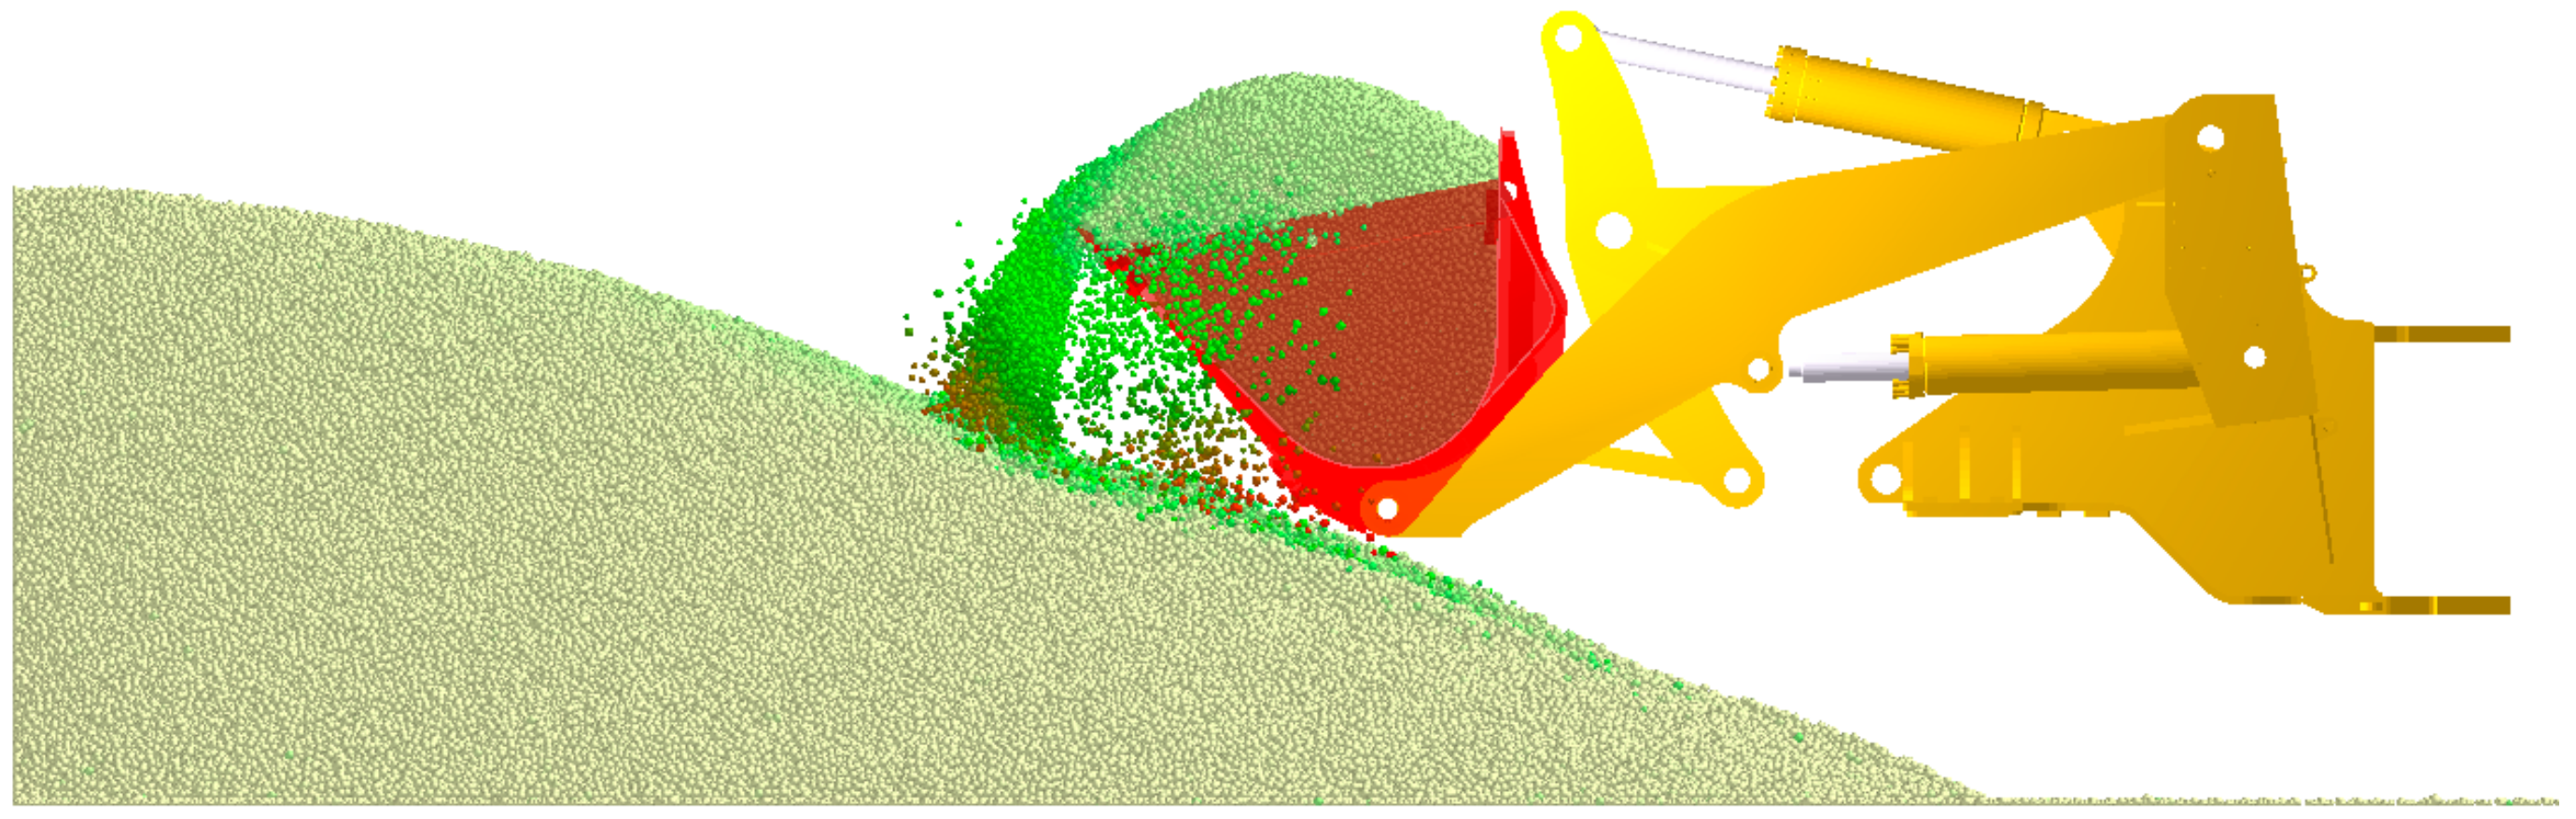
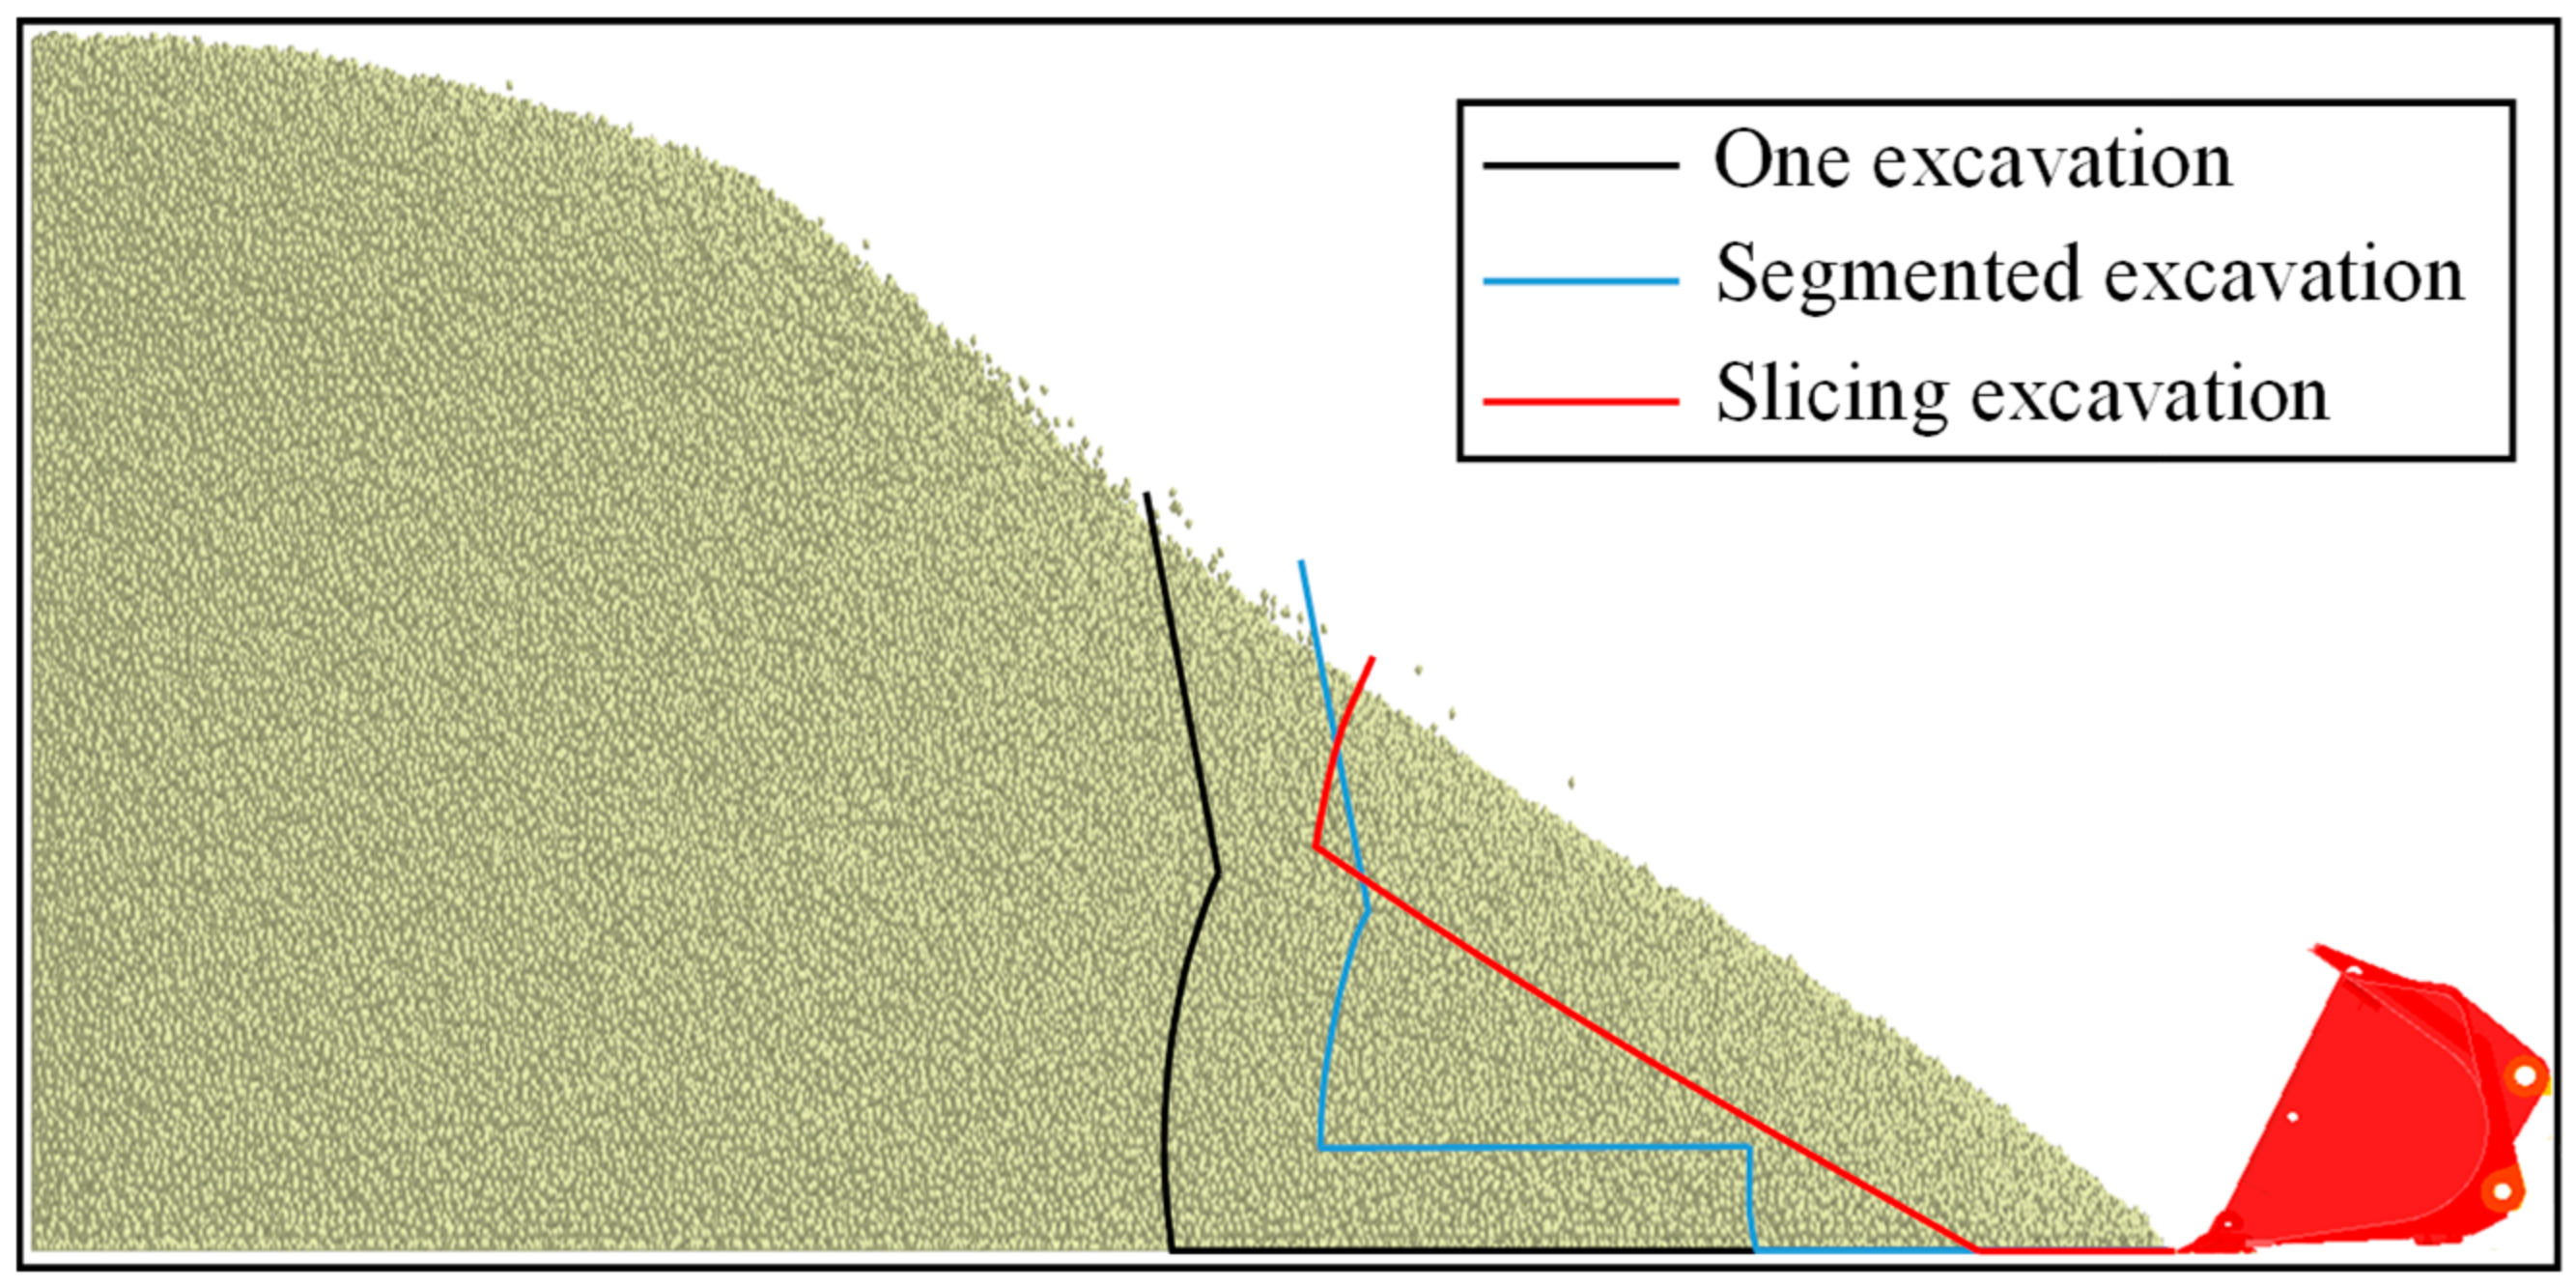
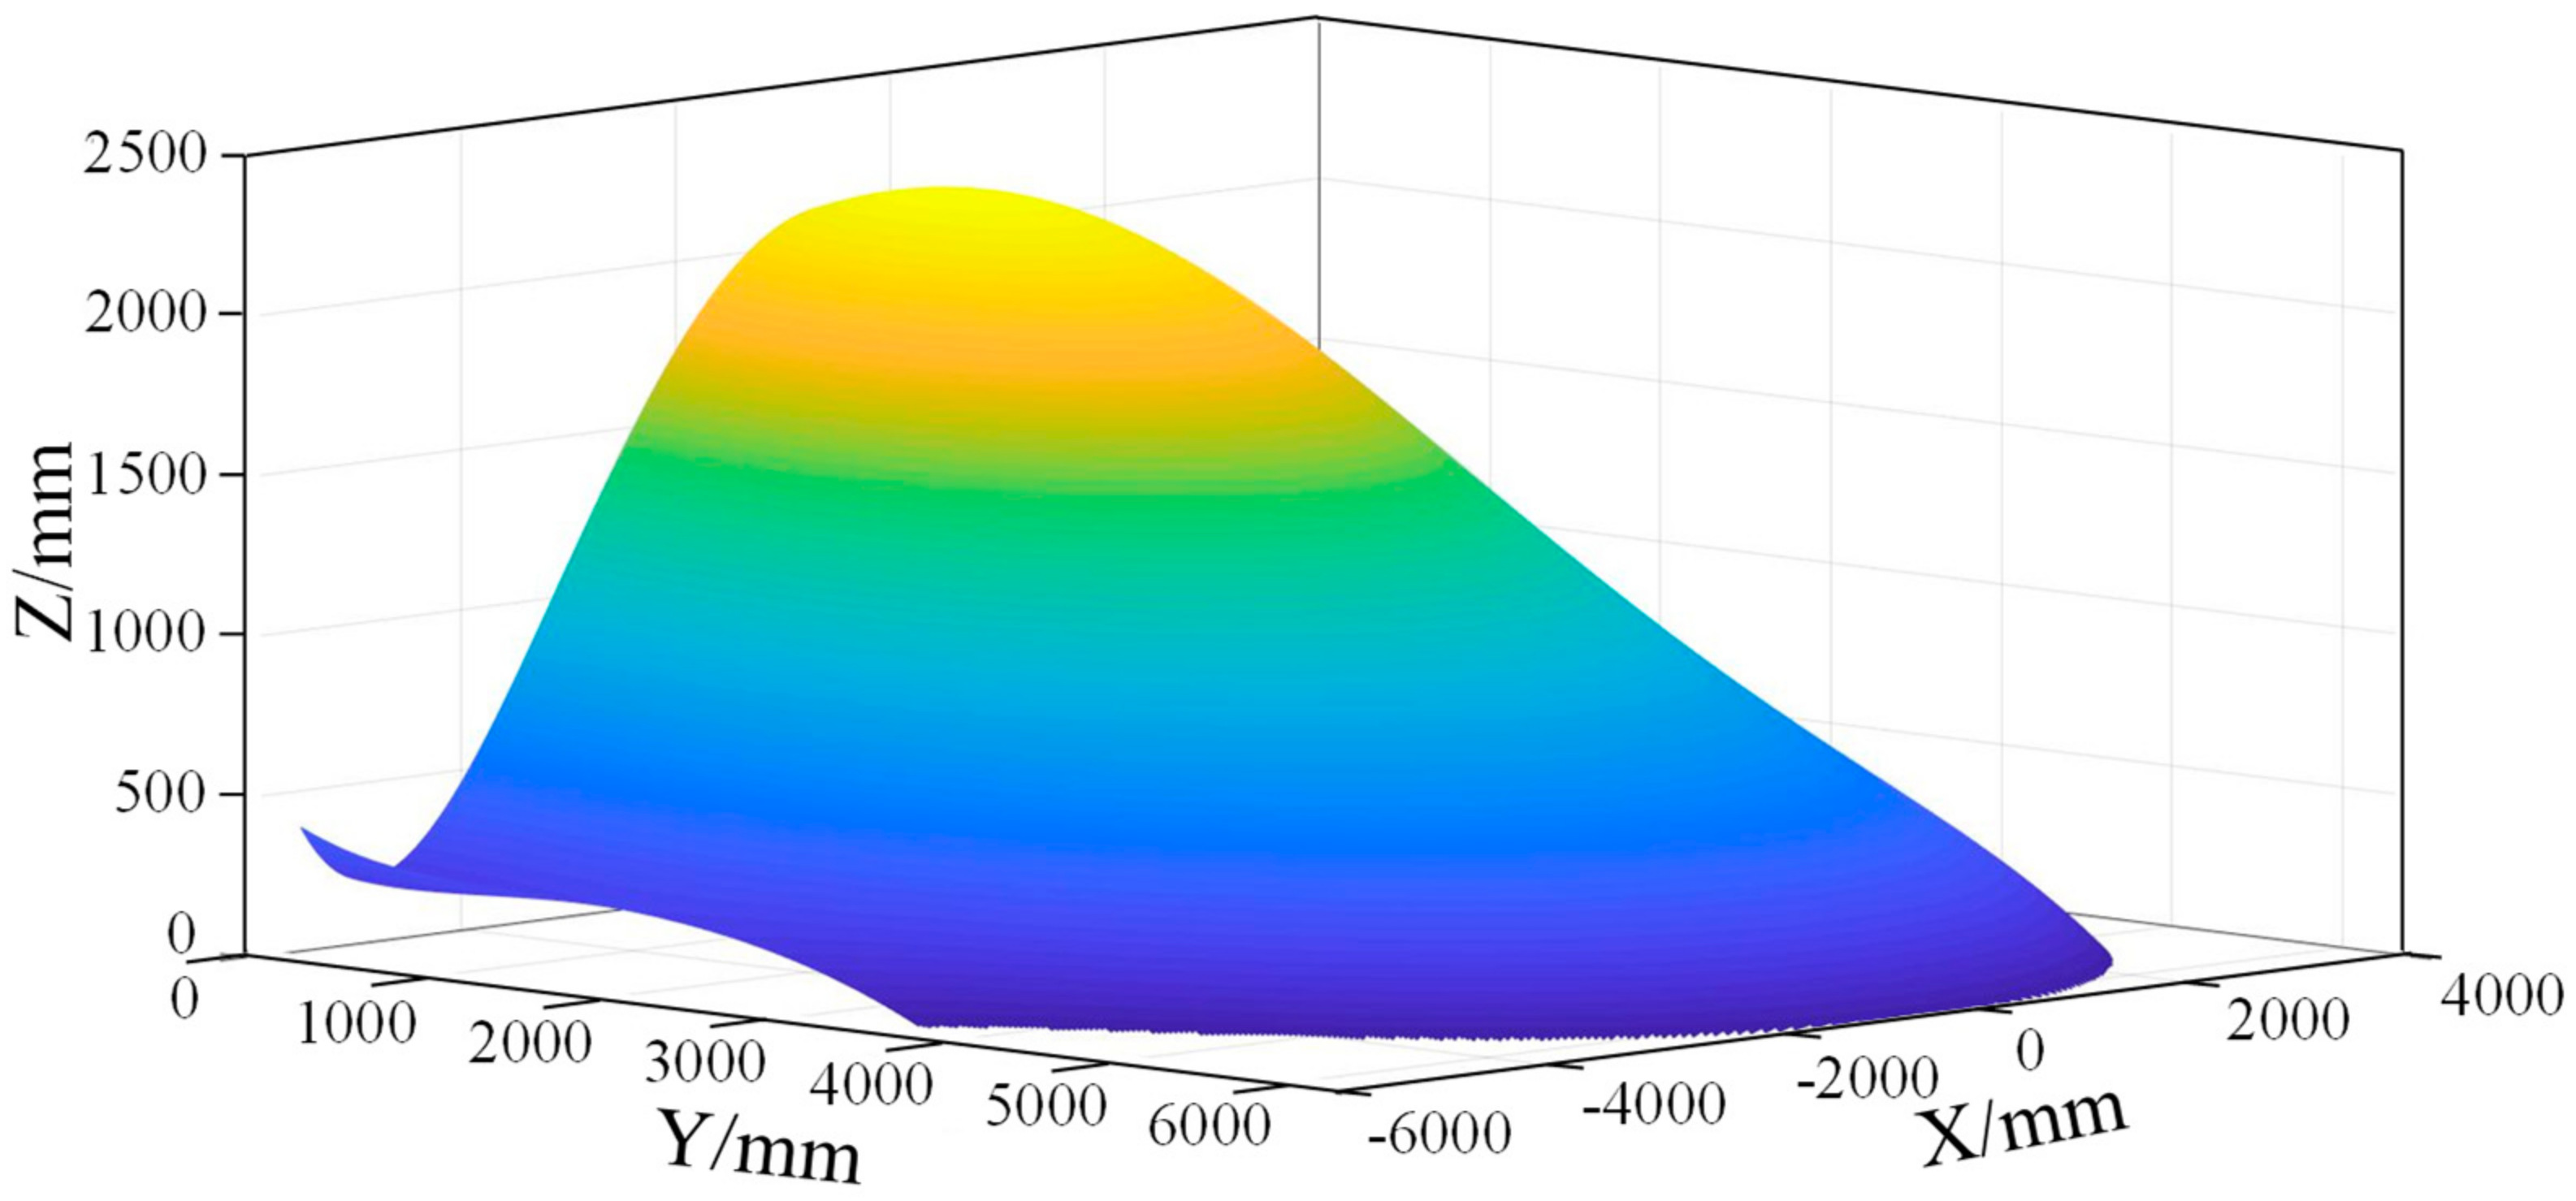
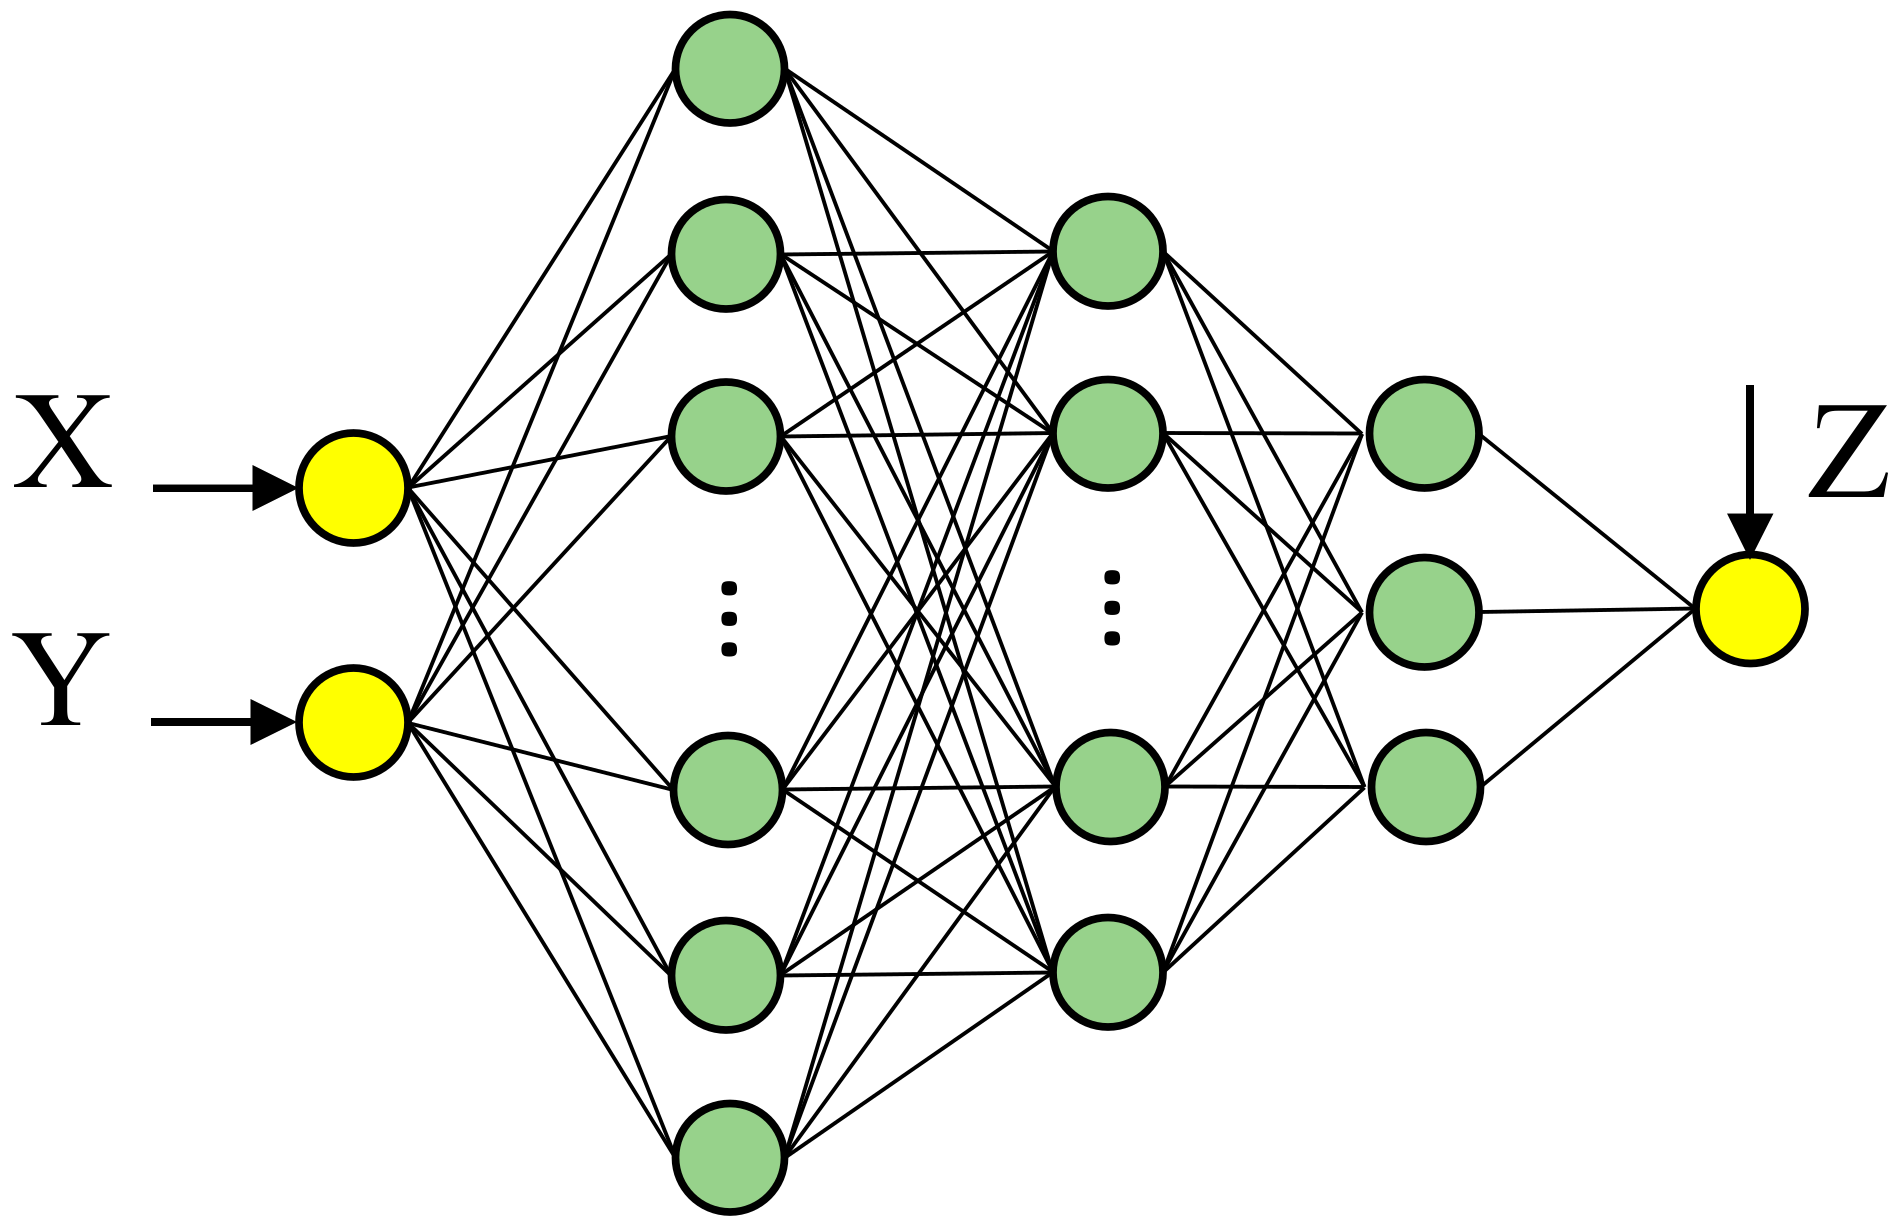
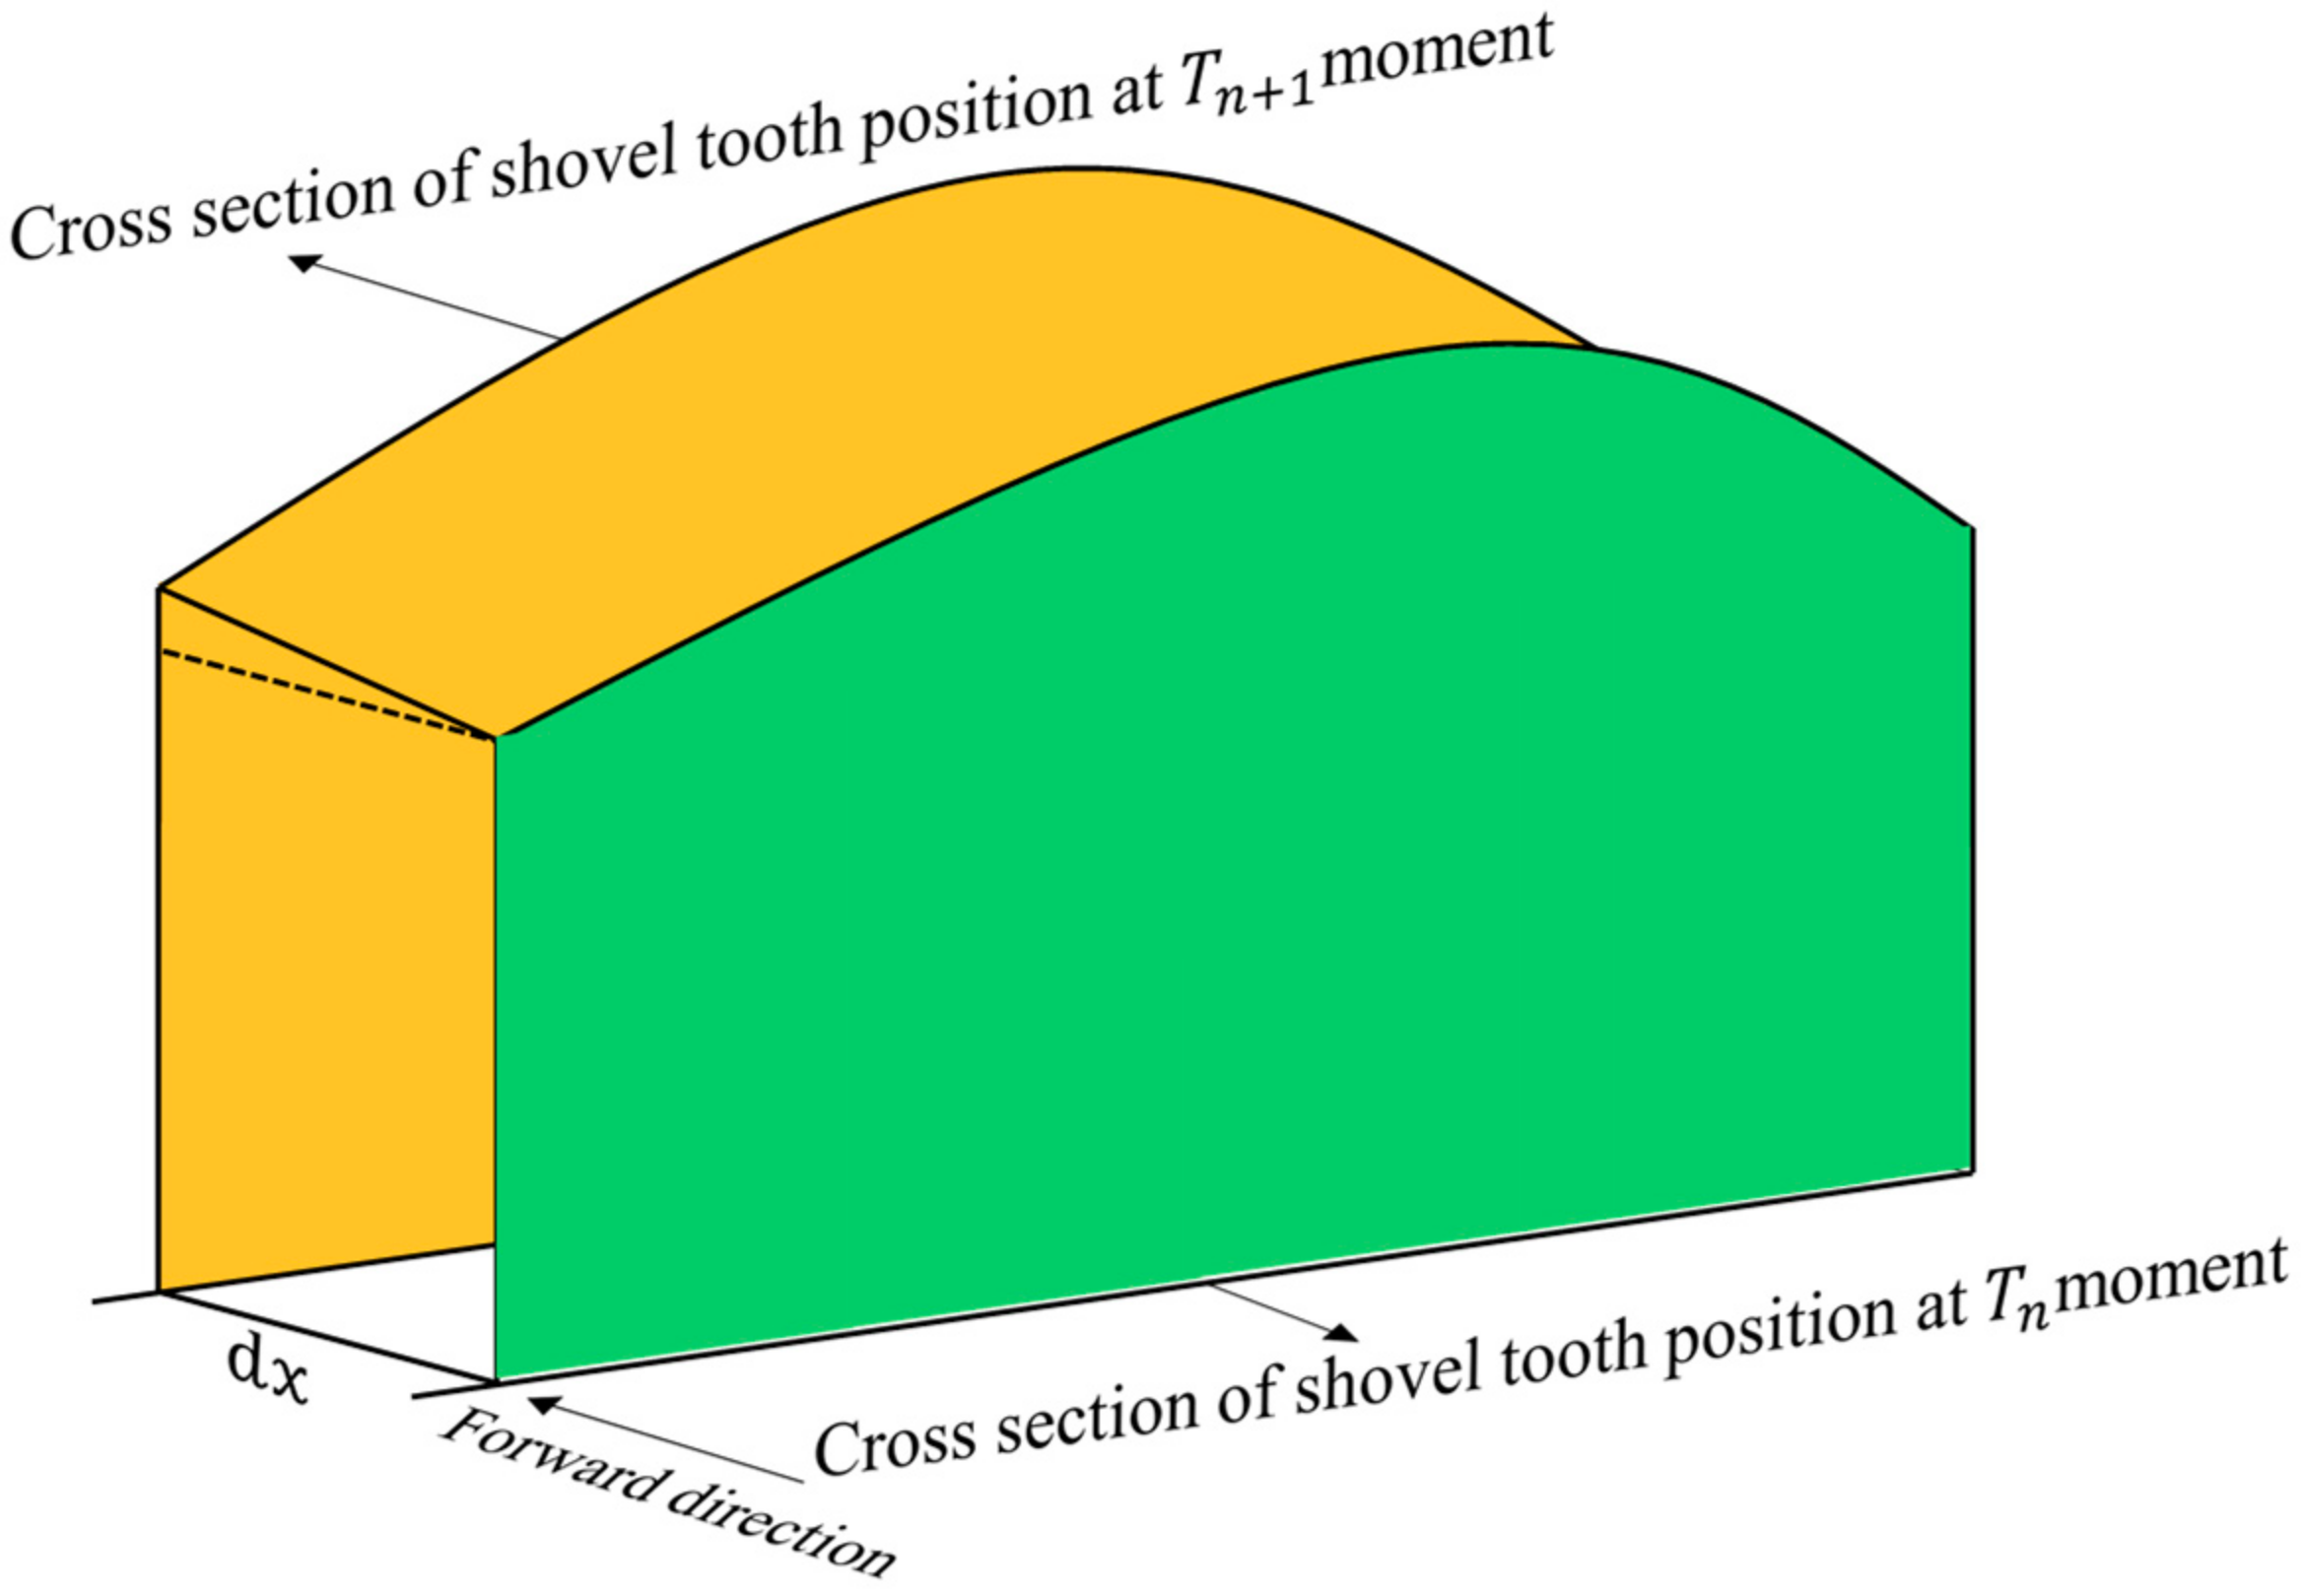
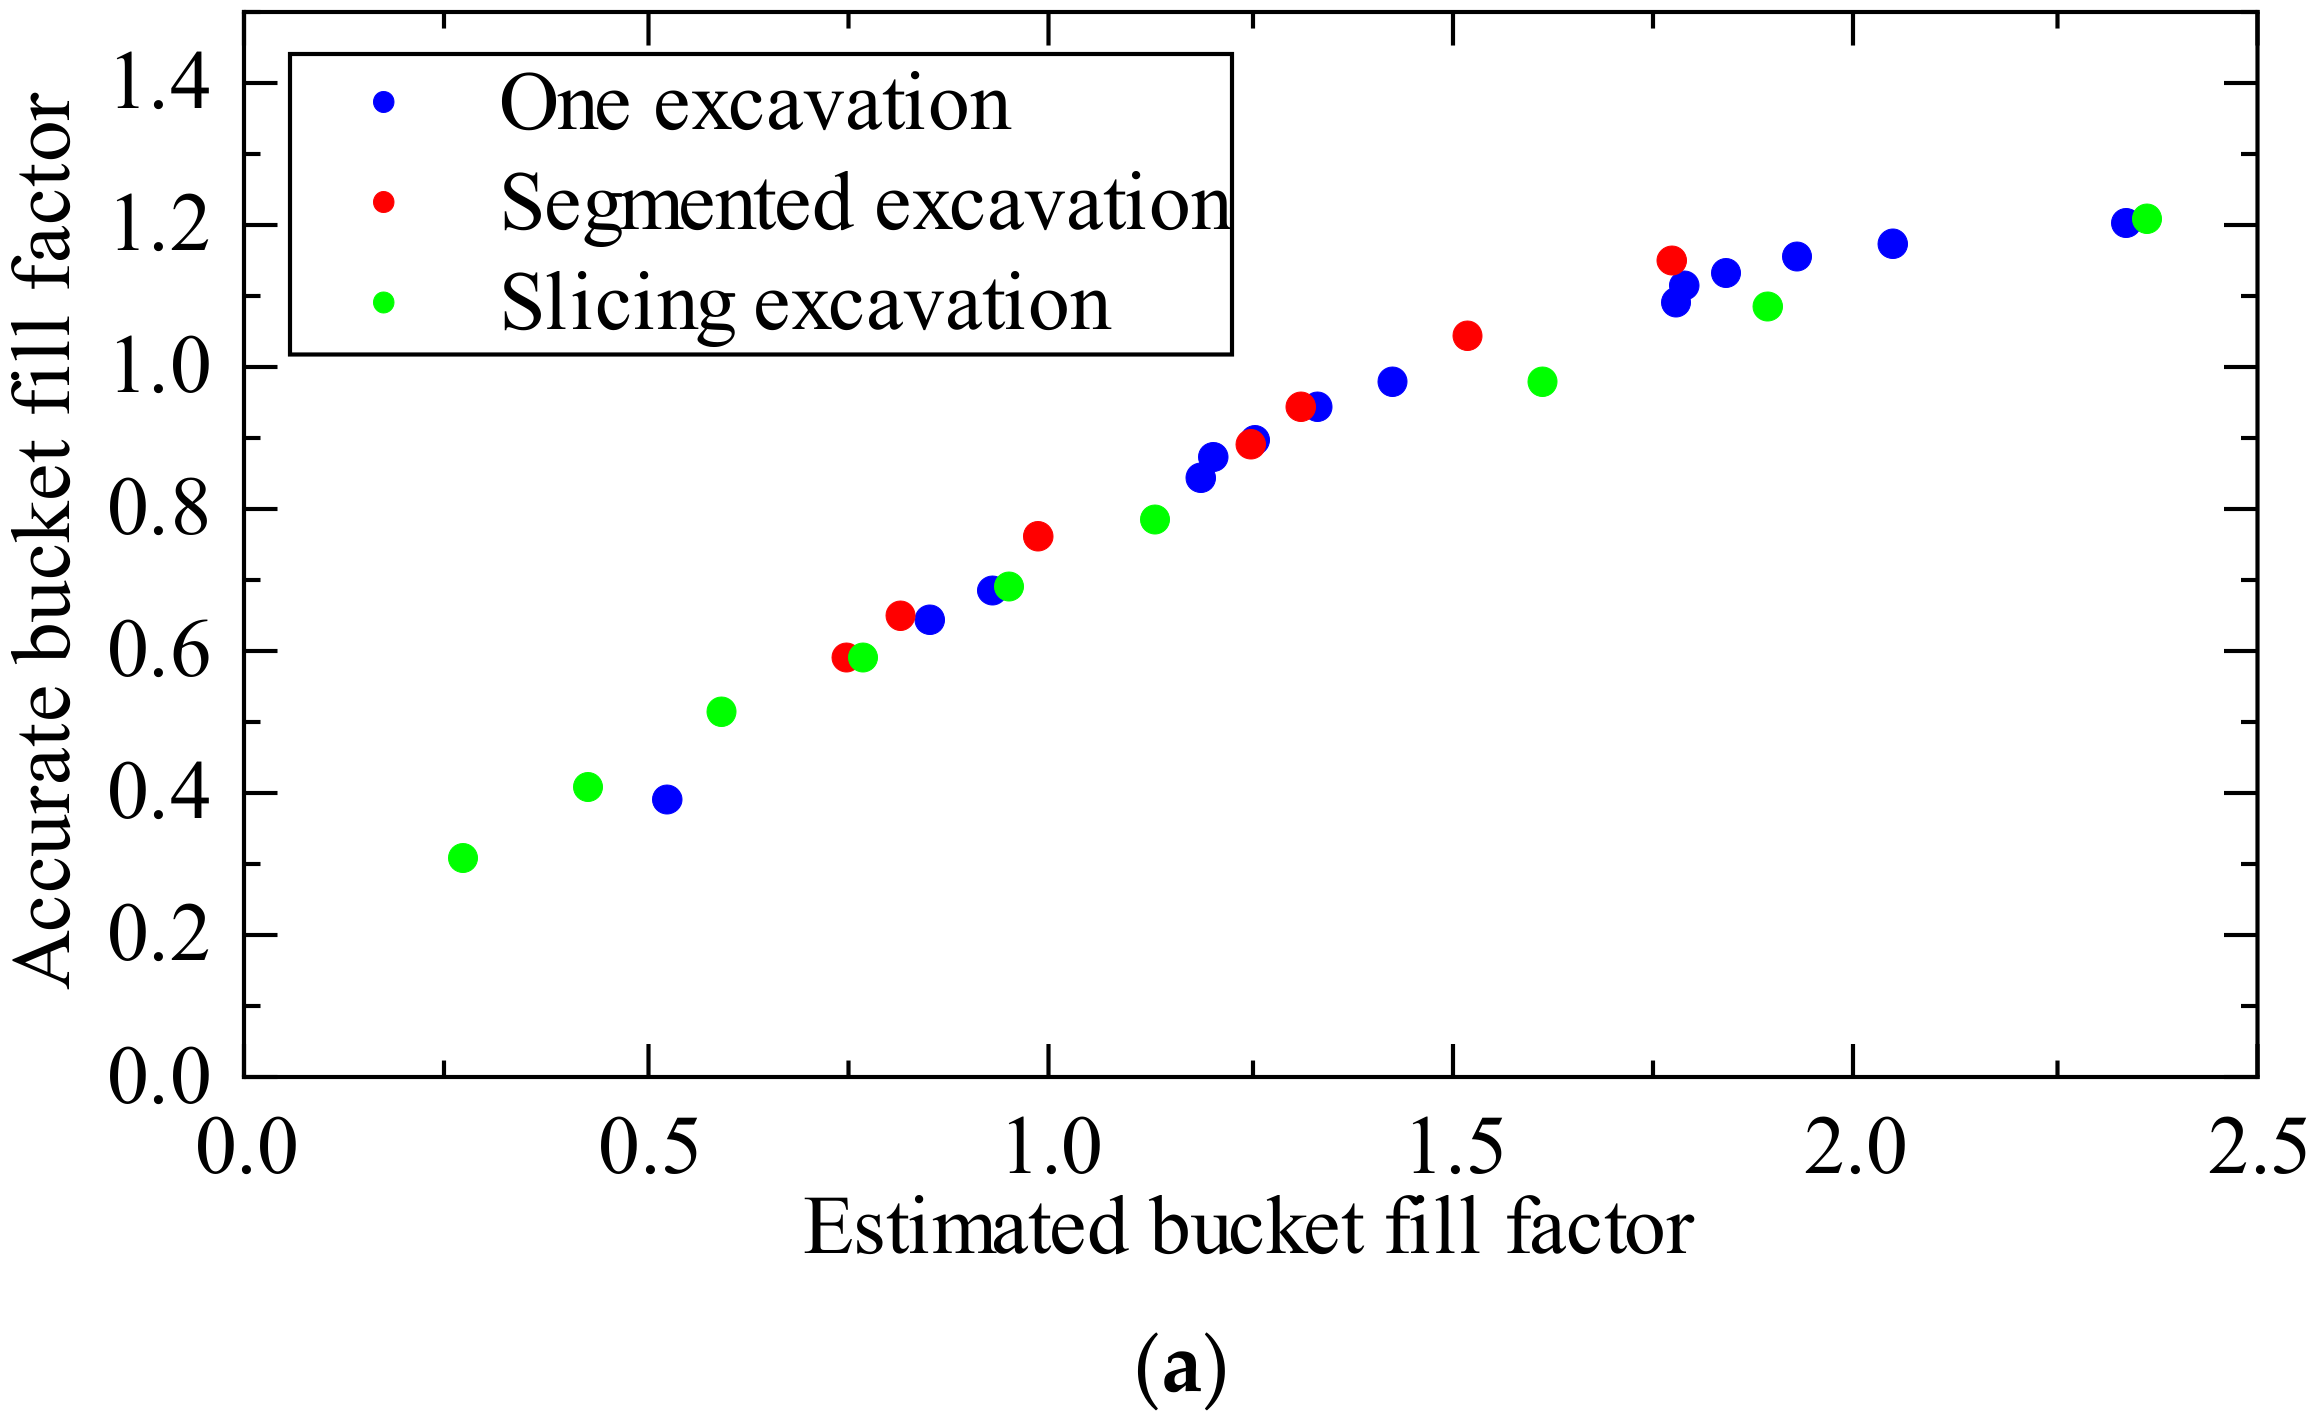
15] et al. simulated the material shoveling process with the EDEM software and summarized the shovel trajectory offset map for a specific bucket to obtain a certain bucket fill factor. However, the offset method proposed by the authors not only requires a large number of simulations but also cannot summarize well the relationship between the bucket fill factor and the shovel trajectory. From the above analysis, it can be seen that the predicted completion time of the bucket fill factor of the loader can be divided into after the completion of shoveling and before the completion of shoveling. Additionally, the prediction of bucket fill factor before shovel excavation completion is more suitable for the automation of the loader and is the focus of this paper. Based on the analysis of the existing studies, this paper proposes a method for predicting the bucket fill factor of loader based on the three-dimensional information of material surface. Our method can achieve accurate bucket fill factor prediction before excavation and provide technical support for optimizing the operation trajectory of the loader under autonomous excavation.
The rest of this paper is organized as follows. Section 2 describes the bucket fill factor prediction method proposed in this paper. Section 3 introduces the construction of the co-simulation model of shovel. Section 4 presents the implementation of the proposed bucket fill factor prediction method. Finally, Section 5 concludes the research work of this paper.

2. Prediction Method of Bucket Fill Factor

The bucket fill factor is an important optimization target for the loader under autonomous excavation. The research on the prediction method of the bucket fill factor of the loader helps to promote the development of unmanned loaders. Considering the complexity of the experimental process of the loader, the difficulty of obtaining the trajectory, and the high cost of the experiment, the multi-body dynamics software RecurDyn and the discrete element software EDEM can reproduce the complete material shoveling process. Therefore, to verify the feasibility of the proposed bucket fill factor prediction method, the method will be tested in a virtual simulation environment, and the specific flow chart is shown in Figure 1. Firstly, the three-dimensional virtual model of the loader is created in RecurDyn and the material pile model is created in DEMS. Then, the RecurDyn and DEMS software is used to perform co-simulation of multiple shovel trajectories. Next, the material volume in the bucket after the loader digging is completed is divided by the volume of the bucket to obtain the accurate bucket fill factor; meanwhile, the shovel trajectory and the three-dimensional surface of the material pile are obtained for each shovel excavation process. Based on this, the volume between the shoveled path and the material surface profile is integrated to obtain the estimated bucket fill factor. Finally, the regression analysis method is used to find and verify the mapping relationship between the estimated bucket fill factor and the accurate bucket fill factor obtained in the simulation.

3. Co-Simulation of Loader Excavation Process Based on EDEM and RecurDyn

In order to carry out the co-simulation of the loader excavation process, firstly, the material pile model is created in the DEMS, secondly, the loader model is constructed in the multi-body dynamics software, and, finally, the co-simulation of the loader excavation process is carried out.

3.1. The Stockpile Model

The working conditions of the loader are complex, and the operation objects are mainly loose granular materials, such as sand, cinder, loose soil, and gravel [16]. Therefore, in this paper, a typical material such as sand is selected as the operation object to build a sandpile model based on DEMS, and the model is finally used as the material pile model to simulate the shoveling process of the loader. It is worth mentioning that DEMS divides the whole simulation time into several small time steps and then calculates and updates the motion state of all the material particles in each time step. Therefore, a too-large material pile will directly affect the subsequent simulation time and data storage, and a too-small material pile cannot reflect the real shoveling process [17]. In summary, the sandpile model constructed in this paper has a base radius of about 6 m and a height of about 2.3 m, as shown in Figure 2. The material pile was created on a workstation equipped with Intel Xeon Silver 4210 CPU (20 cores, 2.19 GHz), 128 GB main memory, and NVIDIA Quadro P620 and running Windows 10 operating system. The creation process takes about two weeks. To build a larger pile of material, it is recommended to build the material on an inclined slope to reduce the number of particles and the simulation calculation overhead. This is because the innermost layer of material does not affect the simulation of the entire shovel excavation, but it increases the calculation time.
The intrinsic and contact parameters [18] of the sand are shown in Table 1. Meanwhile, to reflect the phenomenon that the particle size of sand varies in practice, the particle size distribution of sand is set in EDEM as follows: 1 mm (30%), 1.5 mm (40%), and 2 mm (30%).

3.2. The Loader Model

In this paper, a 958 N loader is selected as the research object. It is also feasible to select the other models of loader, and the three-dimensional virtual model of the loader is established with the multi-body dynamics software RecurDyn, as shown in Figure 3. The main performance parameters of the loader are listed in Table 2.
During the shoveling process of the loader, the movement of the bucket is subject to the joint action of three factors: the movement direction of the loader, the expansion and contraction of the turning bucket cylinder, and the expansion and contraction of the lifting cylinder. Therefore, after constructing the three-dimensional virtual model of the loader with RecurDyn, it is necessary to add motion driving functions for the forward movement of the loader, the telescoping of the bucket cylinder, and the telescoping of the lifting cylinder to simulate the shoveling action of the loader. The above-mentioned three types of motion can be performed using the step-driven function [19] with the following expressions.
step ( t , t 0 , x 0 , t 1 , x 1 ) = x 0 x 0 + ( x 1 x 0 ) ( t t 0 t 1 t 0 ) 2 [ 3 2 ( t t 0 ) ( t 1 t 0 ) ] x 1    t t 0 t 0 t t 1 t 0 t t 1
In Equation (1), t is the time; t0 is the start time of the motion; t1 is the end time of the motion; x0 is the initial position of the motion, and x1 is the end position of the motion.

3.3. Co-Simulation of Loader Shovel Excavation Process

After the sandpile model and the three-dimensional virtual model of the loader are created, the co-simulation of the excavation process of the loader can be conducted. First, the WALL file containing the three-dimensional model information that can be recognized by DEMS is exported from RecurDyn. Then, the WALL file is loaded into the DEMS, and the two pieces of software exchange data through the data interface file. During the co-simulation process, RecurDyn controls the shovel movement of the loader and calculates and updates the position, velocity, and other motion states of the loader at each time point; meanwhile, DEMS calculates and updates the motion states of all material particles at each time point, and it feedbacks the forces generated by the interaction between the material and the bucket to RecurDyn [20]. The two together simulate the process of the loader shoveling the material. The schematic diagram of the co-simulation is shown in Figure 4.
In the actual operation of the loader, the loader can use different shoveling methods according to the material density, particle size, and the variability of the driver’s operating proficiency. The three common shovel excavation methods [19] are shown in Figure 5, i.e., one excavation, segmental excavation, and slicing excavation. Considering the huge calculation overhead of the simulation, only the first half of the loader model can be imported into DEMS, and the shoveling time of each trajectory is within 5 to 6.5 s depending on the shoveling depth and shoveling method. Even in this case, the simulation of each shoveling trajectory still took about 2 days, and the volume of the data generated by the simulation was about 1.5 TB. Therefore, to save time and storage space, a total of 30 simulations of the shoveling process was carried out for the three shoveling methods in this paper. Meanwhile, to ensure the validity of the method, the accurate bucket fill factor values obtained for all three shoveling methods were in the range of 60% to 110%, thus ensuring a reasonable distribution of samples.

4. Prediction of Bucket Fill Factor

4.1. Calculation of the Accurate Bucket Fill Factor

As shown in Equation (2), the bucket fill factor is defined as the ratio η of the volume V m of the material shoveled into the bucket to the rated bucket volume V b .
η = V m V b
where η is the bucket fill factor, and V m is the volume of the material in the bucket. According to the performance parameters listed in Table 2, the rated bucket volume V b is 2.4 m3.
The forces on a bucket after a shovel excavation are shown in Figure 6. It can be seen that the resultant force on the bucket at the last moment is equal in magnitude to that on the bucket in the vertical direction.
This means that the bucket at the last moment is only subject to the gravity of the material in the bucket. Based on this, it is possible to calculate the volume of the material in the bucket at the end of each excavation according to Equation (3), and then the bucket fill factor can be calculated by substituting into Equation (2).
V m = F g ρ m
where F is the magnitude of the resultant force on the bucket at the last moment, g is the acceleration of gravity, and ρ m is the bulk density of the material.

4.2. Calculation of the Estimated Bucket Fill Factor

4.2.1. Acquisition of Three-Dimensional Information on the Material Surface

The three-dimensional coordinates (X, Y, Z) of the particles on the surface of the pile can be derived from the DEMS simulation results. Based on the three-dimensional coordinates of the particles on the surface of the pile, the three-dimensional surface information of the pile can be expressed by surface fitting or neural network fitting.
First, the polynomial function shown in Equation (4) is used to perform surface fitting, and the fitting result is shown in Figure 7. In practical applications, lidar, binocular camera, or depth camera [11] can be used to obtain the three-dimensional point cloud data of the material pile surface, and surface fitting can be performed on this point cloud data to obtain the three-dimensional surface information of the material pile.
f ( x , y ) = a 0 0 + a 10 x + a 20 x 2 + a n 0 x n + a 11 x y + a 21 x 2 y a n 1 x n y + + a n 1 x n y + + a n n x n y n
Then, considering the good data fitting ability of the neural network, the relationship between X, Y, and Z is established by building the neural network shown in Figure 8. Therefore, the three-dimensional information of the surface of the material pile can be expressed by the constructed neural network.
Finally, according to Equations (5) and (6), the coefficient of determination R2 and root mean square error RMSE of the fitting results obtained by the above two methods are calculated, and the results are shown in Table 3. The results show that both methods can well express the three-dimensional surface information of the material pile.
R 2 = 1 i = 1 n z i z ^ i 2 i = 1 n z i z ^ 2
R M S E = i = 1 n z i z ^ i 2 n
where z i represents the true value, z ^ represents the mean value of the true value, and z ^ i represents the predicted value.

4.2.2. Volume Integration Based on Shovel Trajectory and Material Surface Information

After the three-dimensional information of the material surface is obtained, the information of bucket excavation trajectory can be obtained directly from RecurDyn. Then, based on the three-dimensional surface information of the material and the excavation trajectory information, the material volume between the excavation trajectory and the material surface contour can be integrated, and the integration area is shown in Figure 9.
An integral unit in the shoveling process is shown in Figure 10. The integral unit at different times is slightly different. The process of integrating the material volume is as follows. Firstly, all the integration units between the shovel tooth position section at T n and the shovel tooth position section at T n + 1 of the loader are summed up. Then, the material volume under the corresponding shovel trajectory is obtained, as shown in Equation (7).
V = f ( x , y ) d x d y
where f(x,y) is the acquired three-dimensional information of the material surface. The integration area is the area between the digging trajectory and the material surface contour.
Finally, following the above method, each shovel trajectory is calculated to obtain the volume of the material, and then the volume is divided by the rated bucket volume of the bucket to obtain the estimated bucket fill factor.
Table 4 shows the calculated bucket fill factor and estimated bucket fill factor obtained through the above-mentioned methods. Using the estimated bucket fill factor as the horizontal coordinate and the calculated bucket fill factor as the vertical coordinate, the scatter plot is shown in Figure 11. It can be seen from Table 4 that the difference between the calculated accurate bucket fill factor and the estimated bucket fill factor is large. This is because the estimated bucket fill factor is obtained by adding up all the material on the excavation path, which is not consistent with the actual shoveling process. Figure 11 shows that there is a clear linear regression relationship between the calculated bucket fill factor and the estimated bucket fill factor. Therefore, a regression prediction model can be constructed so that the predicted bucket fill factor can be obtained by inputting the estimated fill bucket fill factor to this model.

4.3. Prediction of Bucket Fill Factor Based on Regression Model

After the calculated bucket fill factor and the estimated bucket fill factor are obtained, the latter is taken as the input of the prediction model, and the former is taken as the output of the prediction model. Therefore, the mapping relationship between the estimated bucket fill factor and the accurate bucket fill factor can be constructed using regression algorithms such as support vector machine regression and polynomial regression. The obtained regression curves are shown in Figure 12, and the specific bucket fill factor prediction results are shown in Table 5. Based on the constructed regression prediction model, it is possible to predict the bucket fill factor after shoveling on a predefined shovel trajectory. To ensure the validity of the method, the values of the accurate bucket fill factor for all the three shoveling methods were in the range of 60% to 110%, thus ensuring a reasonable distribution of the samples.
After the regression model on the dataset in Table 4 is established, to verify the reliability of the model, this paper conducts the excavation simulation of nine trajectories. Table 6 shows the predicted bucket fill factor and the error under the polynomial regression method. The analysis of the prediction results under each regression method is shown in Table 7. It can be seen from Table 7 that the polynomial regression method performs the best with a root mean square error of 0.025, a lowest mean absolute error of 0.021, and a lowest maximum error of 4.36% on the validation set. Therefore, our proposed prediction method of the bucket fill factor based on three-dimensional information of material surface achieves a good performance in the simulation.

5. Discussion

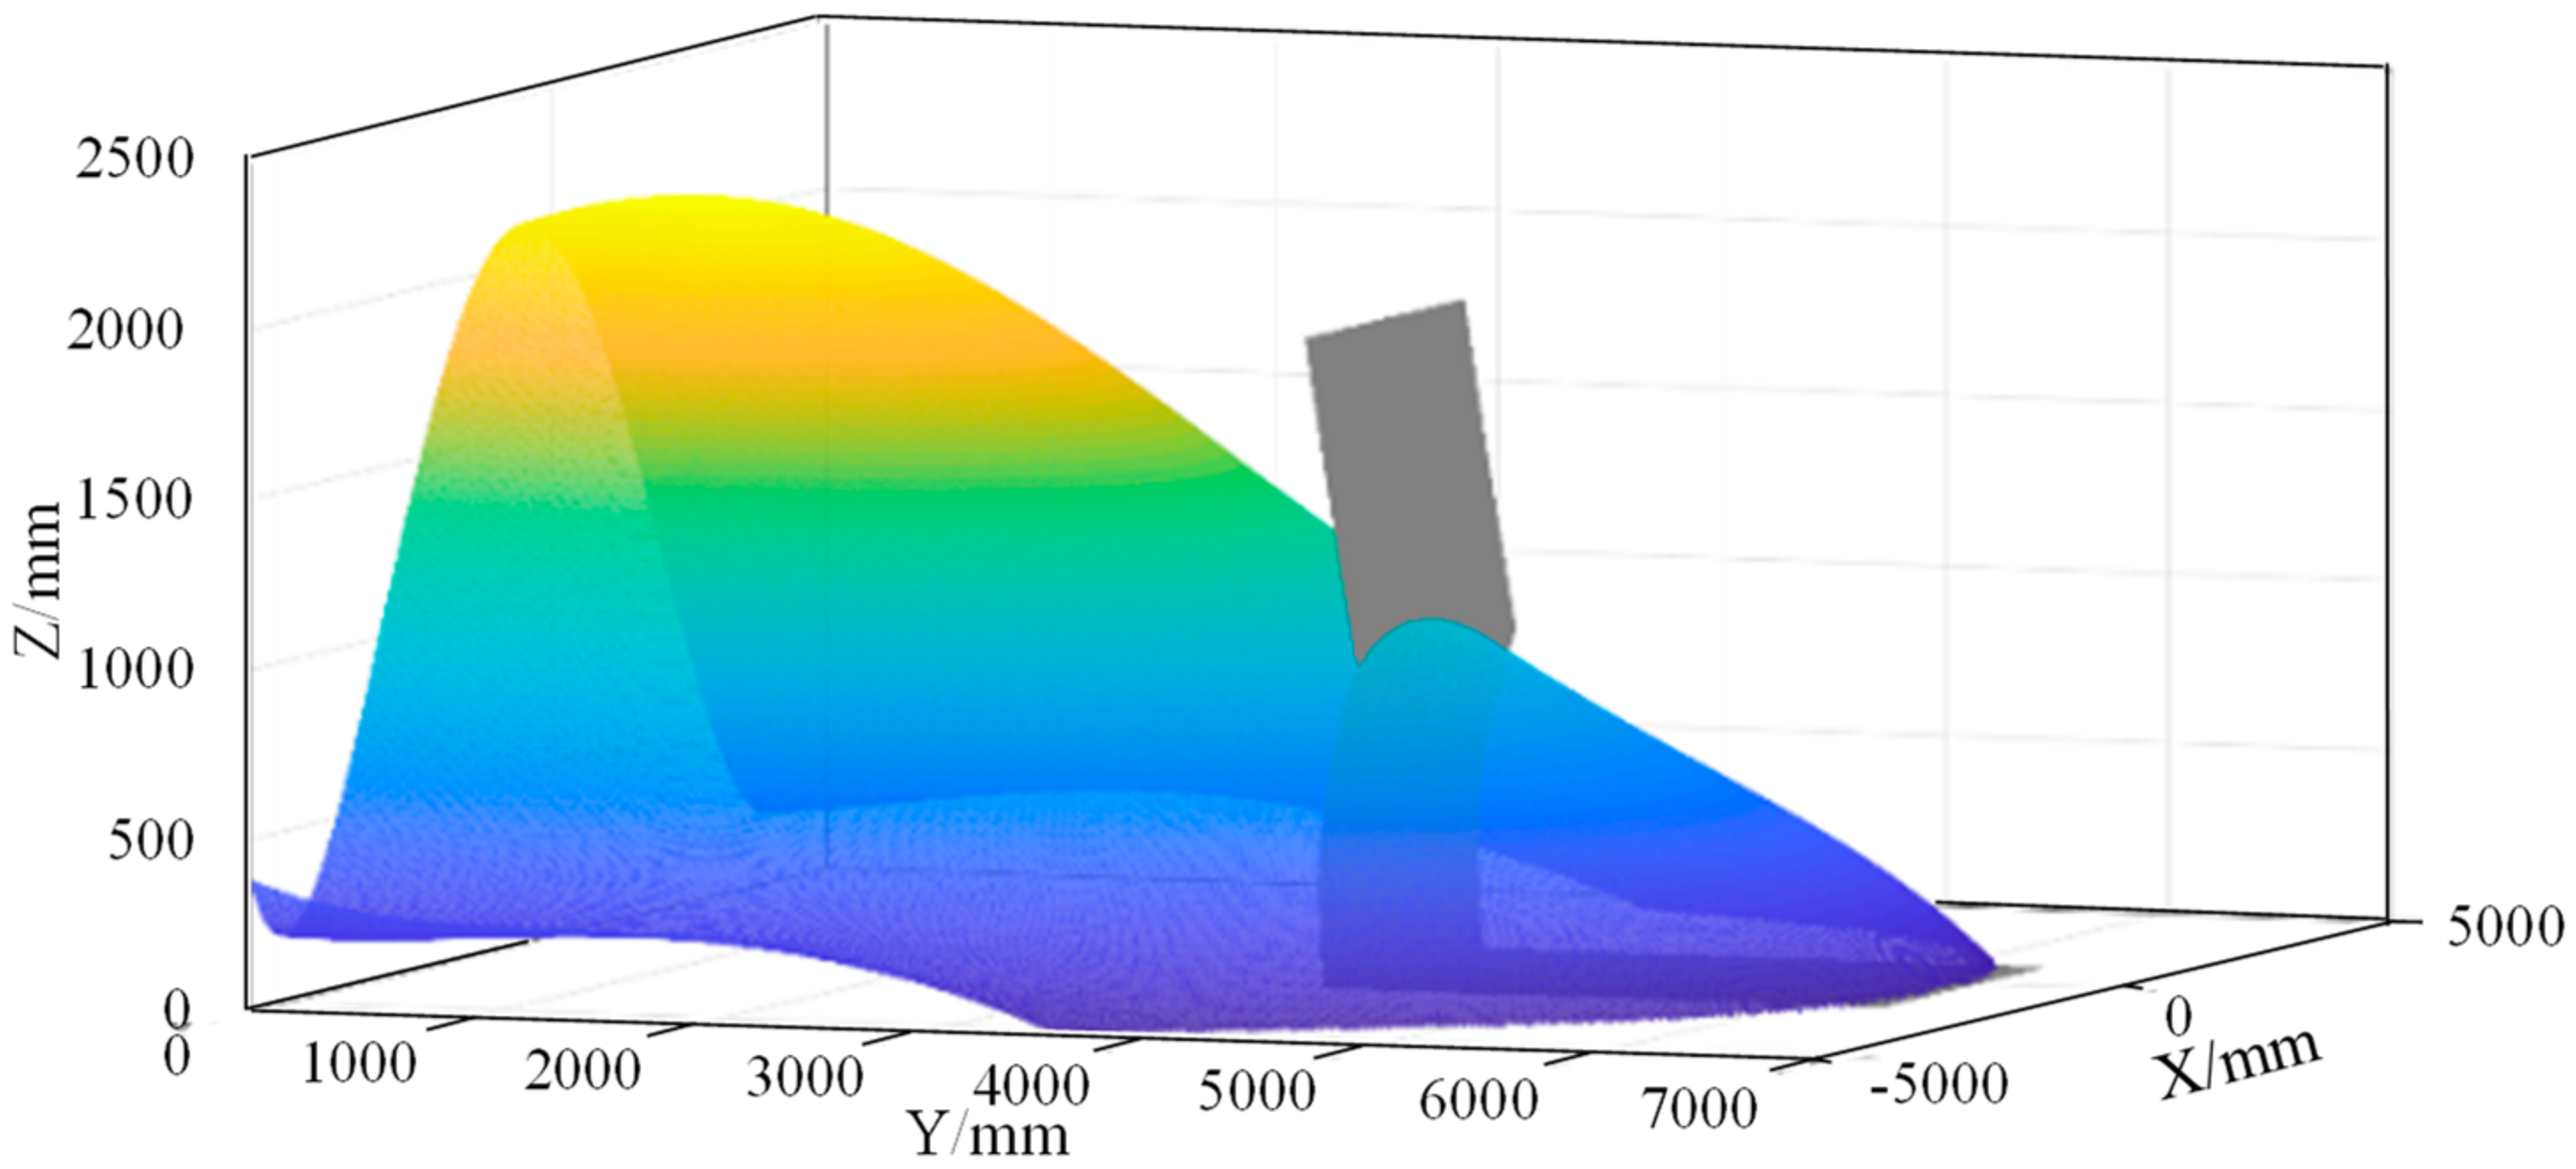
In practical applications, the use of lidar, binocular camera, or depth camera is essential to realize the unmanned construction machinery. At present, the use of these sensors for the 3D reconstruction of the global or local operating environment of the loader has been one of the hot spots of research and has made some progress. Combined with the method proposed in this paper, the bucket fill factor of the loader after shoveling on this preset trajectory can be calculated based on the surface 3D information of the material pile and the preset planning trajectory, and then the trajectory planning algorithm is prompted to find a suitable operating trajectory with bucket fill factor, which has potential in this aspect.
Due to the complexity of the actual shovel loading process and the limitations of the shovel loading simulation, the research work of this paper still needs to be deepened and expanded. Specifically, the experimental data are obtained from the simulation results of the loader shoveling a material, and the simulation verification of a variety of materials needs to be performed. Moreover, the proposed method is only verified in the simulation environment, and a large number of verification experiments are required. Therefore, in future research, simulations of the shoveling process for many different materials and verification experiments will be conducted to optimize this research work.

6. Conclusions

To accurately predict the bucket fill factor of a loader under different shovel trajectories, this paper proposes a prediction method based on three-dimensional information of the material surface. Firstly, the multi-body dynamics software RecurDyn and the discrete element software EDEM are used to create a co-simulation model of the loader excavating materials, and a total of 30 excavation processes are co-simulated. Then, the material volume in the bucket after the loader excavation is divided by the rated volume of the bucket to obtain the accurate bucket fill factor, the shovel trajectory information, and the three-dimensional surface information of the material pile in each shovel excavation process. Based on this, the volume between the shoveled path and the material surface profile is integrated to obtain an estimated bucket fill factor. Finally, a variety of regression algorithms are used to find the mapping relationship between the estimated bucket fill factor and the accurate bucket fill factor. The verification of the mapping relationship shows that the maximum error between the predicted bucket fill factor and the accurate bucket fill factor under the polynomial regression algorithm is 4.3%, the root mean square error is 0.025, and the average absolute value error is 0.021. The results indicate that the method proposed in this paper can well predict the bucket fill factor of the loader after excavation for the preset trajectory. This plays a key role in optimizing the loader unmanned algorithm and in evaluating the merits of the unmanned strategy.

Author Contributions

Conceptualization, S.W. and L.H.; Methodology, S.W. and S.Y.; Investigation, S.Y. and Y.W.; Validation, S.Y.; Writing—original draft preparation, S.Y. and B.W.; Writing—review and editing, S.W. and L.H.; funding acquisition, S.W. and L.H. All authors have read and agreed to the published version of the manuscript.

Funding

This work was supported by the National Key Research and Development Program of China (Grant No. 2020YFB1709904, 2020YFB1709901), National Natural Science Foundation of China (Grant No. 51905460,51975495), Natural Science Foundation of Fujian (Grant No.2022J01060), and Guangdong Basic and Applied Basic Research Foundation (Grant No. 2021A1515012286).

Institutional Review Board Statement

The study did not require ethical approval.

Informed Consent Statement

The study did not involve humans.

Data Availability Statement

The study did not report any data.

Conflicts of Interest

The authors declare no conflict of interest.

References

  1. Jun, G.; Daqing, Z.; Yong, G.; Zhongyong, T.; Changsheng, L.; Peng, H.; Yuming, Z.; Weicai, Q.; Yongping, J. Potential energy recovery method based on alternate recovery and utilization of multiple hydraulic cylinders. Autom. Construct. 2020, 112, 103105. [Google Scholar] [CrossRef]
  2. You, Y.; Sun, D.; Qin, D.; Wu, B.; Feng, J. A new continuously variable transmission system parameters matching and optimization based on wheel loader. Mech. Mach. Theory 2020, 150, 103876. [Google Scholar] [CrossRef]
  3. He, X.; Jiang, Y. Review of hybrid electric systems for construction machinery. Autom. Construct. 2018, 92, 286–296. [Google Scholar] [CrossRef]
  4. Chen, Z.; Zhao, F.; Zhou, J.; Huang, P.; Zhang, X. Fault diagnosis of loader gearbox based on an Ica and SVM algorithm. Int. J. Environ. Res. Public Health 2019, 16, 4868. [Google Scholar] [CrossRef] [PubMed]
  5. Wu, G.; Ma, W.; Liu, C.; Wang, S. IOT and cloud computing based parallel implementation of optimized RBF neural network for loader automatic shift control. Comput. Commun. 2020, 158, 95–103. [Google Scholar] [CrossRef]
  6. Zhao, H.; Wang, G.; Lv, W.; Cao, Y.; Li, X. Optimization of hydropneumatic suspension for articulated wheel loader based on kriging model and particle swarm algorithm. Adv. Mech. Eng. 2018, 10, 1687814018810648. [Google Scholar] [CrossRef]
  7. Dadhich, S.; Bodin, U.; Andersson, U. Key challenges in automation of earth-moving machines. Autom. Construct. 2016, 68, 212–222. [Google Scholar] [CrossRef]
  8. Yu, C.; Jiang, S.; Chu, C. Application of SPC Method to Loader Bucket’s Fill Factor Test. Construct. Mach. Equip. 2014, 45, 13–19+7. [Google Scholar] [CrossRef]
  9. Huang, P.; Liao, X. Study on the Mathematical Model of Bucket Filling Rate of Bucket Shoveling and Loading Process. Met. Min. 2017, 3, 126–130. [Google Scholar] [CrossRef]
  10. Anwar, H.; Abbas, S.M.; Muhammad, A.; Berns, K. Volumetric estimation of contained soil using 3d sensors. Int. Commer. Veh. Technol. Symp. 2014, 11–13. Available online: https://cyphynets.lums.edu.pk/images/SoilEstimCVT2014.pdf (accessed on 8 August 2022).
  11. Guevara, J.; Arevalo-Ramirez, T.; Yandun, F.; Torres-Torriti, M.; Cheein, F.A. Point cloud-based estimation of effective payload volume for earthmoving loaders. Autom. Construct. 2020, 117, 103207. [Google Scholar] [CrossRef]
  12. Lu, J.; Bi, Q.; Li, Y.; Li, X. Estimation of fill factor for earth-moving machines based on 3D point clouds. Measurement 2020, 165, 108114. [Google Scholar] [CrossRef]
  13. Lu, J.; Yao, Z.; Bi, Q.; Li, X. A neural network–based approach for fill factor estimation and bucket detection on construction vehicles. Comput. Aided Civ. Infrastruct. Eng. 2021, 36, 1600–1618. [Google Scholar] [CrossRef]
  14. Sandzimier, R.J.; Asada, H.H. A data-driven approach to prediction and optimal bucket-filling control for auonomous excavators. IEEE Robot. Autom. Lett. 2020, 5, 2682–2689. [Google Scholar] [CrossRef]
  15. Filla, R.; Obermayr, M.; Frank, B. A study to compare trajectory generation algorithms for automatic bucket filling in wheel loaders. In Proceedings of the 3rd Commercial Vehicle Technology Symposium, Kaiserslautern, Germany, 11–13 March 2014; pp. 588–605. [Google Scholar] [CrossRef]
  16. Frank, B.; Kleinert, J.; Filla, R. Optimal control of wheel loader actuators in gravel applications. Autom. Construct. 2018, 91, 1–14. [Google Scholar] [CrossRef]
  17. Coetzee, C.J. Calibration of the discrete element method. Powder Technol. 2017, 310, 104–142. [Google Scholar] [CrossRef]
  18. Shao-Jie, W.; Yue, Y.; Sheng-Feng, Y.; Liang, H. Dynamic analysis on loader coupling based on RecurDyn-EDEM. J. Mach. Des. 2021, 38, 1–6. [Google Scholar] [CrossRef]
  19. Yu, X.J.; Huai, Y.H.; Li, X.-F.; Wang, D.-W.; Yu, A. Shoveling trajectory planning method for wheel loader based on kriging and particle swarm optimization. J. Jilin Univ. 2022, 50, 437–444. [Google Scholar] [CrossRef]
  20. Richter, C.; Roessler, T.; Otto, H.; Katterfeld, A. Coupled discrete element and multibody simulation, part I: Implementation, verification and validation. Powder Technol. 2021, 379, 494–504. [Google Scholar] [CrossRef]
Figure 1. Flow chart of prediction method of bucket fill factor.
Electronics 11 02841 g001
Figure 2. Flow chart of prediction method of bucket fill factor.
Electronics 11 02841 g002
Figure 3. The three-dimensional model of the 958 N loader.
Electronics 11 02841 g003
Figure 4. Schematic diagram of co-simulation.
Electronics 11 02841 g004
Figure 5. Schematic diagram of the shoveling method.
Electronics 11 02841 g005
Figure 6. Graph of the force on the bucket.
Electronics 11 02841 g006
Figure 7. The polynomial surface fitting results of the sandpile surface.
Electronics 11 02841 g007
Figure 8. The structure of the neural network.
Electronics 11 02841 g008
Figure 9. The integration area between the material surface profile and the shovel trajectory.
Electronics 11 02841 g009
Figure 10. A volume integration unit.
Electronics 11 02841 g010
Figure 11. Scatter plot of predicted bucket fill factor under different fitting surface methods. (a) Polynomial surface fitting; (b) Neural network surface fitting.
Electronics 11 02841 g011aElectronics 11 02841 g011b
Figure 12. Prediction regression curve of shovel full rate under different fitting surface methods. (a) Polynomial Surface Fitting; (b) Neural Network Surface Fitting.
Electronics 11 02841 g012
Table 1. Material properties and parameters.
Properties/ParametersValue
Density/(kg∙m−3)1900
Poisson’s ratio0.25
Modulus of shear/MPa1.6 × 104
Sand-Sand coefficient of restitution0.62
Sand-Steel coefficient of restitution0.42
Sand-Sand coefficient of static friction0.74
Sand-Sand coefficient of rolling friction0.12
Sand-Steel coefficient of static friction0.42
Sand-Steel coefficient of rolling friction0.01
Table 2. The performance parameters of the 958 N loader.
Performance ParametersValue
Rated loading capacity/kg5000
Rated power/kw162
Digging power/kn175
Peak traction/kn160
Minimum turning radius/mm5910
Unloading height/mm3167
Rated bucket capacity/m32.4
Table 3. The fitting error of sandpile surface.
Surface Fitting MethodCoefficient of Determination (R2)Root Mean Squared Error (RMSE)
Polynomial function0.992751.26
Neural networks0.996933.86
Table 4. Calculation results of estimated bucket fill factor.
Trajectory TypeSample NumberAccurate Bucket Fill Factor/%Estimated Bucket Fill Factor/%
PolynomialNeural Networks
One excavation167.9992.9886.88
264.0285.1783.07
397.65143.06135.87
494.15133.33130.70
589.62125.70126.09
687.32120.79122.40
784.28119.17120.09
8116.87205.05195.48
9115.29193.23189.17
10112.68184.39183.98
11111.15179.17180.38
12108.83178.20178.82
13120.25234.15223.25
1439.0852.8347.67
Segmented excavation175.8099.0991.93
264.6781.7382.18
359.0975.1876.21
4104.27152.29142.65
593.96131.61131.19
688.92125.43126.03
7114.47177.43166.62
Slicing excavation130.7527.4523.81
240.7942.8335.70
351.2759.7249.87
459.0377.1265.55
569.0195.0182.28
678.16113.4199.83
799.08161.51146.78
8109.86189.27175.64
9123.09236.45221.85
Table 5. Predicted results of bucket fill factor.
Trajectory TypeSample NumberAccurate Bucket Fill Factor/%Predicted Bucket Fill Factor of Different Regression Method/%Error/%
PolynomialSVRGaussPolynomialSVRGauss
PolyNNPolyNNPolyNNPolyNNPolyNNPolyNN
One excavation167.9970.5370.2569.4069.5069.1069.272.542.261.411.511.101.28
264.0265.7467.9465.6867.5464.6066.981.723.921.663.520.582.96
397.6596.7995.5890.3391.2798.1596.570.862.077.326.380.501.08
494.1592.3293.2786.1888.9893.4693.091.830.887.975.170.691.06
589.6288.6091.1482.9886.9589.1690.081.021.526.642.670.460.46
687.3286.1089.3980.9685.3386.1887.801.222.076.361.991.140.48
784.2885.2688.2780.3084.3285.1886.440.983.993.980.040.902.16
8116.87117.24116.30112.93113.45116.62117.020.370.573.943.420.250.15
9115.29114.46114.60109.85112.06114.59113.650.830.695.443.230.701.64
10112.68112.03113.12106.96110.61111.93112.160.650.445.722.070.750.52
11111.15110.45112.05105.09109.48110.23111.630.700.906.061.670.920.48
12108.83110.15111.58104.73108.96109.92111.491.322.754.100.131.092.66
13120.25121.63122.40113.63112.71120.20119.891.382.156.627.540.050.36
1439.0844.0944.1643.7342.0944.1545.425.015.084.653.015.076.34
Segmented excavation175.8074.1573.2272.0871.9472.6972.091.652.583.723.863.113.71
264.6763.5867.3963.8867.0762.6166.431.092.720.792.402.061.76
359.0959.3663.6760.1463.7158.7362.600.274.581.054.620.363.51
4104.27100.7398.4894.2794.27101.72101.073.545.7910.0010.002.553.20
593.9691.5093.5085.4589.2092.5493.412.460.468.514.761.420.55
688.9288.4791.1182.8786.9289.0090.050.452.196.052.000.081.13
7114.47109.91107.60104.44104.44109.67110.654.566.8710.0310.034.803.82
Slicing excavation130.7525.2125.6421.8420.7831.2331.015.545.118.919.970.480.26
240.7936.8435.1234.9731.0337.9739.543.955.675.829.762.821.25
351.2748.9345.7649.3744.0648.7746.502.345.511.907.212.504.77
459.0360.6156.7161.2956.7559.8955.551.582.322.262.280.863.48
569.0171.7567.4670.3167.1270.2866.502.741.551.301.891.272.51
678.1682.2077.7077.9675.5381.5576.124.040.460.202.633.392.04
799.08104.36100.1898.1496.08104.71103.585.281.100.943.005.634.50
8109.86113.41110.58108.61107.85113.47111.293.550.721.252.013.611.43
9123.09121.83122.15113.12113.06123.14123.541.260.949.9710.030.050.45
Description: 1, Poly represents the polynomial surface fitting method; 2, NN represents the neural networks fitting method.
Table 6. Statistics of the results under the polynomial regression method on the validation set.
Trajectory TypeSample NumberAccurate Bucket Fill Factor/%Estimated Bucket Fill Factor/%Predicted Bucket Fill Factor/%Error/%
PolynomialNeural NetworksPolynomialNeural NetworksPolynomialNeural Networks
One excavation153.4771.6766.0257.0557.033.583.56
283.35116.77110.1984.0083.280.650.07
3114.12191.45182.47114.00112.680.121.44
Segmented excavation146.2357.7951.7247.5947.111.360.88
290.86124.70116.5088.1086.492.764.37
398.7814044136.3795.6295.803.162.98
Slicing excavation153.9268.3657.5454.8351.230.912.68
273.98104.1690.9277.0772.633.091.35
3101.96171.46156.61107.93104.005.972.04
Table 7. Analysis of regression results.
Surface Fitting MethodRegression MethodRMSEMAEMaximum Error
Polynomial functionPolynomial0.0290.0245.97%
SVR0.0500.0399.57%
gauss0.0250.0185.80%
Neural NetworksPolynomial0.0250.0214.36%
SVR0.0440.0388.10%
gauss0.0360.0316.44%
Publisher’s Note: MDPI stays neutral with regard to jurisdictional claims in published maps and institutional affiliations.

