Article

Research on Adaptive Exponential Droop Control Strategy for VSC-MTDC System

1
School of Computer and Electrical Engineering, Hunan University of Arts and Science, Changde 415000, China
2
Key Laboratory of Hunan Province for Control Technology of Distributed Electric Propulsion Air Vehicle, Changde 415000, China
*
Author to whom correspondence should be addressed.
Electronics 2022, 11(17), 2788; https://doi.org/10.3390/electronics11172788
Submission received: 5 August 2022 / Revised: 29 August 2022 / Accepted: 1 September 2022 / Published: 4 September 2022

Abstract

:
To solve the problem of large DC voltage deviation caused by the power fluctuations and poor power distribution characteristics of converters in a voltage source converter multi-terminal DC (VSC-MTDC) system based on traditional droop control, this paper proposes an adaptive exponential droop control strategy. This strategy introduces the relative power deviation factor of the converter, and replaces the traditional linear droop control curve with a nonlinear exponential curve. Under different working conditions, the converter adaptively adjusts the droop control coefficient of the converter according to the relative power deviation factor to realize stability for the DC voltage and a reasonable power distribution for the MTDC system. A simulation model of a three-terminal VSC-MTDC was established in MATLAB/Simulink, and the feasibility and effectiveness of the proposed strategy were verified.

1. Introduction

The voltage source converter multi-terminal DC (VSC-MTDC) system, which is composed of multiple VSC converter stations and DC grids, can easily realize multi-power supply and multi-load power supply, has strong flexibility, and is economical and reliabile. Therefore, this system is a hot research and engineering topic in the areas of large-scale renewable energy grid connection, interconnection between energy systems, and island power supply [1,2,3,4,5]. In recent years, with the rapid development of power electronics technology, research on the VSC-MTDC system has deepened [6,7,8,9], but the current research is mainly aimed at optimizing its stability and power quality. When the distribution network fails to maintain the stability of grid voltage, the system can quickly provide active and reactive power support [10,11,12]. When the active power is unbalanced in the DC network of the system and the fluctuation of the DC side voltage is large, the dynamic response process of the control strategy will activate the protection device to stop the equipment, which will then lead to economic losses. Therefore, it is particularly important to study the control of the DC side voltage of VSC-MTDC, and to improve its power distribution and voltage fluctuation characteristics during faults or disturbances.
At present, the control methods based on VSC-MTDC mainly include master–slave control [13,14], voltage droop control [15,16,17,18,19], voltage margin control [20], and combinations of these [21,22,23]. Different control strategies have different applications and scope. Among them, the voltage droop control strategy is generally applicable to the VSC-MTDC system with multiple converter stations. This strategy both manages the DC voltage control according to the slope relationship between the given DC power and the DC voltage, and realizes a fast, balanced distribution of DC power [24]. However, the traditional voltage droop control strategy has a fixed droop coefficient, which cannot flexibly respond to system failures or power disturbances; it also causes DC voltage fluctuations. Therefore, an improved droop control strategy that considers the power marginwas proposed in [25]. The droop control coefficient is determined by the power margin of the converter station to avoid a full load of the converter and to realize reasonable power distribution, but it is easy for the DC voltage to exceed the limit range. A power influence factor in the droop control was thus introduced in [26], which greatly improved the DC voltage quality and power distribution characteristics. An improved droop control strategy based on DC voltage deviation was proposed in [27], which can cope with flexible operating conditions, but the calculation of the sag factor is too complicated.
To sum up, in order to take into account DC voltage quality and power distribution characteristics, an adaptive exponential droop control strategy is proposed, which introduces the relative power deviation factor of the converter in order to transform the traditional linear droop control into a nonlinear exponential droop control. Under different working conditions, the strategy uses the relative power deviation factor of the converter to adaptively adjust the droop control coefficient of the converter; it also optimizes the DC voltage deviation caused by the power fluctuation of the MTDC system, thus improving its power distribution characteristics.

2. Adaptive Exponential Droop Control

2.1. Traditional Droop Control

For conventional control, the (U–I) curve equation is as follows:
U d c 1 = k I d c + U d c c _ r e f
where k is the traditional droop control coefficient; Idc is the DC side current, and U d c _ r e f is the rated voltage of the system. With the traditional droop control strategy, both voltage and power are linearly adjusted according to a fixed slope: when the slope is large, the power distribution characteristics of the converter are good, but the voltage deviation is relatively large, and when the slope is small, the voltage deviation is small, but the power distribution is poor.
Adaptive droop control based on the power influence factor was proposed in [26], and its control (U–I) curve equation is as follows:
U d c 2 = k U d c _ r e f P m I d c 2 + U d c _ r e f
where P m is the rated capacity of the converter.
Adaptive droop control based on the power influence factor realizes the transformation of the traditional linear relationship between DC voltage and power into a nonlinear relationship and optimizes the system voltage quality and power distribution characteristics, which is what provided ideas for this paper regarding adaptive exponential droop control.

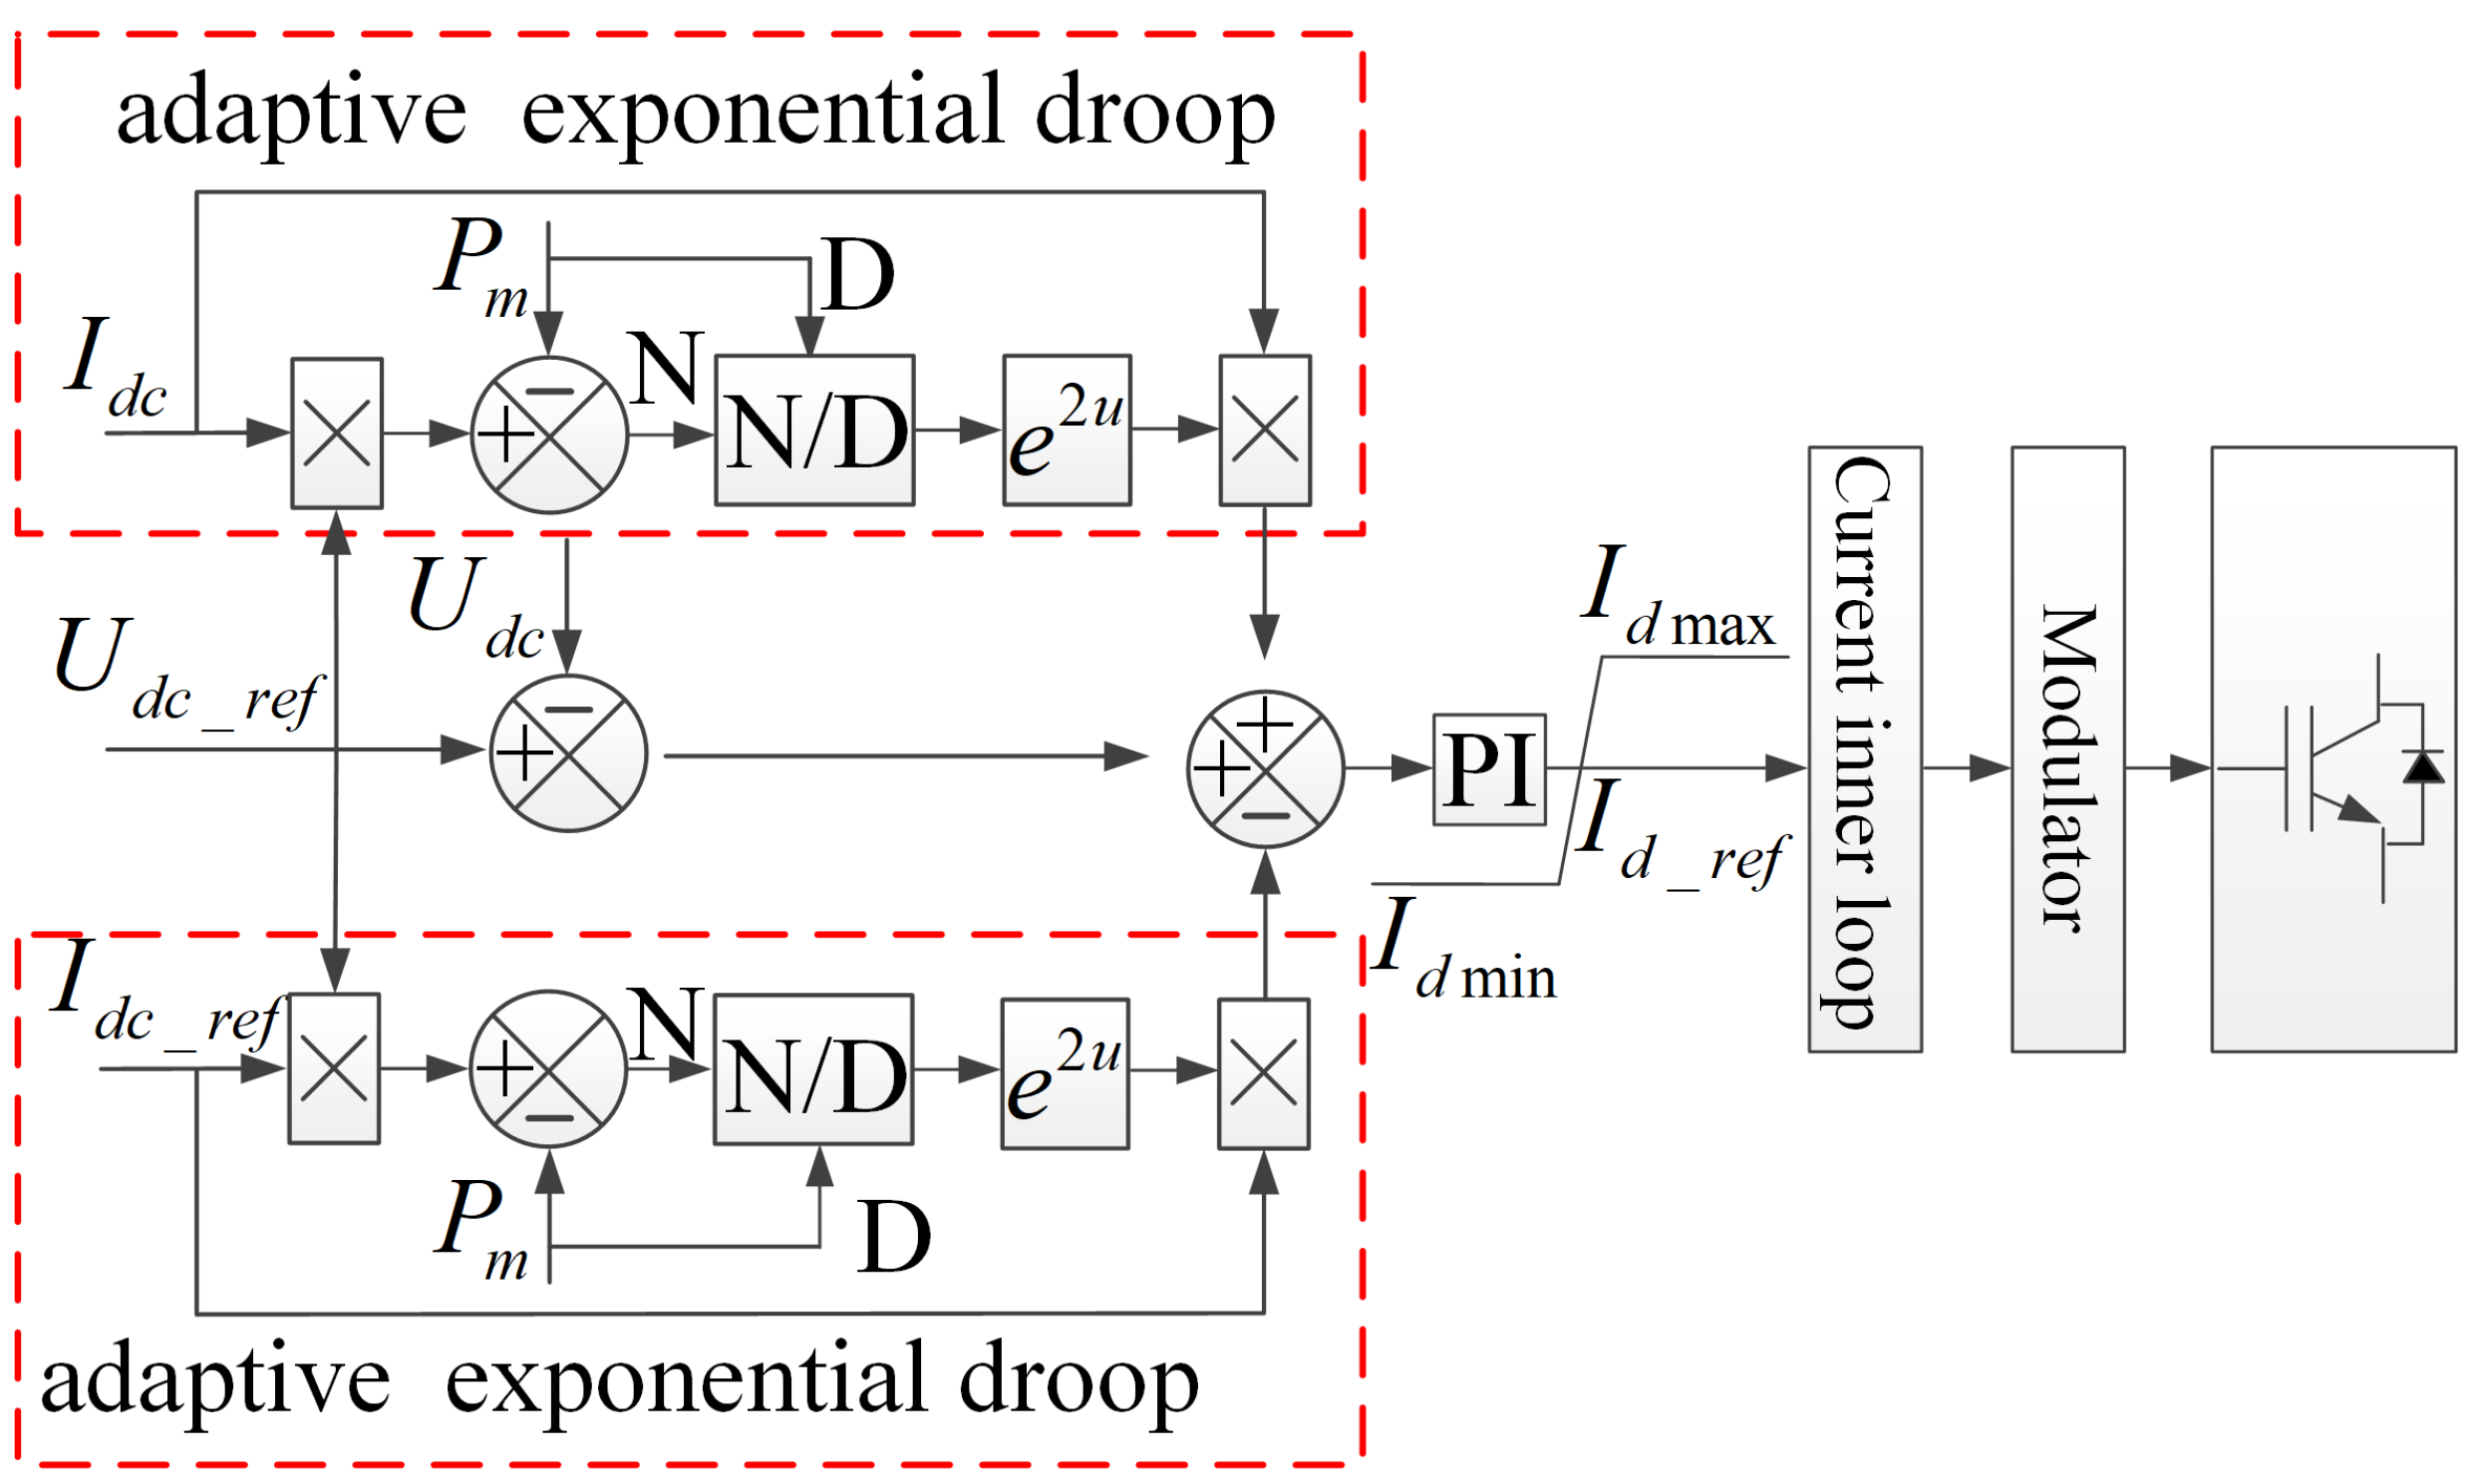
2.2. Adaptive Exponential Droop Control

As shown in Figure 1, in order for the MTDC system to have better power distribution characteristics and voltage quality, the power relative deviation factor ε is introduced into the traditional droop control, and a VSC-MTDC system method based on adaptive exponential droop control is proposed, with ε = P i P m P m and P i = U d c _ r e f I d c ; the control (U–I) curve equation is expressed as follows:
U d c 3 = k e 2 ε I d c + U d c _ r e f

2.3. Dc Voltage Deviation Analysis

Usually, the operating reference point of the MTDC system is set as the transmission power equal to zero, that is, I d c _ r e f = 0 [26], while the rated voltage of the system is I d c r e f = 0 .
The DC voltage deviation caused by the traditional droop control power change is as follows:
Δ U d c 1 = k I d c _ r e f I d c
In [26], the DC voltage deviation caused by the adaptive droop control power change is as follows:
Δ U d c 2 = k U d c _ r e f P m I d c _ r e f 2 I d c 2
The DC voltage deviation caused by the power change of the adaptive exponential droop control proposed in this paper is expressed by the following equation:
Δ U d c 3 = k [ e 2 ( U d c _ r e f I d c _ r e f P m ) P m I d c _ r e f e 2 ( U d c _ r e f I d c P m ) P m I d c ]
The range of the DC current I c d in Equations (4)–(6) is I c d ( 0 , P m / U c d _ r e f ) , and P m / U d c _ r e f is the maximum allowable current of the converter; the allowable range of the DC side voltage U d c is 5%, that is, U d c ( 0.95 U d c _ r e f , 1.05 U d c _ r e f ) .
  • If we compare the voltage deviation between the adaptive exponential droop control and the traditional droop control by mathematical difference, the difference result is as follows:
    Δ U d c 3 Δ U d c 1 = k I d c [ 1 e 2 ( U d c _ r e f I d c P m ) P m ]
    Since this is within the range of the converter current variation, that is, I d c ( 0 , P m / U d c _ r e f ) , there is always U d c _ r e f I d c < P m , and so the above formula always has Δ U d c 3 Δ U d c 1 < 0 . Thus, the DC voltage deviation is always better for the adaptive exponential droop control than the traditional droop control.
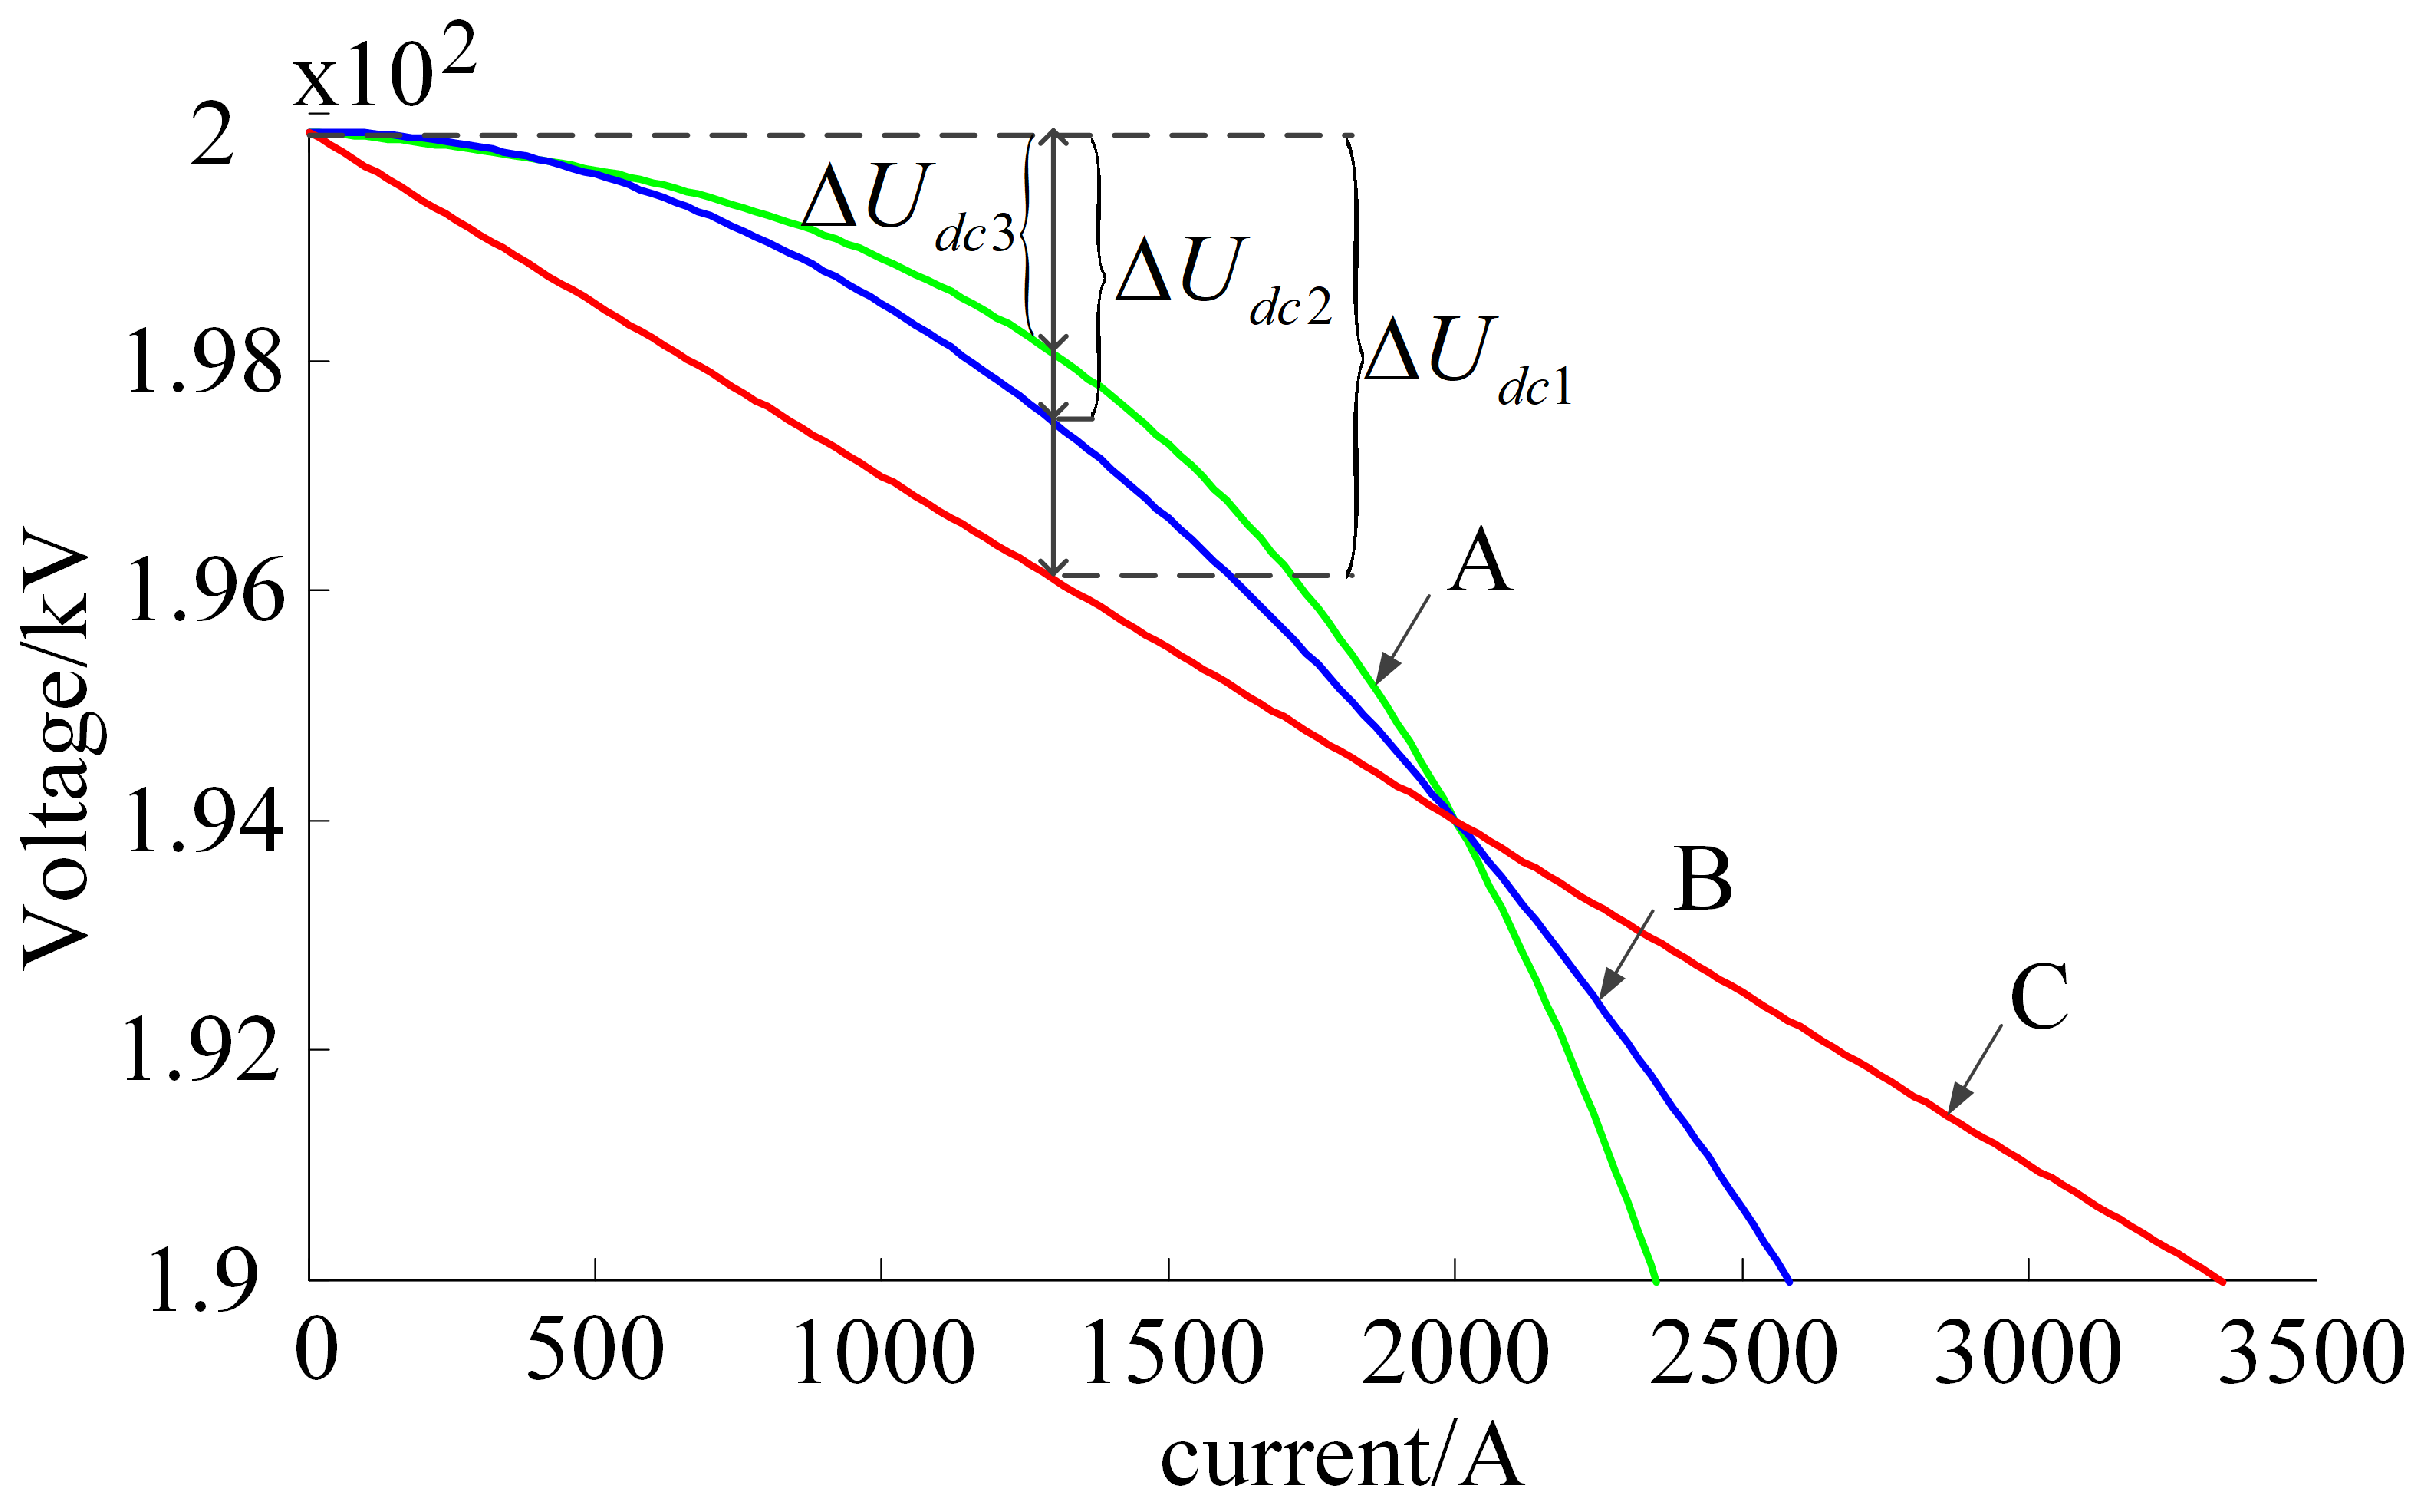
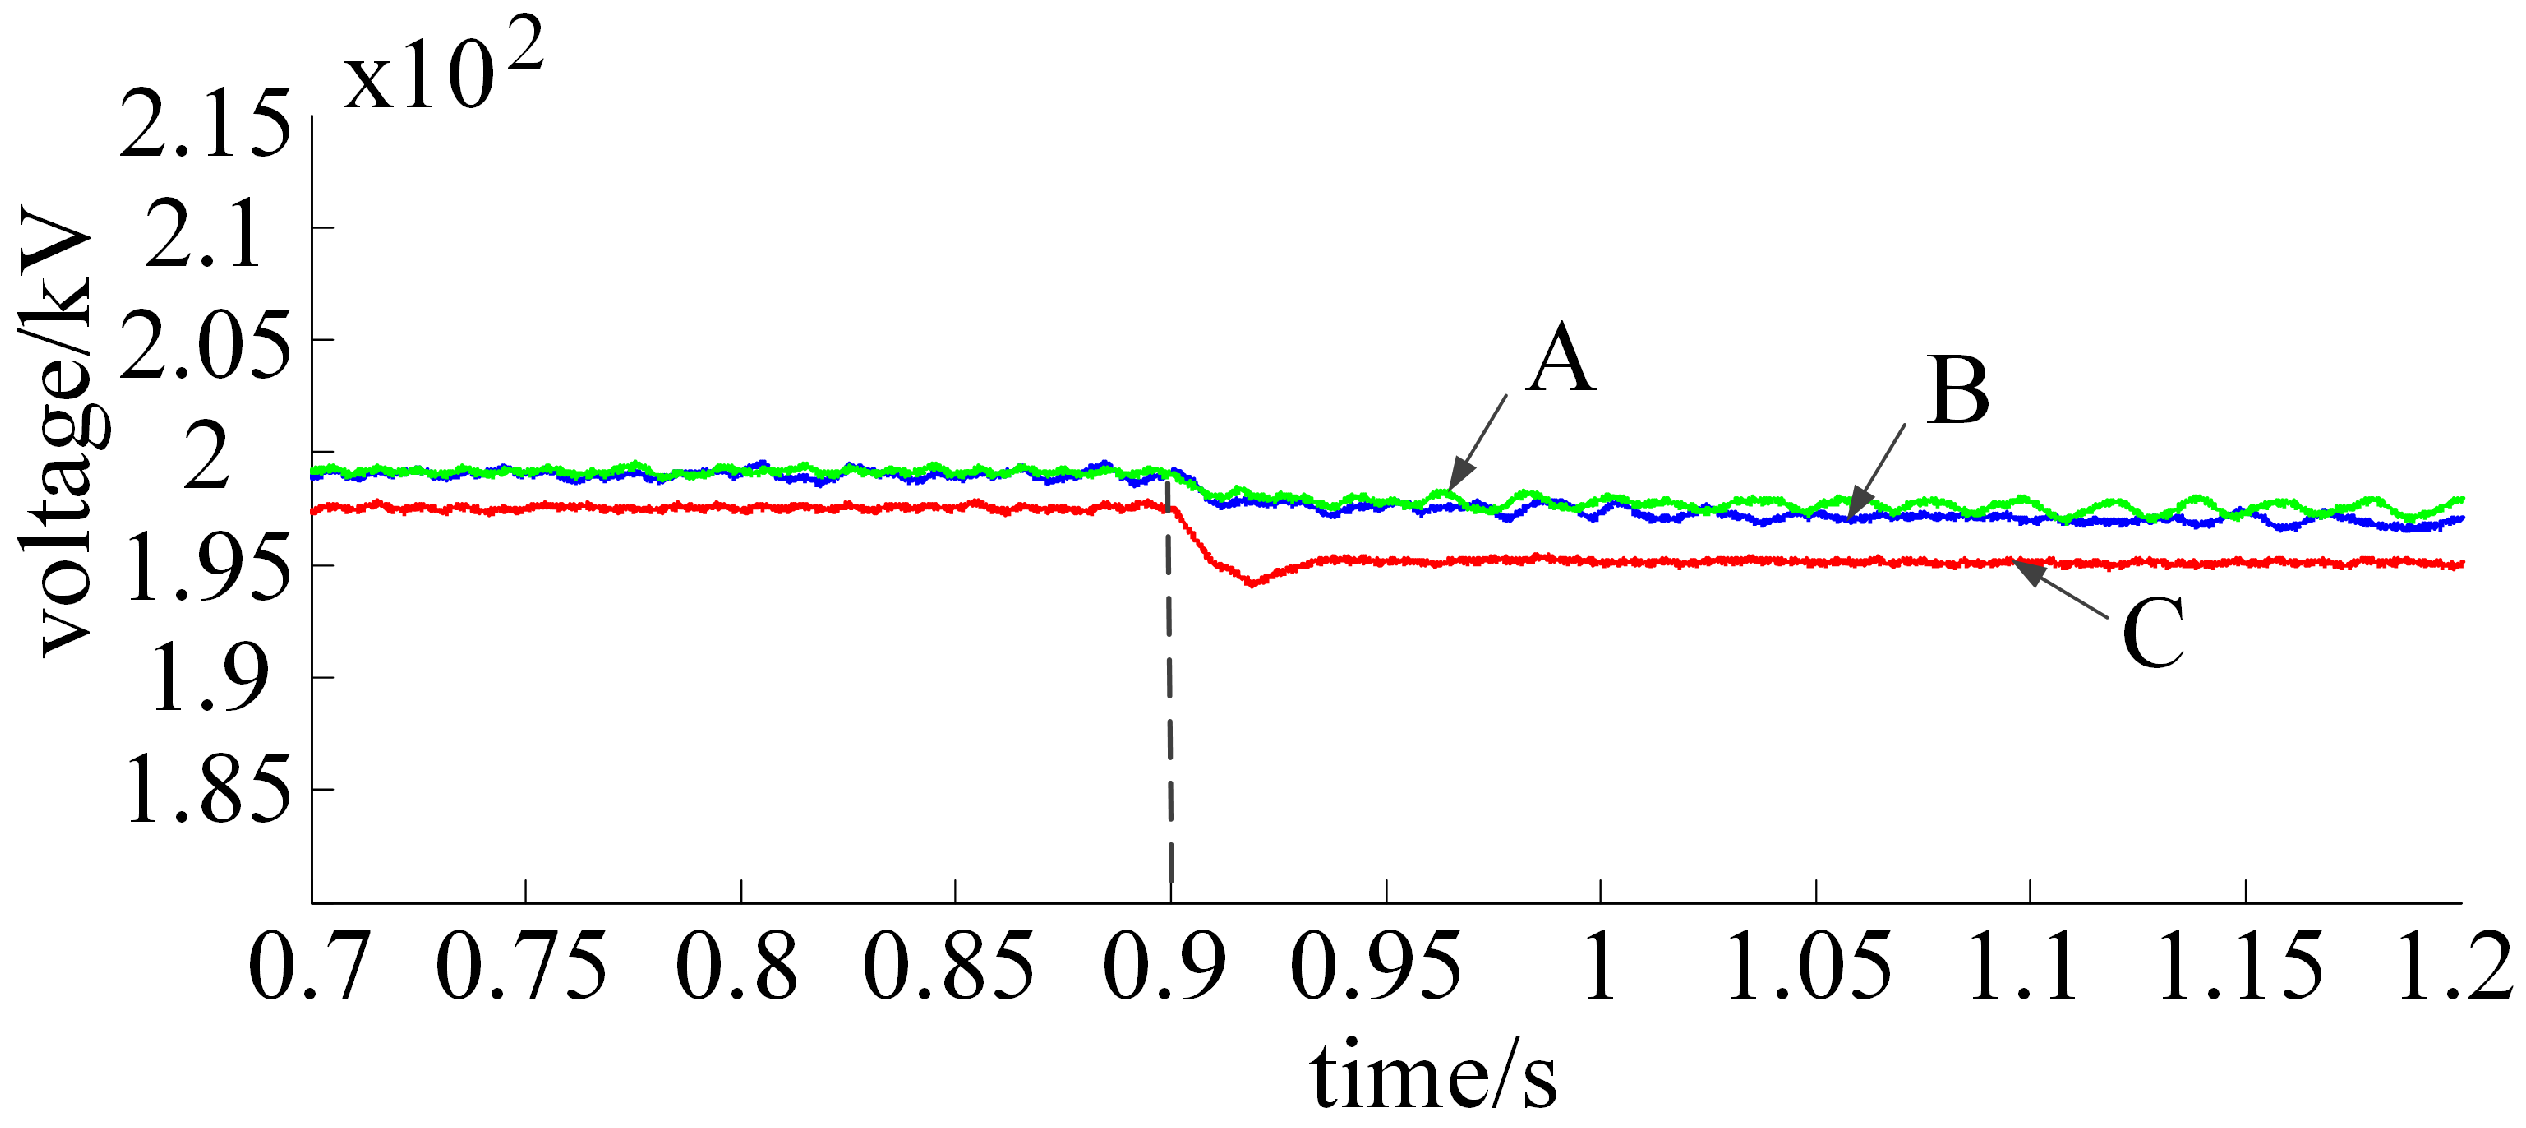
  • As shown in Figure 2, adaptive exponential droop control (A), adaptive droop control (B) [26], and the traditional droop control (C) are compared through a curve diagram, and it is easy to see that the deviation of DC voltage is slighty better for the adaptive droop control than the adaptive exponential droop control in a small range; however, the voltage deviation of the exponential droop control is better than that of the adaptive droop control in a large variation range.
The mathematical difference of the adaptive exponential droop control and the voltage deviation of adaptive droop control in [26] is calculated as follows:
Δ U d c 3 Δ U d c 2 = k U d c _ r e f P m I d c 2 I d c e 2 U d c _ r e f I d c P m P m

2.4. Analysis of Power Distribution Characteristics

The power distribution characteristics of MTDC are generally measured by the slope of the curve: the larger the slope, the better the power distribution characteristics, and vice versa. The greater the voltage change under unit power fluctuation, the better the power distribution characteristics.
The I d c partial derivation is performed on the (U–I) equation of the adaptive exponential droop control of Equation (3), and the result is expressed by the equation below:
U d c 3 I d c = k e 2 U d c _ r e f I d c P m P m 1 + 2 U d c _ r e f I d c P m
Analyzing the above formula, we obtain the following:
k e 2 U d c _ r e f I d c P m P m 1 + 2 U d c r e f I d c P m > k , I d c 0 , 0.6039 U d c r f P m k e 2 U d c _ r e f I d c P m P m 1 + 2 U d c r e f I d c P m < k , I d c 0.6039 U d c r e f P m , U d c r e f P m
The analysis result shows that when the DC side current is in the interval ( 0 , 0.6039 U r e f P m ) , that is, the MTDC system is lightly loaded, the voltage quality of the adaptive exponential droop control within this range is good, and it is more inclined toward the optimization of the voltage quality; when the DC side current is in the interval ( 0.6039 U r e f P m , U r e f P m ) , that is, the load is heavy, the adaptive exponential droop control does not only have good voltage quality, but it also has better power distribution characteristics.

3. Influence of Adaptive Exponential Sag Coefficient on Stability

Figure 3 shows a control block diagram of the adaptive exponential droop control converter, in which the droop coefficient k1 = −k is taken, and the droop control outer loop PI controller is G 0 ( s ) = s k p v + k i v s . The current inner loop function is set as G 1 ( s ) = G 2 ( s ) G 3 ( s ) G 4 ( s ) : G 2 ( s ) = s k p i + k i i s is the current inner loop control PI controller; G 3 ( s ) = k P W M 1.5 T s + 1 is the current inner loop sampling transfer function, where k P W M is the PWM equivalent gain and T s is the sampling period; and G 4 ( s ) = 1 / R 1 + ( L / R ) s is the transfer function of the AC filter resistance and inductance link. The equivalent proportional gain is 0.75 and the DC side capacitance transfer function is 1 s C .
According to the adaptive exponential droop control block diagram in Figure 3, the open-loop transfer function is derived as follows:
G ( s ) = 0.75 k i i + s k p i k i v + s k p v k 1 C s S 2 ( k i i + s k p i ) + s 1 + 1.5 T s s ( 1 + L s / R )
The experimental simulation parameters of the MTDC system in this paper are shown in Table 1.
The values of the experimental simulation parameters of the MTDC system were used in Formula (11), and a root locus diagram of the open-loop transfer function was obtained, as shown in Figure 4.
As shown in Figure 4, the left half plane is the system stability region in the root locus diagram of the open-loop transfer function for the adaptive exponential droop control. The critical point open-loop gain is 0.948, and the k1 value is equal to 1.2. As the stable point of the system moves to the left half plane, k1 gets bigger and goes to positive infinity. Therefore, the range of the droop coefficient k can be obtained as k 1 ( 1.2 , + ) . However, to ensure that the MTDC system maintains steady-state operation, the DC voltage quality must have Δ U d c > 0.95 U d c r e f , and the value range of k1 can be obtained as k 1 ( , 5 ) . Based on the above analysis, the range of the equivalent sag coefficient k1 is: k 1 ( 1.2 , 5 ) .

4. Simulation

As shown in Figure 5, a flexible three-terminal radial DC transmission system was simulated and built, in which two ends were the power-sending ends and one end was the power-receiving end. VSC1 and VSC2 were both rectifier stations, and adaptive exponential droop control was adopted. The rated capacity was 400 MVA, the inverter station was VSC3, the equivalent receiving end load adopted constant active power control, and the converter power was 600 MVA; the DC side voltage was ±100 kV, the line equivalent resistance value was 0.5 Ω, and the line equivalent inductance value was 2 mH.
In this paper, the simulation of different droop coefficients and the power change of the receiving end, that is, the fluctuation of the equivalent load, are analyzed through the use of an example, and the DC voltage quality and power distribution characteristics of traditional droop control, adaptive droop control, and adaptive exponential droop control are compared.

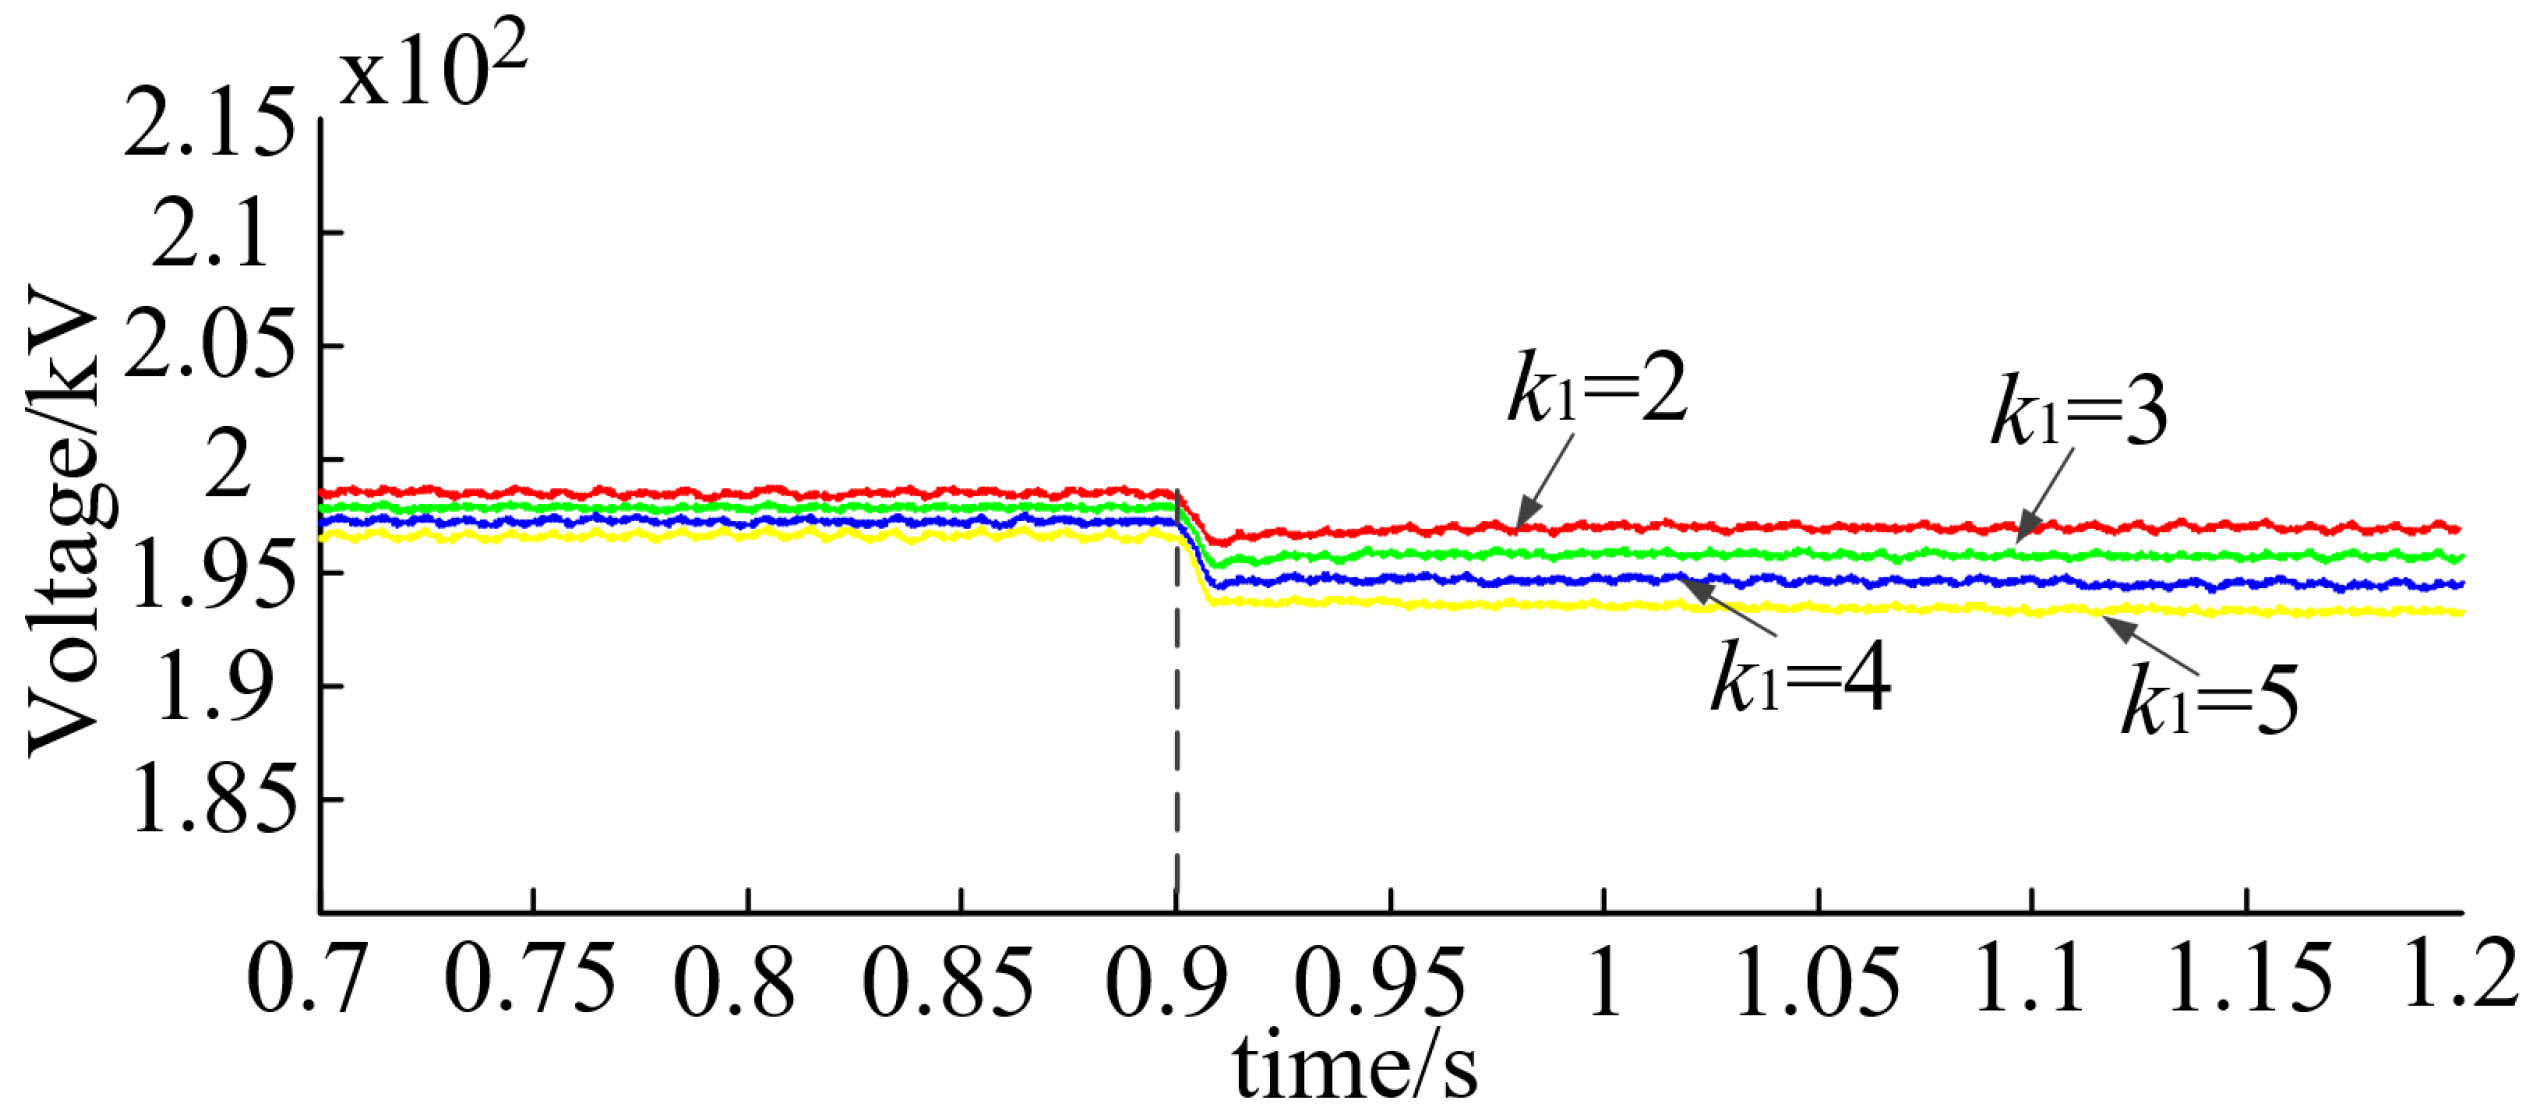
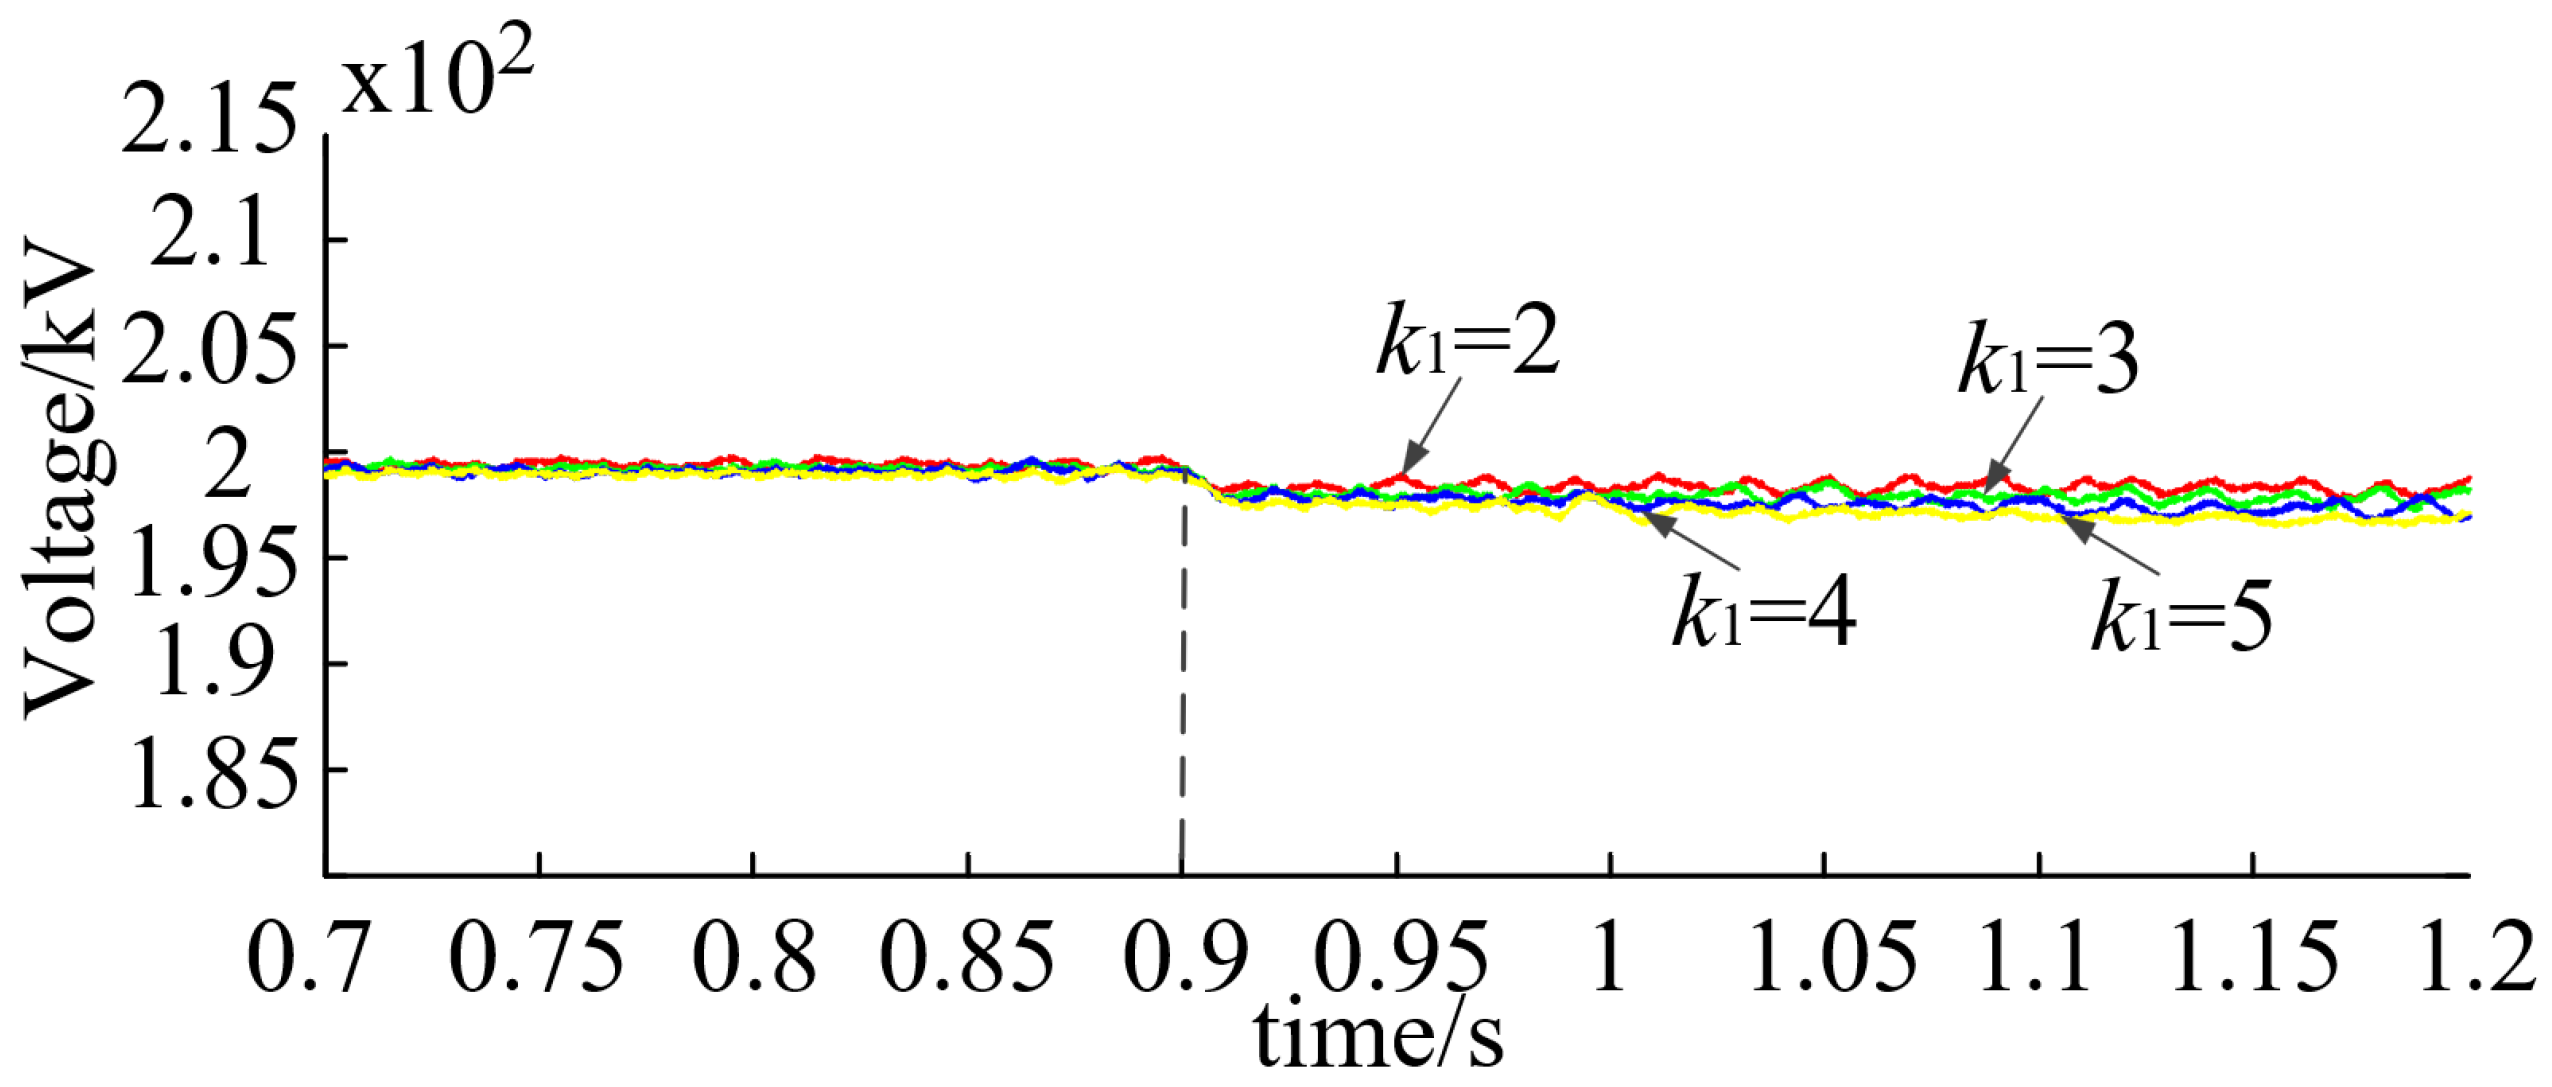
4.1. Simulation Results of Different Droop Coefficients

To verify the superiority of the proposed adaptive exponential droop strategy in terms of voltage characteristics under different initial droop coefficients, this paper simulates the effects of different initial droop coefficients on the steady-state voltage of the DC side when the receiving end power of the MTDC system fluctuates. When it is 0.9 s, the power at the receiving end changes from 240 MW to 480 MW; the simulation waveform is shown in Figure 6, Figure 7 and Figure 8.
In the simulation waveforms in Figure 6, Figure 7 and Figure 8, it can be clearly seen that compared with the traditional droop control strategy and the adaptive droop control strategy, the adaptive exponential droop control proposed in this paper is less affected by the initial droop coefficient, and that the voltage deviation in the whole period is smaller.
As can be seen in Table 2, according to the simulation waveforms in Figure 6, Figure 7 and Figure 8, the specific DC steady-state voltage values of adaptive exponential droop control, adaptive droop control, and traditional droop control are obtained through simulation. Table 3 is the comparison of the DC steady-state voltage deviation of the three droop control strategies mentioned above, in which η 1 and η 2 are expressed as the reduction rates of the adaptive droop and the adaptive exponential droop control voltage deviation relative to the traditional droop control in the literature [26]; the higher the relative reduction rate, the better the DC voltage steady-state performance is. In Table 3, it can be seen that the adaptive droop control can effectively improve the DC voltage quality of the VSC-MTDC system, and the adaptive exponential droop control proposed in this paper can further improve effectively. Therefore, the method proposed in this paper is better than the other two methods in terms of DC voltage quality.

4.2. Power Fluctuation Simulation Results

With the droop control coefficient k 1 = 3.5 , the load power fluctuated in the range of 240–400 MW, 240–480 MW, and 240–600 MW. The results are shown in Figure 9, Figure 10, Figure 11, Figure 12, Figure 13 and Figure 14. Lines A, B, and C in Figure 9, Figure 10, Figure 11, Figure 12, Figure 13 and Figure 14 represent the adaptive exponential droop control strategy, the adaptive droop control strategy, and the traditional droop control strategy, respectively, which are consistent with other simulation figures.
Similarly, the specific DC steady-state voltage values of the three control strategies shown in Table 4 were obtained through simulation, according to the simulation waveforms in Figure 9, Figure 10, Figure 11, Figure 12, Figure 13 and Figure 14; as shown in Table 5, the DC steady-state voltage deviation was calculated, and the proposed adaptive exponential droop control could further reduce the DC steady-state voltage deviation caused by the load power fluctuation, thereby improving the DC voltage quality.

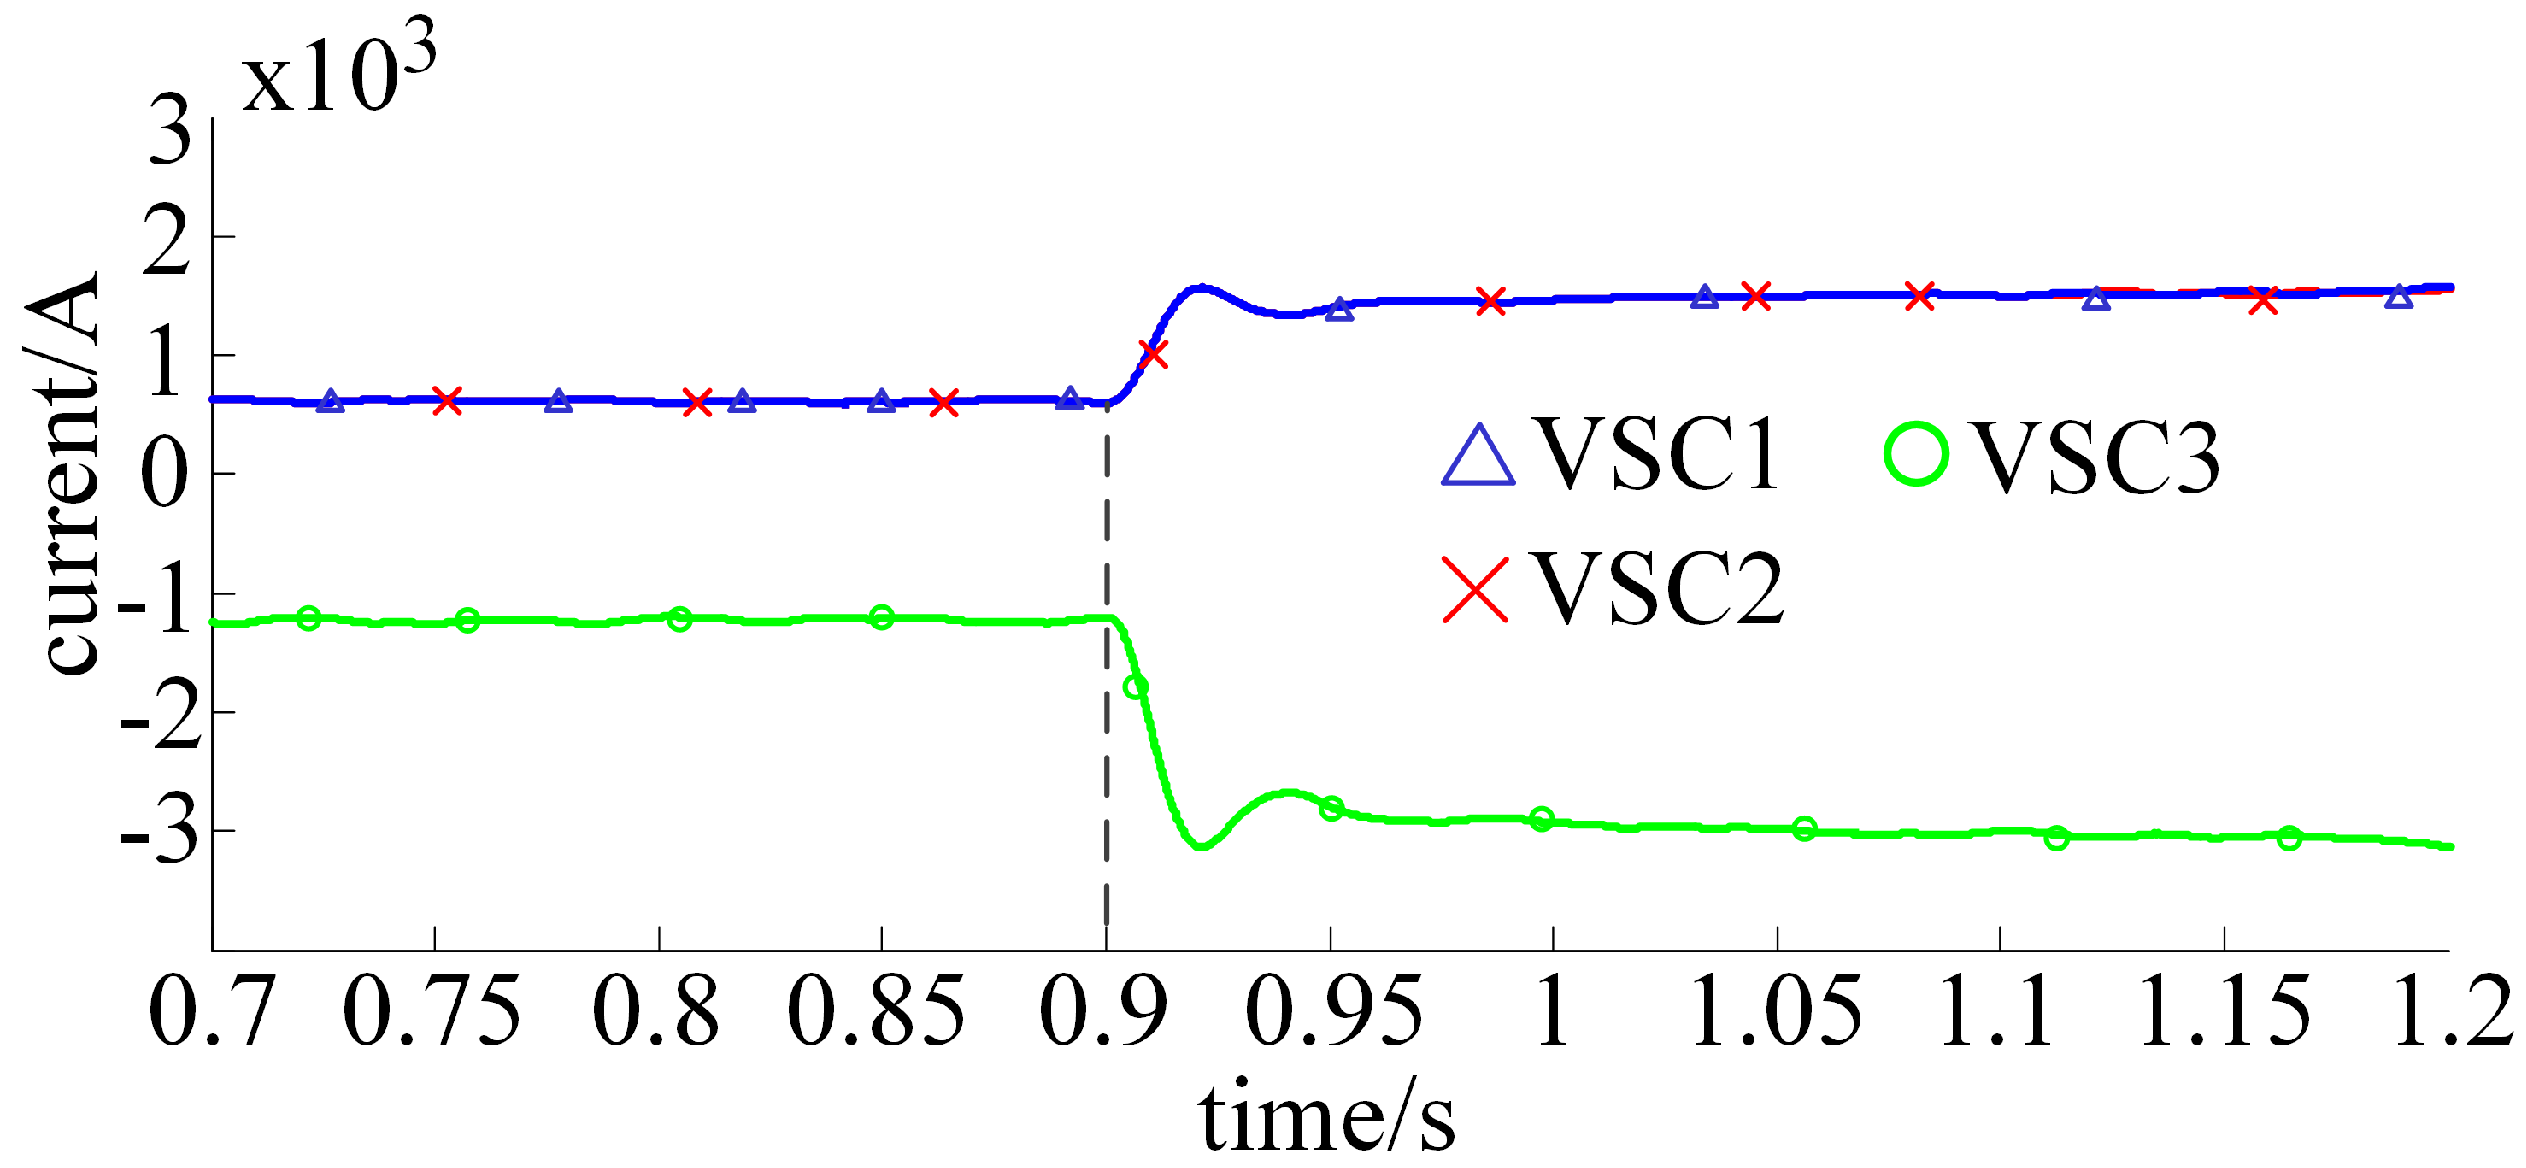
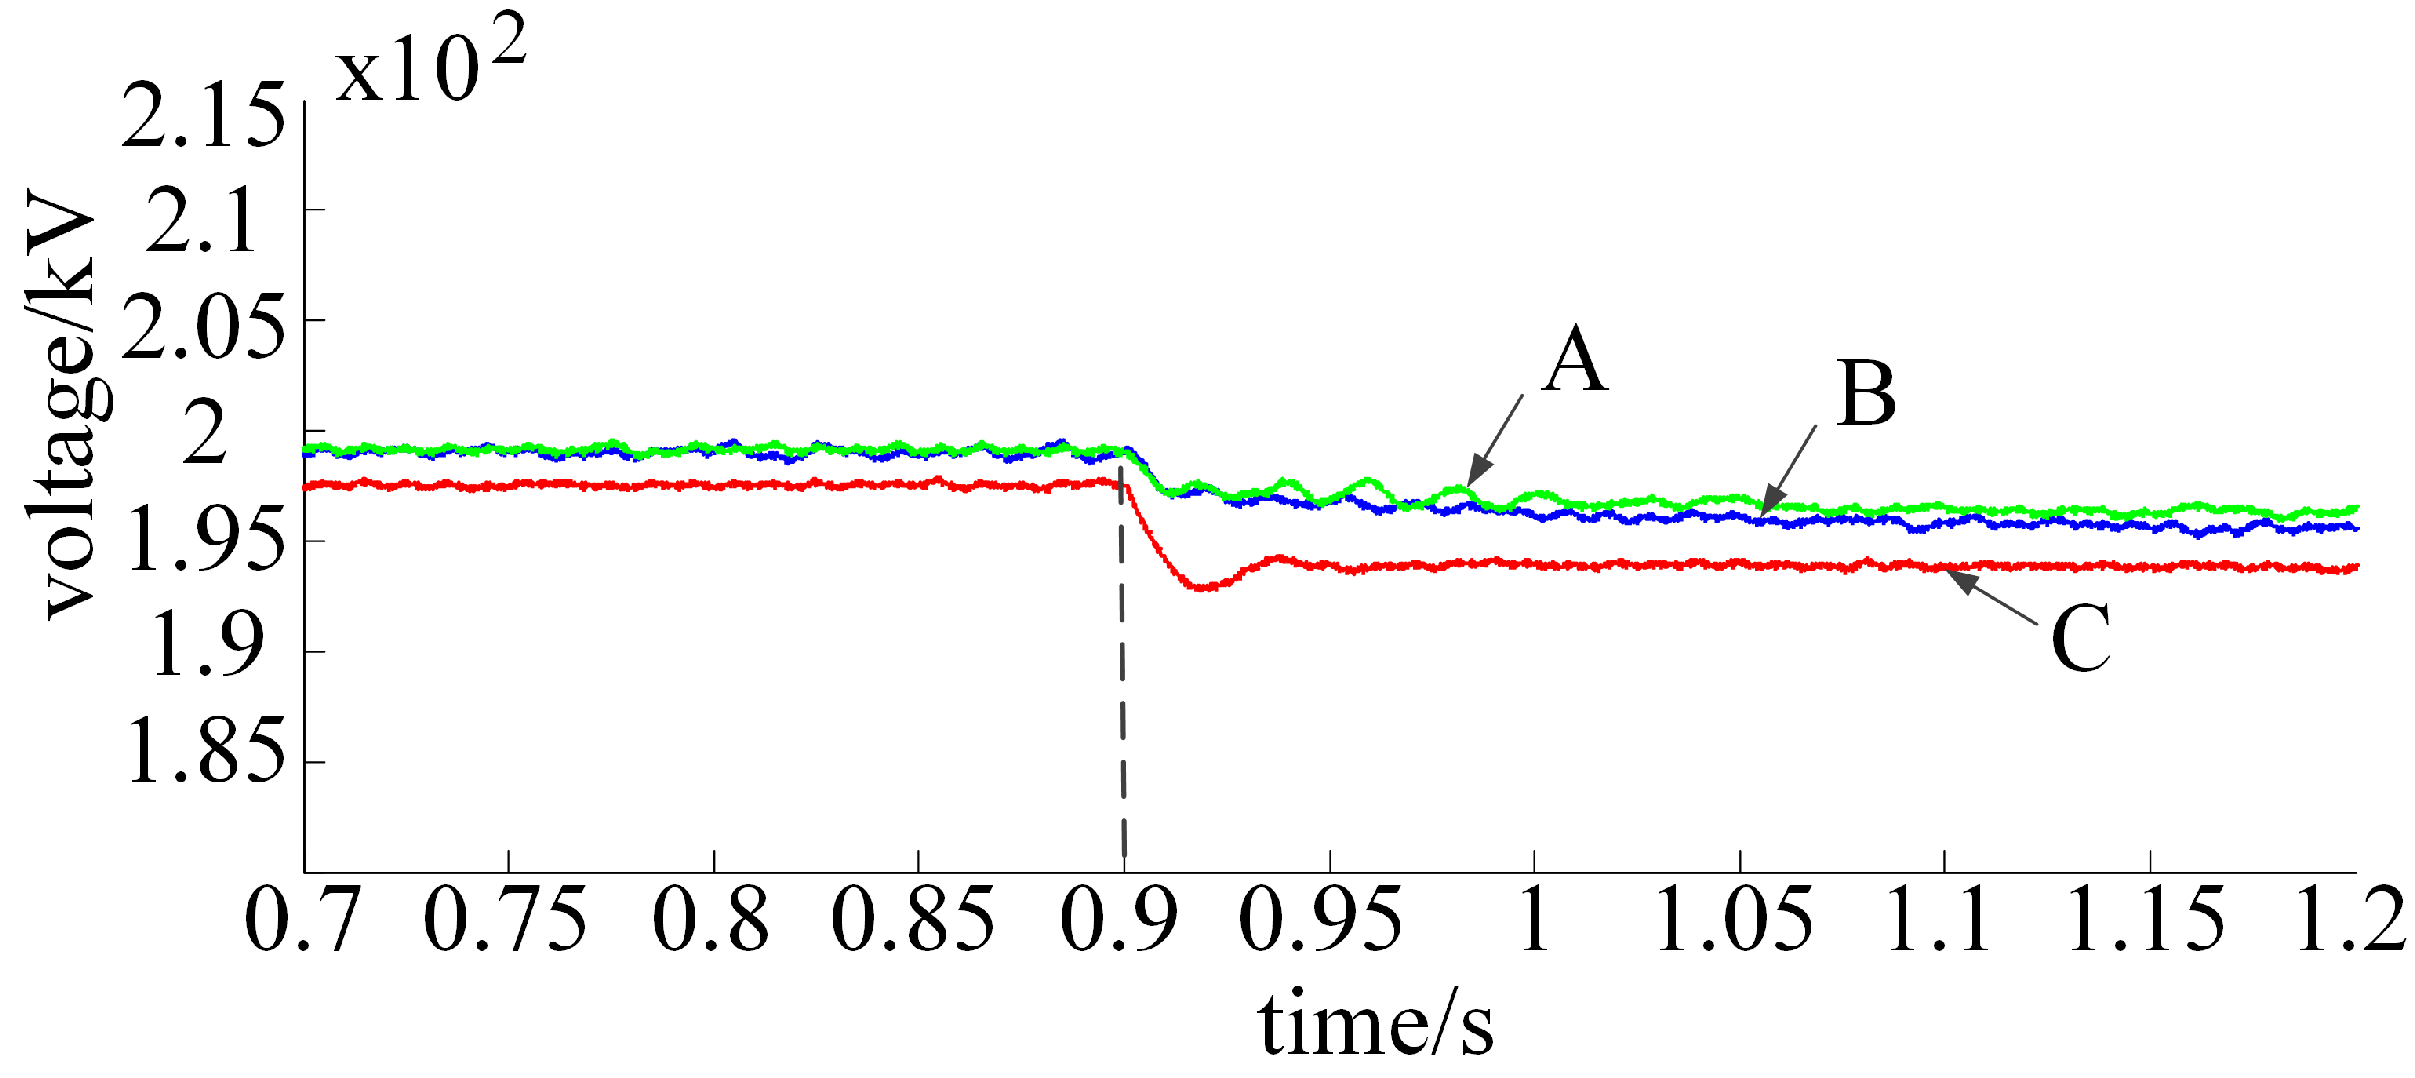
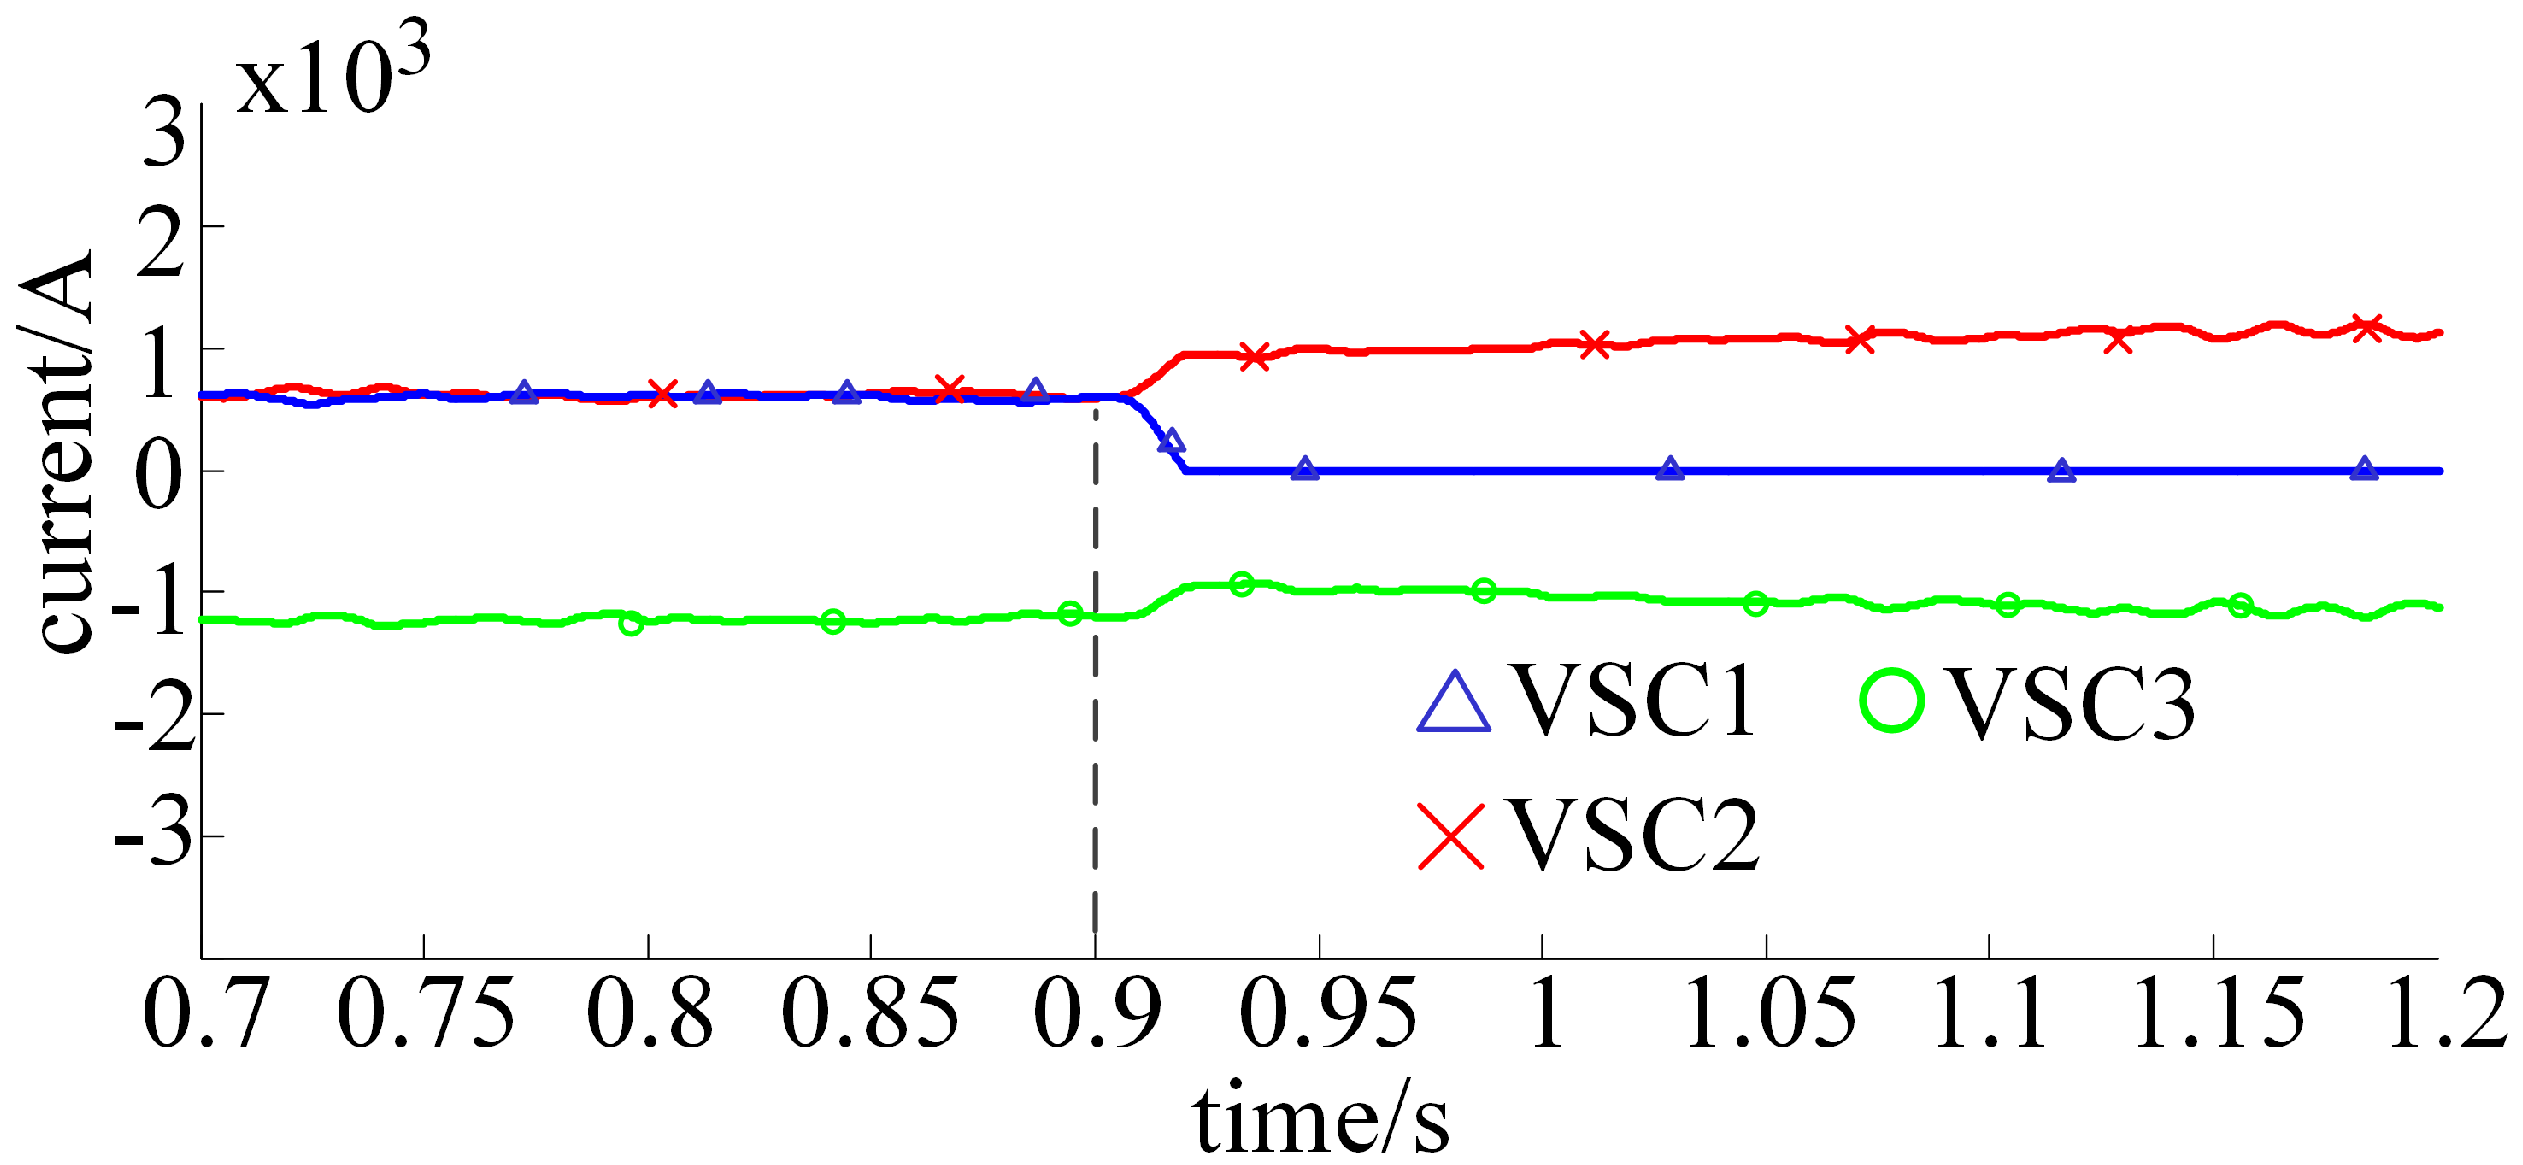
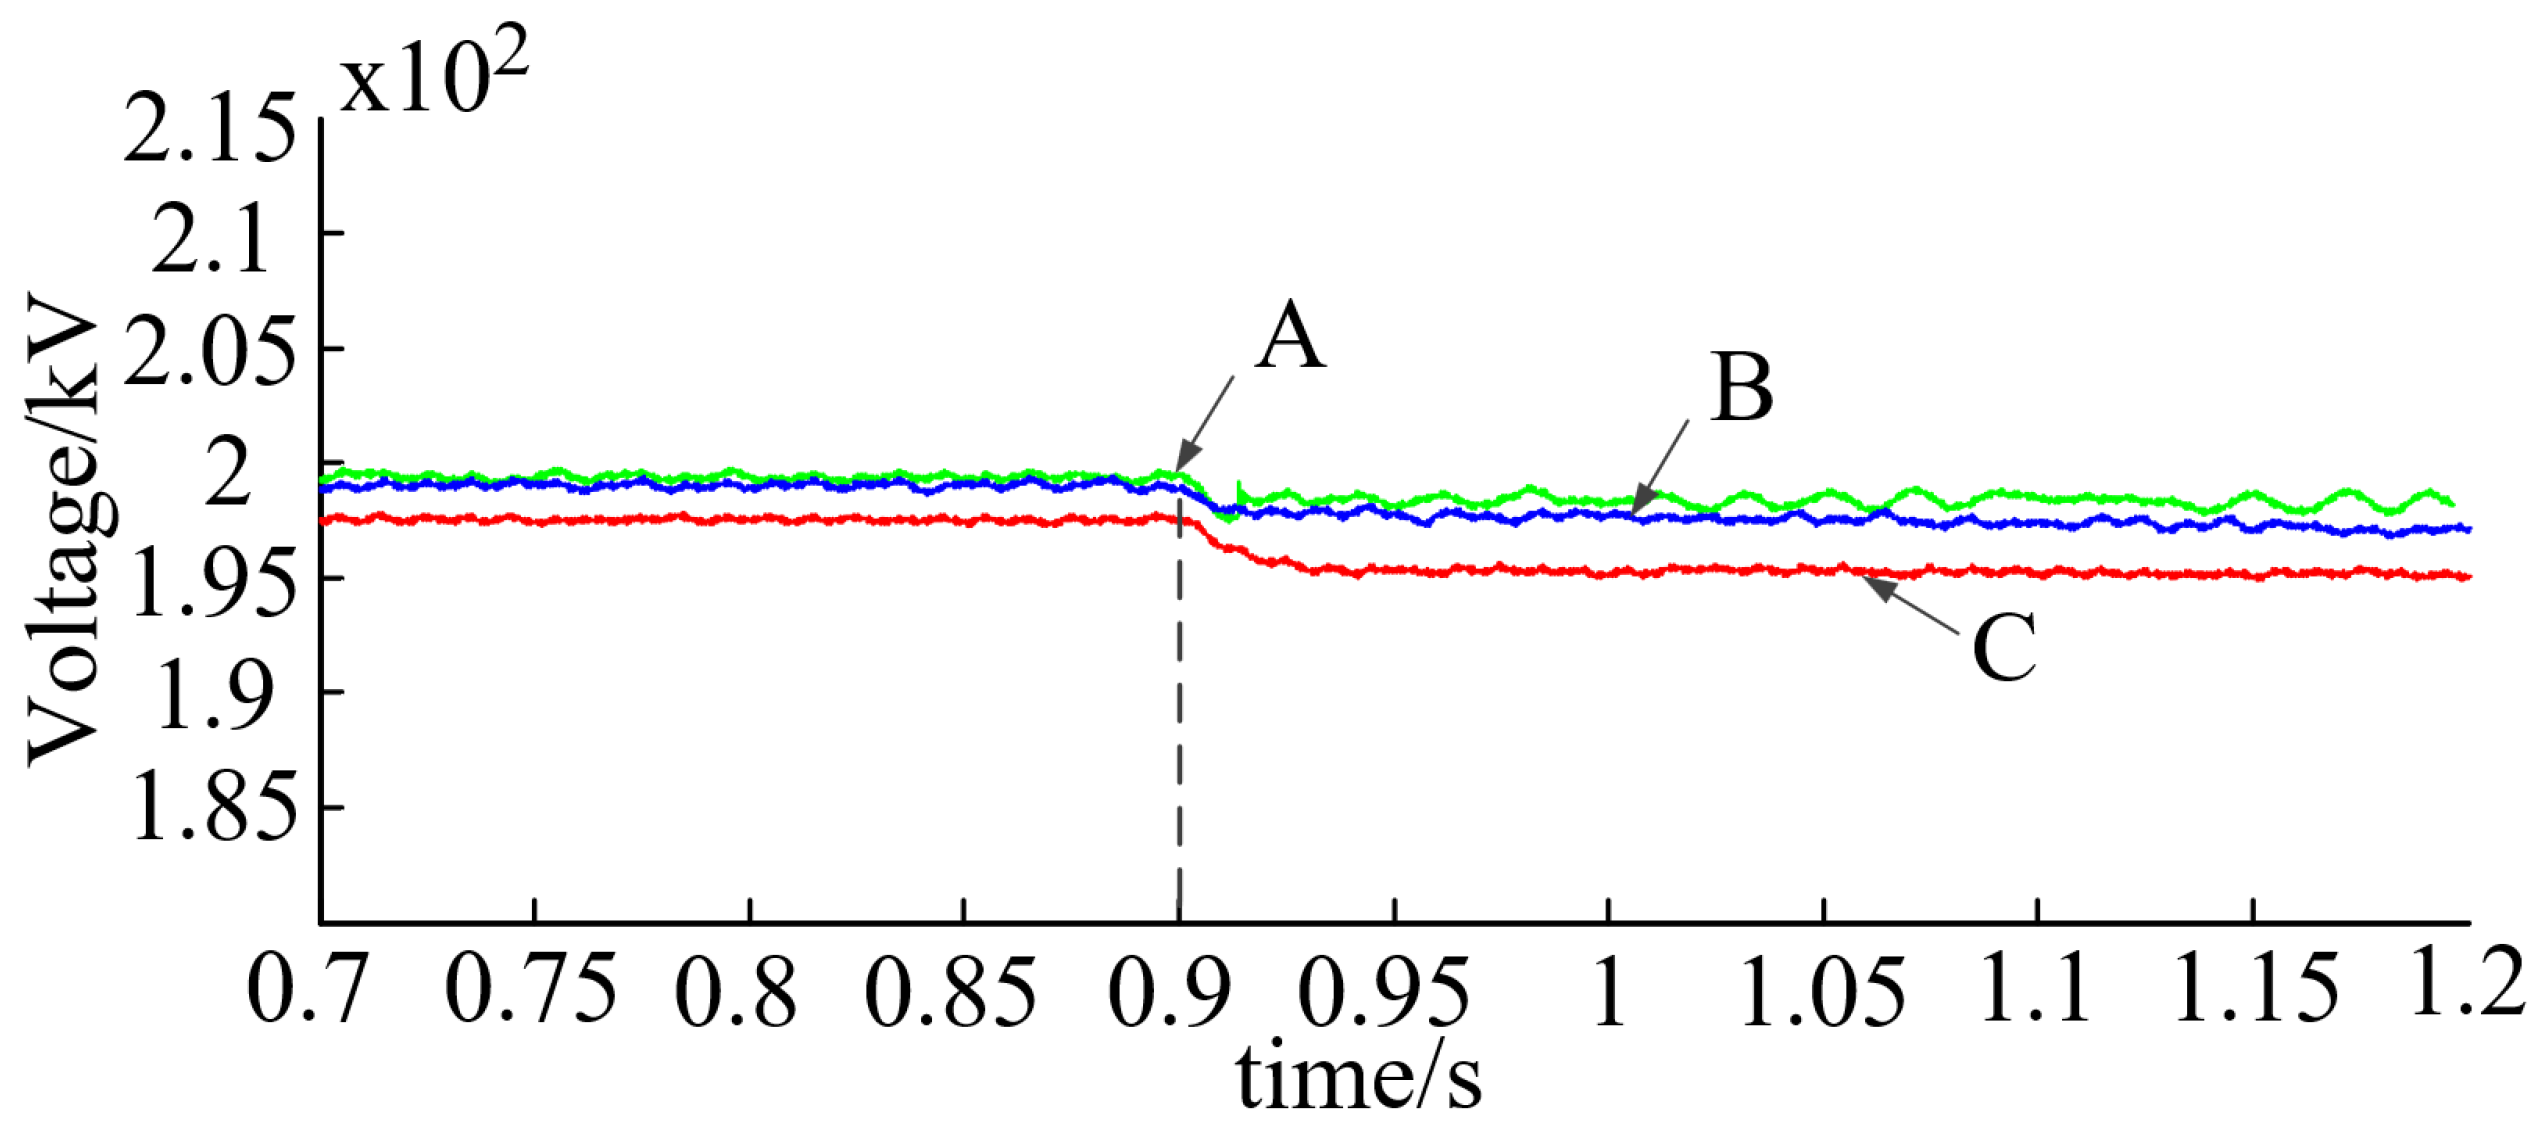
4.3. Three-Terminal System N-1 Verification

The N-1 operation of the VSC-MTDC system means that after any converter station is removed due to a fault, the rest of the system maintains stable operation. In order to verify the application reliability of the proposed adaptive exponential droop control strategy in the VSC-MTDC system as well as its superiority compared with other droop control strategies, the simulation was set to cut off the VSC1 converter at 0.9 s in order to check the line voltage deviation.
Figure 15 is the adaptive exponential droop control of the DC current of each side converter when VSC1 de-runs. When VSC1 de-runs, the power of VSC1 at the sending end is 0 at this time, and the transmission power of VSC2 gradually reaches the maximum until it is twice the original value. Furthermore, in the process of VSC2 power rising, VSC3 power first decreases and then gradually increases to the original due to the influence of nonlinear control. Figure 16 shows the line voltage during N-1 operation under the three control strategies. According to the characteristics of the droop control curve, when the power of the converter on the droop control side increases, the corresponding line voltage will drop, but the deviation will stay within the allowable range so that it conforms to the VSC -MTDC system N-1 runs. Consequently, the reliability of the strategy in system application is verified.

5. Conclusions

Aiming at resolving the problems of large DC voltage deviation and the poor power distribution characteristics of converters caused by power fluctuations in MTDC systems, based on traditional droop control, this paper proposed an automatic control coefficient of droop control that uses power deviation through mathematical theory derivation. Finally, based on the three-terminal flexible HVDC transmission system built for this study, the advantages and disadvantages of the adaptive exponential droop control were verified according to the DC voltage and converter power simulation under different droop coefficients and different load power fluctuations.

Author Contributions

Conceptualization, J.L. (Jianying Li) and J.L. (Jianqi Li); Data curation, J.L. (Jianying Li) and J.W.; Formal analysis, M.Y. and Y.X.; Funding acquisition, J.L. (Jianying Li), J.L. (Jianqi Li) and Y.X.; Investigation, J.L. (Jianqi Li) and J.W.; Methodology, J.L. (Jianying Li) and M.Y.; Software, J.L. (Jianying Li), Y.X. and J.W.; Writing—original draft, J.L. (Jianying Li); Writing—review & editing, J.L. (Jianying Li), M.Y., J.L. (Jianqi Li) and Y.X. All authors have read and agreed to the published version of the manuscript.

Funding

This research was funded by the Program of the Natural Science Foundation of Hunan Province, grant number 2020JJ6061, 2021JJ30477; the Hunan Enterprise Science and Technology Commissioner program, grant number 2021GK5074; the Provincial and Municipal Joint Project of Hunan Natural Science Foundation, grant number 2021JJ50023; the Science and Technology Innovation Program of Hunan Province, grant number 2021GK2010; and the Scientific Research Project of Hunan University of Arts and Sciences, grant number 17BSQD29.

Conflicts of Interest

The author declares that there are no conflicts of interest that could be perceived as prejudicing the impartiality of the research reported.

References

  1. Dong, H.; Xu, Z.; Song, P.; Tang, G.; Xu, Q.; Sun, L. Optimized Power Redistribution of Offshore Wind Farms Integrated VSC-MTDC Transmissions After Onshore Converter Outage. IEEE Trans. Ind. Electron. 2017, 64, 8948–8958. [Google Scholar] [CrossRef]
  2. Wei, X.; Tang, G.; Wei, X.; Zhang, Z. Study of VSC-HVDC controller to mitigate voltage fluctuation caused by wind farm integration. Diangong Jishu Xuebao/Trans. China Electrotech. Soc. 2007, 22, 150–156. [Google Scholar]
  3. Sang, Y.; Yang, B.; Yao, W.; Jiang, L. Design and Implementation of Perturbation Observer based Robust Passivity-based Control for VSC-MTDC Systems Considering Offshore Wind Power Integration. IET Gener. Transm. Distrib. 2018, 12, 2415–2424. [Google Scholar] [CrossRef]
  4. Du, W.; Qian, F.; Wang, H. Method of Open-loop Modal Analysis for Examining the Sub-synchronous Interactions Introduced by VSC Control in a MTDC/AC System. IEEE Trans. Power Deliv. 2017, 33, 840–850. [Google Scholar] [CrossRef]
  5. Wu, W.; Wu, X.; Zhao, Y.; Wang, L.; Zhao, T.; Jing, L. An Improved Multiport DC Power Flow Controller for VSC-MTDC Grids. IEEE Access 2020, 8, 7573–7586. [Google Scholar] [CrossRef]
  6. Wang, W.; Yin, X.; Cao, Y.; Jiang, L.; Li, Y. A Distributed Cooperative Control Based on Consensus Protocol for VSC-MTDC Systems. IEEE Trans. Power Syst. 2021, 36, 2877–2890. [Google Scholar] [CrossRef]
  7. Dong, H.; Su, M.; Liu, K.; Zou, W. Mitigation Strategy of Subsynchronous Oscillation Based on Fractional-Order Sliding Mode Control for VSC-MTDC Systems with DFIG-Based Wind Farm Access. IEEE Access 2020, 8, 209242–209250. [Google Scholar] [CrossRef]
  8. Li, B.; Li, Q.; Wang, Y.; Wen, W.; Li, B.; Xu, L. A Novel Method to Determine Droop Coefficients of DC Voltage Control for VSC-MTDC System. IEEE Trans. Power Deliv. 2020, 35, 2475–2479. [Google Scholar] [CrossRef]
  9. Dierckxsens, C.; Srivastava, K.; Reza, M.; Cole, S.; Beerten, J.; Belmans, R. A distributed DC voltage control method for VSC MTDC systems. Electr. Power Syst. Res. 2012, 82, 54–58. [Google Scholar] [CrossRef]
  10. Li, B.; Li, Y.; He, J.; Wen, W. A Novel Single-Ended Transient-Voltage-Based Protection Strategy for Flexible DC Grid. IEEE Trans. Power Deliv. 2019, 34, 1925–1937. [Google Scholar] [CrossRef]
  11. Sayed, S.S.; Massoud, A.M. A generalized approach for design of contingency versatile DC voltage droop control in multi-terminal HVDC networks. Int. J. Electr. Power Energy Syst. 2021, 126, 106413. [Google Scholar] [CrossRef]
  12. Zhou, T.; Chen, Z.; Zhao, J.; Xu, C.; Teng, X. A novel electromechanical transient analysis technique of VSC-MTDC considering DC-PCC and its application to AC/DC hybrid system simulation. IEEE Access 2019, 7, 47011–47021. [Google Scholar] [CrossRef]
  13. Zhang, L.; Harnefors, L.; Nee, H.P. Modeling and control of VSC-HVDC links connected to island systems. IEEE Trans. Power Syst. 2010, 26, 783–793. [Google Scholar] [CrossRef]
  14. Lu, W.; Ooi, B.T. DC overvoltage control during loss of converter in multiterminal voltage-source converter-based HVDC (M-VSC-HVDC). IEEE Trans. Power Deliv. 2003, 18, 915–920. [Google Scholar]
  15. Haileselassie, T.M.; Uhlen, K. Impact of DC line voltage drops on power flow of MTDC using droop control. IEEE Trans. Power Syst. 2012, 27, 1441–1449. [Google Scholar] [CrossRef]
  16. Irnawan, R.; Silva, F.; Bak, C.L.; Lindefelt, A.M.; Alefragkis, A. A droop line tracking control for multi-terminal VSC-HVDC transmission system. Electr. Power Syst. Res. 2020, 179, 106055. [Google Scholar] [CrossRef]
  17. Song, S.; McCann, R.A.; Jang, G. Cost-based adaptive droop control strategy for VSC-MTDC system. IEEE Trans. Power Syst. 2020, 36, 659–669. [Google Scholar] [CrossRef]
  18. Wang, Y.; Wen, W.; Wang, C.; Liu, H.; Zhan, X.; Xiao, X. Adaptive Voltage Droop Method of Multiterminal VSC-HVDC Systems for DC Voltage Deviation and Power Sharing. IEEE Trans. Power Deliv. 2018, 34, 169–176. [Google Scholar]
  19. Xiao, L.; Xu, Z.; An, T.; Bian, Z. Improved Analytical Model for the Study of Steady State Performance of Droop-controlled VSC-MTDC Systems. IEEE Trans. Power Syst. 2016, 32, 2083–2093. [Google Scholar] [CrossRef]
  20. Pinto, R.T.; Bauer, P.; Rodrigues, S.F.; Wiggelinkhuizen, E.J.; Pierik, J.; Ferreira, B. A novel distributed direct-voltage control strategy for grid integration of offshore wind energy systems through MTDC network. IEEE Trans. Ind. Electron. 2012, 60, 2429–2441. [Google Scholar] [CrossRef]
  21. Alavi, S.M.; Ghazi, R. A novel control strategy based on a look-up table for optimal operation of MTDC systems in post-contingency conditions. Prot. Control Mod. Power Syst. 2022, 7, 1–7. [Google Scholar] [CrossRef]
  22. Wang, Y.; Chen, Y.; Zeng, Q.; Li, J. Improed droop control strategy for VSC-MTDC. High Volt. Eng. 2018, 44, 3190–3196. [Google Scholar]
  23. Wu, W.; Chen, Y.; Zhou, L.; Zhou, X.; Yang, L.; Dong, Y.; Xie, Z.; Luo, A. A Virtual Phase-Lead Impedance Stability Control Strategy for the Maritime VSC–HVDC System. IEEE Trans. Ind. Inform. 2018, 14, 5475–5486. [Google Scholar] [CrossRef]
  24. Saif, M. An Improved Droop-Based Control Strategy for MT-HVDC Systems. Electronics 2020, 9, 87. [Google Scholar]
  25. Zhu, R.; Li, X.; Wu, F. A novel droop control strategy taking into account the available headroom for VSC-MTDC system. J. Sichuan Univ. Sci. Ed. 2015, 47, 137–143. [Google Scholar]
  26. Lun, Y.; Li, Y.; Wang, P. DC voltage adaptive droop control of multi-terminal HVDC systems. Proc. CSEE 2016, 36, 2588–2599. [Google Scholar]
  27. Han, M.; Xie, W.; Cao, W.; Zhang, W.; Yang, J. Application scenarios and system design of medium-voltage DC distribution network. Autom. Electr. Power Syst. 2019, 43, 81–93. [Google Scholar]
Figure 1. Block diagram of the outer loop control of the adaptive exponential droop control.
Electronics 11 02788 g001
Figure 2. Comparison of plane curves of three control strategies.
Electronics 11 02788 g002
Figure 3. Adaptive exponential droop control diagram.
Electronics 11 02788 g003
Figure 4. Root locus diagram of open-loop transfer function for adaptive exponential droop control.
Electronics 11 02788 g004
Figure 5. Model of a three-terminal radial VSC-MTDC.
Electronics 11 02788 g005
Figure 6. DC steady-state voltage under traditional droop control.
Electronics 11 02788 g006
Figure 7. DC steady-state voltage under adaptive droop control.
Electronics 11 02788 g007
Figure 8. DC steady-state voltage under adaptive exponential droop control.
Electronics 11 02788 g008
Figure 9. DC current of converter stations with load power varying from 240 to 400 MW.
Electronics 11 02788 g009
Figure 10. DC steady-state voltage with load power varying from 240 to 400 MW.
Electronics 11 02788 g010
Figure 11. DC current of converter stations with load power varying from 240 to 480 MW.
Electronics 11 02788 g011
Figure 12. DC steady-state voltage with load power varying from 240 to 480 MW.
Electronics 11 02788 g012
Figure 13. DC current of converter stations with load power varying from 240 to 600 MW.
Electronics 11 02788 g013
Figure 14. DC steady-state voltage with load power varying from 240 to 600 MW.
Electronics 11 02788 g014
Figure 15. DC current of converter stations after VSC1 outage.
Electronics 11 02788 g015
Figure 16. DC bus voltage after VSC1 outage.
Electronics 11 02788 g016
Table 1. Parameters of the simulation system.
No.Parameter NameParameter Value
1Outer ring proportional k p v 0.55
2Outer loop integral k i v 25
3Inner ring proportional k p i 2.5
4Inner loop integral k i i 20
5Sampling period T s 5 × 10⁻⁶ s
6DC side capacitance C2000 uF
7AC filter inductor L3 mH
8AC filter resistor R0.03 Ω
Table 2. Comparison table of simulation results with different droop coefficients.
Different Droop CoefficientsDC Side Steady-State Voltage (kV)
Traditional Droop ControlAdaptive Droop Control [26]Adaptive Exponential Droop Control
k 1 = 2 196.9197.9198.3
k 1 = 3 195.6197.1197.7
k 1 = 4 194.4196.4197.2
k 1 = 5 193.1195.7196.5
Table 3. Comparison table of calculation results with different droop coefficients.
Droop Coefficient Δ U dc 1 ( / kV ) Δ U dc 2 ( / kV ) Δ U dc 3 ( / kV ) η 1 ( / % ) η 2 / ( % )
k 1 = 2 3.12.11.732.2645.16
k 1 = 3 4.42.92.334.0947.73
k 1 = 4 5.63.62.835.7150
k 1 = 5 6.94.33.537.6849.28
Table 4. Comparison of simulation results with different load fluctuations.
VSC3 Active Power VariationDC Side Steady-State Voltage (kV)
Traditional Droop ControlAdaptive Droop Control [26]Adaptive Exponential Droop Control
240–400 MW195.8197.7198.2
240–480 MW195.0196.7197.4
240–600 MW193.8195.1196.2
Table 5. Comparison of calculation results with different load fluctuations.
VSC3 Active Power Variation Δ U dc 1 ( / kV ) Δ U dc 2 ( / kV ) Δ U dc 3 ( / kV ) η 1 ( / % ) η 2 ( / % )
240–400 MW4.22.31.845.2457.14
240–480 MW53.32.63448
240–600 MW6.24.93.820.9738.71
Publisher’s Note: MDPI stays neutral with regard to jurisdictional claims in published maps and institutional affiliations.

