Article

Development of a Low-Cost Portable Cluster for Numerical Weather Prediction

1
Research Center for Environmental Changes, Academia Sinica, Taipei 11529, Taiwan
2
Department of Military Meteorology, Air Force Institute of Technology, Kaohsiung 82047, Taiwan
*
Author to whom correspondence should be addressed.
Electronics 2022, 11(17), 2769; https://doi.org/10.3390/electronics11172769
Submission received: 17 August 2022 / Revised: 31 August 2022 / Accepted: 31 August 2022 / Published: 2 September 2022
(This article belongs to the Section Systems & Control Engineering)

Abstract

:
Numerical weather prediction (NWP) systems are crucial tools in atmospheric science education and weather forecasting, and high-performance computing (HPC) is essential for achieving such science. The goals of NWP systems are to simulate different scales of weather systems for educational purposes or to provide future weather information for operational purposes. Supercomputers have traditionally been used for NWP systems; however, supercomputers are expensive, have high power consumption, and are difficult to maintain and operate. In this study, the Raspberry Pi platform was used to develop an easily maintained high-performance NWP system with low cost and power consumption—the Improved Raspberry Pi WRF (IRPW). With 316 cores, the IRPW had a power consumption of 466 W and a performance of 200 Gflops at full load. IRPW successfully simulated a 48-h forecast with a resolution of 1 km and a domain of 32,000 km2 in 1.6 h. Thus, IRPW could be used in atmospheric science education or for local weather forecasting applications. Moreover, due to its small volume and low power consumption, it could be mounted to a portable weather observation system.

1. Introduction

Greater and greater computing resources are required in applied sciences (e.g., engineering, geophysics, and bioinformatics) [1]. High-performance parallel computing is required for processing large data sets, numerous variables, or complicated computations [2]. Parallel computing integrates independent computing resources into a coherent system that can achieve superior performance to conventional computing by executing numerous tasks in parallel [3]. Parallel computing is achieved with a message-passing interface (MPI) [4].
High-performance computing (HPC) is the technology that enables the high-speed processing of complex data. Some scholars have stated that HPC systems are limited by their power consumption [5]. However, the performance of these systems has continued to improve following Moore’s law, and due to the development of parallel computing; energy efficiency is no longer a major concern in HPC [6]. Aldana et al. (2019) stated that computing clusters could be used to sufficiently complete various computations if the nodes are inexpensive and energy-efficient [7].
Most daily activities are conducted via the internet in Industry 4.0, such as the Internet of Things (IoT). However, a high-performance, low-cost, and easily built web server is required if the original web server cannot satisfy the service demand of users. The Raspberry Pi is a small, inexpensive, and energy-efficient computing platform that can collect sensor data and perform computations. The platform can be used as an online server or sensor endpoint [8]. For example, Hadiwandra & Candra (2021) used the Raspberry Pi as an inexpensive yet high-performance web server with low power consumption [9].
Similarly, numerous scholars have investigated computing clusters assembled from Raspberry Pi and analyzed the performance of these clusters for various algorithms, core count, node count, costs, and power consumption [10,11,12,13,14,15]. Moreover, researchers have used Raspberry Pi in education and demonstrated that an interactive learning environment incorporating the platform increased student engagement in atmospheric or oceanic studies. The platform improved students’ conceptual understanding and affected their performance and career trajectory [16,17]. This result was consistent with those of other studies; providing a hands-on experience affected the learning of junior and senior high school students [18,19]. Foust (2022) used Raspberry Pi to install and configure atmospheric and climatic numerical models and built a graphical user interface to facilitate teaching and learning [20].
In addition to applications in education, the Raspberry Pi has also been used in IoT systems, such as for temperature and humidity monitoring, real-time weather monitoring [21], facial recognition and access control [22], and health monitoring [23], and home automation [24]. Collected data preprocessed by the Raspberry Pi can be input into machine learning models. For example, a support vector machine was used for facial recognition to assist law enforcement [25], a deep belief network was used to identify images of bridge cracks with an accuracy of ≥90% [26], and a naive Bayes model was used to reduce pests and improve agricultural production [27], unsupervised learning was used predict the probability of local rainfall [28]. The Random Kitchen Sink algorithm was used to improve the accuracy of label classification [29]. Raspberry Pi has also been used as a hardware or computing resource [30,31,32,33,34,35,36].
Numerical weather prediction (NWP) systems predict future atmospheric conditions by solving kinetic and physical equations. In NWP, data assimilation is often performed, in which predictions are compared with current observations to update the models [37]. For example, many studies have demonstrated that assimilating three-dimensional wind fields into NWP could improve weather phenomenon predictions [38,39,40,41]. However, data assimilation requires substantial computing resources. Therefore, international meteorological agencies such as the National Aeronautics and Space Administration (NASA), Japan Meteorological Agency, European Centre for Medium-Range Weather Forecasts, and Central Weather Bureau all use supercomputers for data assimilation.
The novelty of this study is the first to use the Raspberry Pi platform to assemble an NWP system that can assimilate three-dimensional wind fields. The system was portable, inexpensive, had low power consumption, and had high performance; schools or meteorological agencies could use it. The major contribution of this study is that it can be combined with the UPS system for various mobile observation devices because of being portable and easily moved to areas with power shortages (such as wilderness and ships) to meet the computing needs of multiple tasks (e.g., exercise weather forecasting). Furthermore, this system could be highly suitable for the needs of numerical weather prediction and education purposes.

2. Materials & Methods

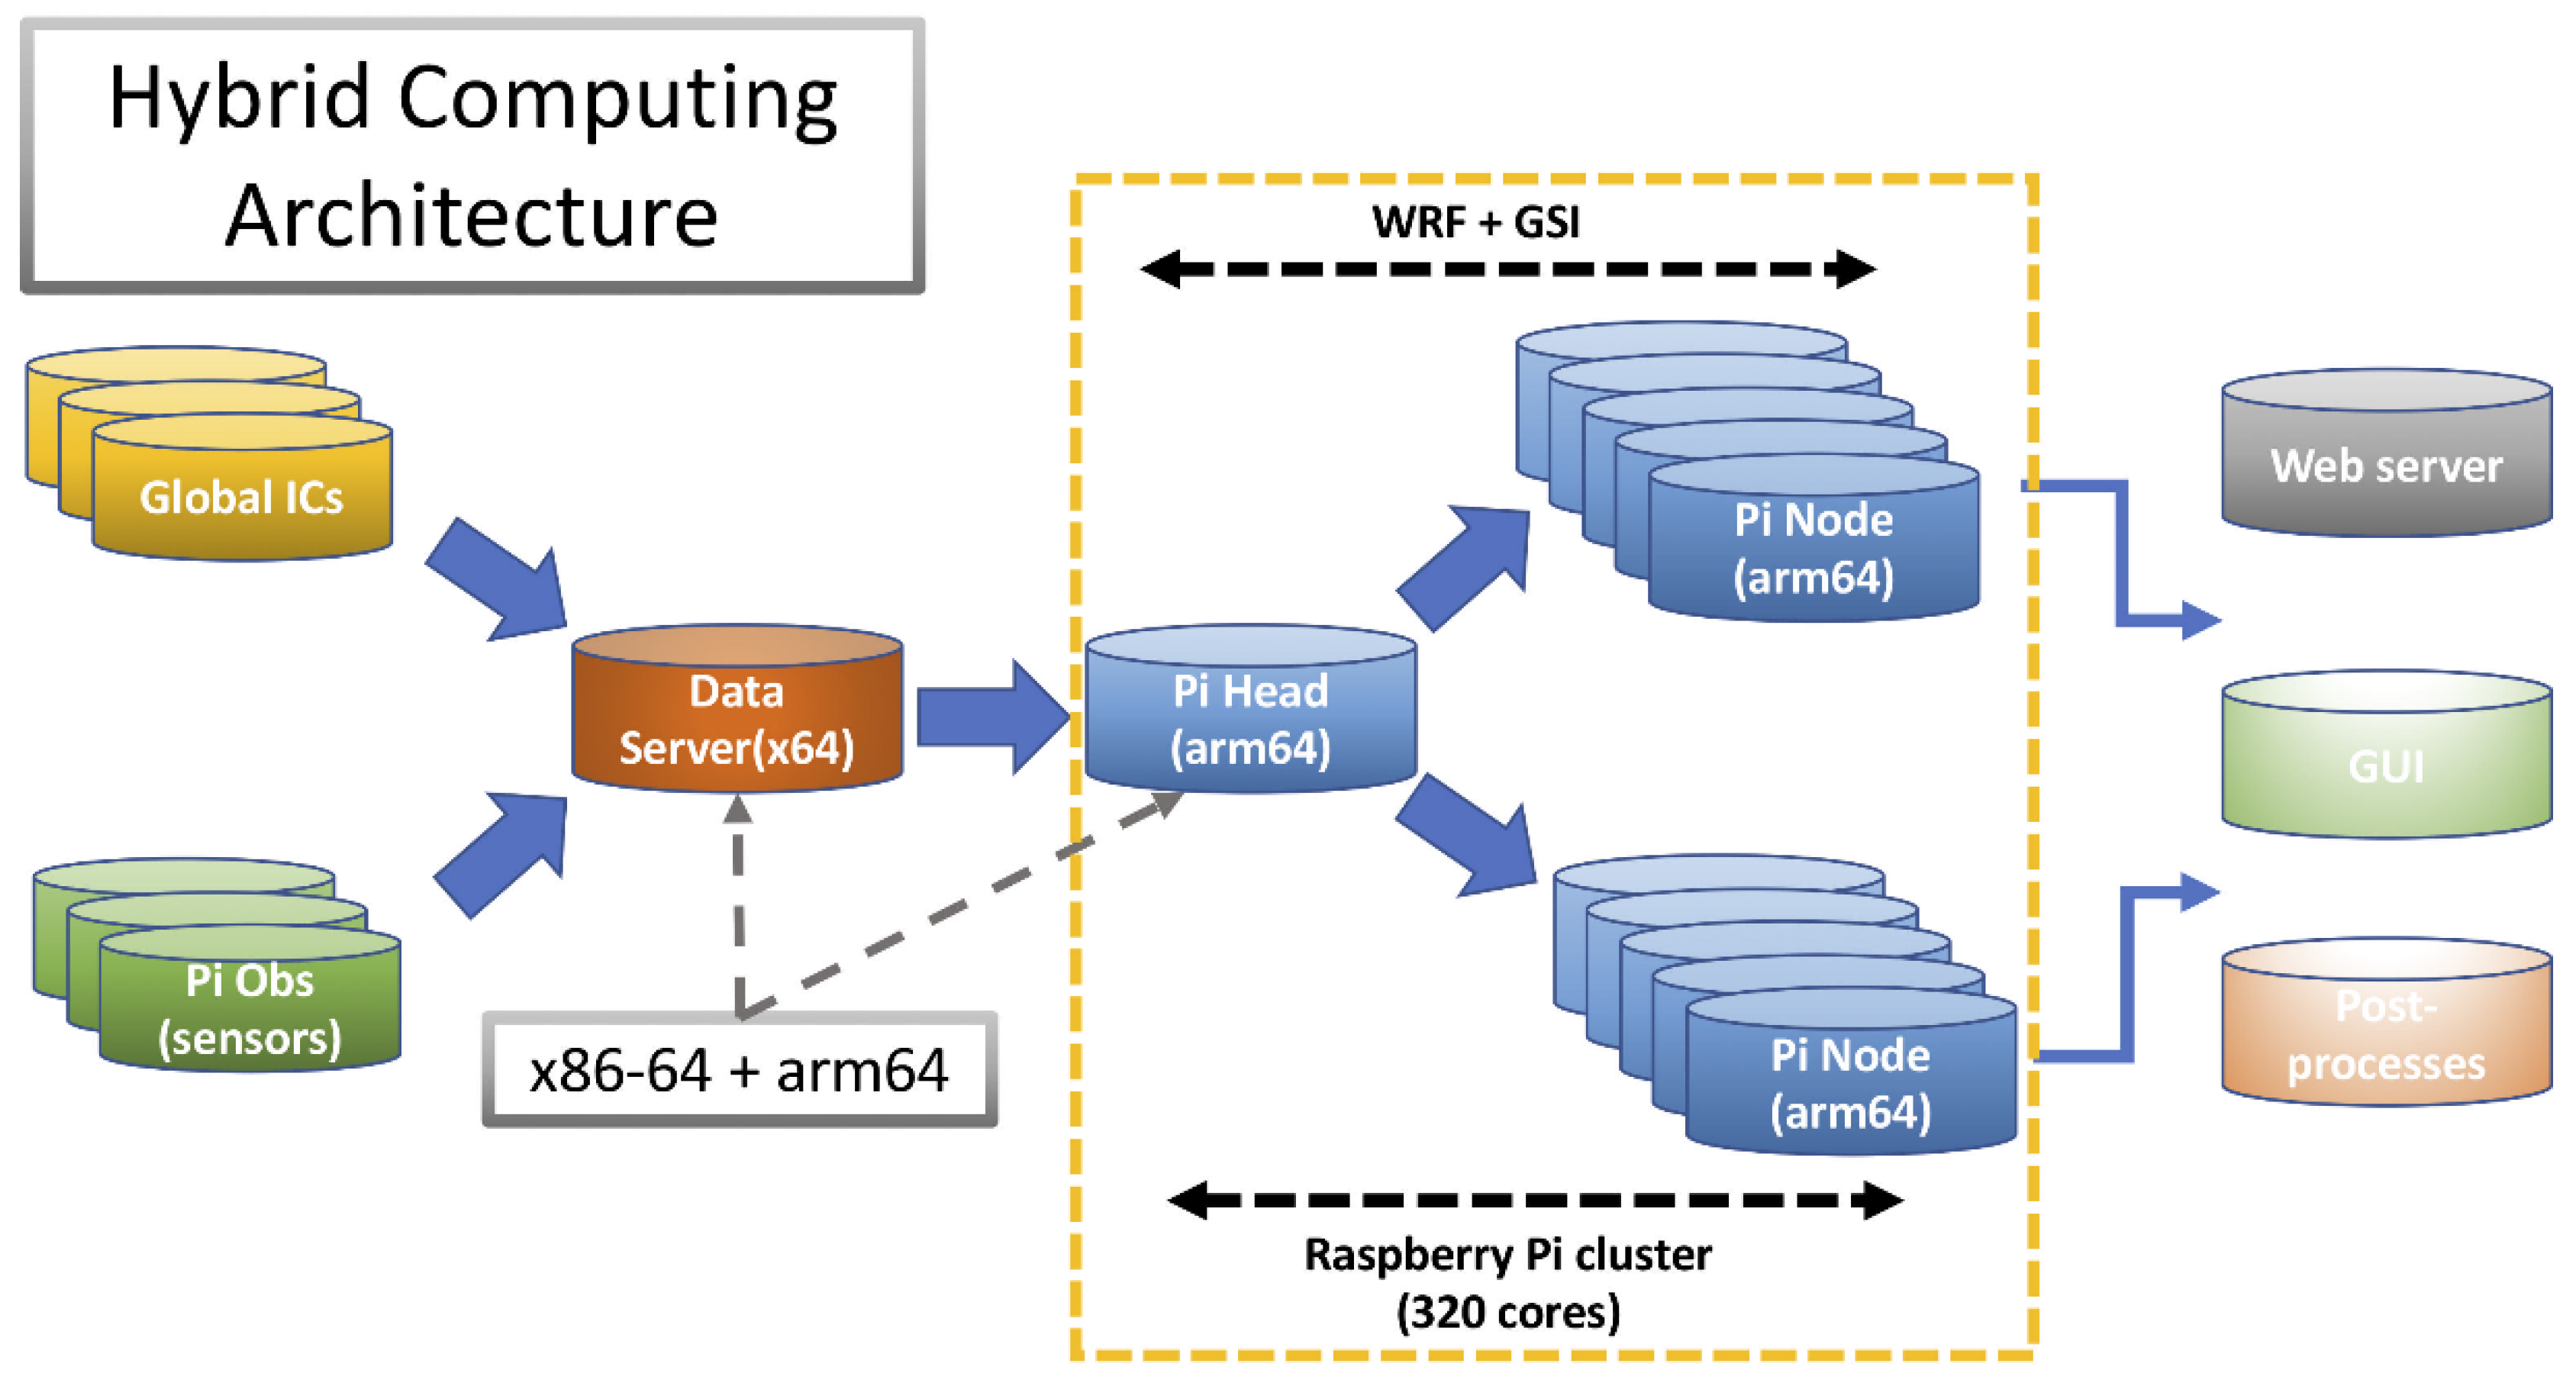
2.1. The Original Idea of the Potable NWP System

Supercomputers are expensive and large. Only governments, public institutions, or large companies can afford them. This study aimed to develop an affordable, small, and portable parallel computing system with a hybrid architecture that would be suitable for small institutions or schools with lower budgets. The system used the advanced data assimilation system of the University of California, Davis (UCD-WRF-GSI). The system architecture design is demonstrated in Figure 1. The system comprises one controller server, one x86-64 file server, and eighty Advanced RISC Machine (ARM) nodes.
The primary server was a Raspberry Pi 8GB that functioned as the network file system (NFS) server, the dynamic host configuration protocol (DHCP) server, and the compiler of the atmospheric model. The x86-64 file server performed preprocessing, postprocessing, and data storage; it also functioned as a web interface for the model. This architecture reduced the load on the master server. The primary function of the master server was the control of the ARM nodes.

2.2. Hardware Design and Implementation of Potable NWP System

Figure 2 presents images of the hardware. This single-board parallel computing system architecture produced by Oracle in 2019 (the largest in the world at the time) was used as a reference for designing a frame to support the Raspberry Pi nodes. The authors produced this frame from a 3D standard tessellation language file (STL) file (Figure 2a) on a three-dimensional (3D) printer (Figure 2b) with polylactic acid, which was selected because it is simple and easy to print, has a low warpage rate, and is nontoxic; however, it has low heat resistance. After putting the nodes in the frame (Figure 2c), it was placed in the standard server rack. Moreover, all the necessary software was installed (Figure 2d), and the network switch and file server were connected (Figure 2e).
Initially, the eight Raspberry Pi nodes were installed in an eight standard unit (8U) rack. However, the excessive heat caused the frame to deform. This study divided the system into 8U, and 6U racks with 40 nodes each and six 120-mm 2000-rpm fans (Figure 2f). The system did not overheat in this configuration (ensuring that the system functioned normally and protected the three-dimensional printing components) and had increased flexibility. Those two racks could move for computations depending on the task requirements.
The 81 Raspberry Pi 4 Model B nodes used in this study all had ARMv8 (Cortex-A72) quad-core processors, 2 GB of DDR4 memory, gigabit ethernet, and a USB3.0 port. Each node required 5 V and 1–3 A; the standby and maximum power consumption were 5 and 15 W, respectively. Thus, the estimated maximum power consumption of the 80 Raspberry Pi nodes was 1200 W. This comparatively low power consumption was why the authors chose the Raspberry Pi for this application.

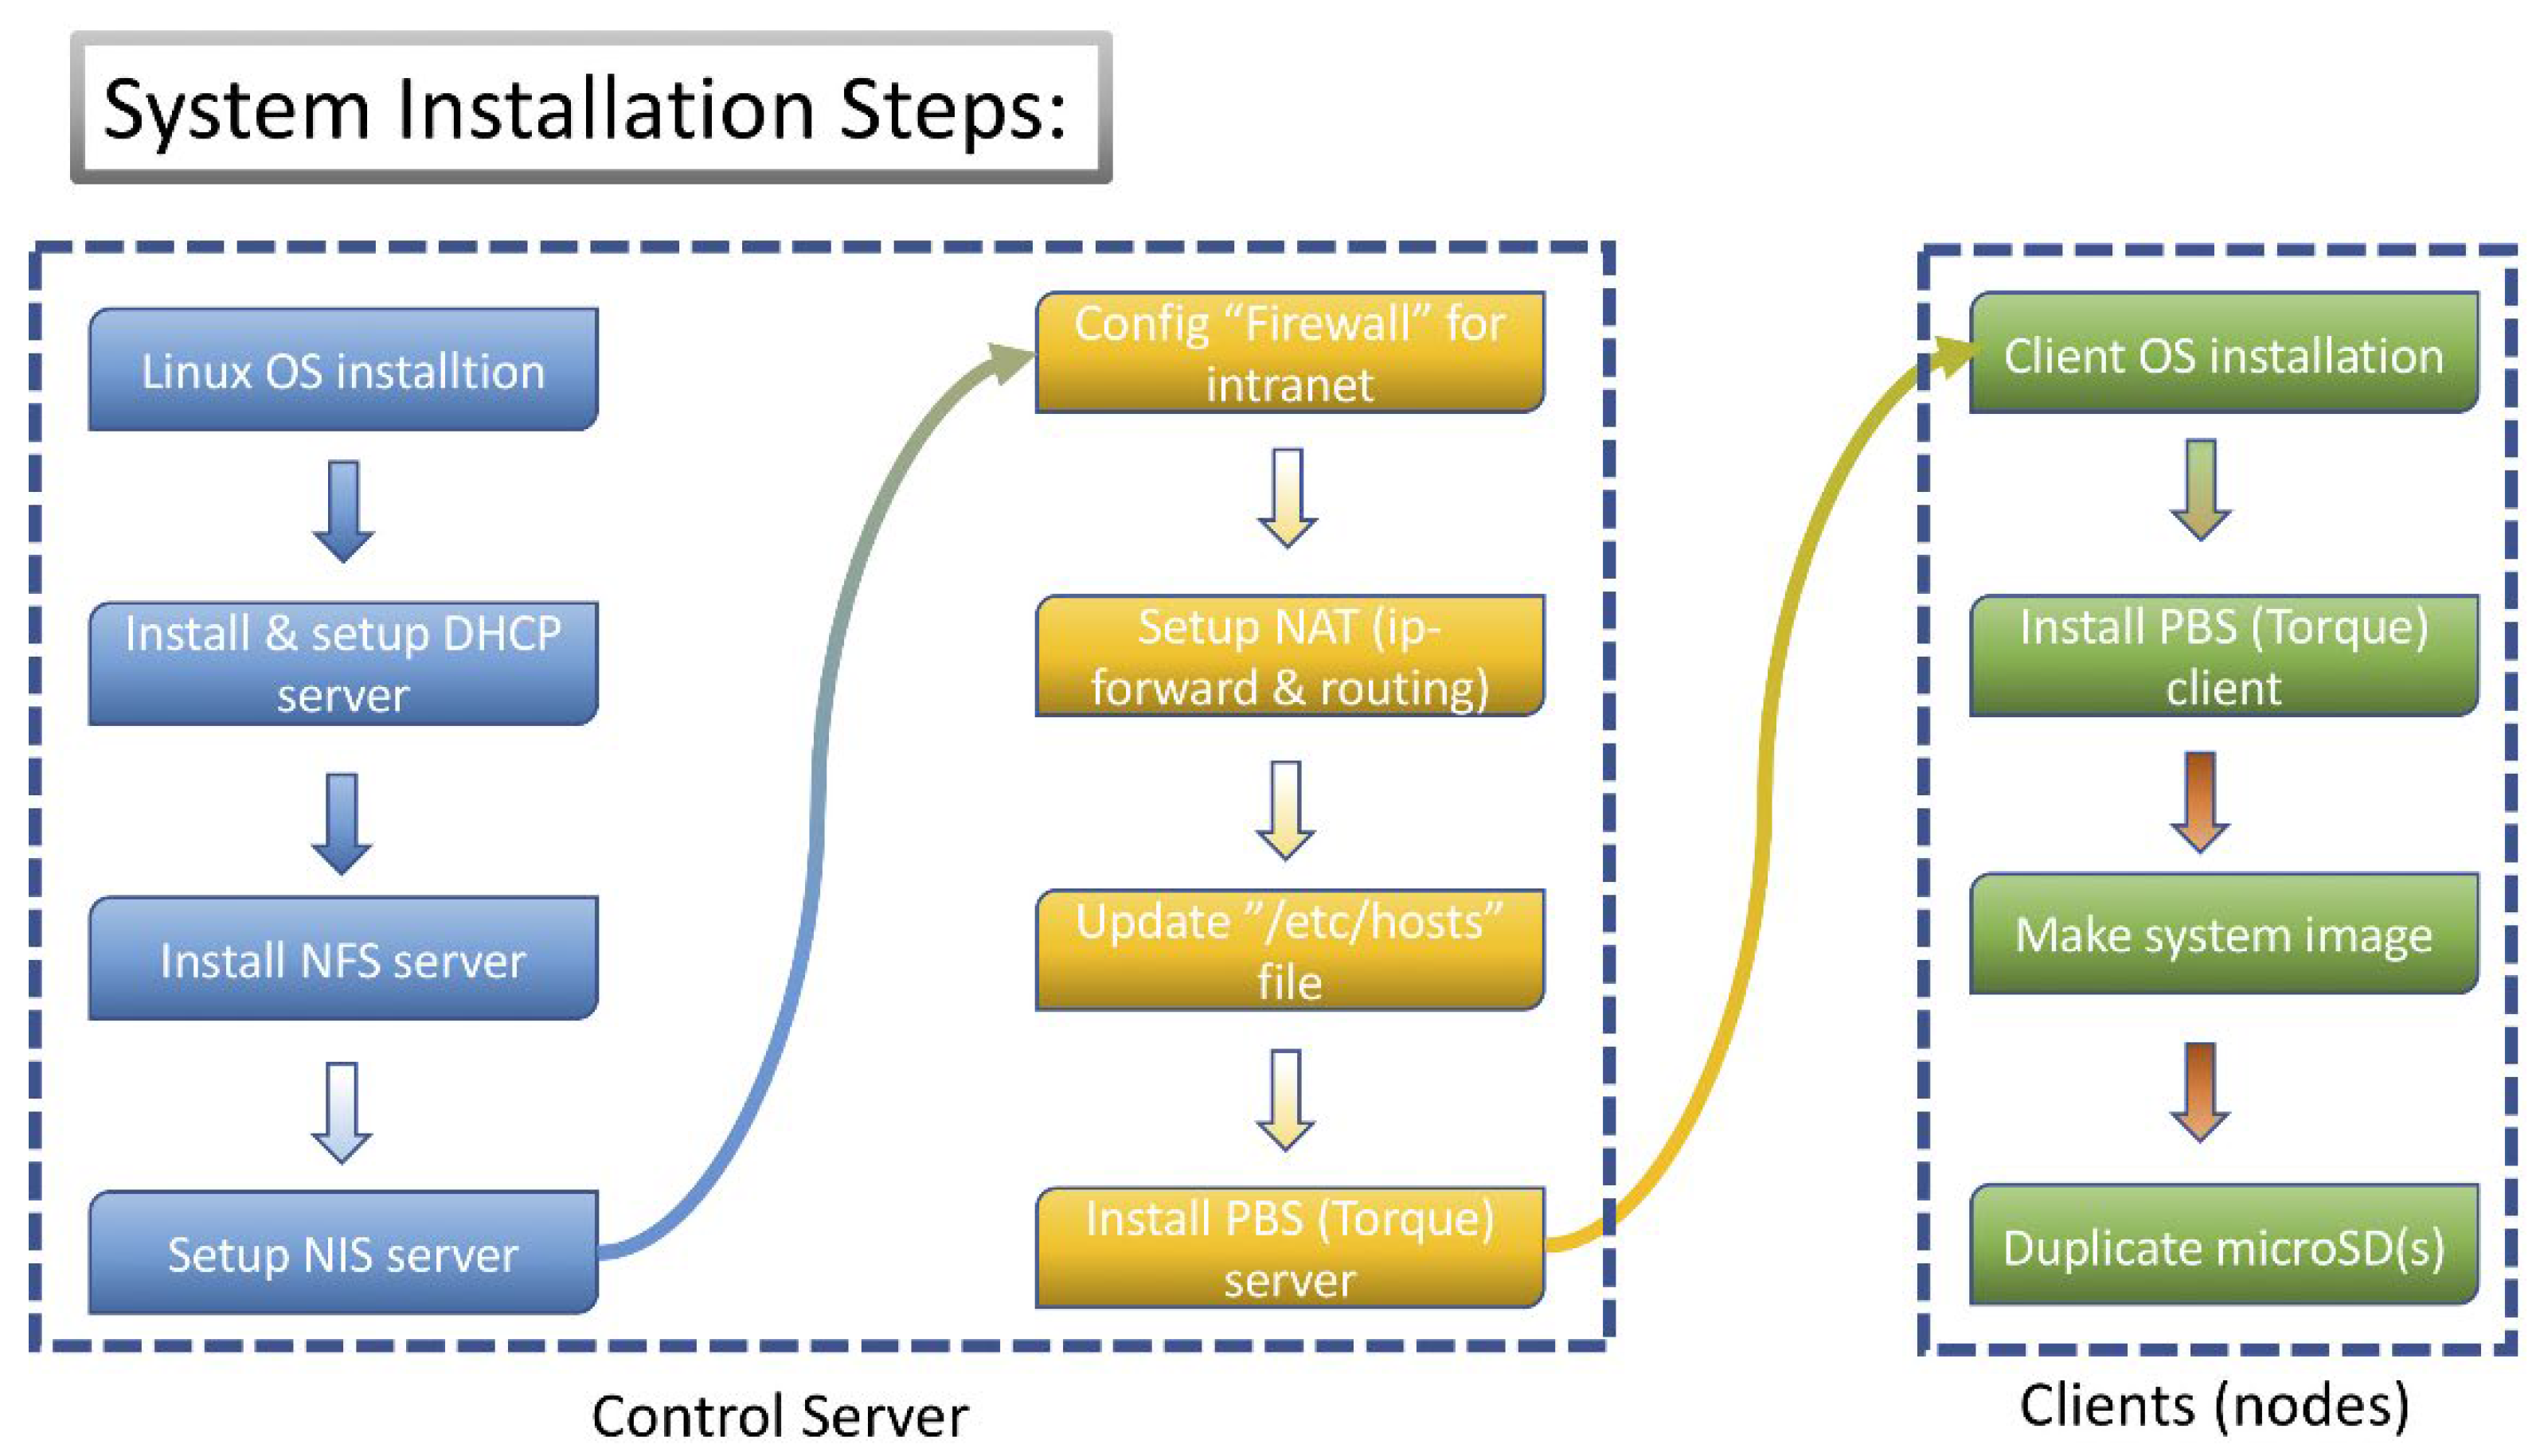
2.3. Software Development and Implementation of Potable NWP System

Figure 3 presents the operating system installation. First, the stable operating system Ubuntu-20.04-LTS was installed on the master server. Subsequently, the DHCP server, file server (using Network File Sharing, NFS), and network information service server were installed, and the firewall, network address translation (NAT), TORQUE server, and MPI chameleon (MPICH) were set up. The cluster had an external firewall, but the internal firewalls of each Raspberry Pi were disabled to enable data exchange, achieving parallel computing. The NAT service enabled us to prepare for future updates for computer nodes, systems, and software.
The file server was responsible for numerical simulation, data assimilation, preprocessing and postprocessing, and providing a graphical interface for users. Linux Mint 20.04-LTS-Xfce was installed on the file server. Next, MPICH, network common data form (NetCDF), and hierarchical data format five were installed. The weather research and forecasting (WRF) model and software required for data postprocessing, such as NCAR command language (NCL) and grads, were also installed.
Finally, the compute nodes were installed: NFS client, TORQUE mom, MPICH, and NetCDF. The nodes had a total of 320 cores. For quick installation, this study set up the first node and produced subsequent nodes by duplicating the microSD card of the first node.

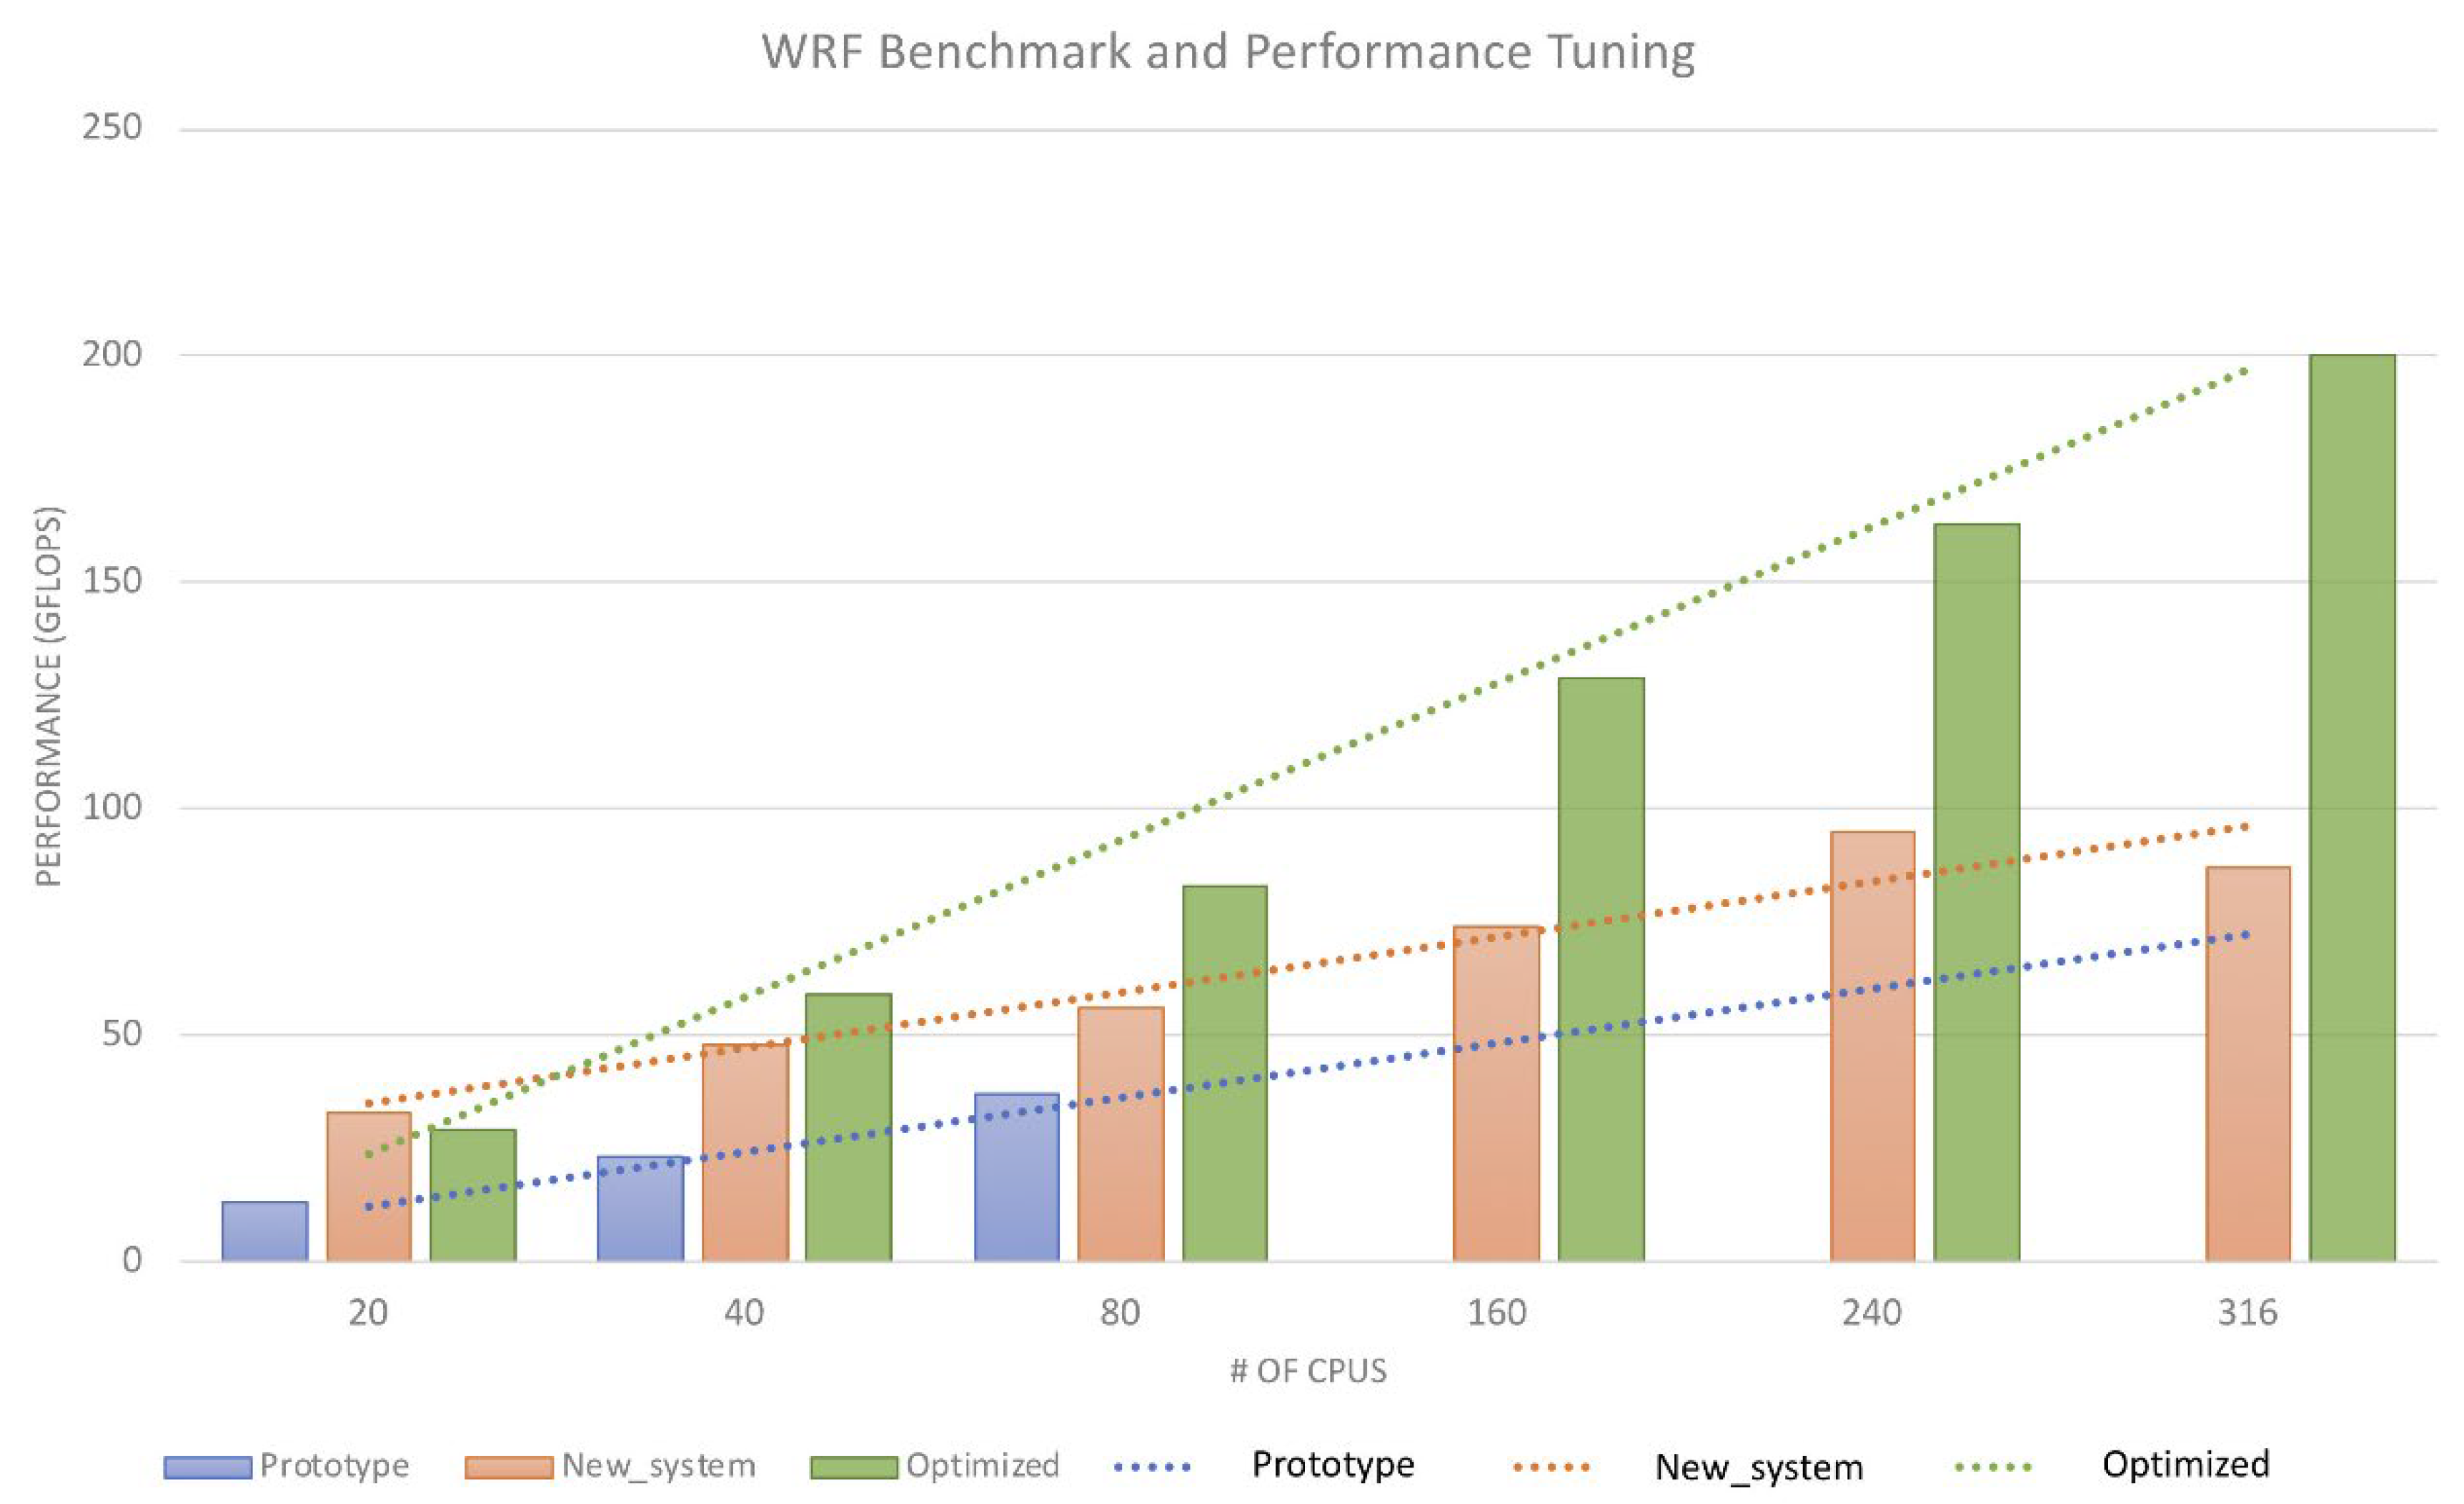
2.4. Strong Scalability

Computing clusters transmit and exchange parallel computing data over a network. In this study, two SGS-5240-48T4X Layer-2 stackable switches were used for networking. Each switch had 48 ports (96 total); up to 6 switches can be stacked at once, enabling the system’s expansion to up to 240 nodes. In other words, the system could support up to 960 cores if six switches were stacked. If the clustering function of the switch was used, up to 13 switches that supported 2080 cores could be used. Using the switch’s clustering function, a total of 13 switches supporting 520 nodes could be used. Therefore, the designed cluster has high scalability.

3. Optimization of WRF-GSI Calculation

3.1. WRF Model

WRF model v3.9.1 was downloaded from the website of the National Center for Atmospheric Research (NCAR) [42] and was installed on the Raspberry Pi NWP cluster (RPC). The RPC was tested, and its performance was tuned. The 0.5 × 0.5 atmospheric data of the National Centers for Environmental Prediction Global Forecast System was used for testing. The suggestions of NCAR were used for the test domain, which was set to East Asia. The spatial resolution was 15 km. The actual domain used to test the WRF model is presented in Figure 4a.
The parameterization of the WRF model is as follows: 1. Goddard Space Flight Center of NASA for cloud microphysics [43,44], 2. The Rapid Radiative Transfer Model for General Circulation Models developed by the Atmospheric and Environmental Research for short- and long-wave radiation [45], and 3. The ACM2 +PXSFCLAY + PXLSM was developed by the United States Environmental Protection Agency for the boundary layer and geophysics [46,47,48,49].

3.2. Gridpoint Statistical Interpolation Assimilation System

The data assimilation system was the UCD WRF-GSI HYBRID DA System developed by the University of California, Davis. The system integrates WRF [42] and gridpoint statistical interpolation (GSI) [50]; it is an automated numerical assimilation system that can update rapidly. The system was used in an experiment from 2016 to 2018 to improve wind prediction in California [51].
Figure 5 presents a diagram of the UCD-WRF-GSI data assimilation cycle. Global data assimilation system data were assimilated every 6 h during the assimilation interval. The observed data were assimilated differently depending on the experimental design. At least 30 min is required to form an adequate ensemble spread. Therefore, the data assimilation cycle using an ensemble Kalman filter (EnKF) must be conducted 2–3 days before the data assimilation experiment begins. For the three-dimensional vibrational (3DVAR) and HYBRID data assimilations, the assimilation interval was 3 h. To make consistency, the ensemble mean of the initial data assimilation time using EnKF was used as the initial value (background) for the data assimilation cycles using 3DVAR and HYBRID.

3.3. System Tuning

The system was tuned, and the model was optimized by modifying the system settings, WRF compilation, and program execution.
The wireless and Bluetooth functions of the Raspberry Pi were disabled, and the graphics processing unit memory was minimized (16 MB) to reduce power consumption and improve system performance. The WRF compiling process used hybrid parallel or dm + sm compiling; moreover, “configure.wrf” was modified by adding the flags “-Ofast -ffast-math” to increase the time step by approximately 20%, elevating performance. Finally, for execution, PBS (Torque) was used to push operations, and the hybrid model (OpenMP + MPI) was used to execute the computation script. The tuned system had increased performance for our model and likely has superior performance for future models.

4. Results

This study aimed to design a high-performance NWP system for schools and meteorological agencies that is portable with low power consumption and costs. Schools and teaching units require high-performance NWP for educational simulations of various weather systems. Meteorological agencies require real-time and precise forecasting (i.e., fast and high-resolution simulations).
WRF computation performance was analyzed for three systems: (1) The original Raspberry Pi WRF NWP system (RPW); (2) the optimized RPW (improved RPW, IRPW); and (3) the prototype WRF (PW).
The RPW and IRPW were described in the previous section. The PW was the SOPINE A64 compute module designed by Pine64 (https://pine64.org (accessed on 1 June 2018)). Each module had a quad-core ARM Cortex A53 64-bit processor produced by Allwinner A64 and 2GB of DDR3 memory. The modules were attached to the Clusterboard board developed by Pine64, which could support up to seven SOPINE A64 models and had a built-in switch and network chip. Thus, this board can be a foundation for a small parallel computing cluster system. The same version of WRF was installed on the PW and the RPW for testing.

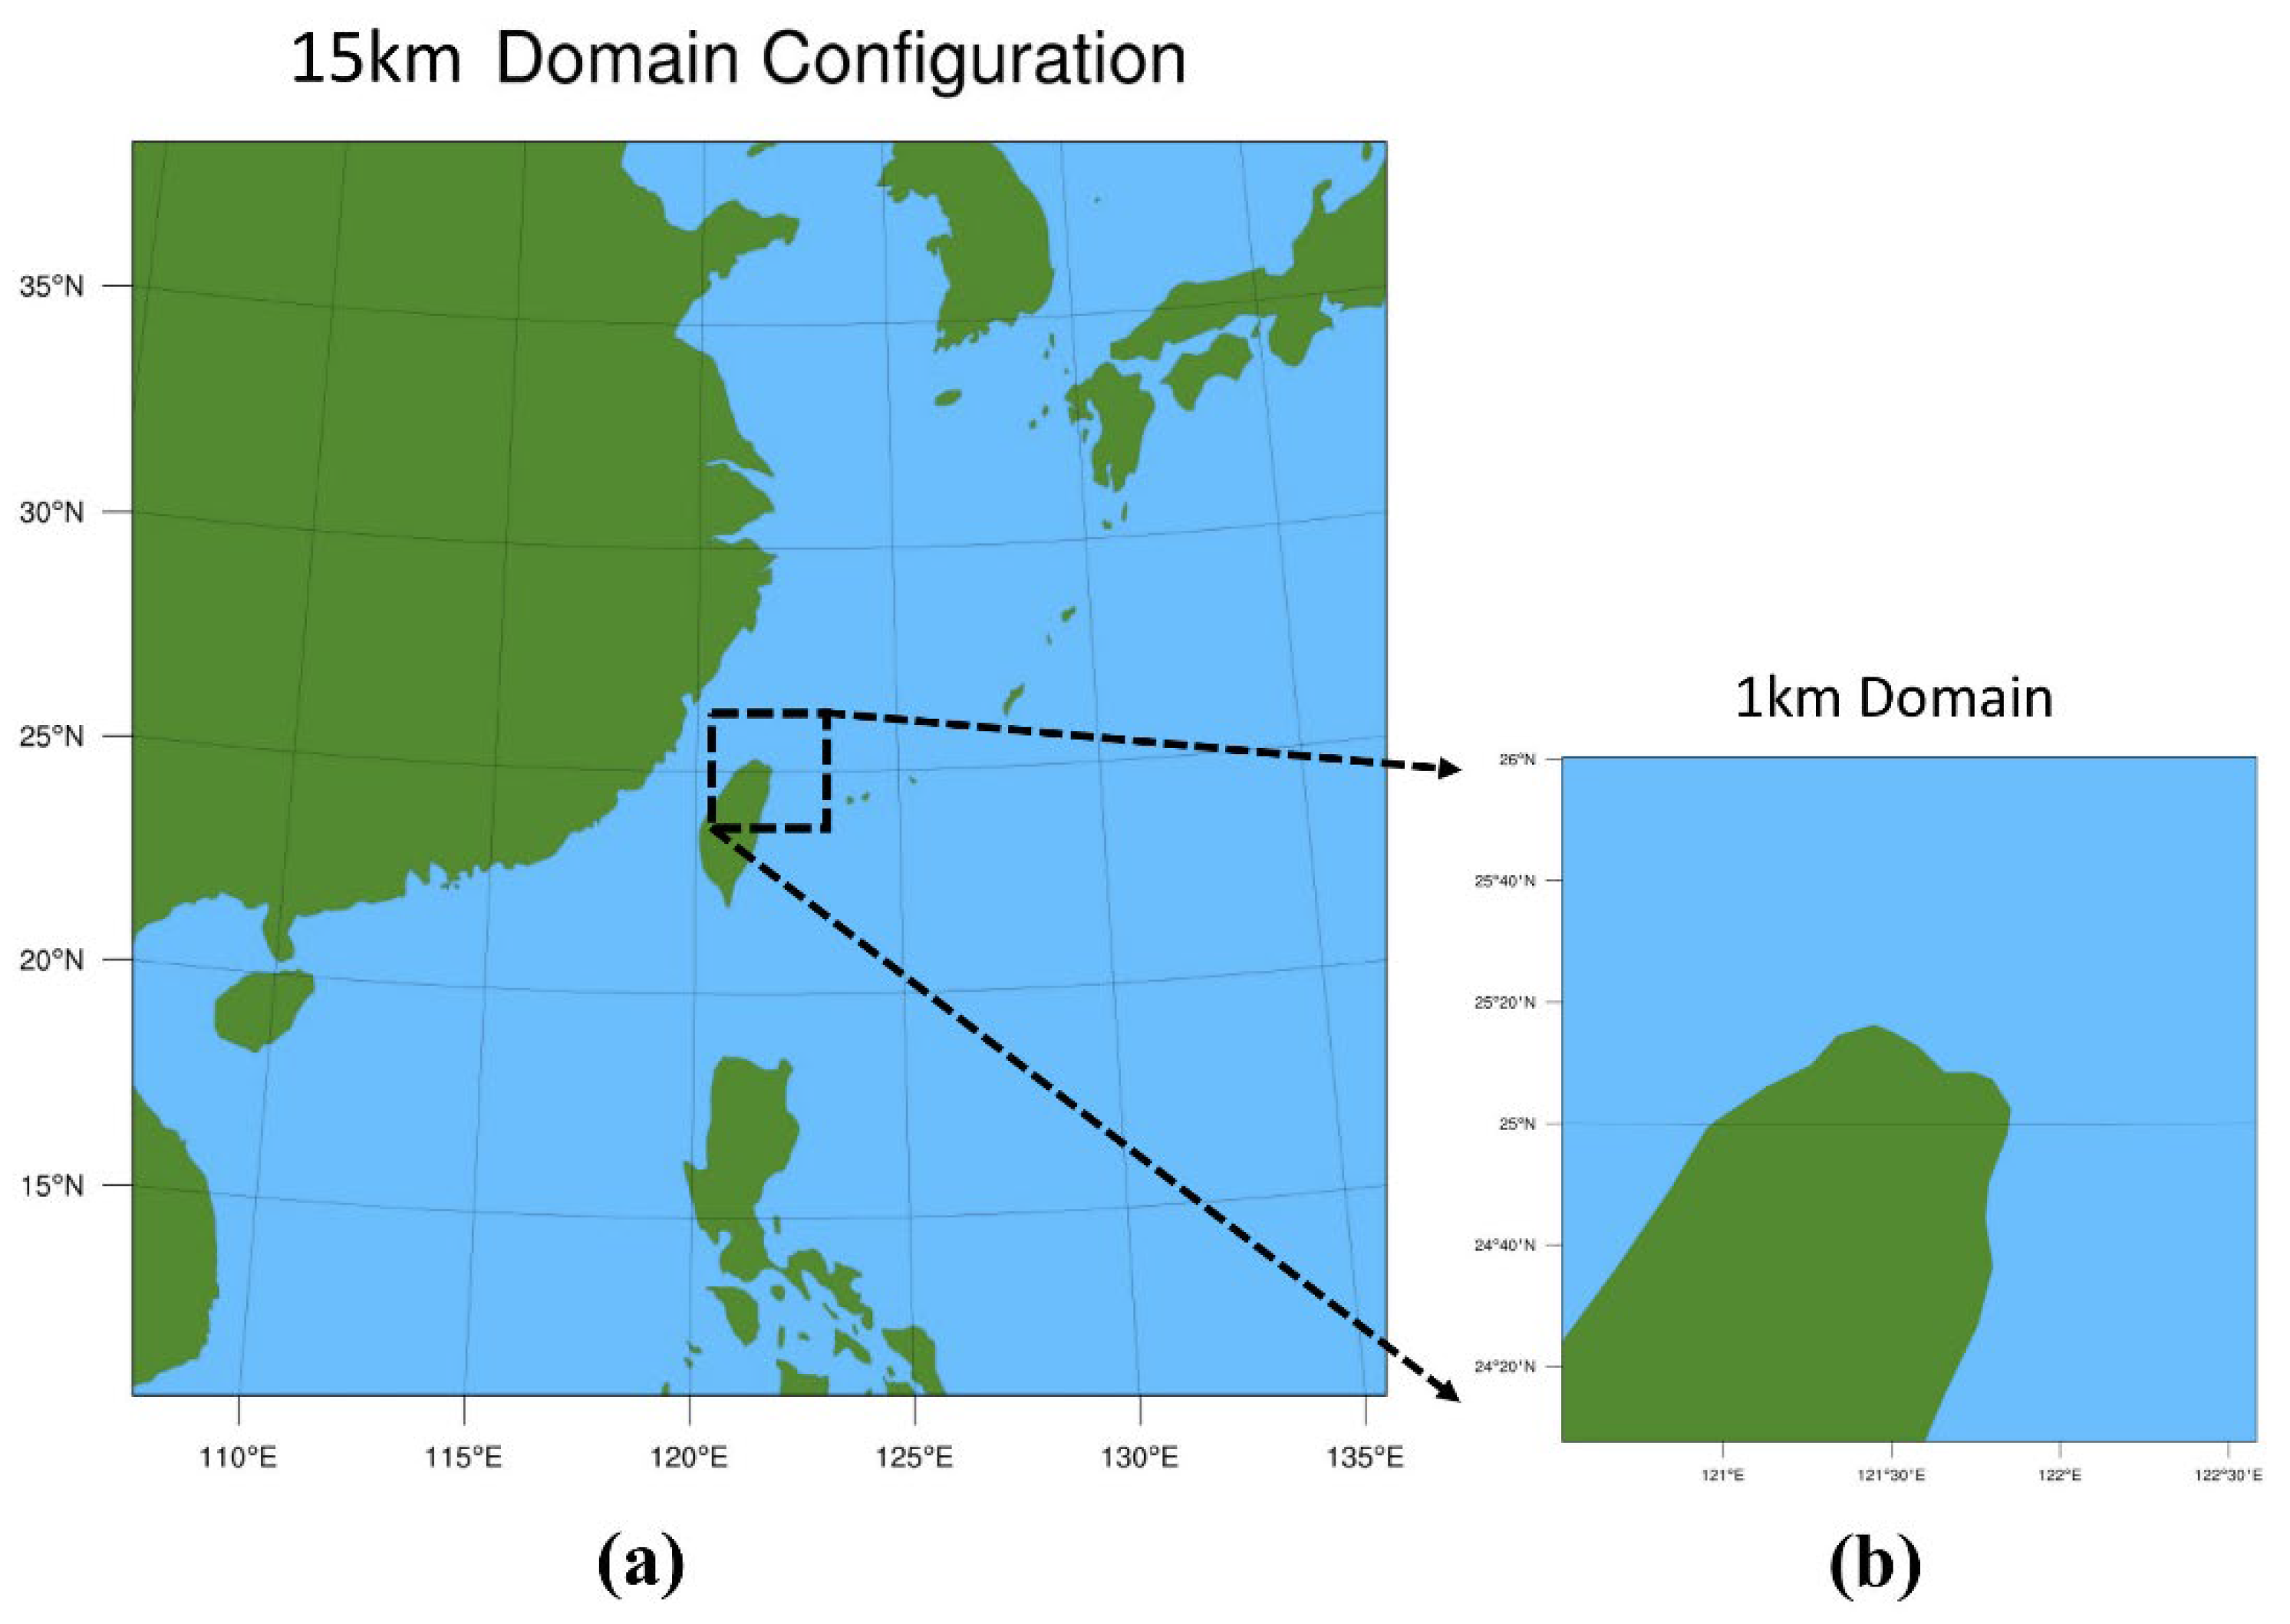
4.1. WRF Performance with 15-km Resolution

Figure 6 presents the performance of the three systems with various numbers of activated cores. Dotted lines indicate performance trends. Figure 6 reveals that doubling the number of PW cores increased its performance by approximately 33%. The maximum performance for PW was ≈25 Gflops with 80 cores. Figure 6 reveals that the results for RPW and PW were similar for <240 cores. The operational performance of PW and RPW improved by approximately 33% and 20%, respectively, as the number of CPUs increased. The maximum performance for RPW was ≈96 Gflops with 240 cores.
Two factors affect performance: network speed and processor performance. PW and RPW used gigabit networks with similar performance (~940 Mbps). The operational performance of PW and RPW improved by approximately 33% and 20%, respectively, as the number of CPUs increased. Thus, the performance of RPW was superior to that of PW with the same number of cores because the processor performance of RPW was higher than PW.
According to Figure 6, the performance of IRPW increased the most as the number of cores increased. If the number of cores was increased from 240 to 316, the performance of RPW decreased slightly. By contrast, IRPW increased to a maximum of approximately 200 Gflops. This performance is more than double that of RPW before tuning. The trends for PW (blue dotted line) and RPW (orange dotted line) are almost parallel, indicating that they both scaled similarly with core count. However, IRPW has superior scaling. The performance of the proposed optimized IRPW at a 15-km resolution was sufficient for the needs of atmospheric science education.

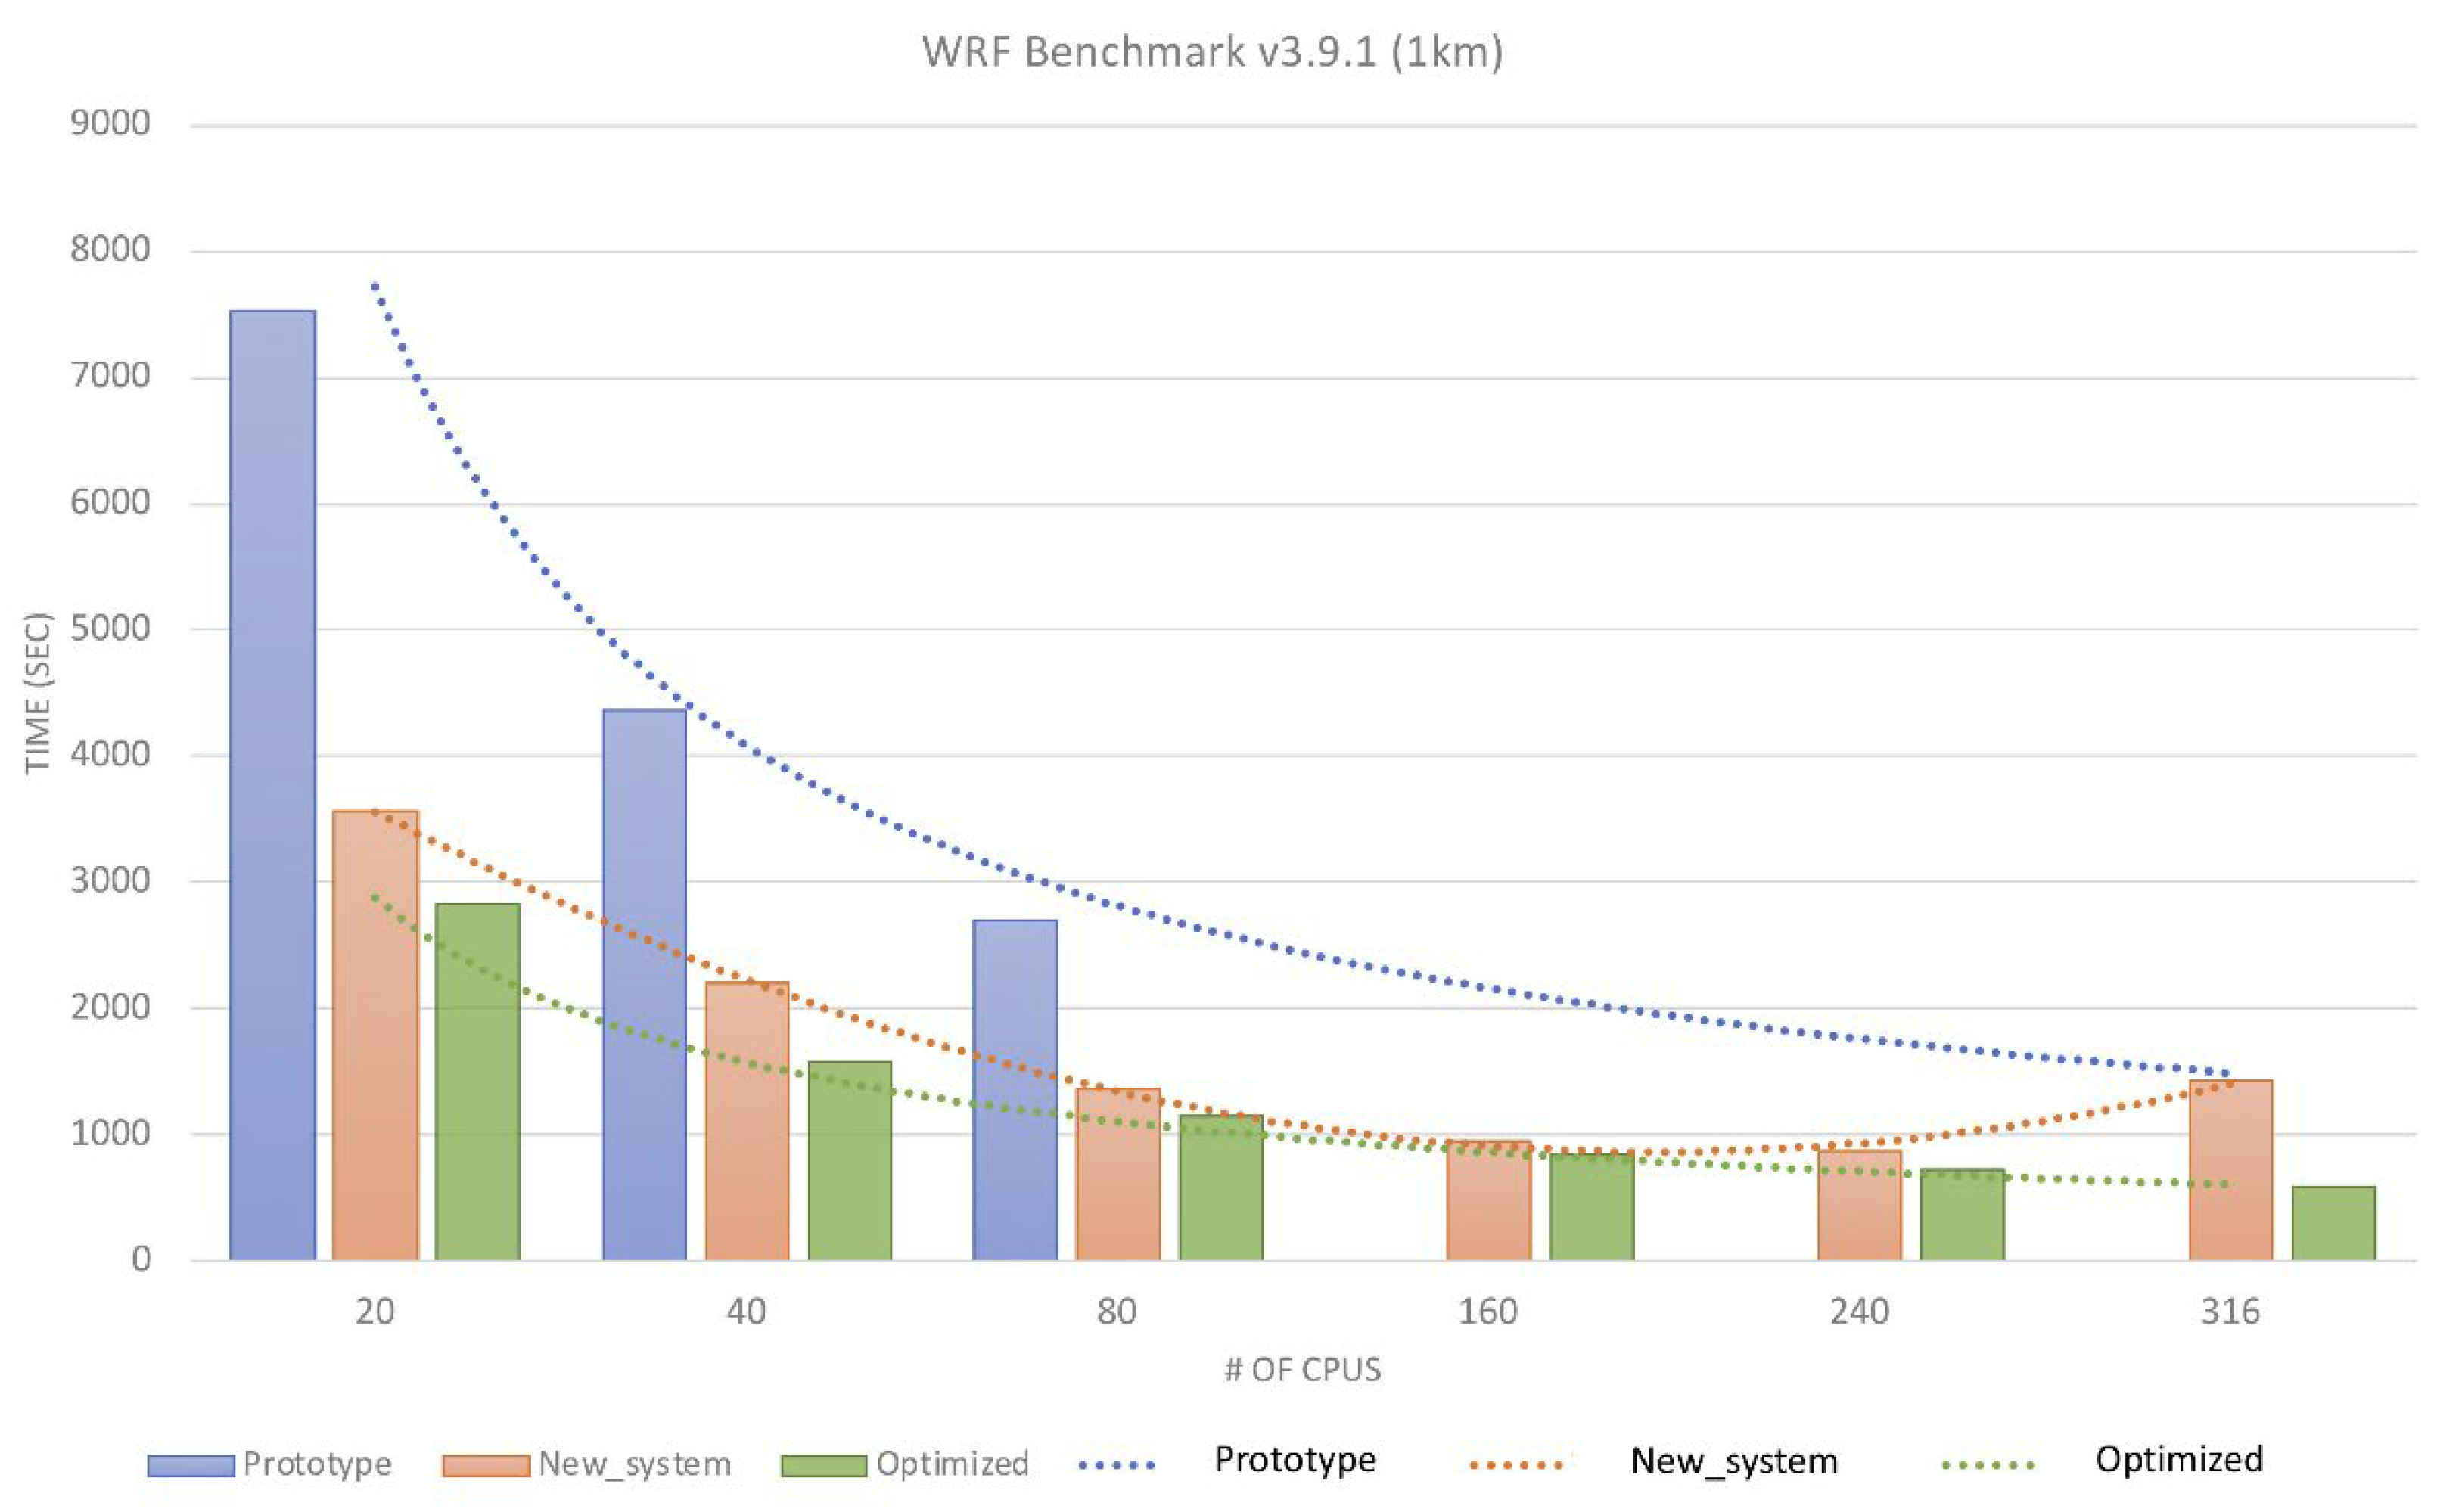
4.2. WRF Performance with 1-km Resolution

High-resolution (1 km) forecasting of the domain surrounding Songshan Airport was also performed to understand whether the developed system could be applied to actual weather forecasting. The domain was centered at Songshan Airport and had a radius of 180 km (Figure 4b). The three tested systems were the same as in the previous test. Figure 7 presents the time required for the three systems to complete the simulation. The simulation was set as a 3-h weather forecast following typical WRF performance testing.
Figure 7 reveals that the time required for simulation decreased as the number of cores increased for all three systems. PW had the longest simulation time, followed by RPW and IRPW, respectively. The time of PW was more than double that of RPW and IRPW, given the same number of cores. As for WRF performance (Figure 6) minimized the RPW time (approximately 1000 s) with 240 cores.
IRPW had the shortest times regardless of the number of cores. Increasing the number of cores to 316 decreased the time to simulate the 3-h forecast to approximately 600 s, suggesting that IRPW could complete a high-resolution 48-h forecast within 2.5 h. In an actual test, IRPW completed the forecast within 1.6 h. Thus, IRPW is not only suitable for academia but also has sufficient speed and resolution for use at airports.

4.3. Comparison of the System Specification

HPC is used by meteorological agencies worldwide. This study used the Raspberry Pi platform to construct a UCD-WRF-GSI numerical assimilation system. The system was an NWP system with a hybrid architecture. Table 1 presents system specifications, such as volume, weight, price, and power consumption, of the prototype SOPINE 64 (4 cores), 8U Raspberry Pi 4B (4 cores), and conventional HPC platforms such as the Asus RS100-e10, Xeon E2234, 4C, and 8HT. The total cost of a Pi cluster is about 1/3 or less than a current existing HPC system. This feature is suitable for budget-limit agencies (Table 1).
The 8U Raspberry Pi cluster included the computing nodes, switch, and x86-64 file server; its power consumption in standby mode and at full load was 188 W and 233 W, respectively. The power consumption of the 8U model was similar to that of the 6U model. Therefore, Table 1 only lists the specifications of the 8U model. The power consumption of the entire system (8U + 6U) in standby mode and at full load was 376 W (188 W × 2) and 466 W (233 W × 2), respectively, which are equivalent to the power consumption of a high-level desktop computer.
The prototype had the smallest volume and power consumption, the lightest weight, and the lowest price; however, it also had the lowest performance and longest integral time. Thus, the prototype was suitable for low-resolution simulations that are not real-time. The conventional HPC had the largest volume, heaviest weight, highest price, and highest power consumption. However, it also had the most superior performance. Therefore, it is suitable for weather forecasting agencies with sufficient funding. The Raspberry Pi NWP system designed by this study was less than one-third of the price and had one-twentieth of the power consumption of a conventional HPC. Moreover, the system was small, light, and thus suitable for small agencies or institutions requiring parallel computing. It can be used both in academia and for practical meteorology.
The operational performance and integral time can be used for academic purposes related to atmospheric science and for high-resolution real-time simulations by local airports. This method was the first time 80 micro single-board computers were used for parallel computing in Taiwan.

5. Conclusions

An NWP system provides weather forecasts using current weather conditions as input to a complex physical model. In general, HPC systems are used to achieve precise model solutions to weather forecasts with reduced uncertainty. However, these systems, their operation, and maintenance are expensive; thus, they are usually not affordable for educational applications or the funding limit agencies that have the calculation requirements for weather forecasting and applications.
In this study, approximately US $7000 was spent to construct a Raspberry Pi-based system with power consumption equivalent to a normal computer and a volume of 15.48 L. The system could be used for atmospheric science education and provide real-time local weather forecasting. This study explained in detail the hardware required to assemble the weather forecasting system mentioned above, the notices for the assembly, the sequence of assembly of the operating system, the installation method of WRF, the parameterization settings, and the GSI data assimilation cycle. A crucial contribution of this study was reducing the server’s power consumption. During the simulations, this study used hybrid parallel compiling and the hybrid model for computing to improve the system’s performance. In other words, the system tuning optimized the computation of this weather forecasting system. Moreover, the system was tuned to optimize its computation, improving forecasting performance and reducing power consumption.
The optimized model, IRPW, achieved 200 Gflops with a 15-km resolution with 316 cores—double the performance of RPW. Similarly, for a 1-km-resolution simulation, IRPW required only 600 s for a 3-h forecast with 316 cores. Moreover, the unoptimized RPW had performance losses as the number of CPUs increased, but the optimized model had a linear performance increase. From our test, IRPW completed a 48-h forecast with a 1-km resolution for a 32,000 km2 domain in less than 2 h.
In conclusion, this study successfully developed a small, high-performance NWP system with low cost, low power consumption, and simple operation and maintenance. IRPW can be applied in education or for actual forecasting. Due to the small volume, low power consumption, and portability of the system, it could be attached to observation devices such as portable lidar or a radar observation vehicle. It could be installed in places with lower power availability, such as the wilderness, for completing various computing tasks, such as weather forecasting, with the addition of undisrupted power supply systems.

Author Contributions

Conceptualization, C.-Y.C.; methodology, C.-Y.C. and N.-C.Y.; validation, C.-Y.C.; formal analysis, C.-Y.C. and N.-C.Y.; writing—original draft preparation, N.-C.Y.; writing—review and editing, N.-C.Y., C.-Y.C., Y.-C.C. and C.-Y.L.; funding acquisition, Y.-C.C. and C.-Y.L. All authors have read and agreed to the published version of the manuscript.

Funding

This research was funded by the MINISTRY OF SCIENCE AND TECHNOLOGY of Taiwan, grant numbers MOST 110-2111-M-344-001, 110-2111-M-001-013, 110-2811-M-001-573, and 111-2111-M-001-016.

Institutional Review Board Statement

Not applicable.

Informed Consent Statement

Not applicable.

Data Availability Statement

The data sets of GFS, GDAS, and GEFS used in this study are publicly available in the archives: GFS and GDAS: (NOAA Global Forecast System (GFS)—Registry of Open Data on AWS), accessed on 01 July 2021. GEFS: (NOAA Global Ensemble Forecast System (GEFS)—Registry of Open Data on AWS), accessed on 1 July 2021, respectively.

Acknowledgments

The authors would like to acknowledge the Air Force Weather Wing of Taiwan for providing the Doppler Wind Lidar data and support, respectively.

Conflicts of Interest

The authors declare no conflict of interest.

References

  1. Rajovic, N.; Rico, A.; Puzovic, N.; Adeniyi-Jones, C.; Ramírez, A. Tibidabo: Making the case for an ARM-based HPC system. Future Gener. Comput. Syst. 2014, 36, 322–334. [Google Scholar] [CrossRef]
  2. Schadt, E.; Linderman, M.; Sorenson, J.; Lee, L.; Nolan, G.P. Computational solutions to large-scale data management and analysis. Nat. Rev. Genet. 2010, 11, 647–657. [Google Scholar] [CrossRef] [PubMed]
  3. Lamport, L.; Lynch, N. Chapter on distributed computing. In Handbook of Theoretical Computer Science; Elsevier: Amsterdam, The Netherlands, 1990; pp. 1157–1199. [Google Scholar]
  4. Mitrović, D.; Marković, D.; Ranđić, S. Raspberry Pi Module Clustering and Cluster Application Capabilities. In Proceedings of the 7th International Scientific Conference Techniques and Informatics in Education Faculty of Technical Sciences, Čačak, Serbia, 25–27 May 2018; pp. 310–315. Available online: http://www.ftn.kg.ac.rs/konferencije/tie2018/Radovi%20TIE%202018/EN/4)%20Session%203%20-%20Engineering%20Education%20and%20Practice/S310_057.pdf (accessed on 2 January 2022).
  5. Mantovani, F.; Garcia-Gasulla, M.; Gracia, J.; Stafford, E.; Banchelli, F.; Josep-Fabrego, M.; Criado-Ledesma, J.; Nachtmann, M. Performance and energy consumption of HPC workloads on a cluster based on Arm ThunderX2 CPU. Future Gener. Comput. Syst. 2020, 112, 800–818. [Google Scholar] [CrossRef]
  6. Weloli, J.W.; Bilavarn, S.; Derradji, S.; Belleudy, C.; Lesmanne, S. Efficiency Modeling and Analysis of 64-bit ARM Clusters for HPC. In Proceedings of the 2016 Euromicro Conference on Digital System Design (DSD), Limassol, Cyprus, 31 August–2 September 2016; pp. 342–347. [Google Scholar] [CrossRef]
  7. Aldana, M.J.; Buitrago, J.A.; Gutiérrez, J.E. Evaluation of clusters based on systems on a chip for high-performance computing: A review. Rev. Ingenierías Univ. Medellín 2019, 19, 75–92. [Google Scholar] [CrossRef]
  8. Nugroho, S.; Widiyanto, A. Designing parallel computing using raspberry pi clusters for IoT servers on apache Hadoop. J. Phys. Conf. Ser. 2020, 1517, 012070. [Google Scholar] [CrossRef]
  9. Hadiwandra, T.Y.; Candra, F. High availability server using raspberry Pi 4 cluster and docker swarm. IT J. Res. Dev. 2021, 6, 43–51. [Google Scholar] [CrossRef]
  10. Gupta, N.; Brandt, S.R.; Wagle, B.; Wu, N.; Kheirkhahan, A.; Diehl, P.; Baumann, F.W.; Kaiser, H. Deploying a Task-based Runtime System on Raspberry Pi Clusters. In Proceedings of the 2020 IEEE/ACM Fifth International Workshop on Extreme Scale Programming Models and Middleware (ESPM2), Atlanta, GA, USA, 11 November 2020; pp. 11–20. [Google Scholar] [CrossRef]
  11. Myint, K.N.; Zaw, M.H.; Aung, W.T. Parallel and distributed computing using MPI on raspberry Pi cluster. Int. J. Future Comput. Commun. 2020, 9, 18–22. [Google Scholar] [CrossRef]
  12. Van Hai, P. Performance analysis of the supercomputer based on raspberry Pi nodes. J. Mil. Sci. Technol. 2021, 72A, 76–86. [Google Scholar]
  13. Saffran, J.; Garcia, G.; Souza, M.A.; Penna, P.H.; Castro, M.; Góes, L.F.; Freitas, H.C. A low-cost energy-efficient raspberry Pi cluster for data mining algorithms. In Euro-Par 2016: Parallel Processing Workshops. Euro-Par 2016; Lecture Notes in Computer Science; Desprez, F., Ed.; Springer: Cham, Switzerland, 2017; Volume 10104. [Google Scholar] [CrossRef] [Green Version]
  14. Marković, D.; Vujičić, D.; Mitrović, D.; Ranđić, S. Image processing on raspberry Pi cluster. Int. J. Electr. Eng. Comput. 2018, 2, 83–90. [Google Scholar] [CrossRef]
  15. Papakyriakou, D.; Kottou, D.; Kostouros, I. Benchmarking raspberry Pi 2 Beowulf cluster. Int. J. Comput. Appl. 2018, 179, 21–27. [Google Scholar] [CrossRef]
  16. Trott, C.D.; Sample McMeeking, L.B.; Bowker, C.L.; Boyd, K.J. Exploring the long-term academic and career impacts of undergraduate research in geoscience: A case study. J. Geosci. Educ. 2020, 68, 65–79. [Google Scholar] [CrossRef]
  17. Mackin, K.J.; Cook-Smith, N.; Illari, L.; Marshall, J.; Sadler, P. The effectiveness of rotating tank experiments in teaching undergraduate courses in atmospheres, oceans, and climate sciences. J. Geosci. Educ. 2012, 60, 67–82. [Google Scholar] [CrossRef]
  18. Dabney, K.P.; Tai, R.H.; Almarode, J.T.; Miller-Friedmann, J.L.; Sonnert, G.; Sadler, P.M.; Hazari, Z. Out-of-school time science activities and their association with career interest in stem. Int. J. Sci. Educ. 2012, 2, 63–79. [Google Scholar] [CrossRef]
  19. Sadler, P.M.; Sonnert, G.; Hazari, Z.; Tai, R. The role of advanced high school coursework in increasing STEM career interest. Sci. Educ. 2014, 23, 1–13. [Google Scholar]
  20. Foust, W.E. An informal introduction to numerical weather models with low-cost hardware. Bull. Am. Meteorol. Soc. 2022, 103, E17–E24. [Google Scholar] [CrossRef]
  21. Shewale, S.D.; Gaikwad, S.N. An IoT based real-time weather monitoring system using raspberry Pi. Int. Res. J. Eng. Technol. 2017, 4, 3313–3316. [Google Scholar]
  22. Patel, A.; Verma, A. IOT based facial recognition door access control home security system. Int. J. Comput. Appl. 2017, 172, 11–17. [Google Scholar] [CrossRef]
  23. Kaur, A.; Jasuja, A. Health monitoring based on IoT using Raspberry PI. In Proceedings of the IEEE International Conference on Computing, Communication and Automation (ICCCA), Greater Noida, India, 5–6 May 2017; pp. 1335–1340. [Google Scholar]
  24. Joshi, J.; Rajapriya, V.; Rahul, S.R.; Kumar, P.; Polepally, S.; Samineni, R.; Tej, D.K. Performance Enhancement and IoT Based Monitoring for Smart Home. In Proceedings of the International Conference on Information Networking, Da Nang, Vietnam, 11–13 January 2017; pp. 468–473. [Google Scholar]
  25. Sajjad, M.; Nasir, M.; Muhammad, K.; Khan, S.; Jan, Z.; Sangaiah, A.K.; Elhoseny, M.; Baik, S.W. Raspberry Pi assisted face recognition framework for enhanced law-enforcement services in smart cities. Future Gener. Comput. Syst. 2017, 108, 995–1007. [Google Scholar] [CrossRef]
  26. Wang, X.; Zhang, Y. The Detection and Recognition of Bridges’ Cracks Based on Deep Belief Network. In Proceedings of the IEEE International Conference on Computational Science and Engineering (CSE) and IEEE International Conference on Embedded and Ubiquitous Computing (EUC), Guangzhou, China, 22–23 July 2017; IEEE: Piscataway, NJ, USA, 2017; Volume 1, pp. 768–771. [Google Scholar] [CrossRef]
  27. Wani, H.; Ashtankar, N. An Appropriate Model Predicting Pest/Diseases of Crops Using Machine Learning Algorithms. In Proceedings of the IEEE International Conference on Advanced Computing and Communication Systems (ICACCS), Coimbatore, India, 6–7 January 2017; IEEE: Piscataway, NJ, USA, 2017; pp. 1–4. [Google Scholar]
  28. Xu, Z.; Pu, F.; Fang, X.; Fu, J. Raspberry pi based intelligent wireless sensor node for localized torrential rain monitoring. J. Sens. 2016, 2016, 4178079. [Google Scholar] [CrossRef] [Green Version]
  29. John, N.; Surya, R.; Ashwini, R.; Kumar, S.S.; Soman, K. A low cost implementation of multi-label classification algorithm using mathematica on raspberry Pi. Procedia Comput. Sci. 2015, 46, 306–313. [Google Scholar] [CrossRef]
  30. Moon, S.; Min, M.; Nam, J.; Park, J.; Lee, D.; Kim, D. Drowsy driving warning system based on gs1 standards with machine learning. In Proceedings of the IEEE International Congress on Big Data (BigData Congress), Honolulu, HI, USA, 25–30 June 2017; IEEE: Piscataway, NJ, USA, 2017; pp. 289–296. [Google Scholar] [CrossRef]
  31. Tripathy, R.; Daschoudhury, R. Real-time face detection and tracking using haar classifier on soc. Int. J. Electr. Comput. Eng. 2014, 3, 175–184. [Google Scholar]
  32. Senthilkumar, G.; Gopalakrishnan, K.; Kumar, V.S. Embedded image capturing system using raspberry pi system. Int. J. Emerg. Trends Technol. Comput. Sci. 2014, 3, 213–215. [Google Scholar]
  33. Baby, C.J.; Singh, H.; Srivastava, A.; Dhawan, R.; Mahalakshmi, P. Smart bin: An Intelligent Waste Alert and Prediction System Using Machine Learning Approach. In Proceedings of the IEEE International Conference on Wireless Communications, Signal Processing and Networking (WiSPNET), Chennai, India, 22–24 March 2017; IEEE: Piscataway, NJ, USA, 2017; pp. 771–774. [Google Scholar] [CrossRef]
  34. Zidek, K.; Pitel’, J.; Hošovský, A. Machine Learning Algorithms Implementation into Embedded Systems with Web Application User Interface. In Proceedings of the IEEE International Conference on Intelligent Engineering Systems (INES), Larnaca, Cyprus, 20–23 October 2017; IEEE: Piscataway, NJ, USA, 2017; pp. 000077–000082. [Google Scholar] [CrossRef]
  35. Tabbakha, N.E.; Tan, W.H.; Ooi, C.P. Indoor Location and Motion Tracking System for Elderly Assisted Living Home. In Proceedings of the IEEE International Conference on Robotics, Automation and Sciences (ICORAS), Melaka, Malaysia, 27–29 November 2017; IEEE: Piscataway, NJ, USA, 2017; pp. 1–4. [Google Scholar] [CrossRef]
  36. Sarangdhar, A.A.; Pawar, V. Machine learning regression technique for cotton leaf disease detection and controlling using IoT. In Proceedings of the IEEE International Conference of Electronics, Communication and Aerospace Technology (ICECA), Coimbatore, India, 20–22 April 2017; IEEE: Piscataway, NJ, USA, 2017; Volume 2, pp. 449–454. [Google Scholar] [CrossRef]
  37. Pu, Z.; Kalnay, E. Numerical Weather Prediction Basics: Models, Numerical Methods, and Data Assimilation. In Handbook of Hydrometeorological Ensemble Forecasting; Duan, Q., Pappenberger, F., Thielen, J., Wood, A., Cloke, H., Schaake, J., Eds.; Springer: Berlin/Heidelberg, Germany, 2018. [Google Scholar] [CrossRef]
  38. Tang, W.; Chan, P.W.; Haller, G. Lagrangian coherent structure analysis of terminal winds detected by lidar. Part I: Turbulence structures. J. Appl. Meteorol. Clim. 2011, 50, 325–338. [Google Scholar] [CrossRef]
  39. Zhang, L.; Pu, Z. Four-dimensional assimilation of multitime wind profiles over a single station and numerical simulation of a mesoscale convective system observed during IHOP_2002. Mon. Weather Rev. 2011, 139, 3369–3388. [Google Scholar] [CrossRef]
  40. Huang, X.Y.; Xiao, Q.; Barker, D.M.; Zhang, X.; Michalakes, J.; Huang, W.; Henderson, T.; Bray, J.; Chen, Y.; Ma, Z.; et al. Four-dimensional variational data assimilation for WRF: Formulation and preliminary results. Mon. Weather Rev. 2009, 137, 299–314. [Google Scholar] [CrossRef] [Green Version]
  41. Li, L.; Shao, A.; Zhang, K.; Ding, N.; Chan, P.-W. Low-level wind shear characteristics and lidar-based alerting at Lanzhou Zhongchuan International Airport, China. J. Meteorol. Res. 2020, 34, 633–645. [Google Scholar] [CrossRef]
  42. Skamarock, W.C.; Klemp, J.B.; Dudhia, J.; Gill, D.O.; Barker, D.M.; Duda, M.G.; Huang, X.Y.; Wang, W.; Powers, J.G. A Description of the Advanced Research WRF Version 3; NCAR Technical Notes NCAR/TN-475+STR: Boulder, CO, USA, 2008; p. 113. [Google Scholar] [CrossRef]
  43. Tao, W.K.; Simpson, J.; McCumber, M. An ice–water saturation adjustment. Mon. Weather Rev. 1989, 117, 231–235. [Google Scholar] [CrossRef]
  44. Tao, W.K.; Wu, D.; Lang, S.; Chern, J.D.; Peters-Lidard, C.; Fridlind, A.; Matsui, T. High-resolution NU-WRF simulations of a deep convective-precipitation system during MC3E: Further improvements and comparisons between Goddard microphysics schemes and observations. J. Geophys. Res. Atmos. 2016, 121, 1278–1305. [Google Scholar] [CrossRef]
  45. Iacono, M.J.; Delamere, J.S.; Mlawer, E.J.; Shephard, M.W.; Clough, S.A.; Collins, W.D. Radiative forcing by long–lived greenhouse gases: Calculations with the AER radiative transfer models. J. Geophys. Res. 2008, 113, D13103. [Google Scholar] [CrossRef]
  46. Nakanishi, M.; Niino, H. An improved Mellor–Yamada level 3 model: Its numerical stability and application to a regional prediction of advection fog. Bound. Layer Meteorol. 2006, 119, 397–407. [Google Scholar] [CrossRef]
  47. Nakanishi, M.; Niino, H. Development of an improved turbulence closure model for the atmospheric boundary layer. J. Meteorol. Soc. Jpn. 2009, 87, 895–912. [Google Scholar] [CrossRef]
  48. Pleim, J.E.; Xiu, A. Development and testing of a surface flux and planetary boundary layer model for application in mesoscale models. J. Appl. Meteorol. 1995, 34, 16–32. [Google Scholar] [CrossRef]
  49. Pleim, J.E.; Xiu, A. Development of a land surface model. Part II: Data assimilation. J. Appl. Meteorol. 2003, 42, 1811–1822. [Google Scholar] [CrossRef]
  50. Kleist, D.T.; Parrish, D.F.; Derber, J.C.; Treadon, R.; Wu, W.S.; Lord, S. Introduction of the GSI into the NCEP global data assimilation system. Weather Forecast. 2009, 24, 1691–1705. [Google Scholar] [CrossRef] [Green Version]
  51. Cooperman, A.; Dam, C.P.; Zack, J.; Chen, S.-H.; MacDonald, C. Improving Short-Term Wind Power Forecasting through Measurements and Modeling of the Tehachapi Wind Resource Area; California Energy Commission: California, CA, USA, 2018. [Google Scholar]
Figure 1. WRF-GSI NWP system architecture.
Electronics 11 02769 g001
Figure 2. Assembly process of hardware. (a) The 3D standard tessellation language file for printing. (b) The 3D printer for the study. (c) The printed Pi SBC holder. (d) Cluster software installation. (e) Version 1 of the cluster. (f) The final version of the cluster with 8U and 6U rack boxes.
Electronics 11 02769 g002
Figure 3. The installation process of the operating system. Blue and yellow boxes indicate server operations; green boxes are node operations.
Electronics 11 02769 g003
Figure 4. (a) Domain for WRF performance testing (resolution of 15 km). (b) Simulated domain of the test group (centered at Songshan Airport).
Electronics 11 02769 g004
Figure 5. Diagram of advanced assimilation system UCD_WRF-GSI.
Electronics 11 02769 g005
Figure 6. Comparison of WRF system performance in Gflops with various core counts. Blue, PW; orange, RPW; green, IRPW.
Electronics 11 02769 g006
Figure 7. Comparison of WRF efficiency for various systems at high resolution (1 km). Blue, PW; orange, RPW; green, IRPW.
Electronics 11 02769 g007
Table 1. Each computing system’s system specifications, price, and power consumption.
System SpecificationLength × Width × Height
(cm)
Weight
(kg)
Price
(USD)
Power Consumption (W)
Computing system Standby ModeFull Load
Pi cluster (160 cores, 8U)10 × 43 × 36~14~7000188.3232.6
Prototype (84 cores)20 × 20 × 15<1~100090130.5
Conventional HPC (160 cores, 20U)38 × 43 × 90~180~24,000~3340~4500
Publisher’s Note: MDPI stays neutral with regard to jurisdictional claims in published maps and institutional affiliations.

