Article

Path Loss Prediction in Tropical Regions using Machine Learning Techniques: A Case Study

by
Oluwole John Famoriji
* and
Thokozani Shongwe
Department of Electrical and Electronic Engineering Technology, University of Johannesburg, Auckland Park, Johannesburg P.O. Box 524, South Africa
*
Author to whom correspondence should be addressed.
Electronics 2022, 11(17), 2711; https://doi.org/10.3390/electronics11172711
Submission received: 9 August 2022 / Revised: 22 August 2022 / Accepted: 24 August 2022 / Published: 29 August 2022
(This article belongs to the Special Issue Applications of AI in Wireless Communication)

Abstract

:
In optimization of wireless networks, path loss prediction is of great importance for adequate planning and budgeting in wireless communications. For efficient and reliable communications in the tropics, determination or estimation of channel parameters becomes important. Research for this article employed different machine learning techniques—AdaBoost, support vector regression (SVR), and back propagation neural networks (BPNNs)—to construct path loss models for Akure metropolis, Ondo state, Nigeria. An experimental measurement campaign was conducted for three different broadcasting stations (Ondo State Radiovision Corporation (OSRC), Orange FM, and FUTA FM) all situated within Akure metropolis. Furthermore, we designed machine learning-based models for path loss prediction at various observation points at a particular frequency, and demonstrated how these algorithms agree with the measured data. For instance, for OSRC (operating at 96.5 MHz) measurement, the RMSEs (root mean square errors) of AdaBoost, SVR, BPNN, and the classical model (log-distance model) predictors were 4.15 dB, 6.22 dB, 6.75 dB, and 1.41 dB, respectively. Additionally, path loss prediction at a new frequency according to the available data at specific frequencies was evaluated. In order to resolve the challenge of limited or insufficient samples at a new frequency, a framework hybridizing classical models and machine learning algorithms was developed. The developed framework employs estimated values that are computed by the classical model based on the prior information for the training set expansion. Performance evaluation of the framework was conducted using measured data of Orange FM (94.5 MHz) and FUTA FM (93.1 MHz), and the samples computed from the classical model were used as training datasets for path loss prediction at a new frequency. RMSEs of AdaBoost, SVR, BPNN, and log-distance predictors were 1.77 dB, 1.52 dB, 1.45 dB, and 2.61 dB, respectively. However, adding measured data generated by the classical-based model, the RMSEs of AdaBoost, SVR, BPNN, and log-distance algorithms were 1.81 dB, 1.63 dB, 1.45 dB, and 1.88 dB, respectively. The results demonstrate how the proposed sample expansion framework enhances prediction performance in the scenario of few measured data at a new frequency. Finally, these results are promising enough for the deployment of the proposed technique in practical scenarios.

1. Introduction

1.1. Incitation and Motivation

Electromagnetic wave (EM) propagation is a necessary task in the performance optimization of communication systems. Generally, EM signal intensity reduces as the range between the transmitting antenna and the receiving antenna increases. Radio wave propagation mechanisms are different and are classified as scattering, diffraction, and reflection [1,2]. The environment of propagation is becoming more complex, making the path loss prediction a difficult problem. Path loss describes the degree of attenuation of radio waves propagating through space [2,3]. Hence, a simple, accurate, and general path loss model is necessary for planning of coverage, budgeting, site selection for base stations, and system performance optimization. Consequently, different attempts have been made in finding adequate path loss models in various applications at different frequencies.
Tropical regions lie at the center of the globe surrounding the equator and include parts of South America, North America, Africa, Asia, and Australia. They are characterized by lots of sunlight and a very warm environment. To enhance the experience of residents of tropical regions (particularly, Akure city, Nigeria) and provide them with high-fidelity wireless access broadcast services, an important task is to evaluate and investigate the characteristics of the channels in such regions. Path loss is important in planning, investigation, and optimization of mobile communication systems. The knowledge of path loss helps to adequately determine the field strength of the signal, and carrier-to-interference (C/I) and signal-to-noise (SNR) ratios [4]. Therefore, it becomes important to design flexible and accurate path loss models for tropical regions.

1.2. Literature Review

So far, various academics have conducted different measurement campaigns and created path loss models for different environments. Path loss models have been designed empirically and/or deterministically [5]. Empirical models are measurements based on a specific frequency and particular site. They give the relationship between the path loss and parameters of propagation, e.g., distance, frequency, antenna heights, etc. For instance, a log-distance model [6] employs a path loss exponent, which is empirically determined for the characterization of how the transmitted signal decreases as distance away from the transmitter increases. The attenuation (dB) caused by shadow fading is predicted using a Gaussian random variable of zero mean. There are other empirical models, such as Egli, Longley-Rice, Hata, Okumura, and Bullington models [7]. They are simple because they demand a smaller number of parameters and the equations of the models are accurate. In contrast, empirical model parameters are fitted from measurements taken at a specific site. Hence, the degree of accuracy is lower when applying the models to other environments [8]. In the same vein, empirical models represent only statistical path loss for a specific distance, but are unable to provide the precise power received at a particular site.
Deterministic models, such as the finite-difference time-domain (FDTD) and ray tracing models, employ knowledge of propagation and numerical approaches to model computational electromagnetics. Deterministic models generally provide a path loss figure at a particular location. There are associated demerits, such as absence of computational efficiency that consequently prohibits adequate computation time in the actual environments. They also require dielectric properties and geometry information of a particular site. Finally, with these models, the computational procedure, which is time-consuming, has to be run again once there is a change in the propagation environment.
Machine learning techniques depend on a huge dataset and a model architecture that is flexible for predictions. They have been applied to computer vision, speech recognition, data mining, and self-driving cars, among other things. Such tasks are categorized as supervised and unsupervised machine learning. For labeled data, the supervised learning learns a function that relates inputs with outputs, therefore making it an appropriate solution for regression and classification problems. In contrast, hidden structures are described from the unlabeled data by unsupervised learning algorithms. In this case, prediction of path loss is associated with the supervised regression issue and can be resolved using supervised machine learning algorithms, such as AdaBoost, support vector regression (SVR), and back propagation neural networks (BPNNs). In studies such as [5,9], machine learning algorithms have been proven to be better in accuracy than empirical models and more efficient in computation than deterministic models.
Recently, the literature has shown that machine learning-based path loss models have a higher degree of accuracy than empirical and deterministic models [8,10,11,12]. ANN-based path loss models with good performance are proposed in [13]. In addition, a hybridized empirical–neural network model has been shown to accurately predict path loss, because it has the capacity to include different factors affecting radio wave propagation [14]. ANN-based path loss prediction models have been proposed for office environments in [15,16]. The authors in [15] considered multi-frequency and multi-wall scenarios, while effects of furniture and body shadowing were considered in [16].
An SVM-based path loss model is proposed in [17] for an in-cabin scenario. The technique gives prediction values of points that were not measured by generating correlation relationships among the path loss predictions of the adjacent points. However, it does not consider the impact of environmental parameters, such as distance; also, only a single machine learning method and one frequency band are considered in [17].
Machine-learning algorithms have been applied to path loss prediction in different scenarios, such as the in-cabin environment [18]. An SVM algorithm was employed to predict the path loss of unmeasured points by creating a relationship in correlation among the path loss figures of adjacent positions. However, it also did not consider the impact of environmental factors. Additionally, in [18], only a machine-learning algorithm was used under a frequency band.
A neural network model was used to develop a path loss model for an ultra-wideband frequency in [19]. The training of the model and the optimal value of the weight was estimated via backpropagation. When compared with other empirical models, the model gave the smallest value. In addition, in [20], another path loss model was developed based on a multi-layer perceptron neural network. The major novelty in [20] is that it evaluates the behaviors while employing the many hidden layers in the whole network performance. It was observed that when the number of hidden layers in the network increased, the prediction accuracy increased, but with some degrees of complexities.
Differential evolution was employed with an artificial neural network in [21]. The model was trained using experimental data in urban environments. The model also used a gradient descent algorithm together with the backpropagation neural network. The model, compared with other experimental studies in the same location, gave a better accurate path loss characterization than the other models. A radial basis function path loss model was introduced in [22]. The model was compared with the performance of a multi-layer perceptron neural network and five other existing propagation models. The radial basis function predicted path loss with the highest accuracy and gave the lowest value of error in the considered environments. In [23], an artificial neural network for several frequency bands was developed with experimental data. The performance of the ANN network was examined using the different frequency bands. The ANN network gave the most accurate prediction; the other empirical models overpredicted path loss and did not give an accurate signal characterization.
Other machine learning algorithms, such as decision tree and K-nearest-neighbors (KNN), were equally used for path loss prediction. In [24], random forest (RF) and KNN are exploited to predict the path loss in an urban environment for UAV communications. Results have shown that machine-learning-based models have high prediction accuracy and acceptable computational efficiency. Feature importance is also assessed using the RF algorithm. In [25], a hybrid scheme based on the ray tracing method and RF was given for signal strength predictions. Contrary to the results of the finite integral method, the proposed model exhibited higher prediction accuracy with lower run time. In [26], the received signal strengths were predicted for an environmental wireless sensor network using several candidate machine learning algorithms, including AdaBoost, RF, ANN, and KNN. Among these methods, RF showed the highest accuracy in the considered environment, achieving a significant reduction in the average prediction error compared to the empirical models. From the perspective of feature reduction, the authors used a variety of manifold learning methods to reduce the original feature dimensions to two dimensions to establish a path loss model in [26].

1.3. Contributions

In this article, the feasibility of various machine learning algorithms for path loss prediction in tropical regions is evaluated. Machine learning algorithms are of different types and different structures. Our aim was to investigate and verify the suitability of these models and whether they have the capacity to predict path loss in the tropics at various frequency bands. In addition, when we apply a new frequency for the tropical regions, it becomes challenging to obtain sufficient data to quickly develop an exact model due to labor-intensive and time-consuming channel measurement campaigns. Insufficient data samples cause performance degradation of machine learning approaches. To overcome this challenge, a data expansion framework is proposed that builds the path loss model using few measured data.
The novelties and contributions of this article are as summarized below.
(a)
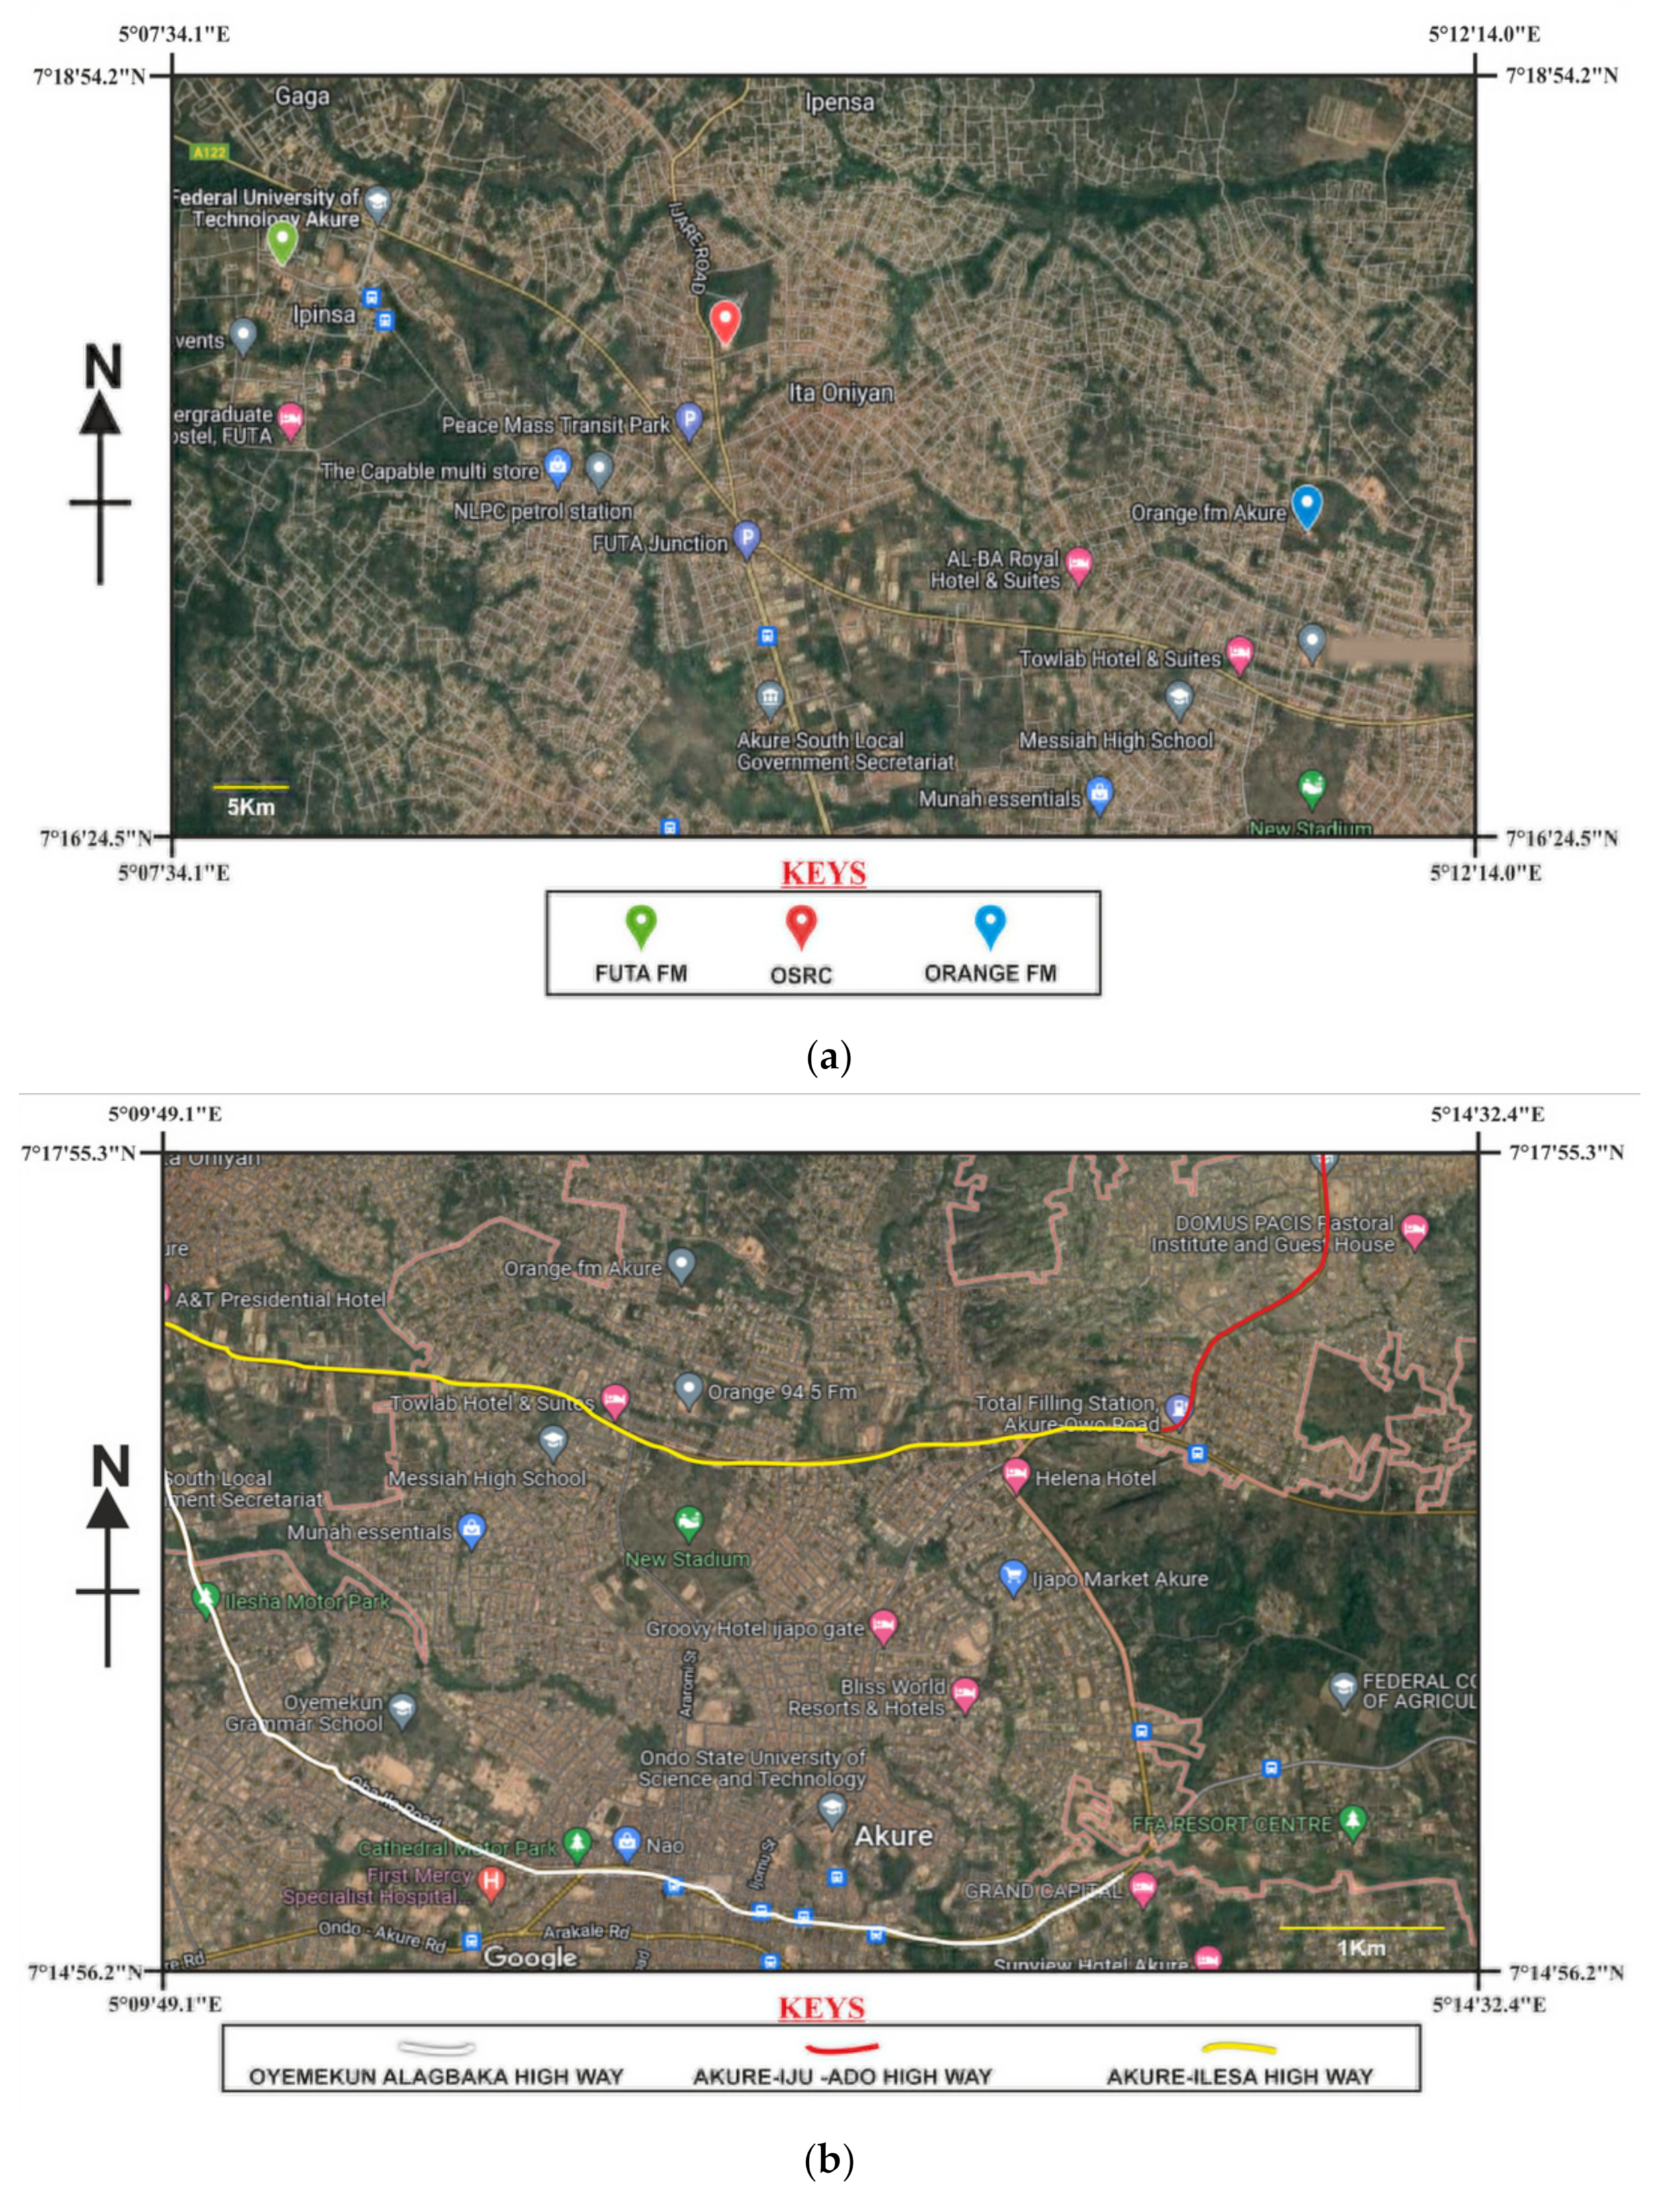
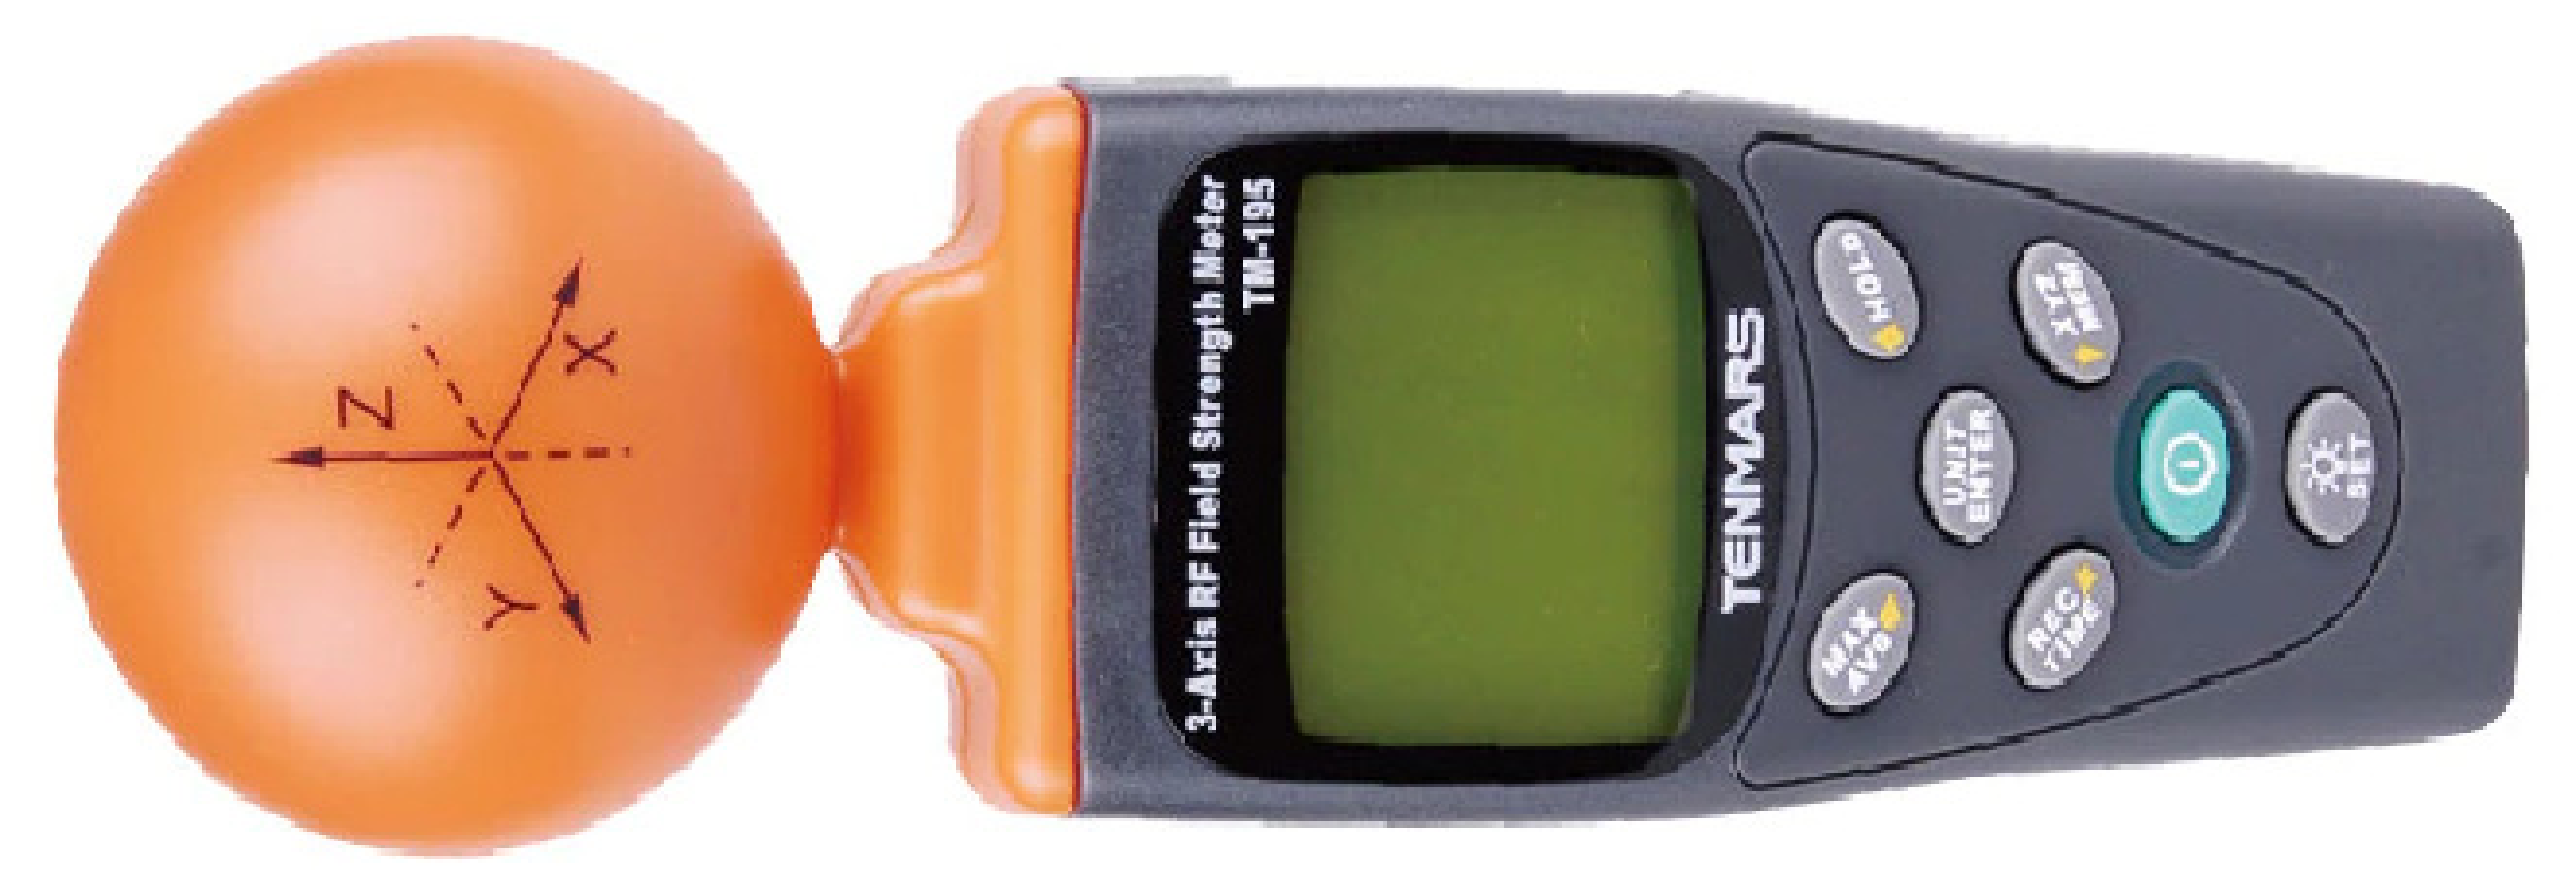
Experimental field strength measurement campaign was conducted in a tropical region with particular reference to three different broadcasting stations (Ondo State Radio Corporation (OSRC), Orange FM, and FUTA FM) in Akure metropolis, Nigeria.
(b)
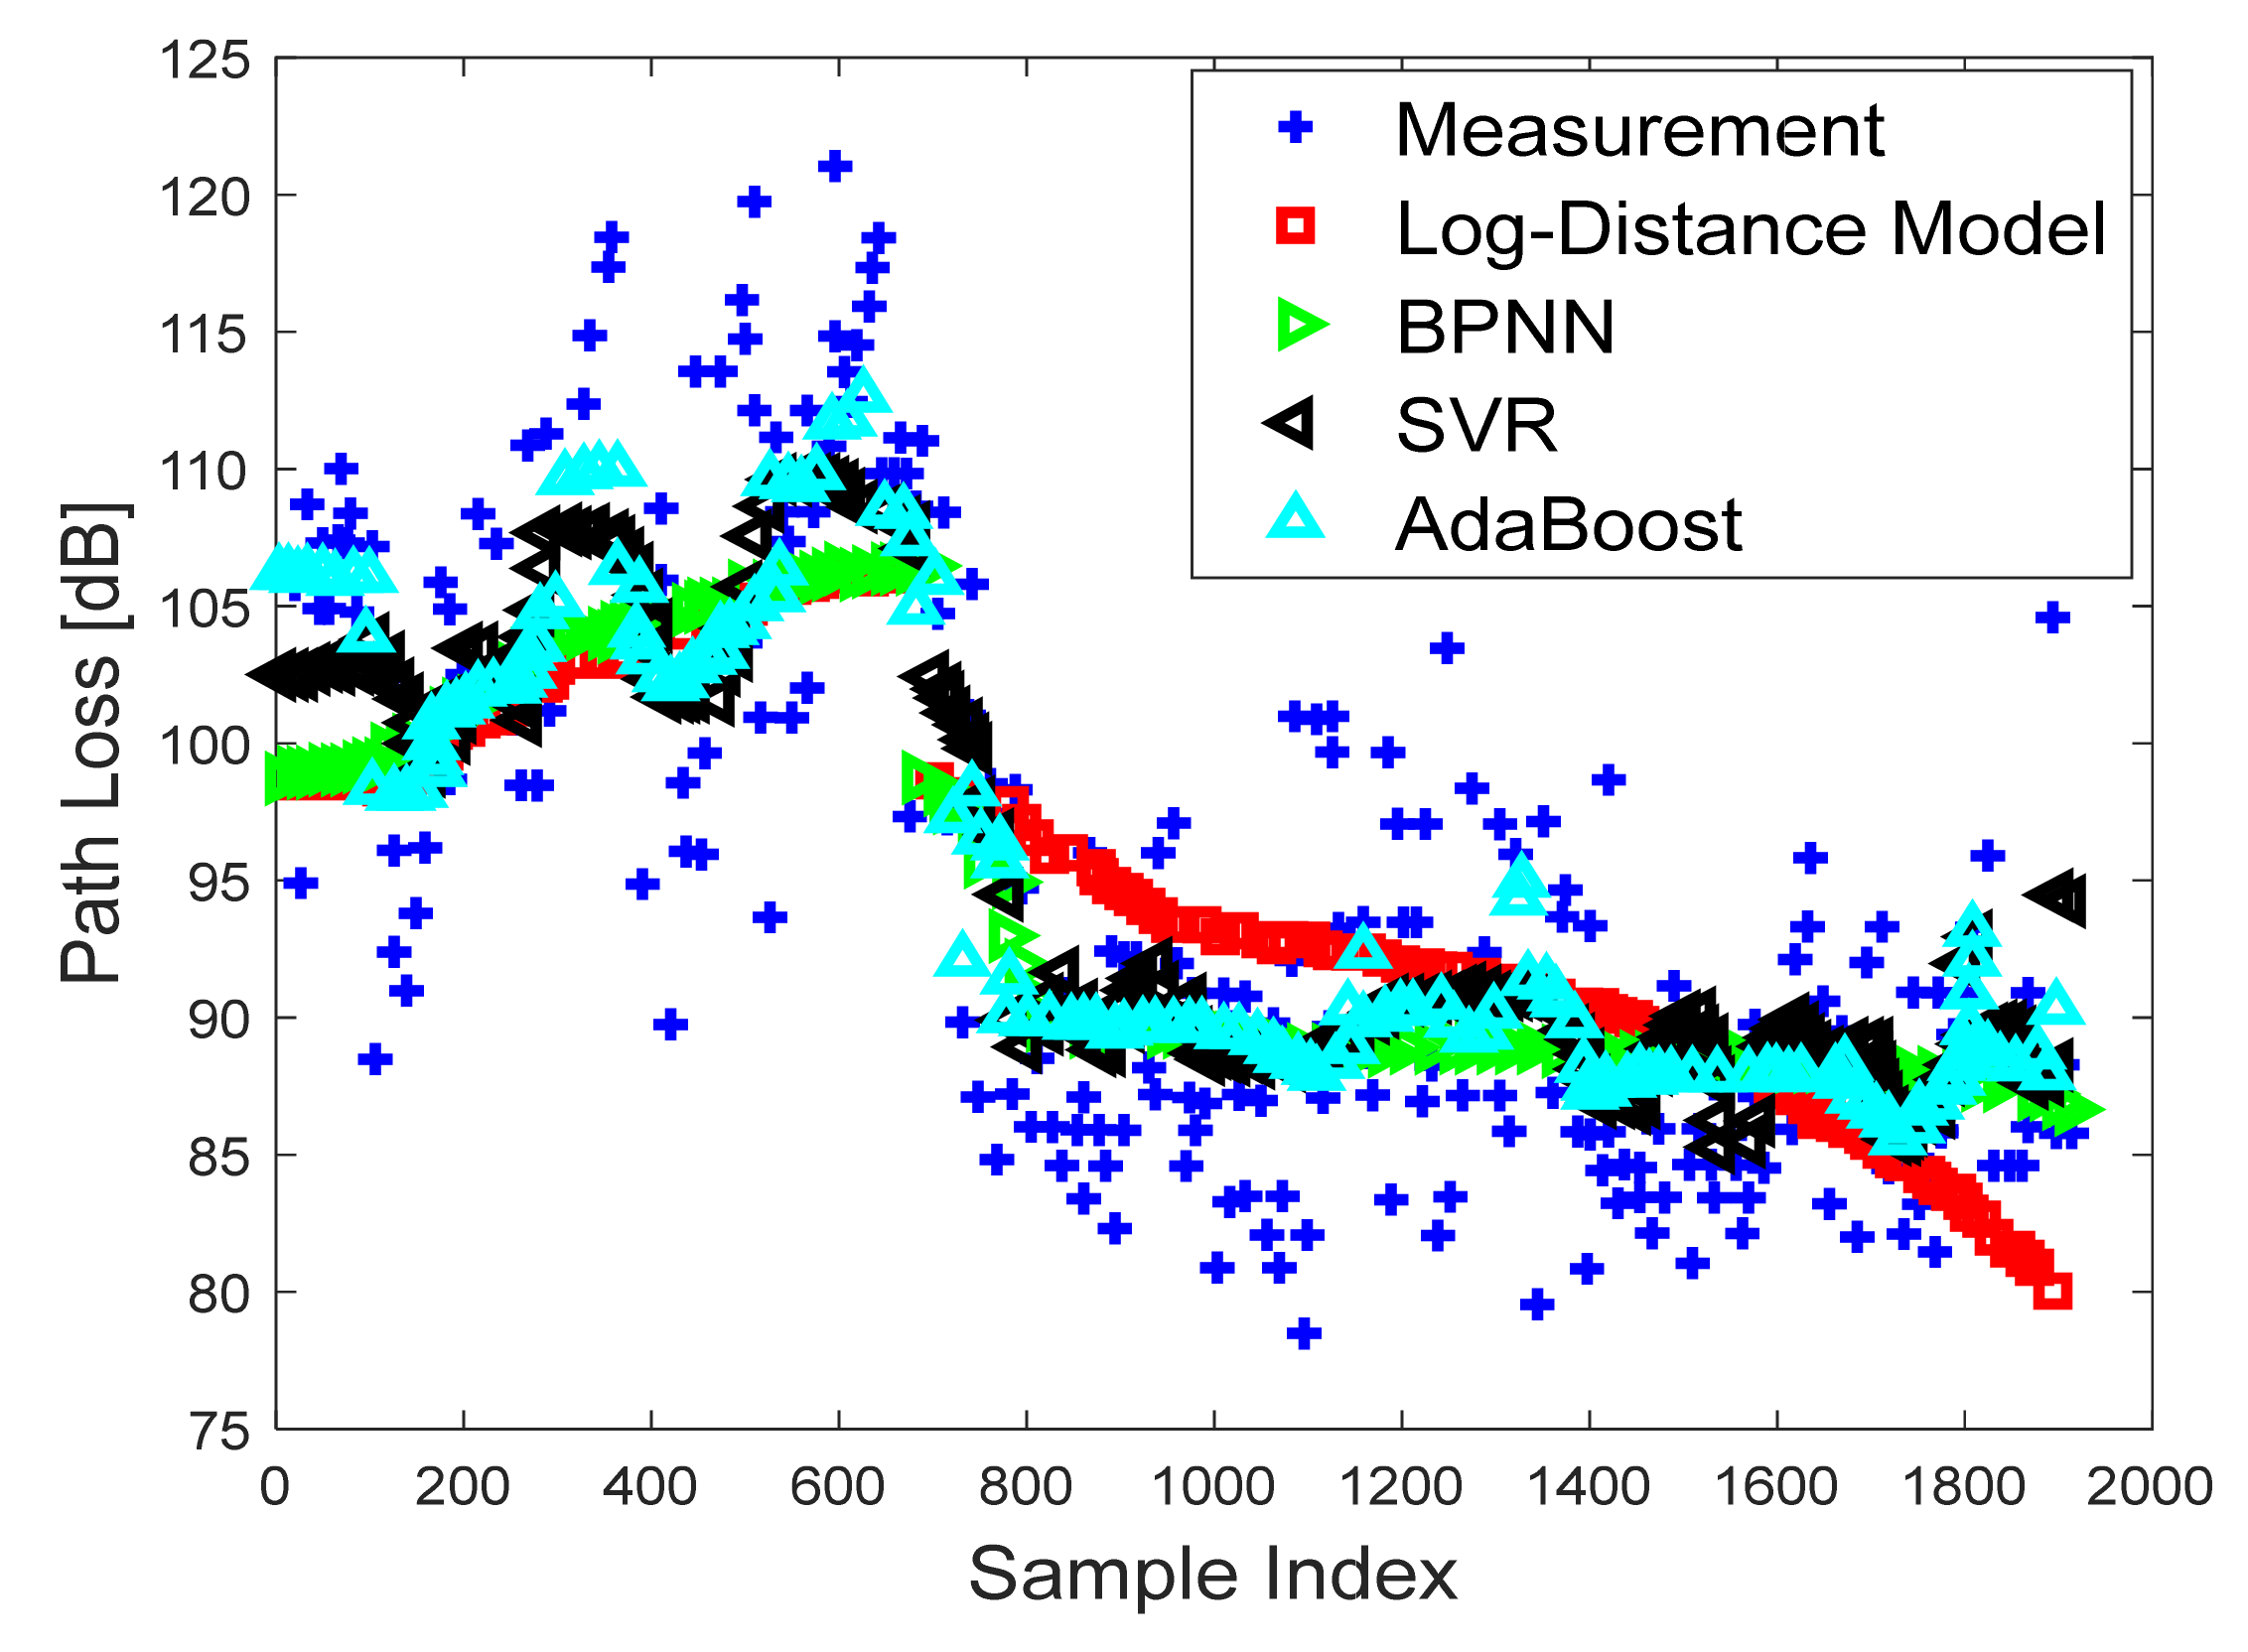
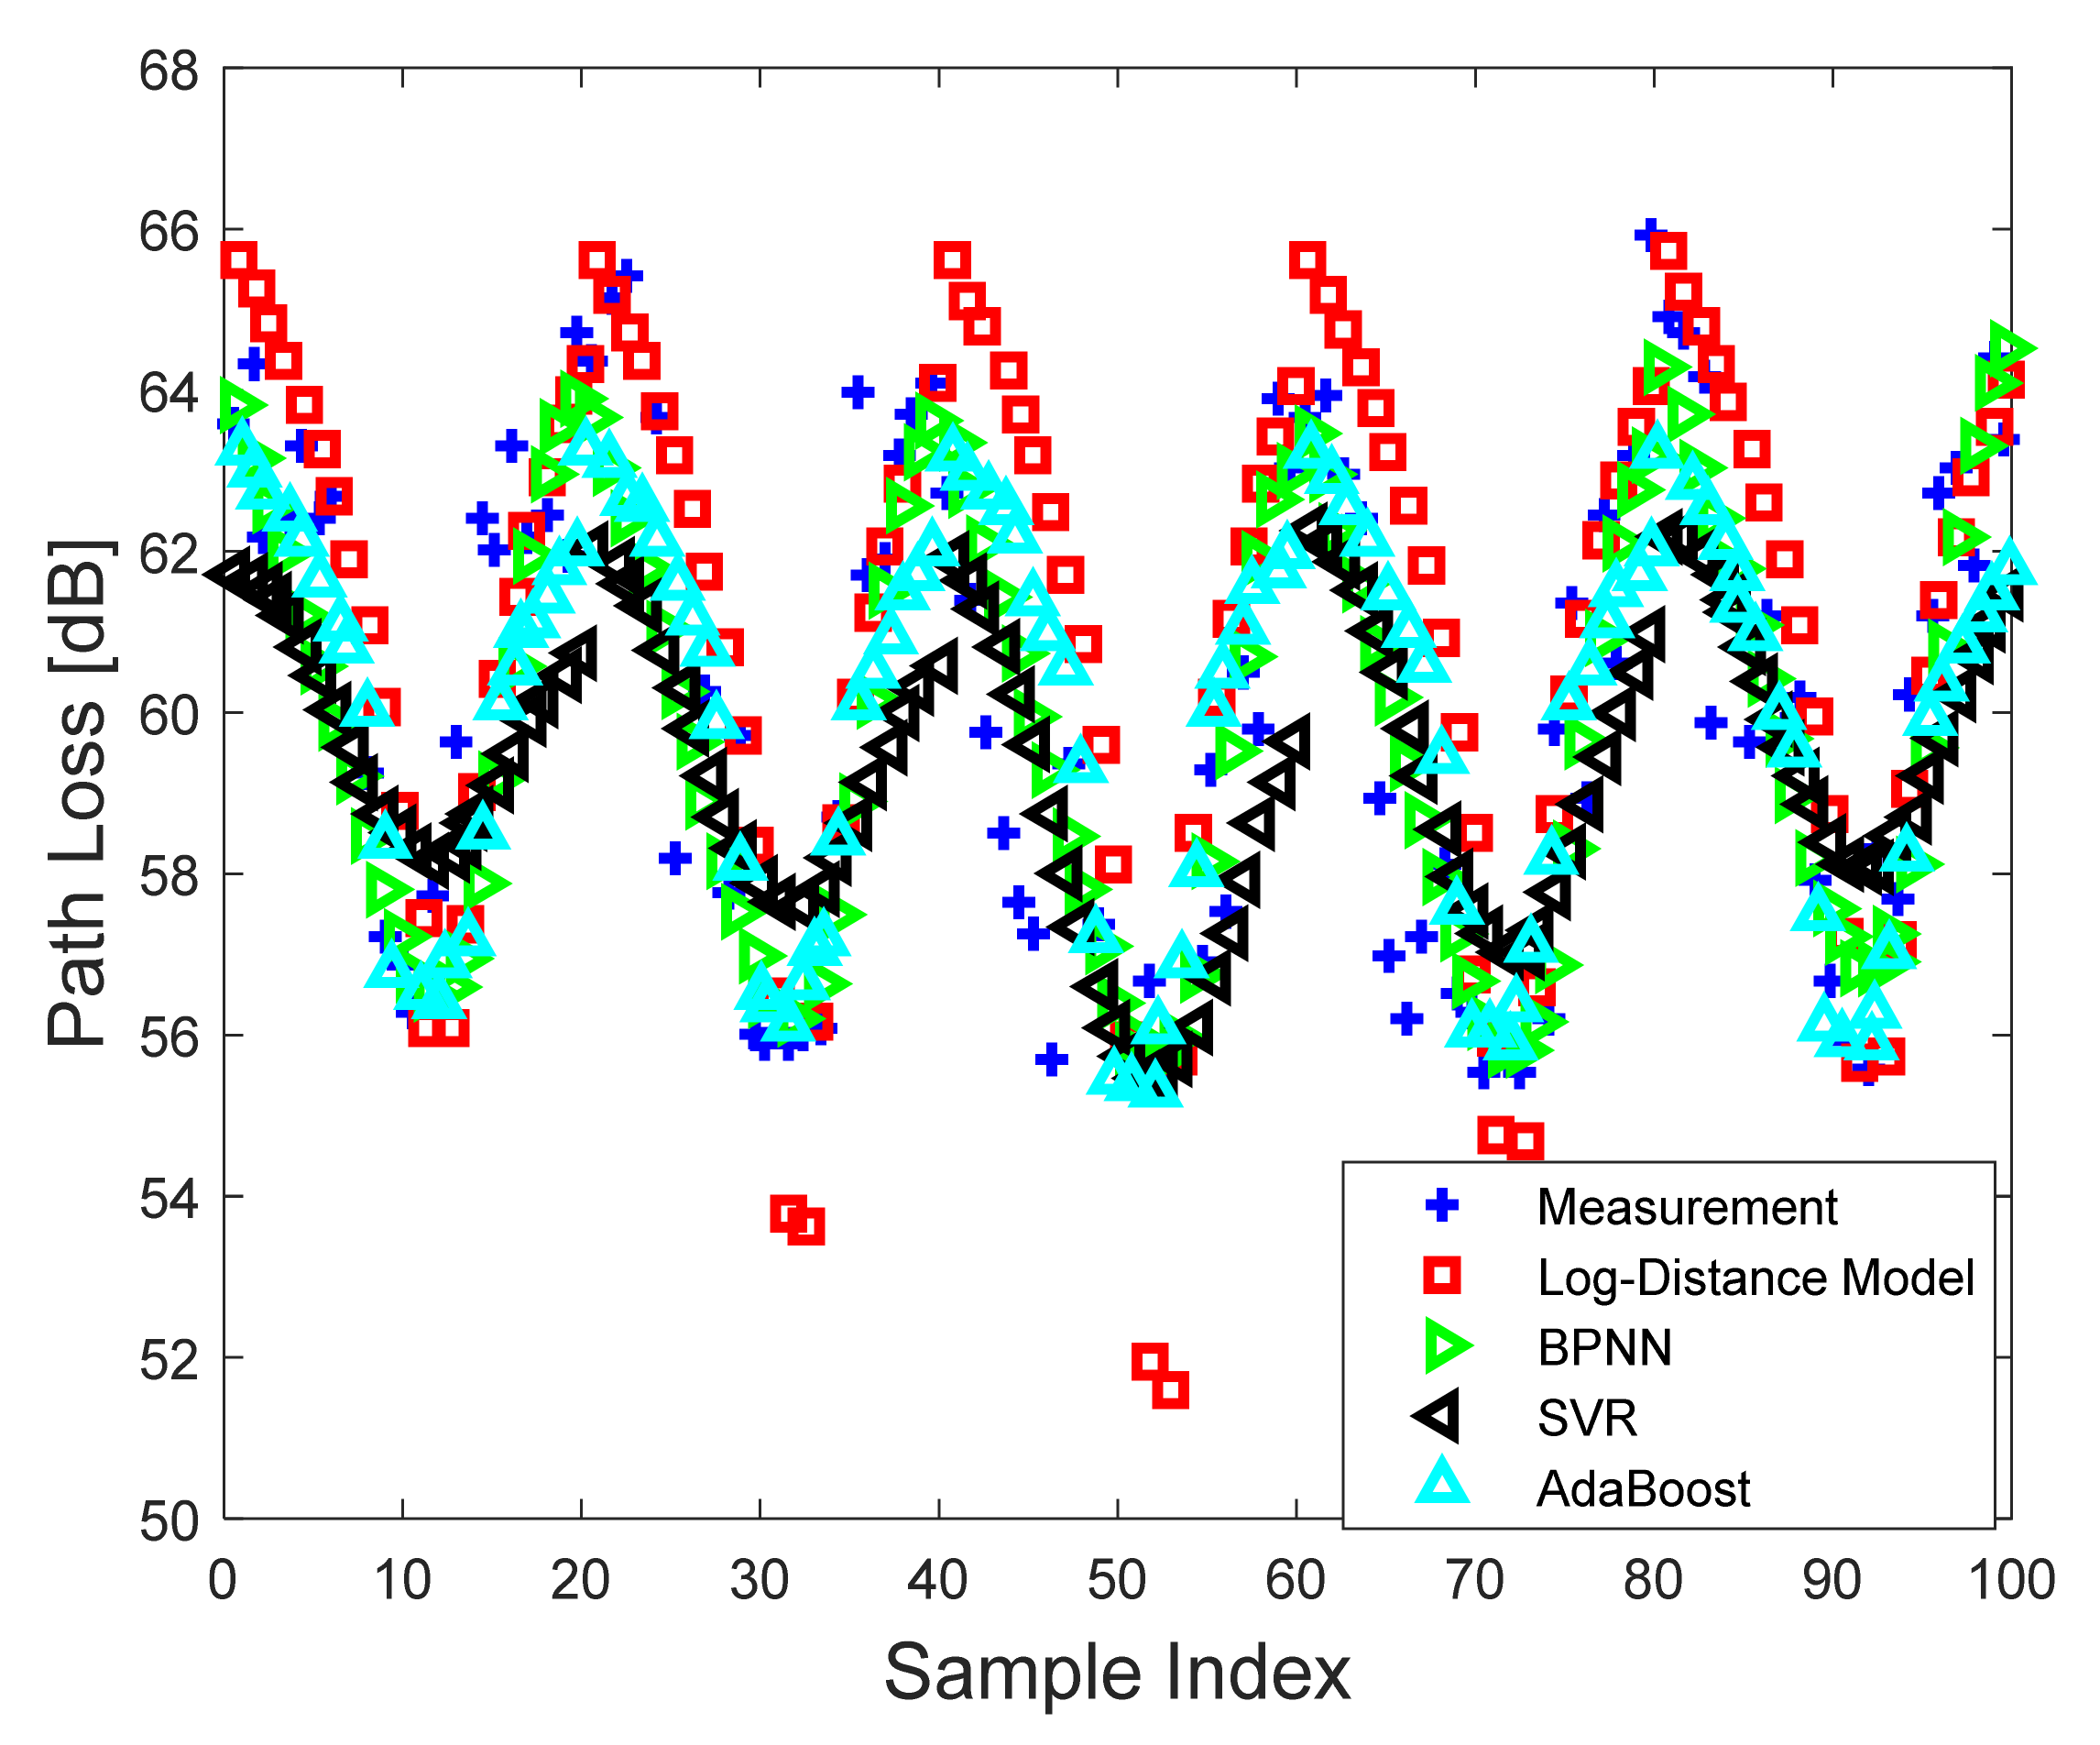
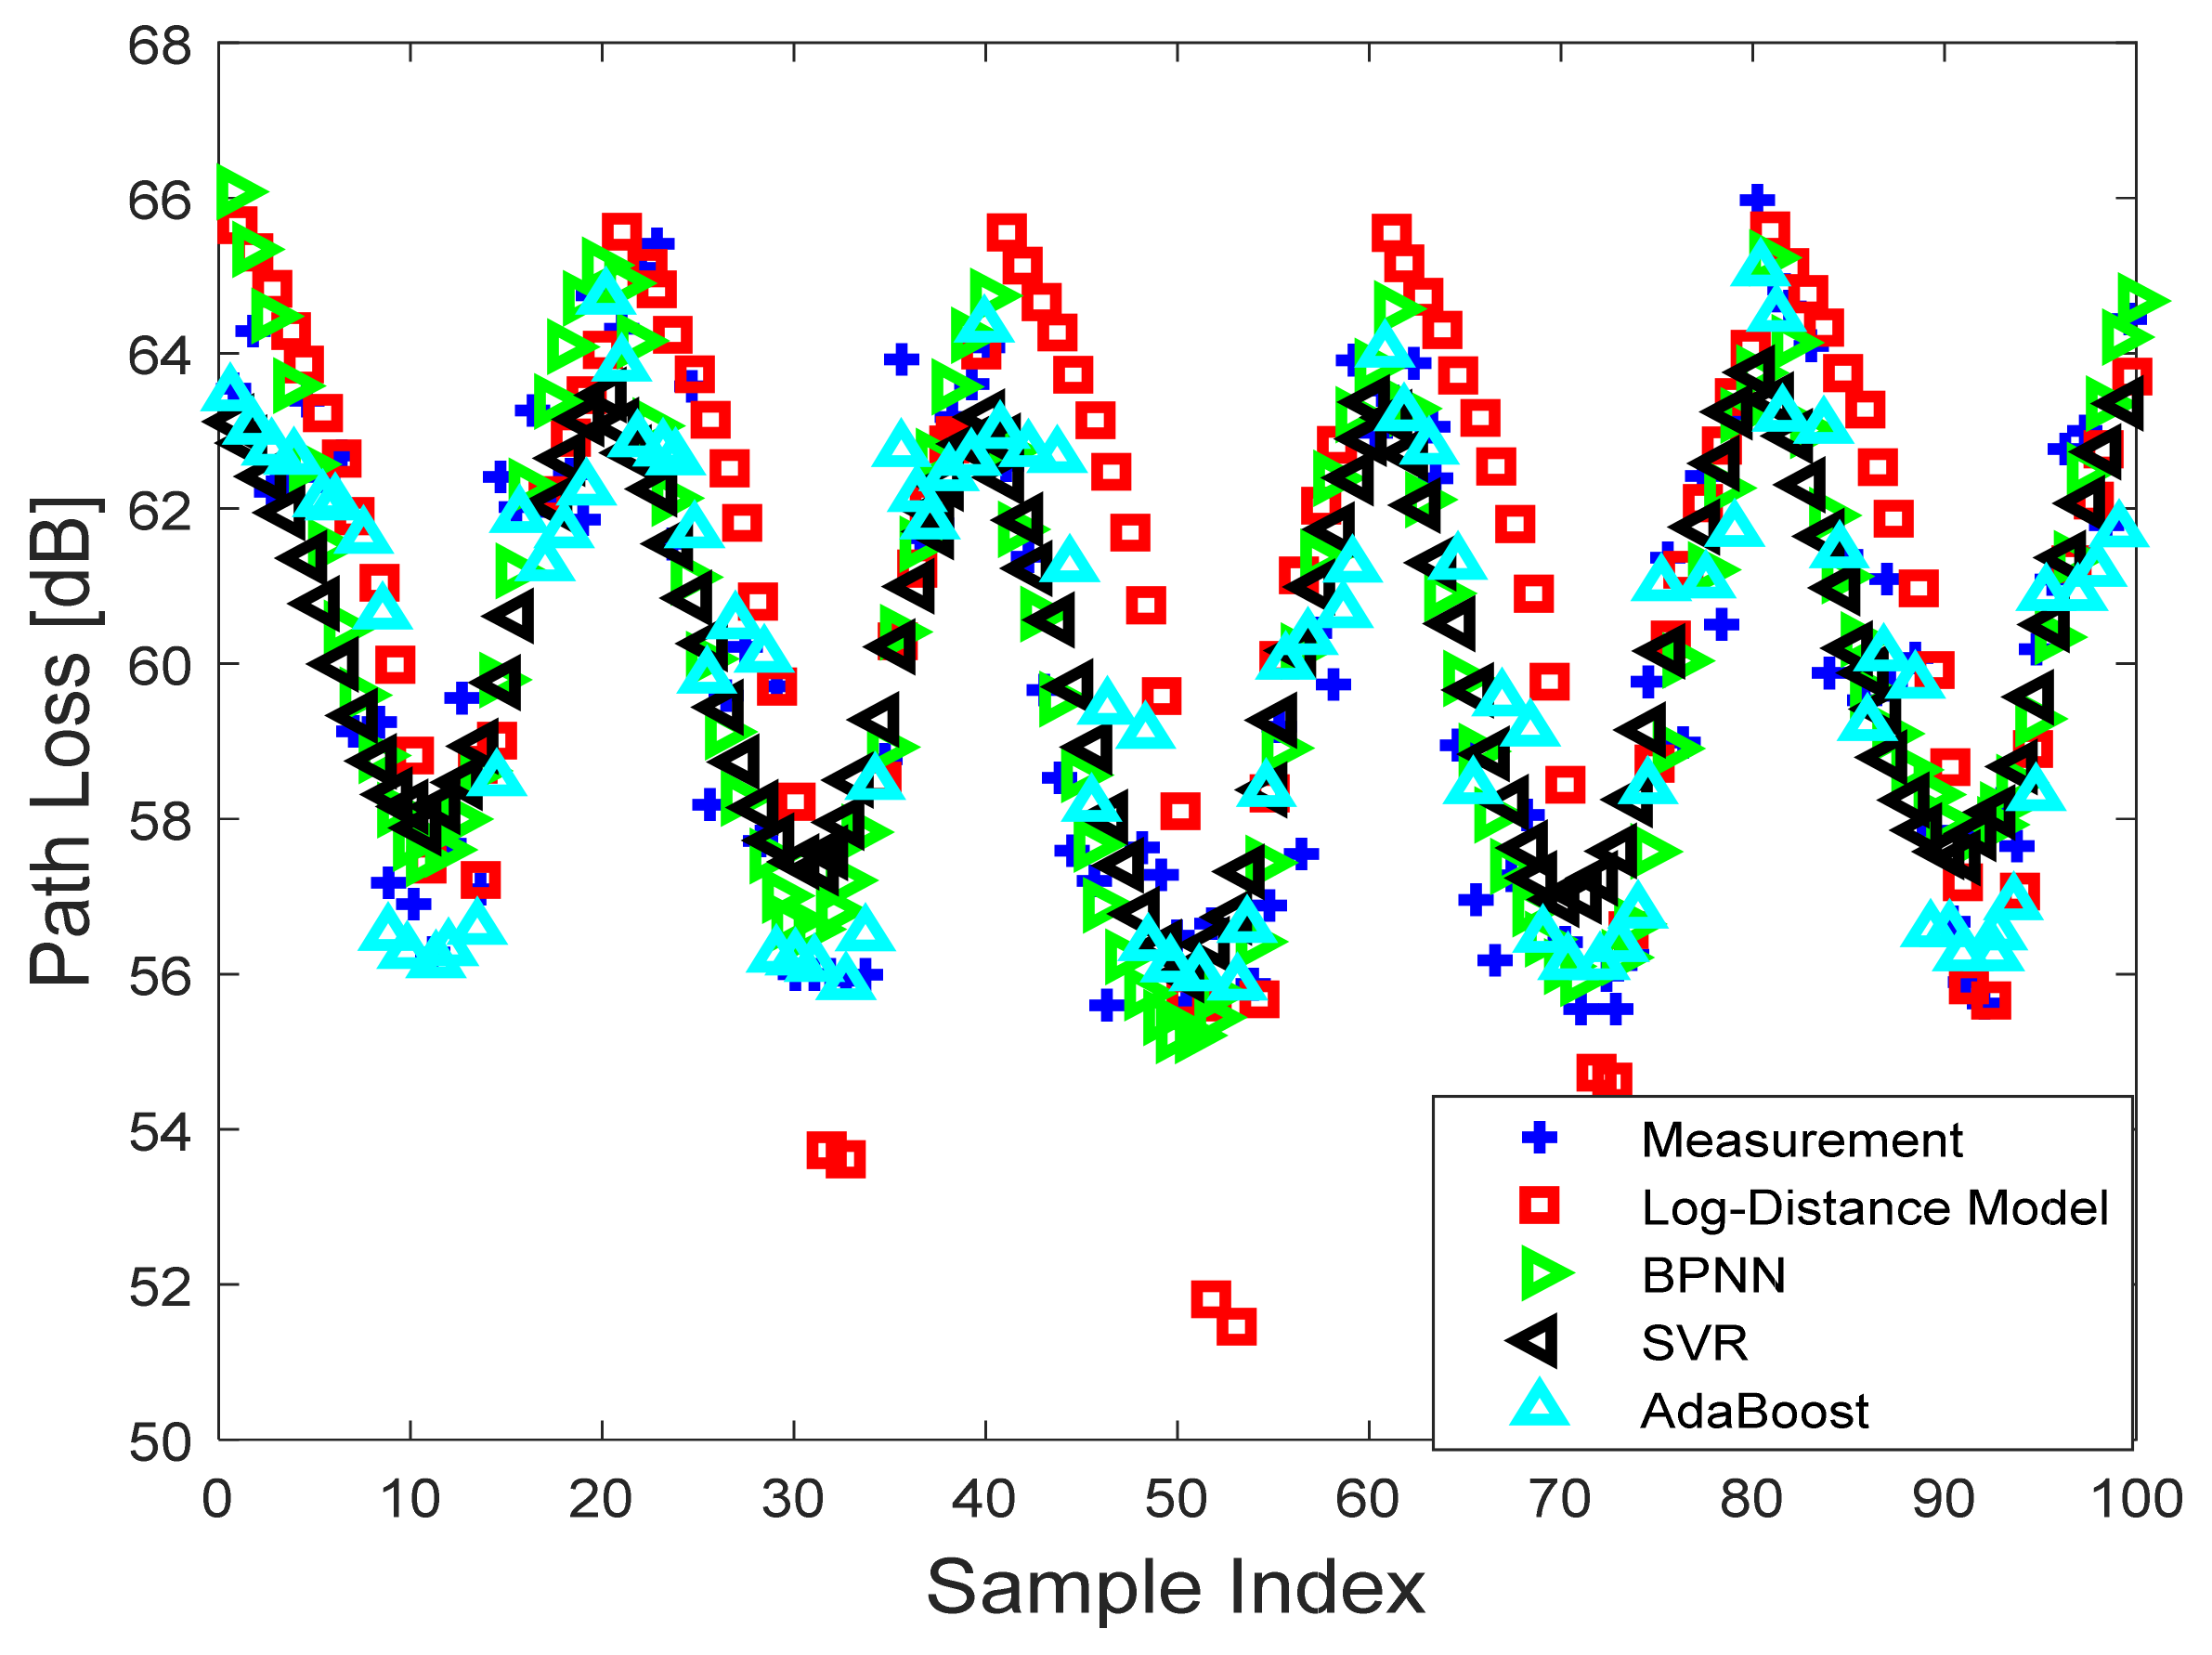
In the tropics, the feasibility of various path loss models was verified by comparing them with measured data. The machine learning algorithms AdaBoost, SVR, and BPNN were used to develop the path loss prediction models for tropical regions, and validated using measurement data.
(c)
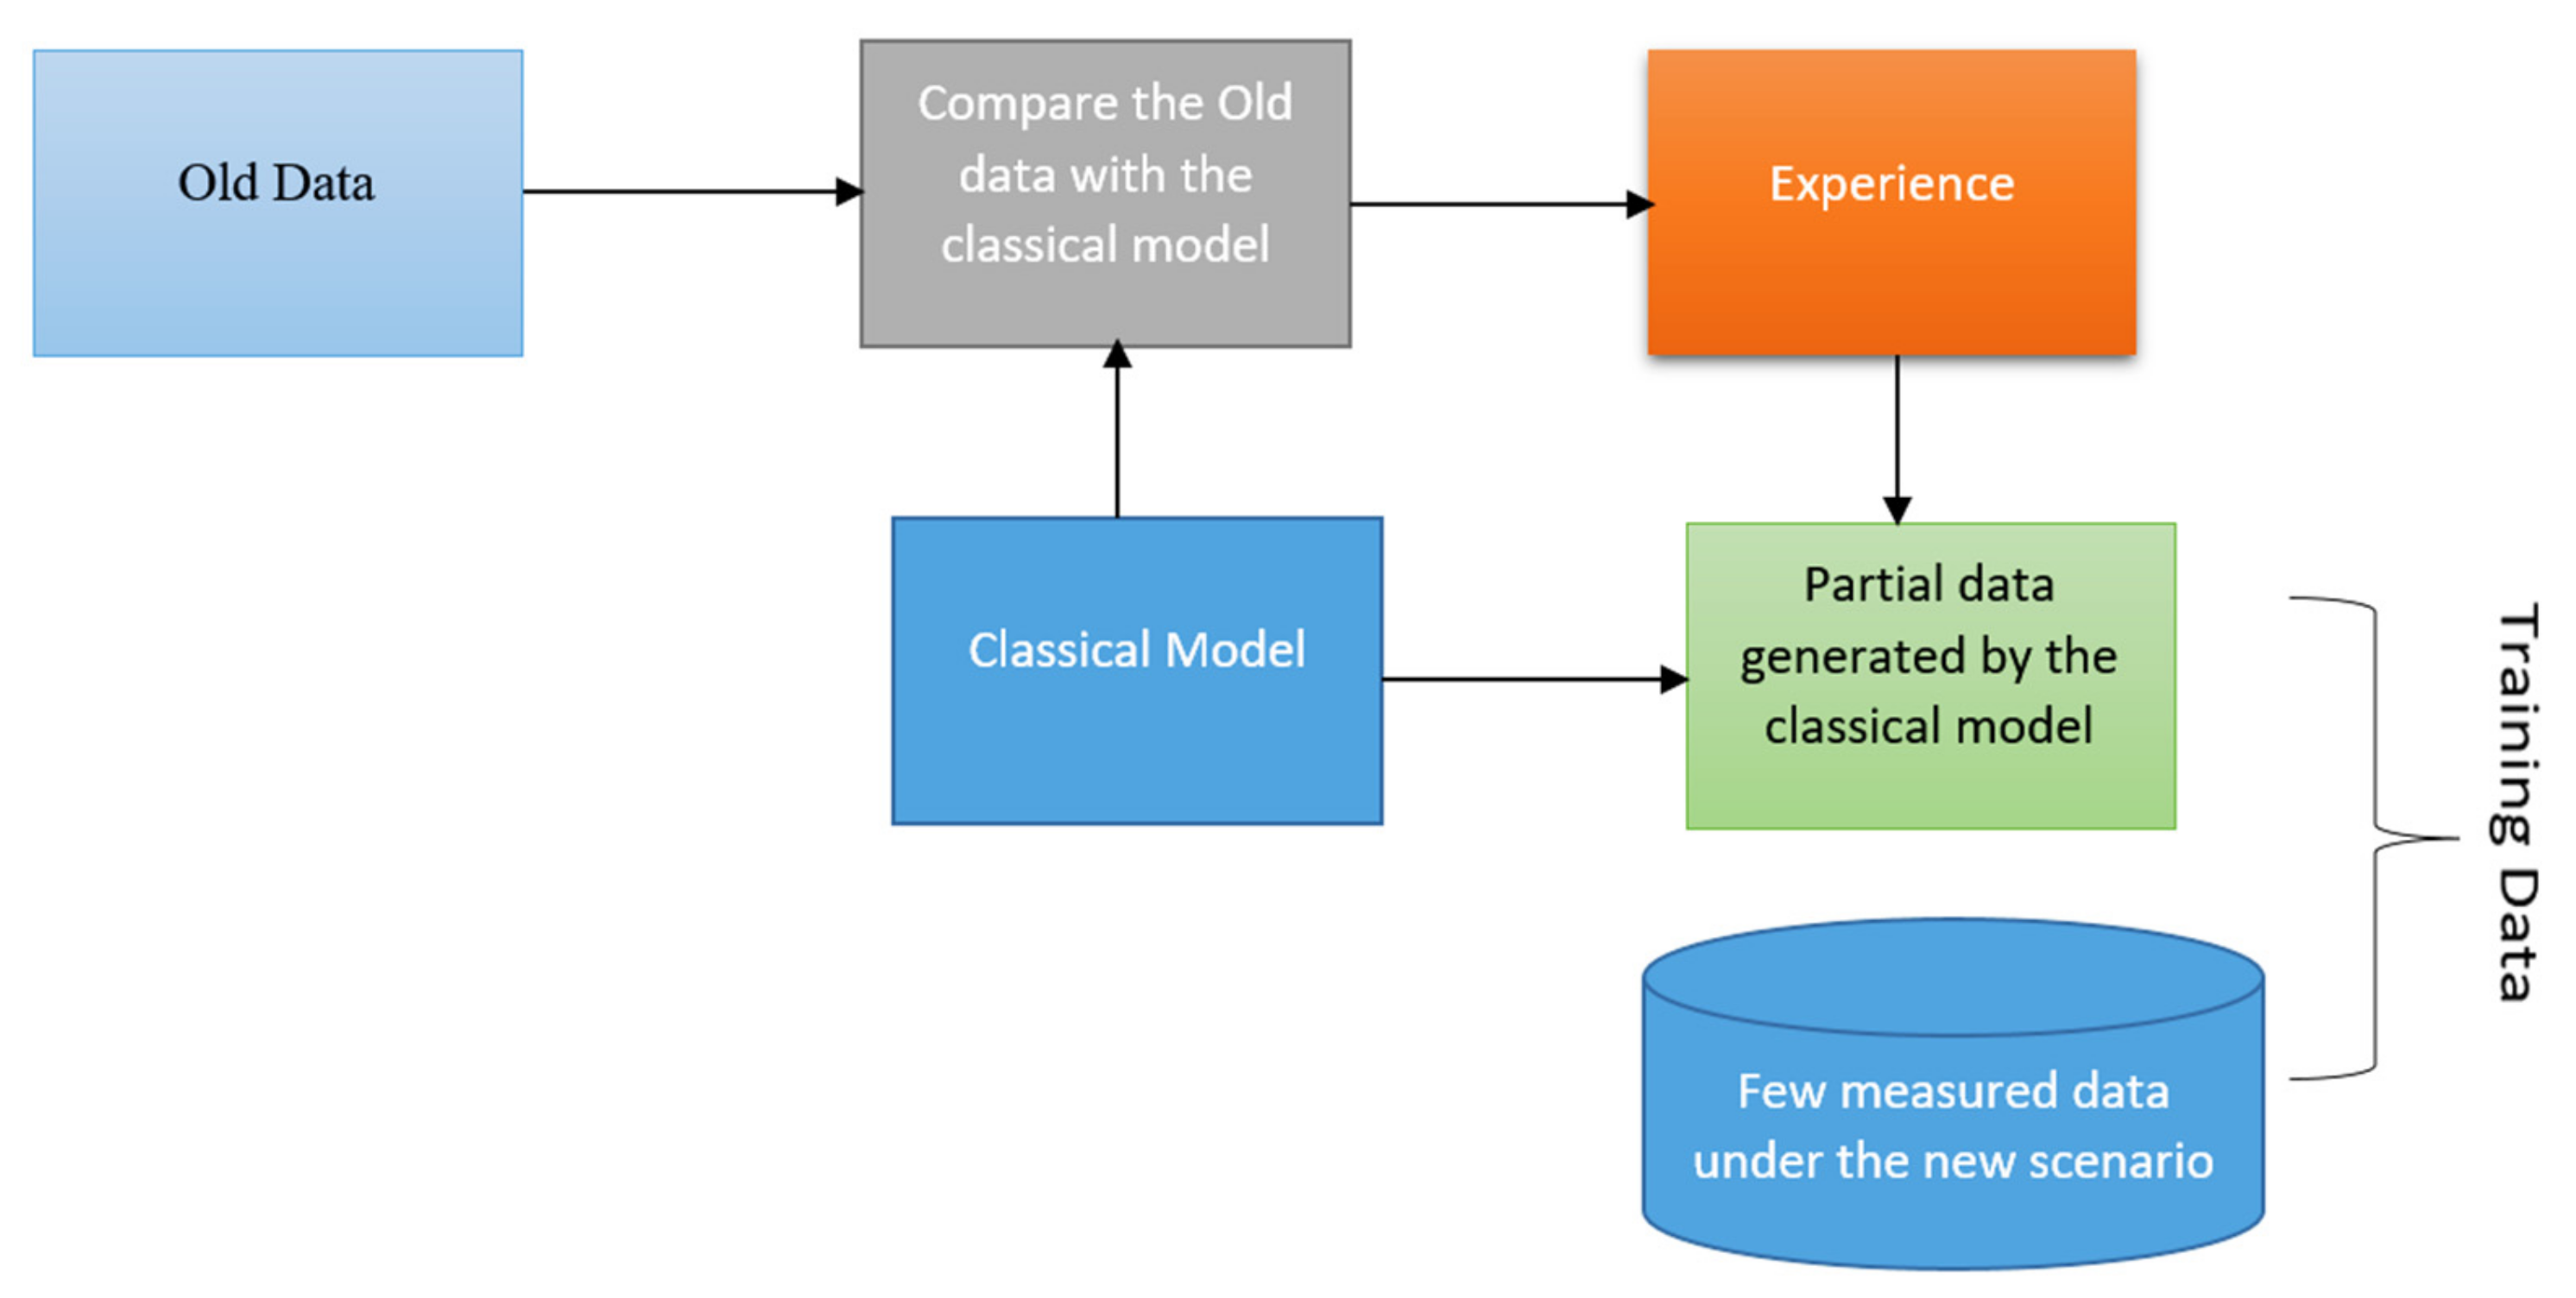
A data expansion framework that matches machine learning algorithms and classical models together is proposed for the expansion of the training dataset. This will improve the prediction accuracy of path loss at a new frequency.

2. Measurement Campaign

Akure metropolis, Nigeria is a typical example of a tropical region, thereby used as a case study in this work. Akure is the capital of Ondo state, Nigeria. It is located in the tropics at latitude 7.25° N, longitude 5.2° E, and altitude of 420 m above sea level. It is an agricultural area with small-scale industries, therefore the impact of industrial pollutants or aerosols is minimal based on the report in [27]. First, a survey of locations (measurement points) was conducted to select a route. During the survey, hills or building, structures, and obstacles that can obstruct radio signals in line of sight were noted. We considered the three major routes for measurements where the three broadcasting stations (Ondo State Radiovision Corporation (OSRC), Orange FM, and FUTA FM) could be easily accessed. The routes were on Akure-Ilesa Highway (named Route 1), Akure-Iju Ado Highway (named Route 2), and Oyemekun-Alagbaka Highway (named Route 3). The Google map of Akure metropolis is as shown in Figure 1a while the map showing the routes taken for measurements is presented as Figure 1b.
A field strength measurement of the broadcast signal was conducted using a TENMARS TM-195 3-axis RF Field Strength Meter electromagnetic field radiation (EMF) tester (frequency range: 50 MHz to 3.5 GHz), as shown in Figure 2, at different distances between the transmitting antennas: OSRC, Orange FM, FUTA FM; and the receiving antennas in the various locations were mapped using the Global Positioning System (GPS) satellite receiver. Different positions of the transmitting antennas were marked as a “home” waypoints on the mark position page of the GERMAN GPS Map 76 receiver and stored in the memory. Using a vehicle, a journey of about 30 km was taken on the routes away from the base stations at an increasing rate of 0.6 km line of sight. The transmitting antennas of the three base stations shared the same omnidirectional characteristics. In addition, there are two major seasons in Akure metropolis: wet and dry seasons. It has been previously established in [27,28] that refractivity is higher during the wet season in the study area than the dry season, and as such, the wet season is the worse-case scenario. Hence, the RF measurement campaign was conducted in August 2021 (peak of the rain season) in order to incorporate the impacts of atmospheric attenuation.
The broadcasting stations FUTA FM, Orange FM, and OSRC Radio operate at different frequencies: 93.1 MHz, 94.5 MHz, and 96.5 MHz, respectively. About 880 samples per station were collected, and the total number of samples collected was 2640. A sample was made up of the path loss and distance between transmitting antenna and observation point computed based on GPS information. The total sum of samples was divided and classified as training and test samples. Distance between the transmitting antenna and point of observation was used as a single feature. Eighty percent of samples were randomly selected and used as a training dataset while the other 20% were used as test data. The training set was used for learning and creation of the model while the test set was employed for performance evaluation of the trained model. Three machine learning models, BPNN, SVR, and AdaBoost, were employed for path loss prediction in the test dataset. We employed the linear unit function for BPNN activation function. In addition, we employed a three-layer feed-forward structure, and fifteen (15) optimal neurons in the hidden layer. The Gaussian radial basis function was employed as the kernel for the SVR algorithm. We set the coefficient of regularization, insensitive loss, and kernel function parameters as 452, 92, and 0.26, respectively.

3. Machine Learning Algorithms

Supervised learning algorithms were employed for prediction of path loss. This section introduces the models, AdaBoost, SVR, and BPNN, and analyzes prediction performance using measured data.

3.1. SVR

The SVM algorithm is a machine learning method based on the statistical learning theory. SVM maps the dataset in finite dimensional space nonlinearly to a high-dimensional space in a way that the dataset can be separated linearly. SVR is an expanded SVM that solves regression problems; as such, it is applicable in the prediction of path loss [29]. The aim of SVR is to find a hyperplane within the feature space in order to ensure the sample points fall on it. The feature space hyperplane is expressed as [18]:
f x = w T ϕ x + b
where w represents the normal vector that dictates the hyperplane direction, x is the input feature vector, ϕ · denotes the mapping function which is nonlinear, and b represents the item of displacement. The appropriate solution of the optimal hyperplane is an optimization problem that is constrained and can be described as [30]:
min w ,   b , ς ς * 1 2 w T w + i = 1 N ς i + ς i * s . t .   f x i y i ε + ς i y i f x i ε + ς i * ς i , ς i * 0 , i = 1 , , N
where ε denotes the insensitive loss, meaning the value predicted can be seen as accurate provided the error between the real value and the predicted value is less than ε ; represents the coefficient of regularization; and ς i   and   ς i * denote the slack variables allowing the range of insensitivity on the two sides of the hyperplane to vary minimally.
Initiating Lagrange multipliers and resolving the dual challenge, the correct equation is [18]:
f x = i = 1 N β i + β i * K x i , x + b
where K . , . represents the kernel function that performs nonlinear mapping from low-dimensional space to high-dimensional space, and β i     and   β i * are the Lagrange multipliers.
The kernel function is an important factor that determines the performance of SVR prediction. Presently, there are many kernel functions, but this paper chose the Gaussian kernel and a tunable parameter γ and it is expressed as [18]:
K x i , x j = exp γ x i x j 2 .
The Gaussian kernel is one of the frequently employed kernel functions [16,17,18,19], useful for works that have small feature dimensions without prior knowledge. Parameters such as insensitive loss, coefficient of regularization, and the parameter of kernel function are tested using the approach in [29].

3.2. AdaBoost Algorithm

The algorithm in [12] is a kind of ensemble learning method named boosting that superimposes a base learner layer. Each layer provides higher weight to the wrongly predicted sample by the previous base learner during training. The weight sum of prediction of individual layers that is based on the structure is the final result of prediction [12]. Later the performance of the AdaBoost algorithm will be analyzed and evaluated.

3.3. ANN

An artificial neural network (ANN) algorithm has been employed to predict path loss [5,8]. ANN is a formulation of neurons that are interconnected. Depending on the neuron model, feed-forward ANNs of multi-layer perception normally have an inputs layer, hidden layers, and an output layer. The neurons are fully connected to the next layer via different weights, but no connection exists between neurons in the same layer and there is no cross-layer connection [5].
Hidden layers and the number of neurons are the determinants of the network size and influence the performance and complexity of the model. However, finding a suitable structure of the ANN for the prediction of path loss remains an open challenge. According to [5], a non-complex ANN will probably give enough accuracy for path loss prediction for the planning of a specific rural macrocell radio network. An ANN made up of many hidden layers and several neurons leads to an inferior generalization property in comparison to simple structures, and this frequently leads to overtraining, which is a case in which the model exhibits good performance on data similar to the training data but is not flexible to allow data that is different from the training data.
BPNN is a low complex algorithm frequently employed in training ANNs [5]. In this work, a three-layer BPNN structure with fully-connected layers was employed. For a set of training data x 1 , y 1 , x 2 , y 2 , , x N , y N , where x i = x 1 i , x 2 i , , x L i R L is a feature vector while y i R 1 is a target output of path loss from the measurement. In forward propagation phase, the path loss value prediction y 1 is described as [18]:
y 1 = f 0 ω 0 m f m ω m l x i + θ m + θ 0
where ω 0 m is the weight of connection between the output layer neurons and hidden layer, ω m l is the weight of connection between the hidden layer neurons and the inputs, θ 0 and θ m represent the thresholds of output layer neurons and that of hidden layer neurons, respectively. f 0 · and f m · denote the transfer functions of neurons in the output and hidden layers, respectively. Errors emanating from the output neurons have backward propagation. The network learning stage is conducted by resetting the weights depending on the loss function that is described as [18]:
E = 1 N i = 1 N ( y i y i ) 2
with E as mean square error.
The BP algorithm is gradient descent strategy-based. A standard gradient exhibits some demerits: slow local poles and convergence speed. Hence, there are other training techniques that can be considered: the Fletcher–Reeves update technique, the Levenberg–Marquardt technique, and the Powell–Beale restart technique. However, the Levenberg–Marquardt technique is usually employed for prediction of path loss due to its high convergence speed, but with memory consumption [5,8].

4. Comparison of Methods

In this section, the performance of machine learning approaches in the prediction of path loss are evaluated and compared with a classical model (log-distance) as in [31]. The value of path loss at every point within the test data is predicted via various models. We computed the comparison between the measured data and the prediction errors. The performance metrics used to evaluate prediction performance were MAE, MAPE, RMSE, ESD, and MaxPE, and can be described as:
M A E = 1 Q q = 1 Q P L q P L q
M A P E = 100 Q q = 1 Q P L q P L q P L q
R M S E = 1 Q q = 1 Q P L q P L q 2
E S D = 1 Q 1 q = 1 Q P L q P L q 2
M a x P E = max P L q P L q
where q = 1 , , Q represents test sample index, Q represents the sum of test samples, and   P L q and P L q are the samples from measurement and path loss, respectively.
Table 1, Table 2 and Table 3 show the errors in the prediction of the machine learning models for Orange FM, FUTA FM, and OSRC, respectively. It can be observed that the machine learning approaches exhibited good performance and performed better than the classical model (log-distance). Based on the chosen hyperparameters, the AdaBoost algorithm had best prediction in the measured case, then the SVR, BPNN, and log-distance models.
Figure 3 shows the plots of measured data and predictions from machine learning algorithms. The horizontal axis denotes the test sample index that corresponds to the locations within the route along the moving path as depicted in Figure 1b. It is depicted that the path loss predictions of Route 1 were larger than those of Route 2 and Route 3. This can be attributed to different degree of NLOS caused by obstructions due to trees and buildings along the routes. Another factor is that the base stations for each broadcasting stations were in different locations, causing different propagation losses.

5. Data Expansion Approach

Generally, machine learning algorithms are data hungry and they depend heavily on the amount of data. As such, a framework was developed for the expansion of the training dataset. When there is an increase in training data at new frequencies, it improves the accuracy of prediction. For instance, if the dataset at a new frequency is not learned, some particular relationships may not be learned at the new frequency. Hence, it becomes important to give some data at that new frequency. The normal practice is to engage in a measurement campaign to have the correct understanding of the channel features. However, this takes a lot of time, energy, and resources. In addition, enough data for machine learning algorithms cannot be obtained within a short time. This implies no sample is available or few measured samples can be used to train the model.
In an attempt to resolve the challenge, here, we developed a path loss framework that is a combination of machine learning algorithms and classical models, as against the empirical model used in [18]. Therefore, some samples can be made available at the new frequencies and used for the expansion of the training data. Figure 4 shows the proposed framework developed for the data expansion.
Demonstrating the workability of the proposed framework, we considered the measurements taken for all the three base stations, i.e., Orange FM, FUTA FM, and OSRC, operating at 94.5 MHz, 93.1 MHz, and 96.5 MHz, respectively. For each base station, we selected 100 data samples with each sample consisting of path loss and two inputs (distance and frequency).
By comparison of measured data at FUTA FM and Orange FM with the log-distance model, 30 locations that had the least fitting errors were chosen. Next, path loss prediction figures at those positions were calculated using the log-distance method at 96.5 MHz (OSRC). The computed dataset from the log-distance model was added to the samples from FUTA FM and Orange FM to formulate the training dataset. The measured samples for the OSRC base station, which were not part of the training process, were employed as test data.
With BPNN, four neurons were situated at the hidden layer, and the activation function used was the hyperbolic tangent sigmoid function. For the SVR algorithm, the coefficient of regularization and parameter of the Gaussian radial basis kernel function were 1, and the insensitivity loss was set at 0.125.
The results of prediction for 100 test samples for the OSRC base station are as depicted in Figure 5 (recall that there was no sample of the OSRC base station employed during the training process). The machine learning algorithms agreed well with measured data for that station. The RMSE of SVR, BPNN, AdaBoost, and log-distance algorithms were 1.52 dB, 2.43 dB, 1.77 dB, and 2.61 dB, respectively. Still, the machine learning algorithms performed better than the log-distance model. Therefore, it has been proven that the developed framework is useful for training data expansion, even when there is no measurement at the new frequency.
Furthermore, we added 30 measured samples for the OSRC base station to the training dataset, consisting of the samples from Orange FM and FUTA FM, and the ones generated from the log-distance model. The same hyperparameters occurred as when there were no measurement samples added to the training data for OSRC. Path loss prediction at 100 observation points was as shown in Figure 6. The RMSE values for SVR, PBNN, AdaBoost, and the log-distance model were 1.63 dB, 1.45 dB, 1.81 dB, and 1.88 dB. This implies the performance of the machine learning algorithms is improved when limited measured samples at a new frequency are collected and employed in the training process. This means that the accuracy of prediction of an algorithm corresponds to the number of samples. The developed framework expands the training data effectively by generating more samples reflecting the laws of propagation at the new frequency.
We have demonstrated how classical models generate channel data and are effective in the reduction of error in prediction initiated by the biases in the data. According to the results shown, the proposed data expansion framework provides new knowledge for fast and adequate prediction of path loss at new frequencies. Therefore, the framework can reduce cost and improve effectiveness of planning and budgeting in the deployment of wireless communications.

6. Conclusions and Future Directions

In this paper, AdaBoost, support vector regression (SVR), and back propagation neural network (BPNN) machine learning algorithms were employed to construct path loss models in tropical regions, with a particular reference to Akure metropolis, Ondo state, Nigeria. A measurement campaign was conducted at three different broadcasting stations (Ondo State Radiovision Corporation (OSRC), Orange FM, and FUTA FM), all situated within Akure metropolis. Furthermore, machine learning-dependent models for path loss prediction at various observation points were designed, at a particular frequency, and it was demonstrated how these models agreed quite well with measurement samples. In order to overcome the high requirement of training samples, a framework that combines machine learning algorithms and classical models was developed. The effectiveness and accuracy of the proposed framework was verified using measured data. The proposed framework is an alternative solution in dealing with the data-hungry problem associated with machine learning models in path loss prediction, because it reduces cost, resources, and time of measurements.
Finally, in spite of the results presented in this paper, there are still gaps requiring research attention. For instance, more research is needed to generate the required volume and quality of data in the study area to ensure an adequate training process. Additionally, with the fast growth in machine learning, new methods are still needed for accuracy improvement and adequate computational efficiency. As such, when solving the path loss problem, more models and parameters should be taken into account.

Author Contributions

Conceptualization, O.J.F.; methodology, O.J.F.; software, T.S.; validation, O.J.F., formal analysis, O.J.F.; investigation, O.J.F.; resources, T.S.; data curation, O.J.F.; writing—original draft preparation, O.J.F.; writing—review and editing, O.J.F. and T.S.; visualization, O.J.F.; project administration, O.J.F. and T.S.; funding acquisition, O.J.F. and T.S. All authors have read and agreed to the published version of the manuscript.

Funding

This research received no external funding.

Acknowledgments

This research was supported in part by the University Research Committee (URC) of the University of Johannesburg, South Africa. The authors wish to thank the authorities of the broadcast stations used for measurements: Ondo State Radiovision Corporation (OSRC), Orange FM, and FUTA FM, all in Ondo state, Nigeria, for making the required transmitting antenna information available. The efforts of Engr. Owolabi during the measurements is acknowledged and appreciated.

Conflicts of Interest

The authors declare no conflict of interest.

References

  1. Rappaport, T.S. Wireless Communications: Principles and Practice, 2nd ed.; Prentice-Hall: Upper Saddle River, NJ, USA, 2002. [Google Scholar]
  2. Phillips, C.; Sicker, D.; Grunwald, D. A Survey of Wireless Path Loss Prediction and Coverage Mapping Methods. IEEE Commun. Surv. Tutor. 2012, 15, 255–270. [Google Scholar] [CrossRef]
  3. Cogalan, T.; Videv, S.; Haas, H. Operating an In-Cabin Femto-Cellular System Within a Given LTE Cellular Network. IEEE Trans. Veh. Technol. 2018, 67, 7677–7689. [Google Scholar] [CrossRef]
  4. Neskovic, A.; Neskovic, N.; Paunovic, G. Modern approaches in modeling of mobile radio systems propagation environment. IEEE Commun. Surv. Tutor. 2000, 3, 2–12. [Google Scholar] [CrossRef]
  5. Ostlin, E.; Zepernick, H.-J.; Suzuki, H. Macrocell Path-Loss Prediction Using Artificial Neural Networks. IEEE Trans. Veh. Technol. 2010, 59, 2735–2747. [Google Scholar] [CrossRef]
  6. Erceg, V.; Greenstein, L.J.; Tjandra, S.Y.; Parkoff, S.R.; Gupta, A.; Kulic, B.; Julius, A.A.; Bianchi, R. An empirically based path loss model for wireless channels in suburban environments. IEEE J. Sel. Areas Commun. 1999, 17, 1205–1211. [Google Scholar] [CrossRef]
  7. Famoriji, O.J.; Olasoji, Y.O. UHF radio frequency propagation model for Akure metropolis. Res. J. Eng. Sci. 2013, 2, 6–10. [Google Scholar]
  8. Ayadi, M.; Ben Zineb, A.; Tabbane, S. A UHF Path Loss Model Using Learning Machine for Heterogeneous Networks. IEEE Trans. Antennas Propag. 2017, 65, 3675–3683. [Google Scholar] [CrossRef]
  9. Isabona, J.; Srivastava, V.M. Hybrid neural network approach for predicting signal propagation loss in urban microcells. In Proceedings of the 2016 IEEE Region 10 Humanitarian Technology Conference (R10-HTC), Agra, India, 21–23 December 2016; pp. 1–5. [Google Scholar]
  10. Faruk, N.; Popoola, S.I.; Surajudeen-Bakinde, N.T.; Oloyede, A.A.; Abdulkarim, A.; Ali, M.; Calafate, C.T.; Atayero, A.A.; Olawoyin, L.A. Path loss predictions in the VHF and UHF bands within urban environments: Experimental investigation of empirical, heuristics and geospatial models. IEEE Access 2019, 7, 77293–77307. [Google Scholar] [CrossRef]
  11. Wu, D.; Zhu, G.; Ai, B. Application of artificial neural networks for path loss prediction in railway environments. In Proceedings of the International Conference on Communications and Networking in China (CHINACOM), Beijing, China, 25–27 August 2010; pp. 1–5. [Google Scholar]
  12. Oroza, C.A.; Zhang, Z.; Watteyne, T.; Glaser, S.D. A Machine-Learning-Based Connectivity Model for Complex Terrain Large-Scale Low-Power Wireless Deployments. IEEE Trans. Cogn. Commun. Netw. 2017, 3, 576–584. [Google Scholar] [CrossRef]
  13. Popescu, I.; Nikitopoulos, D.; Nafornita, I.; Constantinou, P. ANN Prediction Models for Indoor Environment. In Proceedings of the 2006 IEEE International Conference on Wireless and Mobile Computing, Networking and Communications, Montreal, QC, Canada, 19–21 June 2006; pp. 366–371. [Google Scholar]
  14. Milijić, M.; Stanković, Z.; Milovanović, I. Hybrid-empirical neural model for indoor/outdoor path loss calculation. In Proceedings of the 2011 10th International Conference on Telecommunication in Modern Satellite Cable and Broadcasting Services (TELSIKS), Nis, Serbia, 5–8 October 2011; pp. 548–551. [Google Scholar]
  15. Zineb, A.B.; Ayadi, M. A multi-wall and multi-frequency indoor path loss prediction model using artificial neural networks. Arab. J. Sci. Eng. 2016, 41, 987–996. [Google Scholar] [CrossRef]
  16. Ayadi, M.; Ben Zineb, A. Body Shadowing and Furniture Effects for Accuracy Improvement of Indoor Wave Propagation Models. IEEE Trans. Wirel. Commun. 2014, 13, 5999–6006. [Google Scholar] [CrossRef]
  17. Zhao, X.; Hou, C.; Wang, Q. A New SVM-Based Modeling Method of Cabin Path Loss Prediction. Int. J. Antennas Propag. 2013, 2013, 279070. [Google Scholar] [CrossRef]
  18. Wen, J.; Zhang, Y.; Yang, G.; He, Z.; Zhang, W. Path Loss Prediction Based on Machine Learning Methods for Aircraft Cabin Environments. IEEE Access 2019, 7, 159251–159261. [Google Scholar] [CrossRef]
  19. Sotiroudis, S.P.; Goudos, S.K.; Gotsis, K.A.; Siakavara, K.; Sahalos, J.N. Application of a composite differential evo-lution algorithm in optimal neural network design for propagation path-loss prediction in mobile communication systems. IEEE Antennas Wirel. Propag. Lett. 2013, 12, 364–367. [Google Scholar] [CrossRef]
  20. Han, S.; Kim, H. On the Optimal Size of Candidate Feature Set in Random forest. Appl. Sci. 2019, 9, 898. [Google Scholar] [CrossRef]
  21. Imoize, A. Propagation measurements and modelling 1800 MHz in Lagos, Nigeria. Int. J. Wirel. Commun. Mob. Comput. 2013, 6, 165–173. [Google Scholar]
  22. Kavitha, K.N.; Ashok, S.; Imoize, A.L.; Ojo, S.; Selvan, K.S.; Ahanger, T.A.; Alhassan, M. On the Use of Wavelet Domain and Machine Learning for the Analysis of Epileptic Seizure Detection from EEG Signals. J. Healthc. Eng. 2022, 8928021. [Google Scholar] [CrossRef]
  23. Isabona, J.; Imoize, A.L.; Ojo, S.; Karunwi, O.; Kim, Y.; Lee, C.-C.; Li, C.-T. Development of a Multilayer Perceptron Neural Network for Optimal Predictive Modeling in Urban Microcellular Radio Environments. Appl. Sci. 2022, 12, 5713. [Google Scholar] [CrossRef]
  24. Zhang, Y.; Wen, J.; Yang, G.; He, Z.; Luo, X. Air-to-Air Path Loss Prediction Based on Machine Learning Methods in Urban Environments. Wirel. Commun. Mob. Comput. 2018, 8489326. [Google Scholar] [CrossRef]
  25. Hou, W.; Shi, D.; Gao, Y.; Yao, C. A new method for radio wave propagation prediction based on finite integral method and machine learning. In Proceedings of the 2017 IEEE 5th International Symposium on Electromagnetic Compatibility (EMC-Beijing), Beijing, China, 28–31 October 2017; pp. 1–4. [Google Scholar]
  26. Ojo, S.; Sari, A.; Ojo, T.P. Path Loss Modeling: A machine learning based approach using support vector regression and radial basis function models. Open J. Appl. Sci. 2022, 12, 990–1010. [Google Scholar] [CrossRef]
  27. Famoriji, O.J.; Oyeleye, M.O. A test of the relationship between refractivity and radio signal propagation for dry particulates. Res. Desk 2013, 2, 334–338. [Google Scholar]
  28. Famoriji, O.J.; Olasoji, Y.O. Radio frequency propagation mechanisms and empirical models for hilly areas. Int. J. Electr. Comput. Eng. 2013, 3, 372–376. [Google Scholar]
  29. Uccellari, M.; Facchini, F.; Sola, M.; Sirignano, E.; Vitetta, G.M.; Barbieri, A.; Tondelli, S. On the use of support vector ma-chines for the prediction of propagation losses in smart metering systems. In Proceedings of the 2016 IEEE 26th International Workshop on Machine Learning for Signal Processing (MLSP), Vietri sul Mare, Italy, 13–16 September 2016; pp. 1–6. [Google Scholar]
  30. Bishop, C.M. Pattern Recognition and Machine Learning (Information Science and Statistics); Springer: New York, NY, USA, 2006. [Google Scholar]
  31. De Sales Bezerra, T.; de Souza, J.A.R.; da Silva Eleutério, S.A.; Rocha, J.S. Approach to power prediction in WSN using propagation models: Practical analysis applied in water reservoirs. In Proceedings of the 2015 Latin American Network Operations and Management Symposium (LANOMS), João Pessoa, Brazil, 1–3 October 2015; pp. 73–76. [Google Scholar]
Figure 1. Map of the study area. (a) Akure metropolis showing the location of the base stations. (b) Measurements campaign routes.
Electronics 11 02711 g001
Figure 2. The TENMARS TM-195 3-axis RF field strength meter electromagnetic field radiation (EMF) tester.
Electronics 11 02711 g002
Figure 3. Path loss prediction of various machine-learning algorithms on the test dataset using samples from OSRC base station; 80% of data were used for training while the other 20% for tests.
Electronics 11 02711 g003
Figure 4. The proposed framework for data expansion using classical model.
Electronics 11 02711 g004
Figure 5. Path loss prediction performance of machine learning algorithms using 100 sample data for OSRC base station operating at 96.5 MHz. Note: For sample data of OSRC, only 30 computed samples were used in the training.
Electronics 11 02711 g005
Figure 6. Path loss prediction performance of machine learning algorithms using 100 sample data for OSRC base station operating at 96.5 MHz. Note: 30 computed and 30 measured samples were used during the training.
Electronics 11 02711 g006
Table 1. Performance evaluation of various models using 20% test samples from Orange FM (94.5 MHz) Base Station.
MetricAdaBoostSVRBPNNLog-Distance
MAE (dB)1.151.171.991.32
MAPE (%)5.475.736.357.45
RMSE (dB)4.035.325.756.12
ESD (dB)4.155.345.686.32
MaxPE (dB)13.0813.2814.8321.63
Table 2. Performance evaluation of various models using 20% test samples from FUTA FM (93.1 MHz) Base Station.
MetricAdaBoostSVRBPNNLog-Distance
MAE (dB)1.061.261.871.02
MAPE (%)5.125.235.946.66
RMSE (dB)3.435.115.455.98
ESD (dB)4.015.145.286.01
MaxPE (dB)12.8512.8814.5619.67
Table 3. Performance evaluation of various models using 20% test samples from OSRC (96.5 MHz) Base Station.
MetricAdaBoostSVRBPNNLog-Distance
MAE (dB)1.652.113.392.22
MAPE (%)6.476.737.358.45
RMSE (dB)4.156.226.757.13
ESD (dB)5.156.436.787.43
MaxPE (dB)13.8714.0314.8321.88
Publisher’s Note: MDPI stays neutral with regard to jurisdictional claims in published maps and institutional affiliations.

