Article

Evaluation of Signal Quality from a Wearable Phonocardiogram (PCG) Device and Personalized Calibration

by
Prashanth Shyam Kumar
1,*,
Mouli Ramasamy
1 and
Vijay K. Varadan
1,2
1
The Department of Engineering Science and Mechanics, The Pennsylvania State University, State College, PA 16802, USA
2
The Department of Neurosurgery, Milton S. Hershey Medical Center, Hershey, PA 17033, USA
*
Author to whom correspondence should be addressed.
Electronics 2022, 11(17), 2655; https://doi.org/10.3390/electronics11172655
Submission received: 21 July 2022 / Revised: 15 August 2022 / Accepted: 23 August 2022 / Published: 25 August 2022

Abstract

:
Currently, the only clinically utilized Phonocardiogram (PCG) is an electronic stethoscope used in a hospital or clinical environment. The availability of continuously recorded PCGs can provide a new avenue of research into chronic disease management at home. Researchers have proposed such wearable PCG devices. However, limitations exist in evaluating such devices as PCG recording devices in home-like environments. Here, we evaluate a wearable PCG system in a belt-type form factor with an embedded force sensor, accelerometer, and a single lead ECG to study the feasibility of acquiring diagnostic-grade PCGs while the wearer performs daily activities. We describe qualitative and quantitative exploratory analysis methods for cross-subject comparison of PCG signal quality, wearer comfort, and the impact of activities using Signal-to-Noise (SNR) comparisons and cross-spectral coherence between activity and PCG. The analysis of the data suggests that a common user-chosen method of donning a wearable PCG is not applicable across subjects for obtaining optimal PCG recording quality. We propose a method to calibrate wearable PCG devices using an embedded force sensor and by following a protocol involving feedback from the embedded force sensor to determine the optimal method of wearing the device. Following a similar path to precision medicine using genomic data and the extrapolation of risk, wearable devices with healthcare applications should be developed with the ability to be adapted and calibrated to each individual. In the immediate future this may involve calibration procedures such as those followed in this work, using controlled measurements performed with each patient to tune a device for them.

1. Introduction

Heart sounds have traditionally been assessed using stethoscopes. Physicians require several years of training to listen to heart sounds and diagnose conditions. PCGs are visual representations of stethoscope readings that can be recorded digitally and can offer more accurate recordings of measurements made by stethoscope without relying on the qualitative assessment of traditional stethoscopes. Additionally, these can be reviewed retrospectively as needed for reassessment. These reasons have motivated the development of wearable PCGs. In addition, wearable PCGs are a new class of devices that have yet to be widely used in clinical practice. There is tremendous potential for their application in cardiac care at home. During a routine physical examination, heart and lung sounds are most often assessed along with blood pressure. ECGs are ordered when there is suspicion of any rhythm-related problems or if the patient complains of palpitations or other discomforts. ECG and heart sound, if monitored together continuously, can open an entirely new avenue for research into chronic disease management and remote health monitoring in general. However, wearable devices for PCG are rarely reported on in the literature. Examples include devices embedded with a novel acoustic sensor in an adhesive patch or a wearable belt form factor. Simultaneous measurement of PCG and ECG has been demonstrated recently using adhesive patch-type electrodes [1,2]. The reported devices can be divided into four categories based on how they are applied to the user.
  • Belts or Bands that are Adjustable and Incorporate the Sensing Device
The construction of such devices can remain modular, with a sensing component that is separable from the belt, allowing the belt or band to be washed as needed and the sensing component to be mounted before use. This makes the device reusable. Belts and bands can be adjusted over a wide range of circumferences of the chest using a clasping or fastening mechanism, meaning that multiple sizes to serve significant variations in the user population’s body habitus can be avoided. However, as a practical matter, belts and bands are liable to shift upwards or downwards on the chest as the user wears the device for a long duration and performs tasks or activities involving movements such as bending forward or sitting in a slouched posture. This may happen because no mechanisms are incorporated within the belt to prevent slipping against the skin. This is a limitation for long-term recording devices, as the device’s position is essential for interpretating the characteristic heart sounds. For example, with the sensors placed predominantly at the level of the sternum or below and on the anatomic left, S1 sounds will be louder than S2 sounds in normal individuals. However, if the sensors are placed above the heart, S2 sounds will appear to be louder than the S1 sounds. Clinically, the placement of a stethoscope is decided based on which part of the heart and heart valves need to be auscultated. Without a mechanism to confirm the location of the sensor relative to the heart, the collected data could lead to misinterpretation.
  • Discrete Hand-Held Devices that can be Placed and Held in Place by a Trained Medical Professional to Ensure Appropriate Positioning of the Heart Sound Sensor
Although not strictly wearable, such PCG measurement devices have reached the stage of commercial adoption [3]. A trained physician or nurse places the sensing element on the appropriate area of the patient’s thorax to auscultate the heart sounds. The fidelity of the measurements is comparable to a traditional stethoscope, and offers the added availability of digitized PCG waveform data. However, as mentioned, these classes of devices are not wearable. They are not suitable for unassisted use by patients at home due to the requirement of placing the sensing element at the appropriate anatomical location.
  • Sensing Elements that are Incorporated into a Garment
There are very few examples in the literature of garments incorporating sensors for PCG measurement. Sapsanis et al. presented a StethoVest with an array of microphones for cardio-acoustic mapping embedded in a vest [4]. Garments made of textiles are the most natural materials for wearables because they are worn daily. Garments cover a large surface area of the body, meaning that multiple sensors can be embedded while maintaining a discreet appearance for the user’s privacy, and are less cumbersome to use compared to belts, bands, or adhesives. However, sizing and fitting garments is a critical consideration for obtaining high-quality heart sound signals, especially during movement, because sensing elements embedded in garments can move relative to the skin. Conformal fitting of such garments to a widely varying population with differences in gender, body habitus, and BMI requires personalized garment fitting. Such an endeavor is unsustainable from a cost perspective.
  • Adhesives Used to Apply Sensors at Specific Anatomic Locations
Adhesives can be formulated with different strengths, ranging from mild adhesives for temporary or short-term use to strong adhesives meant to hold devices against the skin for several days, even up to seven days [5]. First, adhesives can ensure that the device remains at the location on the skin where it is placed. Second, the relative movement between the sensing element and the skin can be minimized. Finally, they are easy to apply by users and patients themselves. However, adhesive-based devices first require patients to know the exact anatomical location where the sensor should be placed, which can be challenging and can lead to user errors in which the sensors are placed at different locations from one use to the next. Second, adhesives can lead to skin irritation when used for long durations or repeatedly used at the same location on the skin.
On balance, the belt type of wearable PCG device is the most convenient to apply and adjust as needed in order to explore the relationship between subjective comfort and objective quality of the data. The primary limitation of the belt-type form factor is the potential for slipping or upward or downward movement of the belt. This can be mitigated with the use of clothing gripper materials that are widely used nowadays in undergarments and sportswear. Therefore, the present research evaluates a belt-type sensor. Notably, despite the various approaches evaluated in the literature, no articles have described a protocol for measuring PCGs while performing daily activities. Motion artifacts are the most prominent cause of noise in these signals; they can corrupt measurements to the point of being wholly unusable, or worse, misleading, meaning that physicians may draw the wrong conclusions and misdiagnose patients. It is crucial to establish a more specific plan for evaluating the limits of such devices. Table 1 presents the various wearable PCG devices proposed by researchers in the literature.
There is scarce data available for wearable phonocardiograms. Even for devices proposed during research, there has not been very much evaluation of how data quality might change during daily activities or of how it changes from subject to subject or for the same subject from one use to the next. We believe two important aspects need to be addressed in the development of wearable PCG devices. The first is the aspect of designing and discovering novel sensors that are suitable for wearable devices [10,11,12,13,14]. Notably, the repeatability, performance, and reliability of this aspect must be presumed before proceeding to the second aspect, namely, real-world performance analysis of wearable PCGs on subjects performing common ambulatory activities. The former has received considerable attention, as it is the first and most critical component of wearable PCG device design. The latter, however, has not received adequate attention. The reasons may include the challenges involved in performing human testing or a lack of proposed frameworks for real-world evaluation of such devices. Therefore, the present research focuses on the following:
  • Obtain PCG recordings using a wearable belt-mounted form factor sensor during daily activities to explore noise types introduced by movement and other noise sources.
  • Explore how signal characteristics change from subject to subject and depending on how subjects wear the device. The findings are specific to devices that use a belt form factor to apply a heart sound recording system.
We designed a wearable system for PCG acquisition as well as sensors for activity and force between the audio sensor and the skin. In addition, a protocol for a controlled study was followed in order to allow PCGs to be recorded during controlled movements and activities. The data acquired through this protocol enable a novel analysis methodology that could be used to calibrate such belt-mounted wearable PCGs for individuals.
The remainder of this paper is organized as follows. In Section 2.1, we describe the construction of the WPAS device used for testing. In Section 2.2, we describe the protocol for acquiring data while subjects perform different tasks that emulate common daily activities. In Section 2.3, we describe the data analysis methods applied to the collected data, along with the goal of each analysis method and the reason for performing the analysis. In Section 3, we present the results of the methods described in Section 2. In Section 4, we discuss the limitations of the present study and the scope of additional research. Finally, we summarize and conclude our findings in Section 5.

2. Materials and Methods

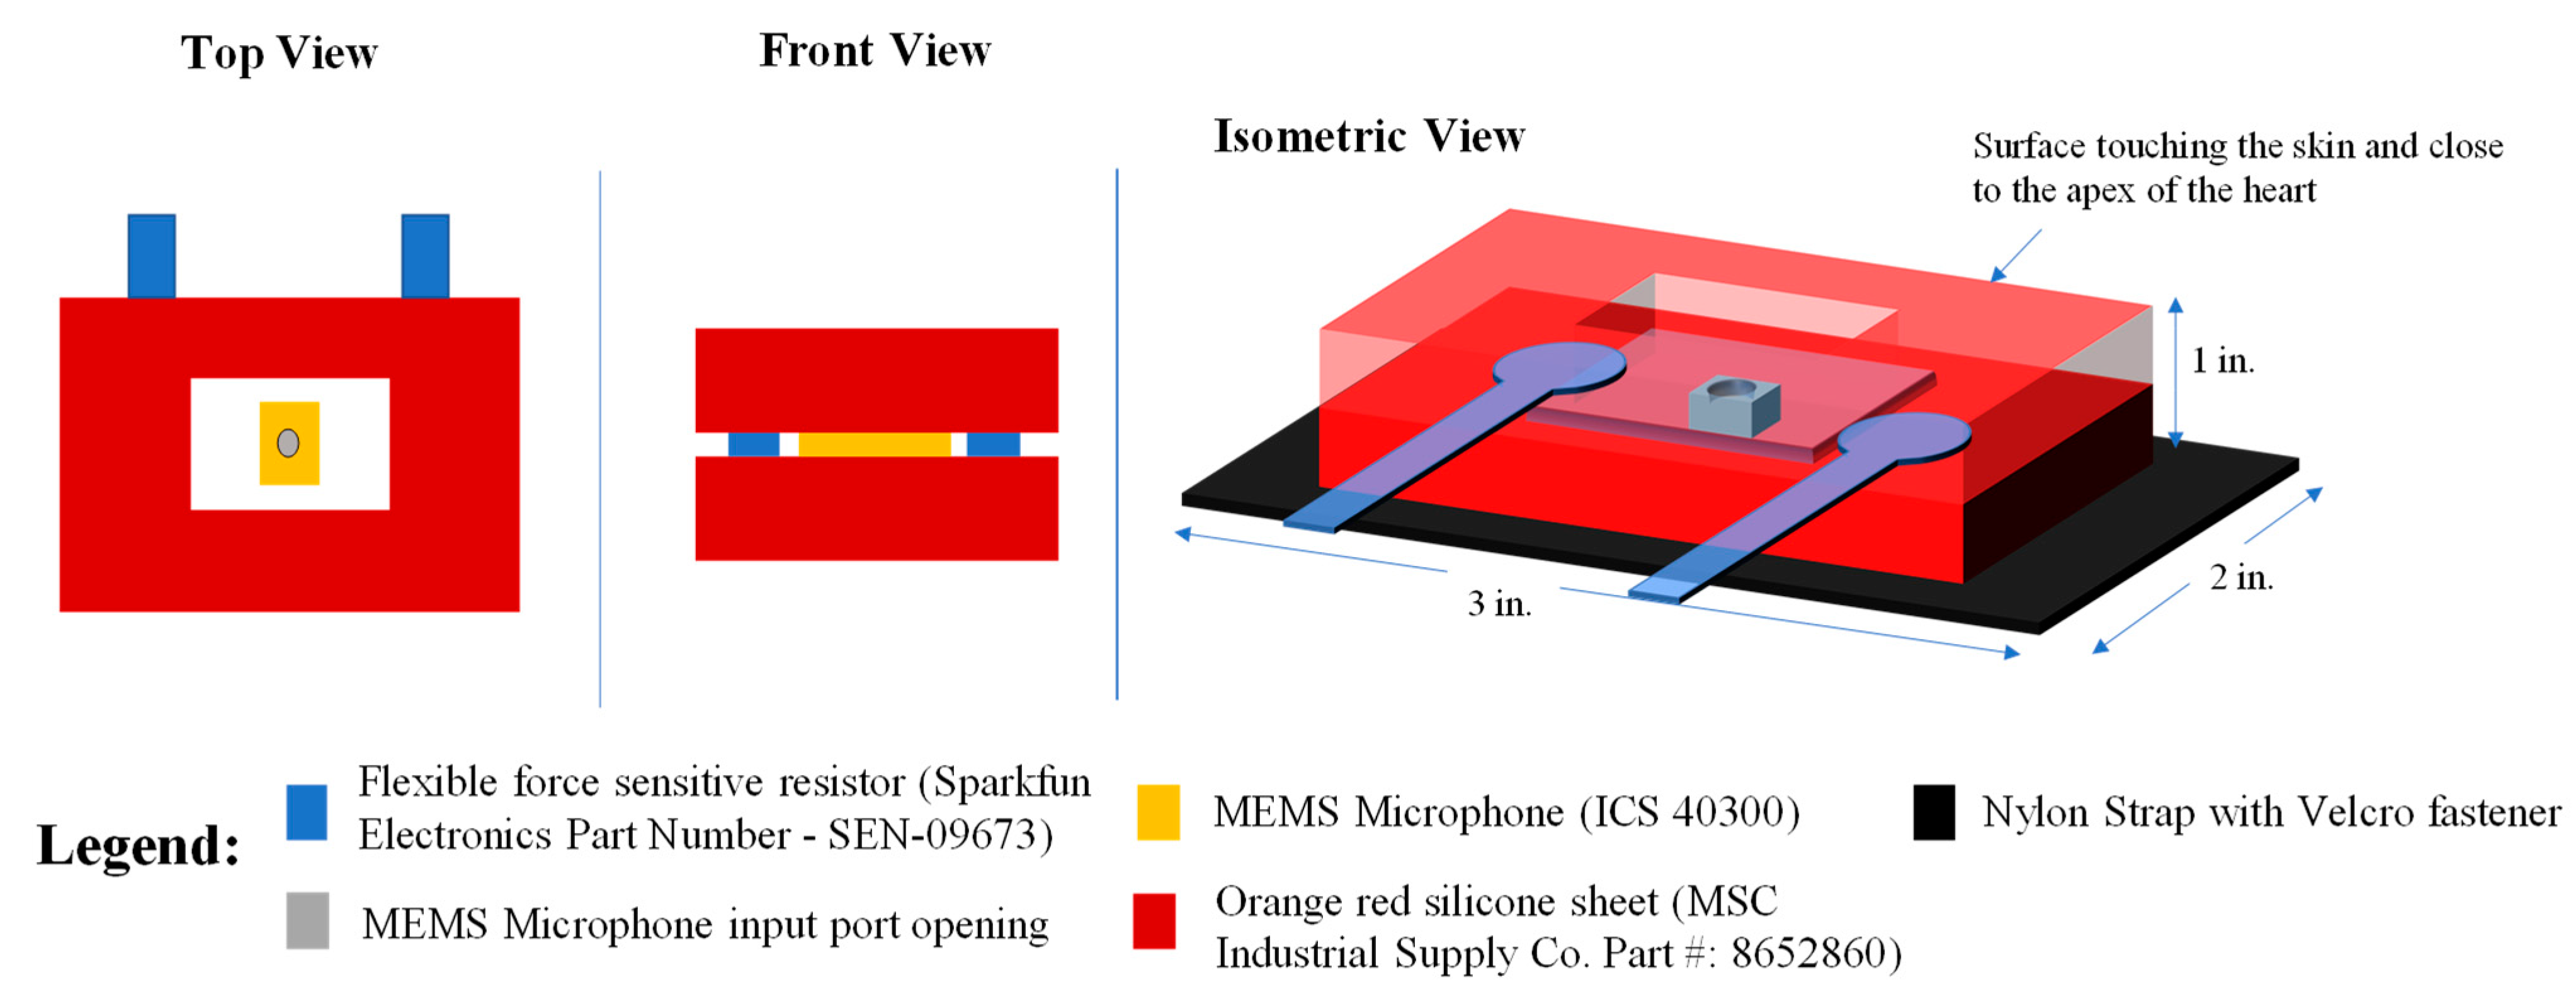
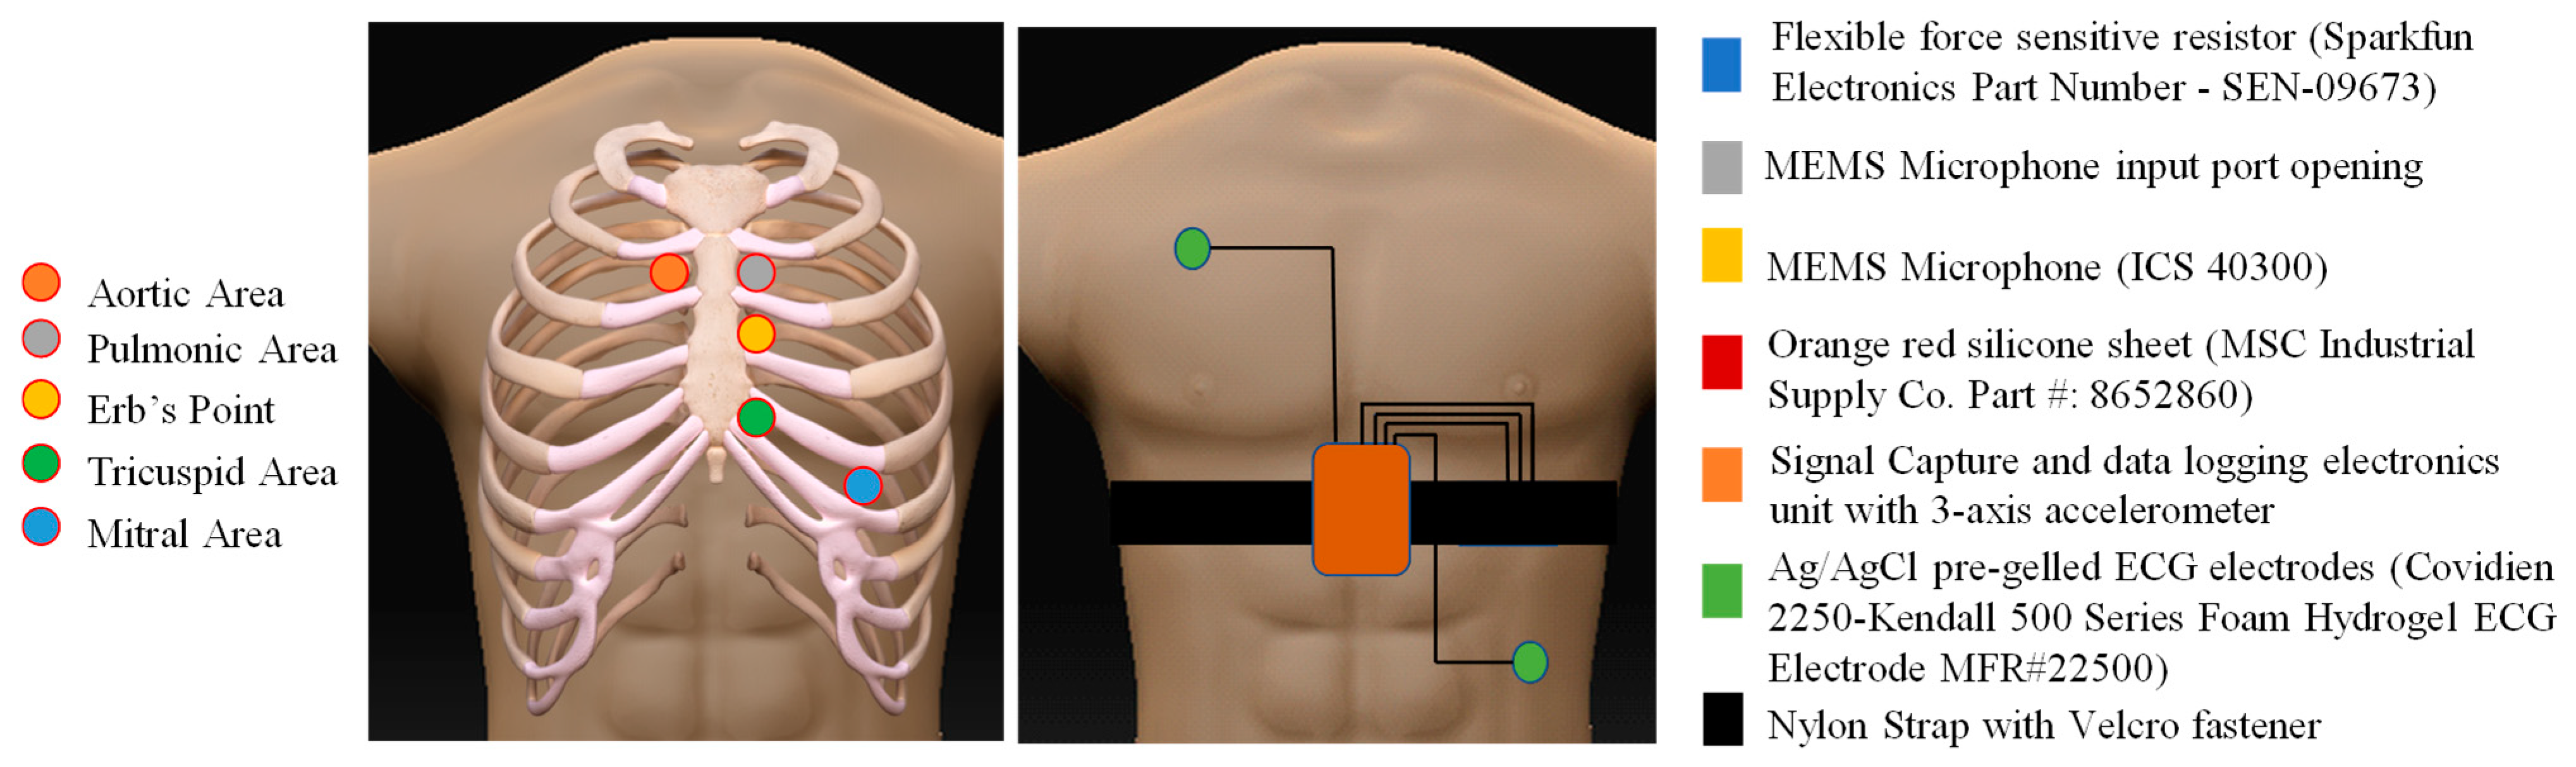
2.1. Device Design and Description

A testbed was designed for heart sound measurement in a wearable form factor. The experimental testbed, called the Wearable Phonocardiogram Acquisition System (WPAS), includes a sensing element and instrumentation to support the digitization of signals. The sensing element consists of heart sound sensors using a MEMS Microphone, an ECG measurement channel, and a three-axis accelerometer. The sensing element is mountable on any belt using Velcro. A nylon belt with Velcro fastenings was used to hold the device in place on the test subjects. A sensor hanging freely or mounted on an unstable substrate, such as everyday clothing, may encounter motion artifacts and a low signal-to-noise ratio, whereas a belt design offers adequate reinforcement to the sensor component, reduces relative motion between the component and the body, and provides an adequate yet comfortable way to don a wearable device.
The MEMS microphone is sandwiched between two layers of biocompatible silicone sheets. The silicone sheets help to elevate the microphone’s input port away from the skin to avoid noise caused by brushing against the skin. Two flexible resistive force sensors are included on either side of the MEMS microphone to act as proxies for the force between the belt and the skin and for the distance between the microphone and the surface of the skin. Figure 1 provides a three-dimensional illustration of the sensing element. Figure 2 illustrates the placement of the sensing element on the thorax. Figure 1 illustrates the location of the sensors on the body when worn. One channel of ECG is acquired in the Lead II position. The primary purpose of the ECG is to serve as an additional marker for identifying heartbeats by identifying R peak timings in ECG waveforms and aligning the heart sounds with heartbeats. The accelerometer is included in the data acquisition unit and is affixed to the nylon belt. This accelerometer is positioned where it is most likely to capture all movements in the protocol.
A software application was developed using MATLAB R2021a, MathWorks Inc, Natick, MA, USA. The WPAS Software Application is a custom-designed software application built using MATLAB (MathWorks Inc.) that communicates with the WPAS Signal acquisition unit over Bluetooth. The software application sets the current time on the electronics unit and initiates recording data on it. The software application further provides a means to log the time at which each activity in the protocol is initiated.

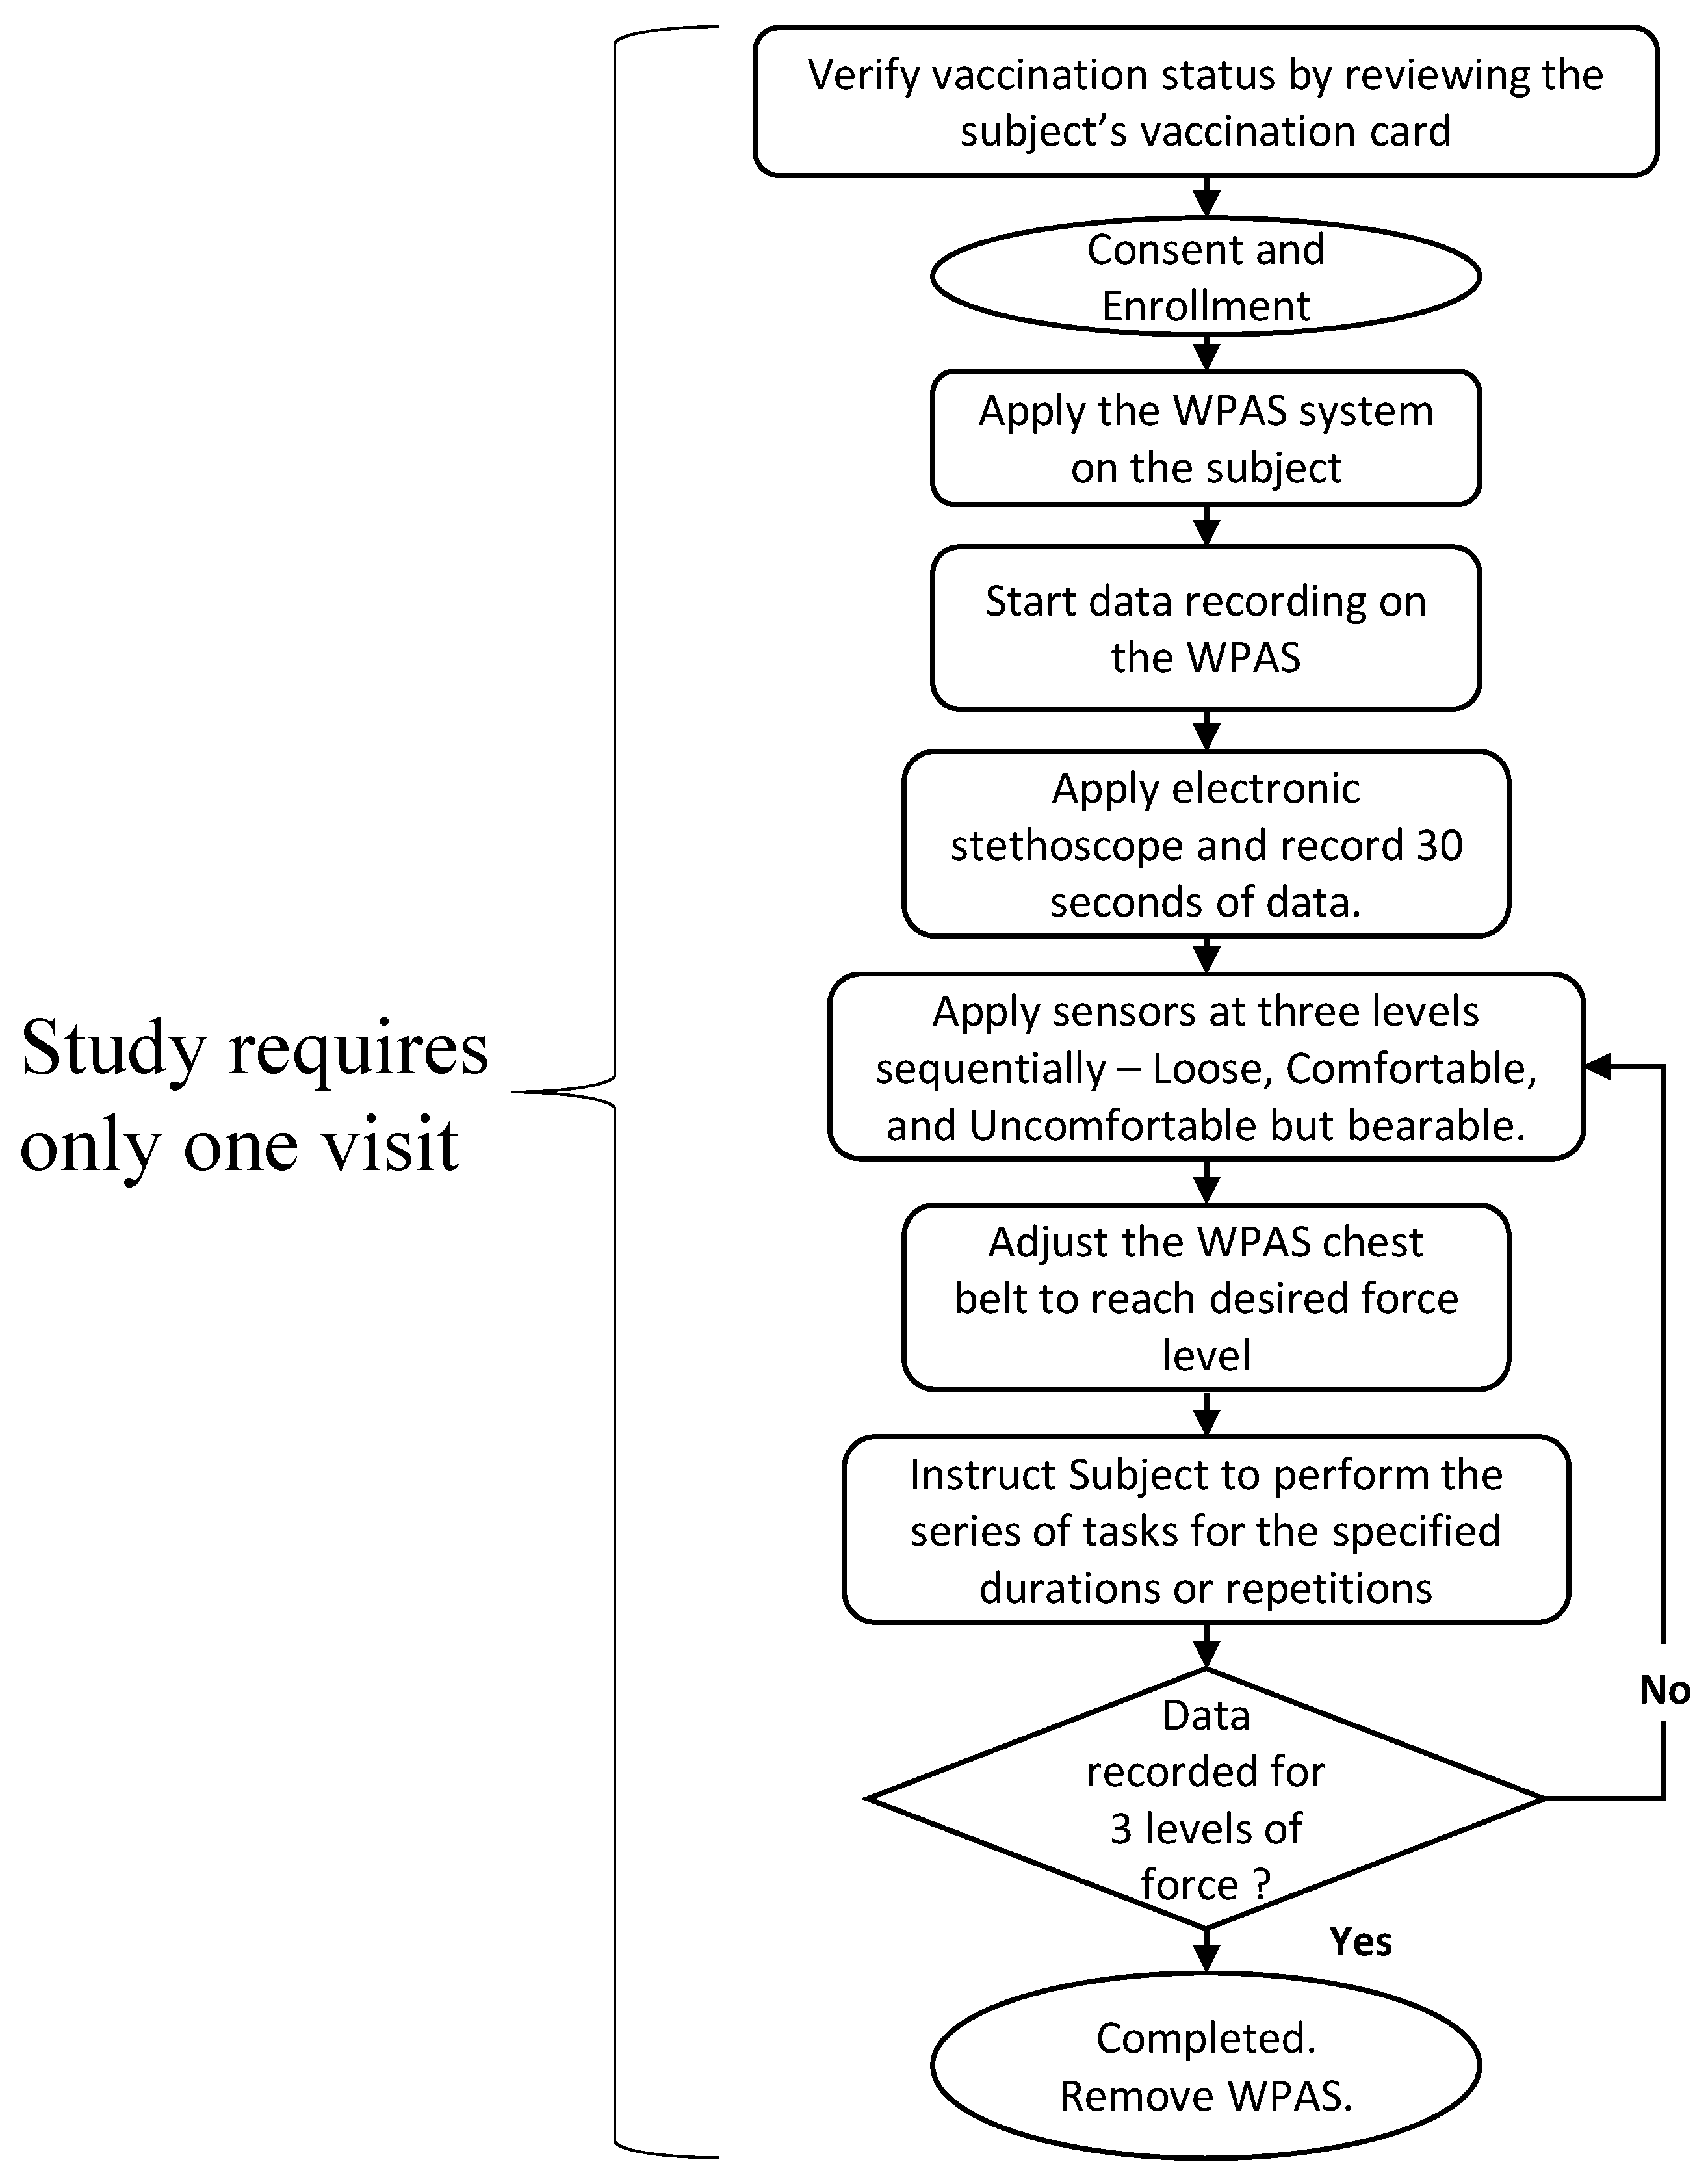
2.2. Protocol for Data Acquisition

The measurements from the sensors described in Section 2.1 are used to guide experimentation on the impact of the tightness of the belt and PCG signal quality in the presence of various movements. The overall study flow is depicted in Figure 3. The study was reviewed and approved by the Institutional Review Board (IRB) at the Pennsylvania State University (IRB # STUDY00018016).
After subjects began to wear the device and recording of data was initiated, a commercially available FDA-cleared electronic stethoscope (Eko Core, Eko devices Inc. Berkeley, CA, USA) was applied to the subject’s body as closely as possible to the location of the sensing element of the WPAS and data were recorded from the stethoscope. It was not possible to place the sensors of the two devices at the same location on the subject’s thorax; they would mutually interfere, as both the WPAS and Eko devices require flush contact between the silicone sheet and stethoscope diaphragm with the skin, and cannot be placed at the same physical location on the subject’s thorax for auscultation. The Eko diaphragm and the input port of the WPAS MEMS component were thus placed adjacent to each other on the subjects’ skin, with the separation not exceeding 1.5 inches between the center of the diaphragm of the Eko device and the WPAS MEMS input port. Furthermore, perfect time synchronization across devices with millisecond precision is infeasible. Instead, three physical finger-tap stimuli on the thorax of the subjects near both sensors were used as fiducial time markers for retrospective synchronization of the data from the two devices. This step was performed to obtain a validation reading in order to compare the timing of heart sounds with the measured heart sounds. Figure 4 illustrates the manifestation of the physical tap stimuli and the alignment of the S1 and S2 sounds between the Eko Core device and the WPAS. After this initial simultaneous recording of PCG using Eko and WPAS was performed, the remainder of the protocol (Table 2) was followed with only the WPAS worn by the subject. The Eko device is not intended to be used as a wearable device, and thus was not applied during performance of the activities listed in Table 2.
The subjects were then asked to perform a sequence of movements as listed in Table 2. The intent was to emulate most movements that are likely among patients at home. Moderate or high-intensity exercise movements were not included, as they seemed to corrupt the PCGs entirely and were not helpful diagnostically. The first eight movements emulated everyday movements, the ninth emulated speech, and the rest emulated the impact of posture on the PCG measurements. These activities were repeated upon setting the force values between the WPAS and the skin at three qualitative levels as deemed by the subjects: loose (the sensing element barely touches the skin), comfortable (the sensing element is in flush contact with the skin), and uncomfortable but bearable (the sensing element is in full contact with the skin and the subject can perform all movements without difficulty). Preset levels of force in the sensing element could not be achieved among subjects with higher BMI. Specifically, force levels in the range of 7–9 Newtons could not be achieved without causing discomfort to some of the subjects. Therefore, a subjective scale was chosen to control the extent to which the WPAS belt was tightened to reach the force levels. The subjective levels were defined as follows:
  • “Loose” when the WPAS sensing element was just touching the skin during Stand Still 1.
  • “Comfortable” when the WPAS sensing element was in flush contact with the skin, with the WPAS belt feeling similar to a typical undergarment.
  • “Uncomfortable” when the WPAS belt was secured as tightly as possible within tolerable limits, with the subject feeling no discomfort in the form of pain or difficulty performing the activities in Table 2.

2.3. Data Analysis

This section describes the analyses performed on the acquired data.
  • Evaluation of the WPAS system for recording PCGs:
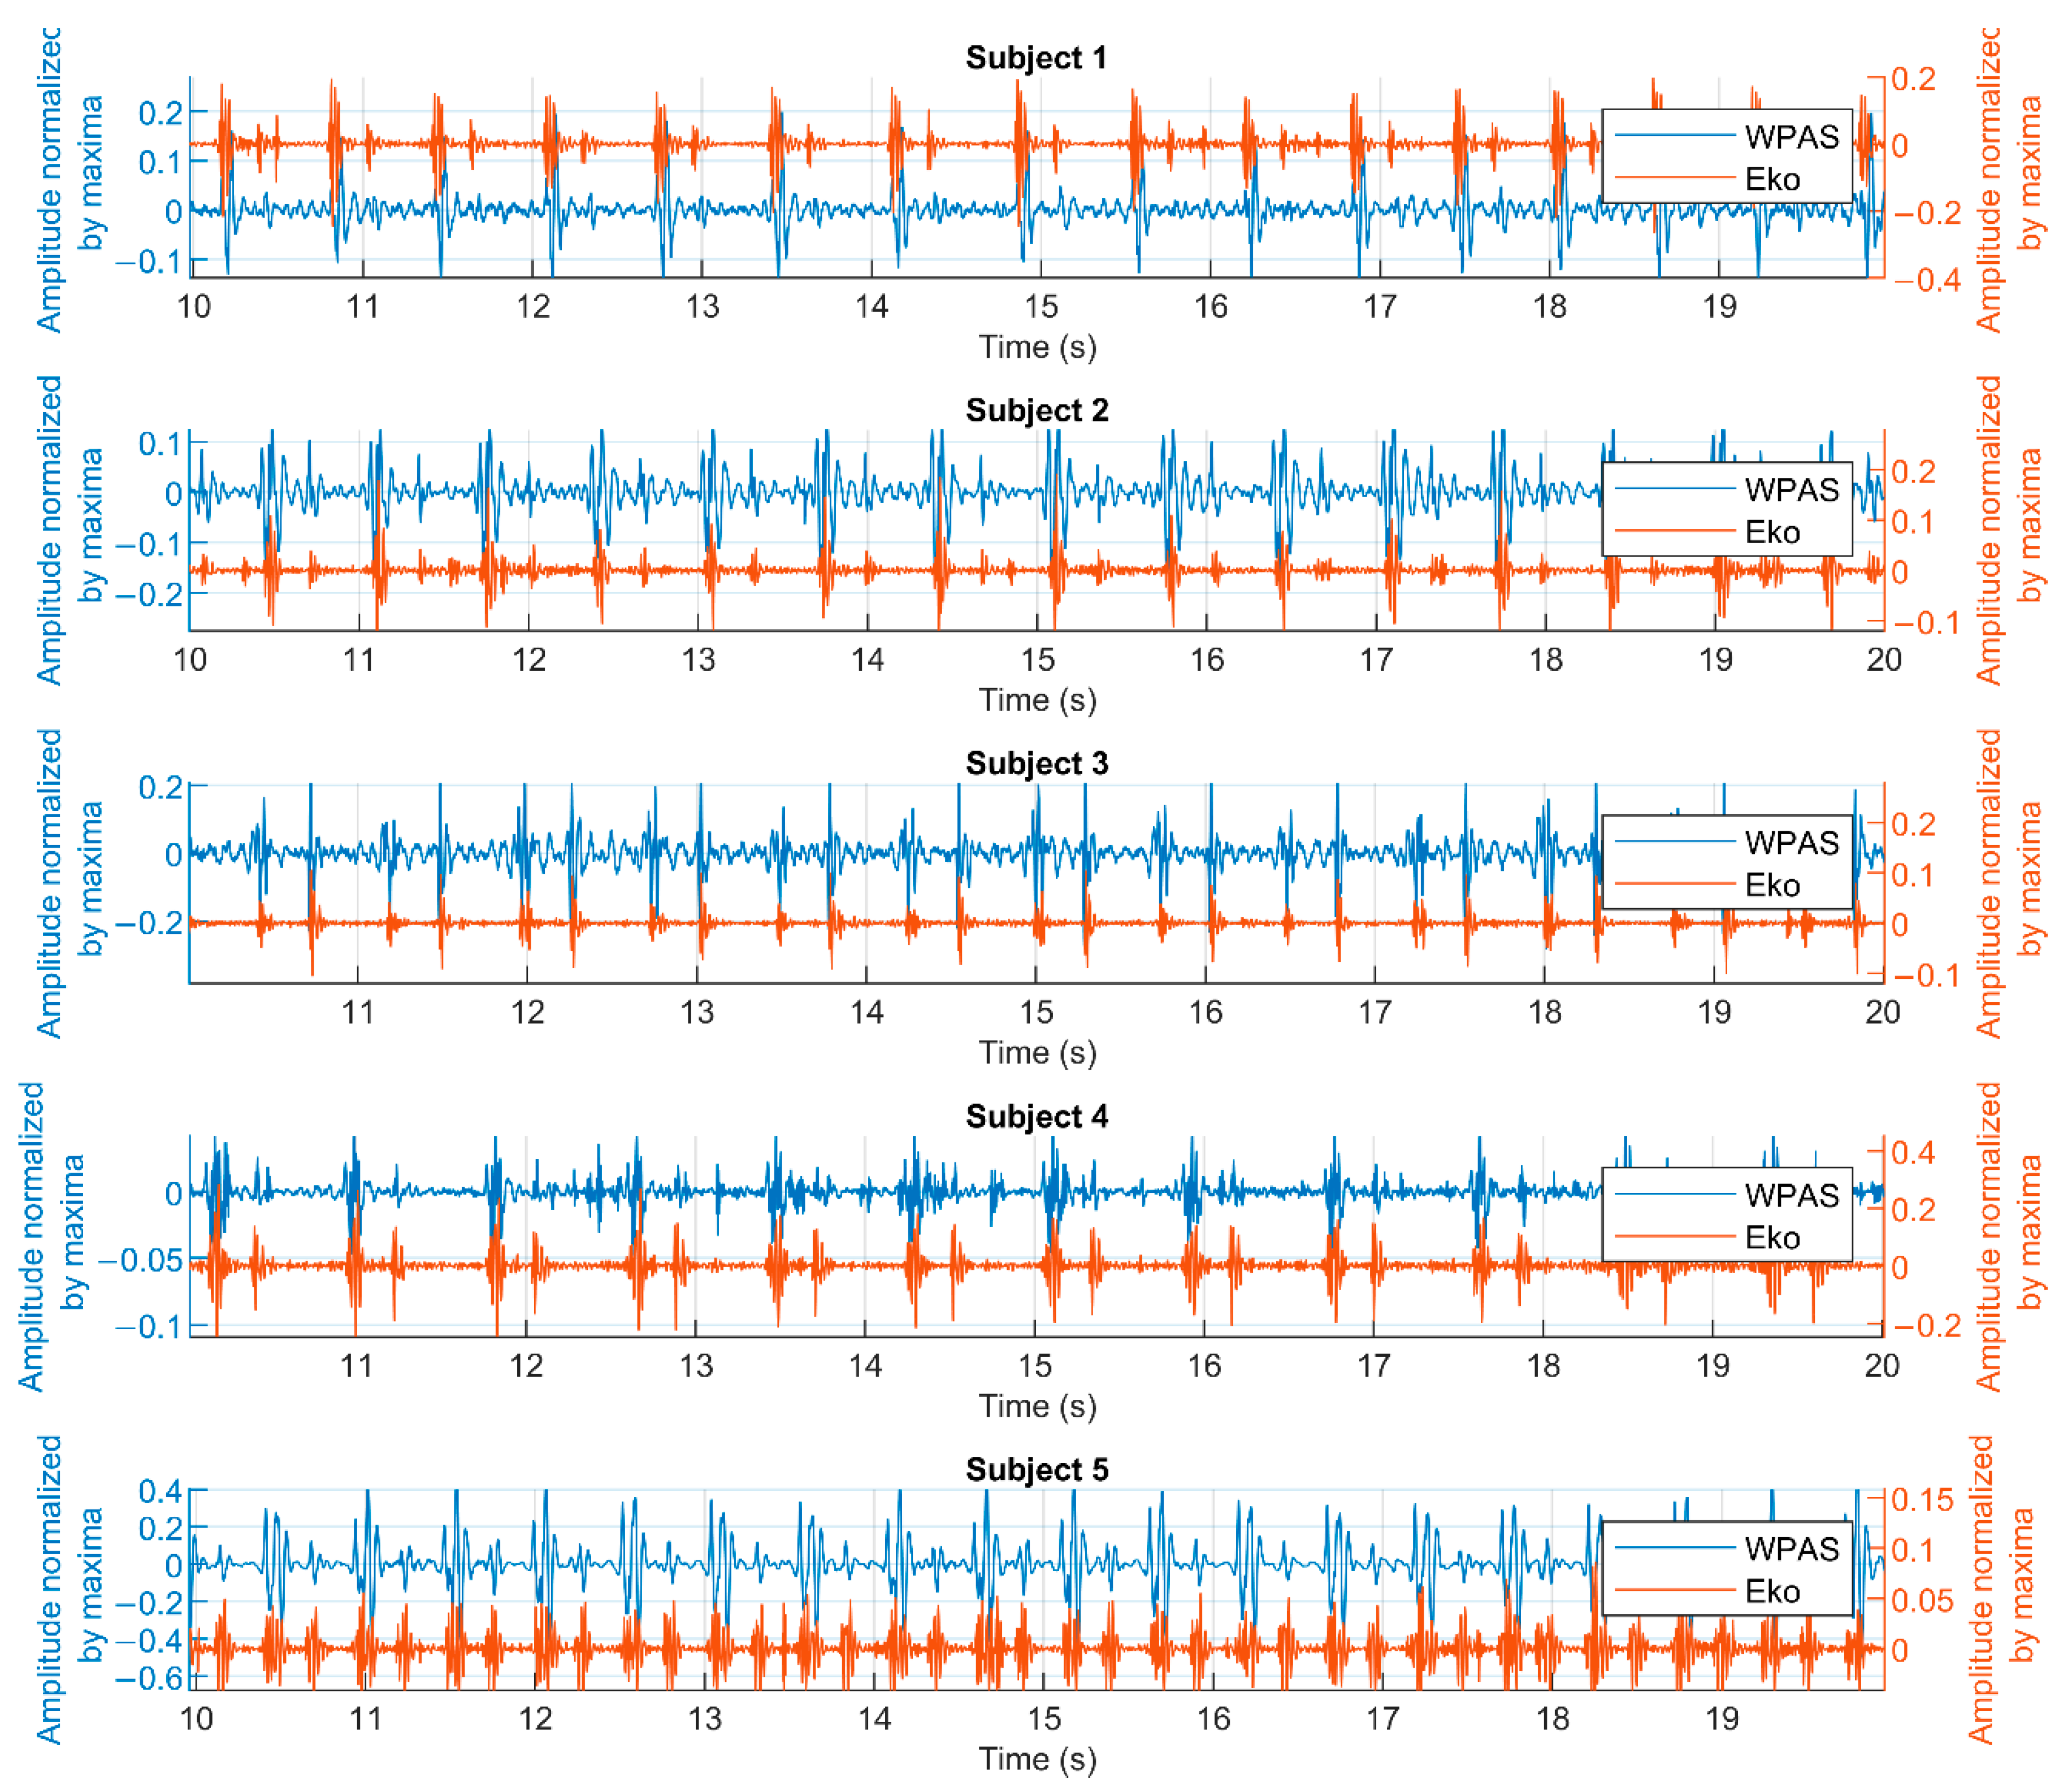
  • Comparison of WPAS to a commercial electronic stethoscope to validate that WPAS captures heart sounds.
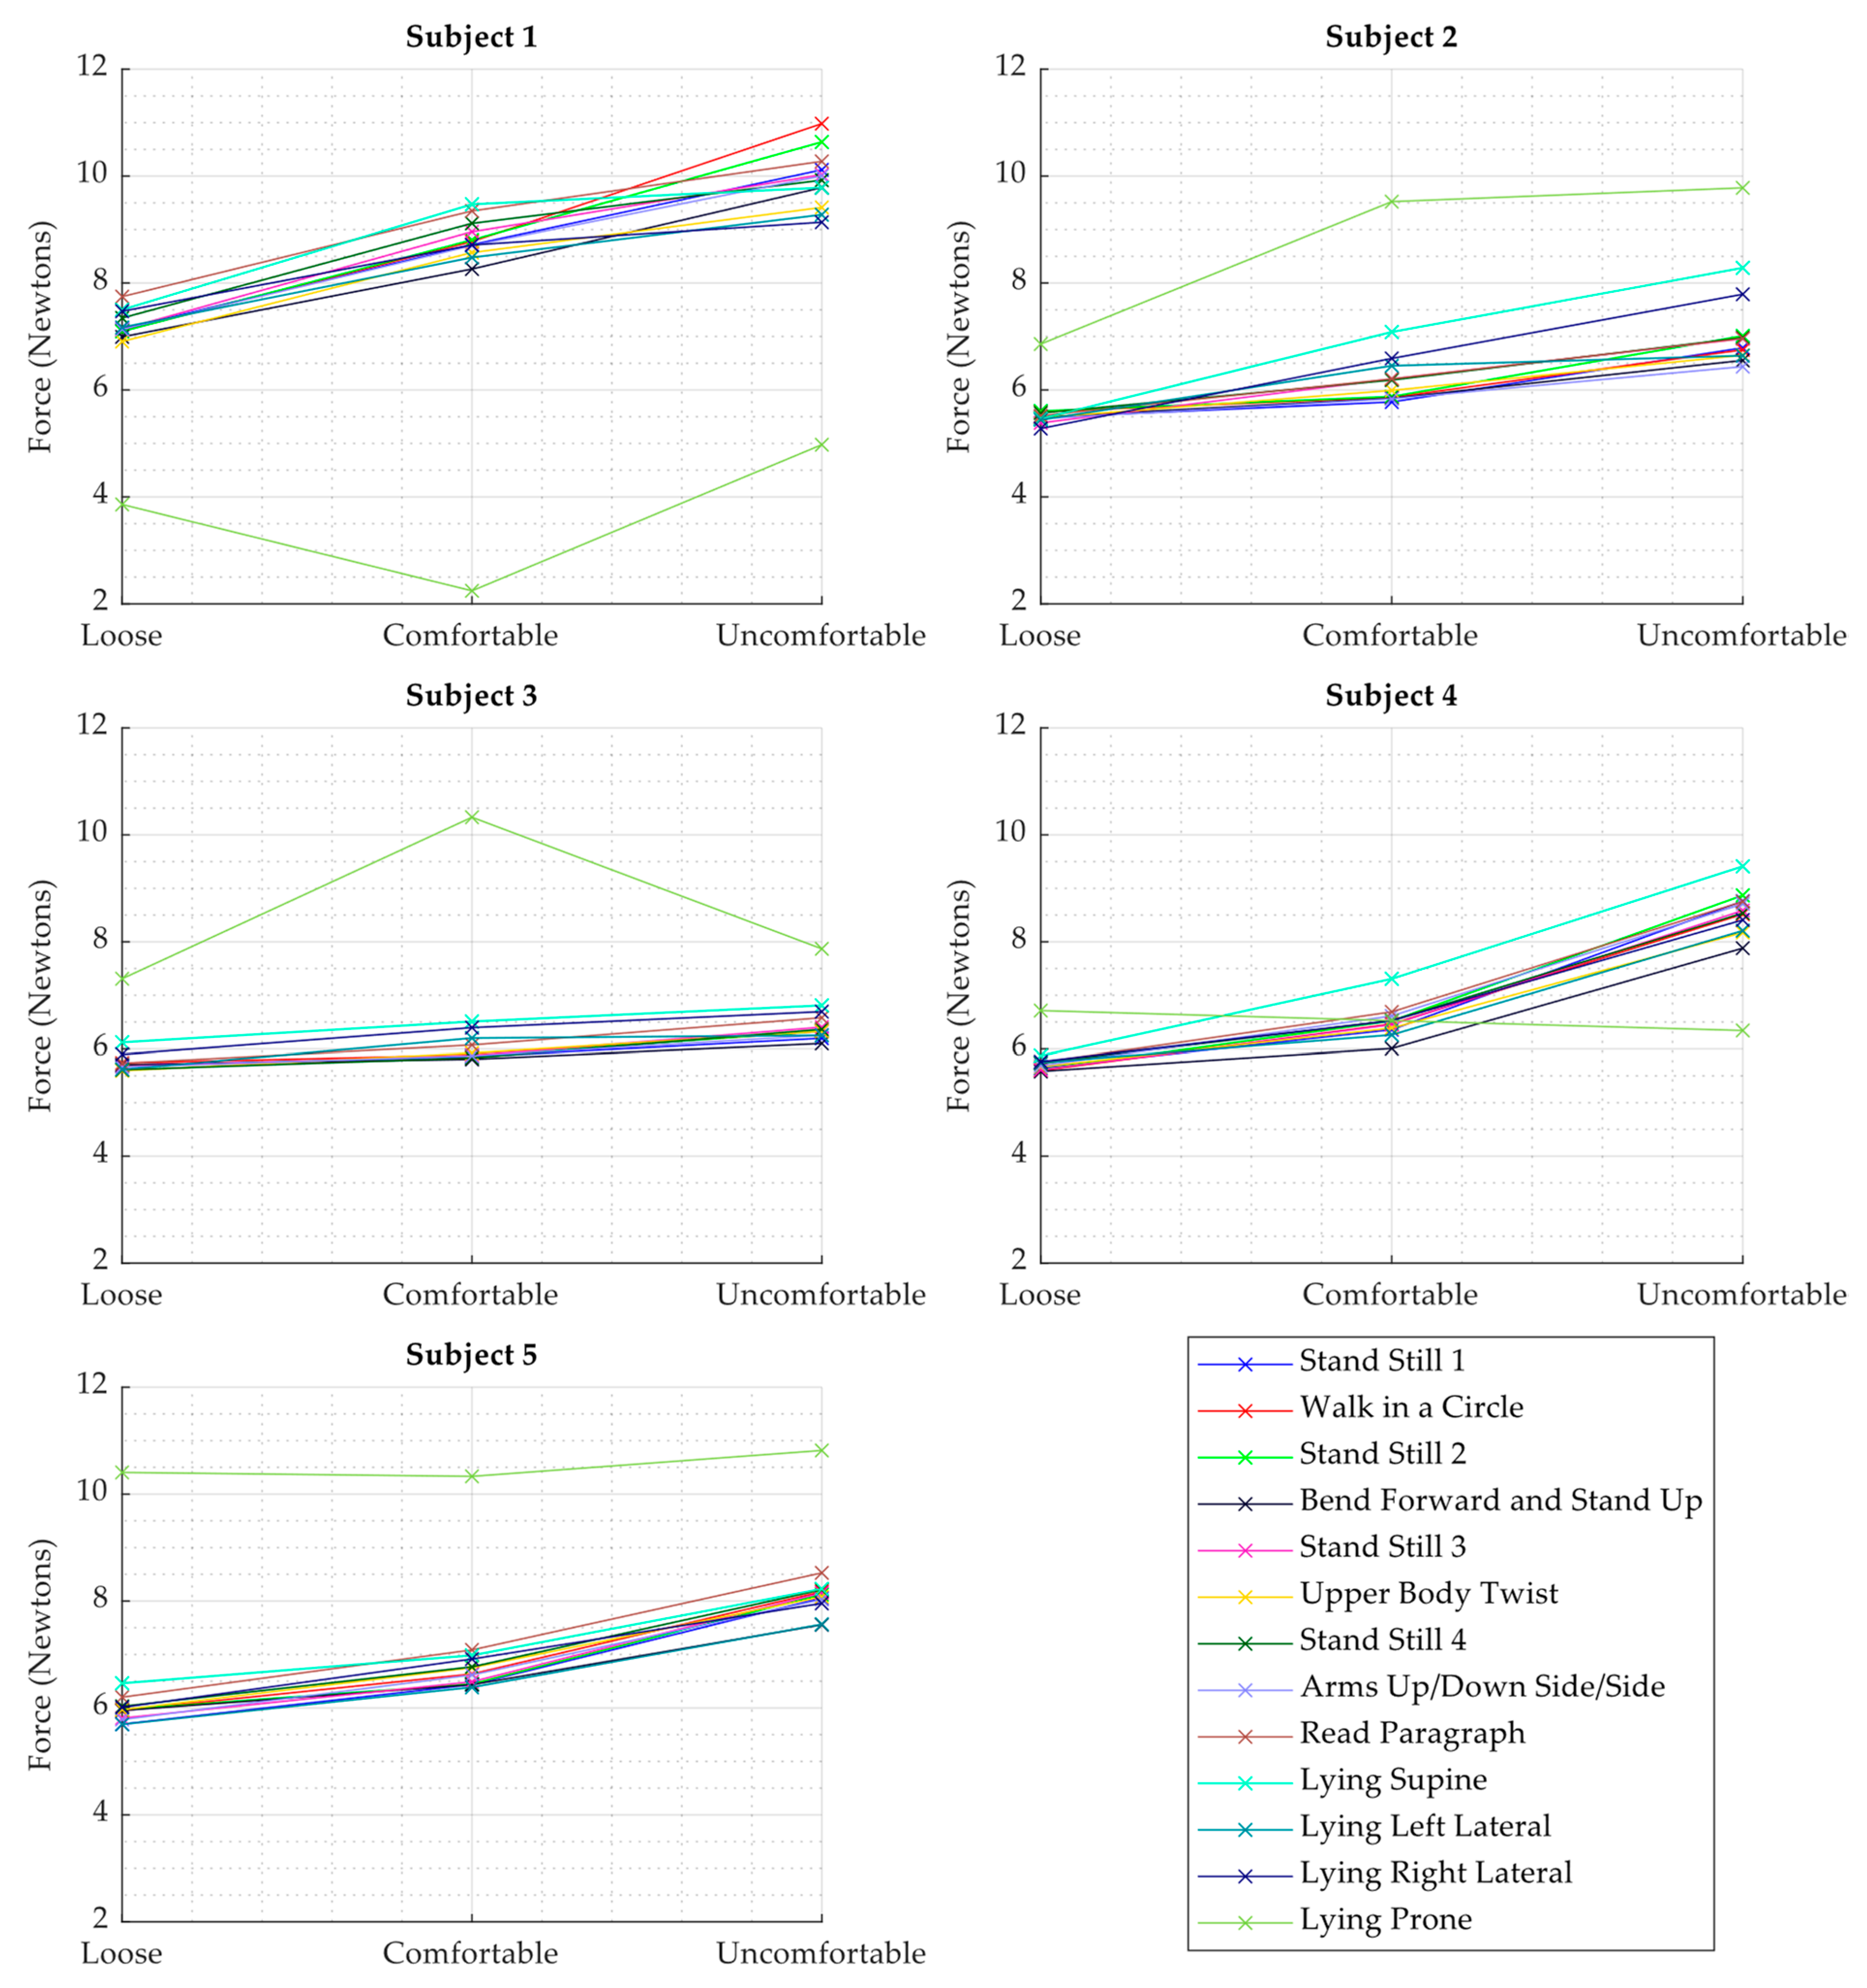
  • Assessment of the range of force values observed through the execution of the protocol on each subject.
  • Exploration of the relationship between PCG quality and force and activity measured by WPAS:
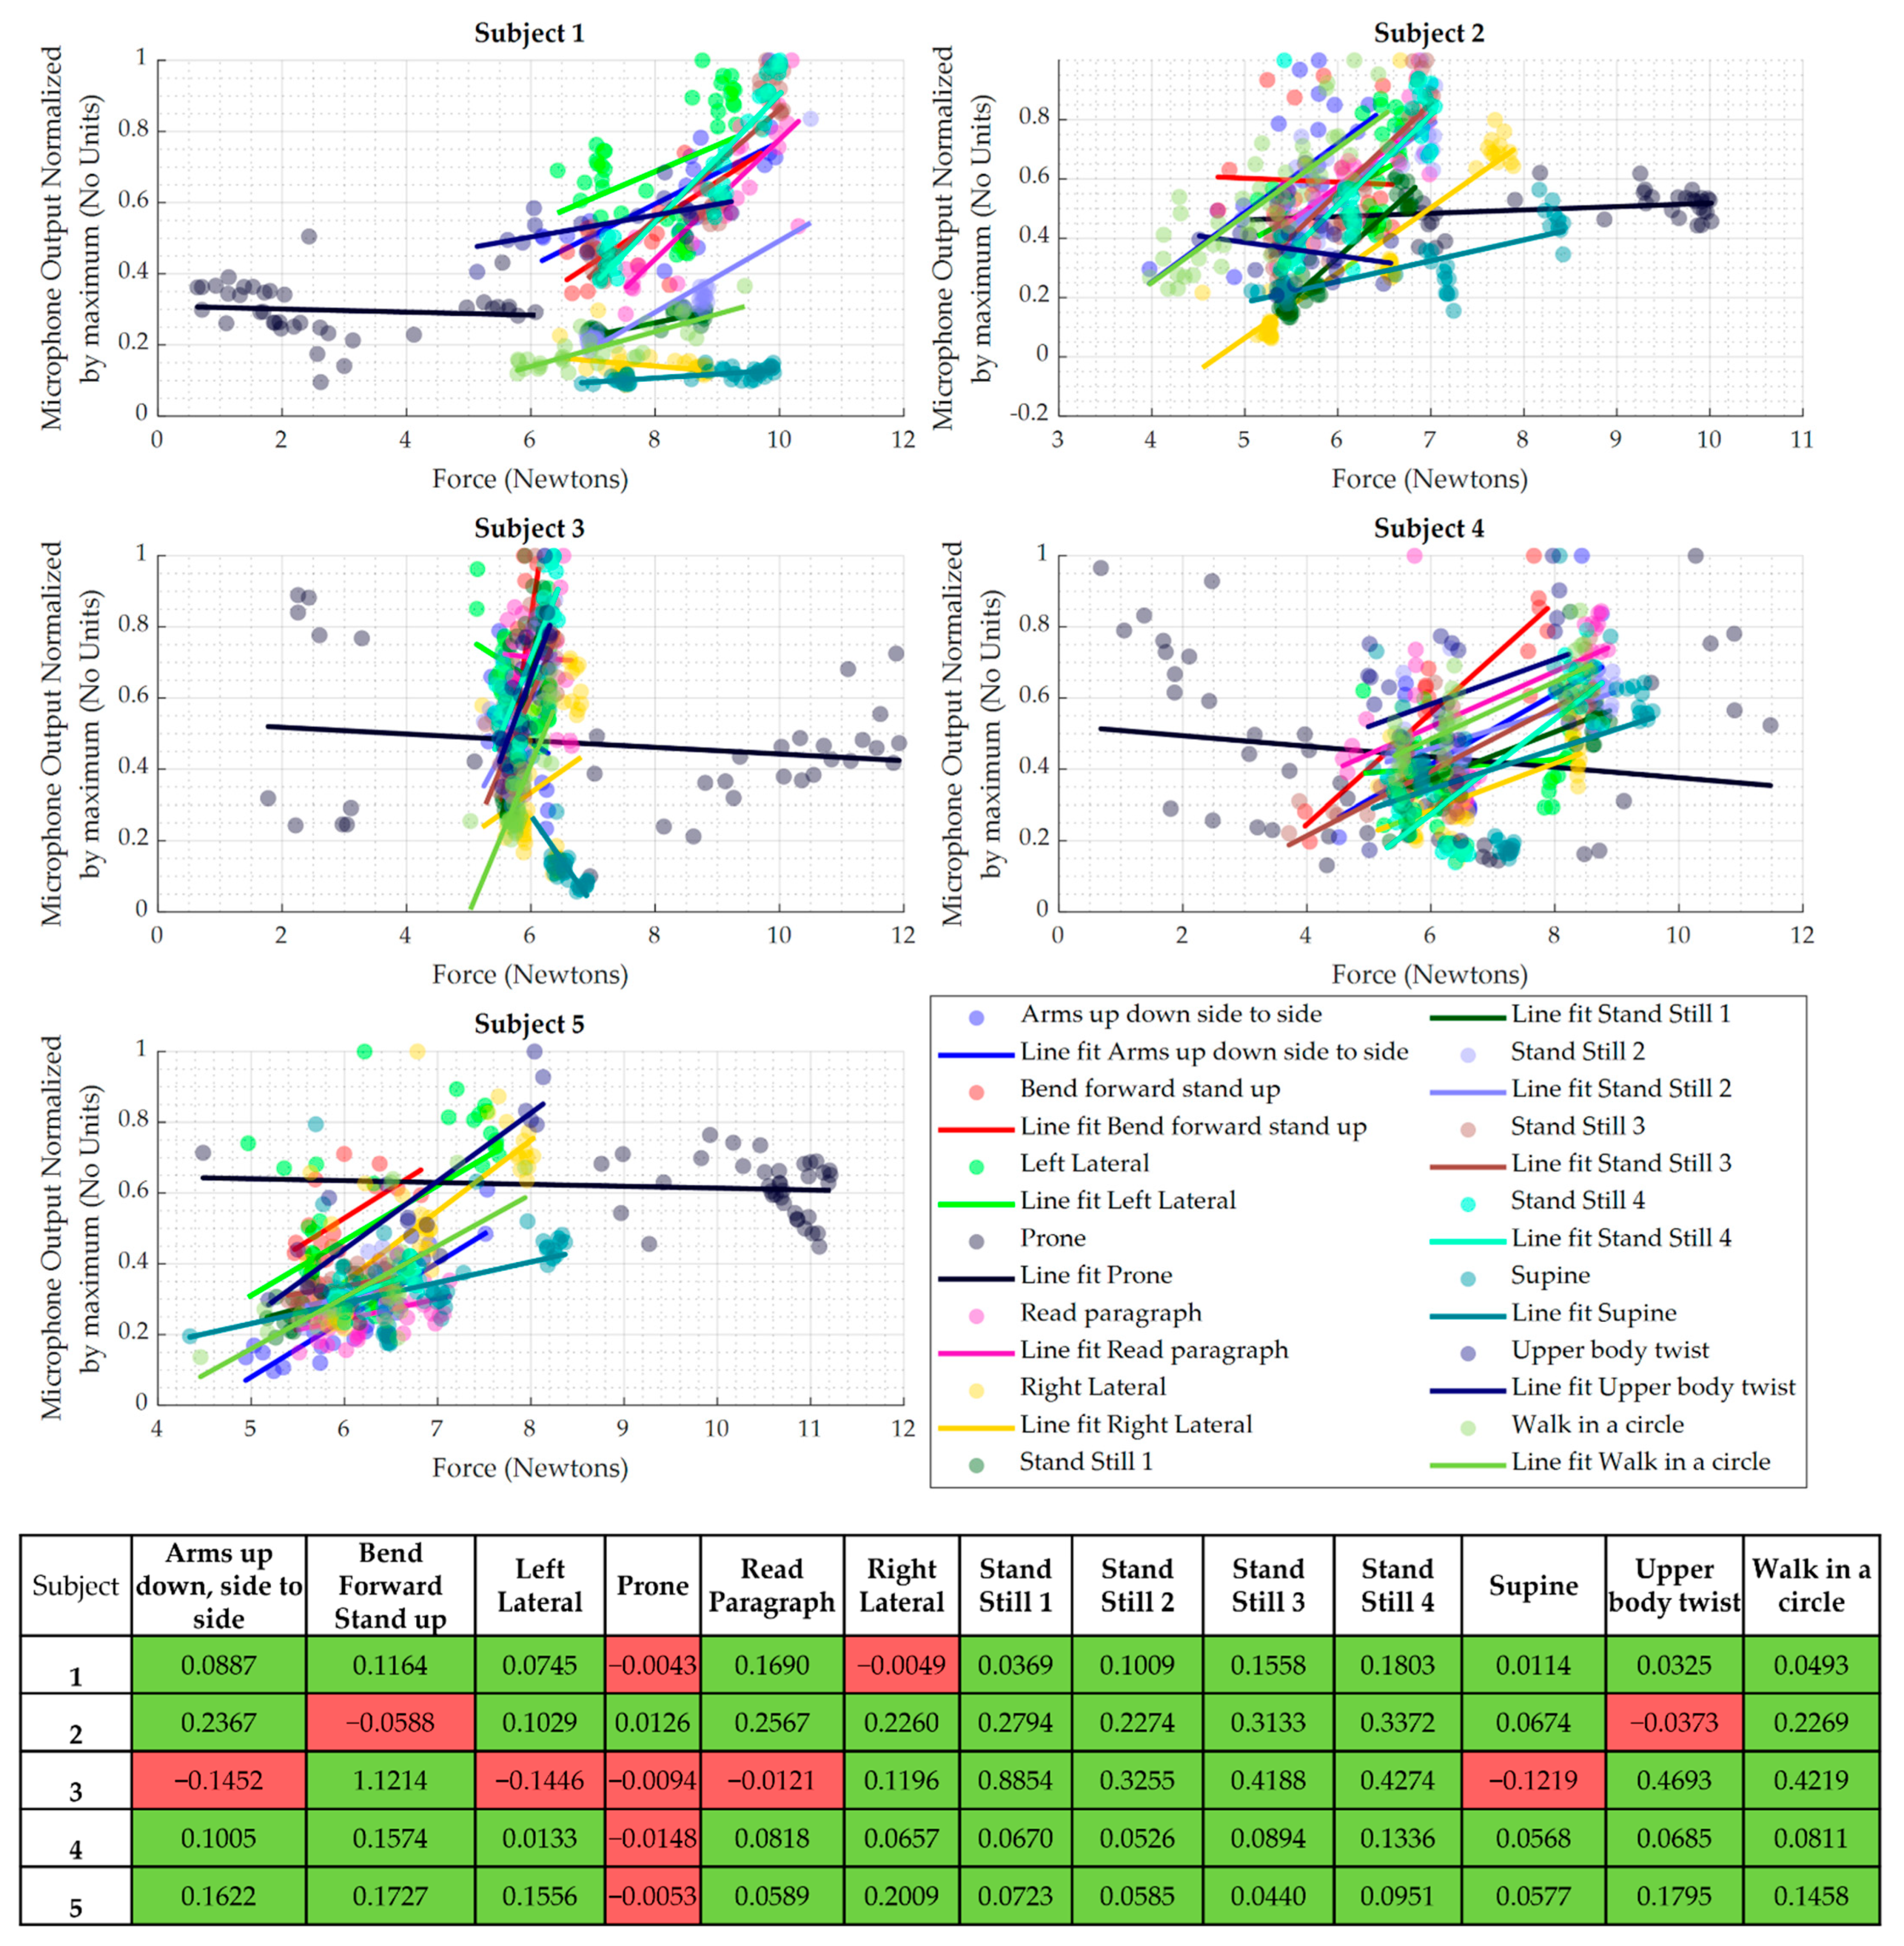
  • Analysis of the relationship between loudness of the measured heart sounds and the force values observed by the WPAS sensing element.
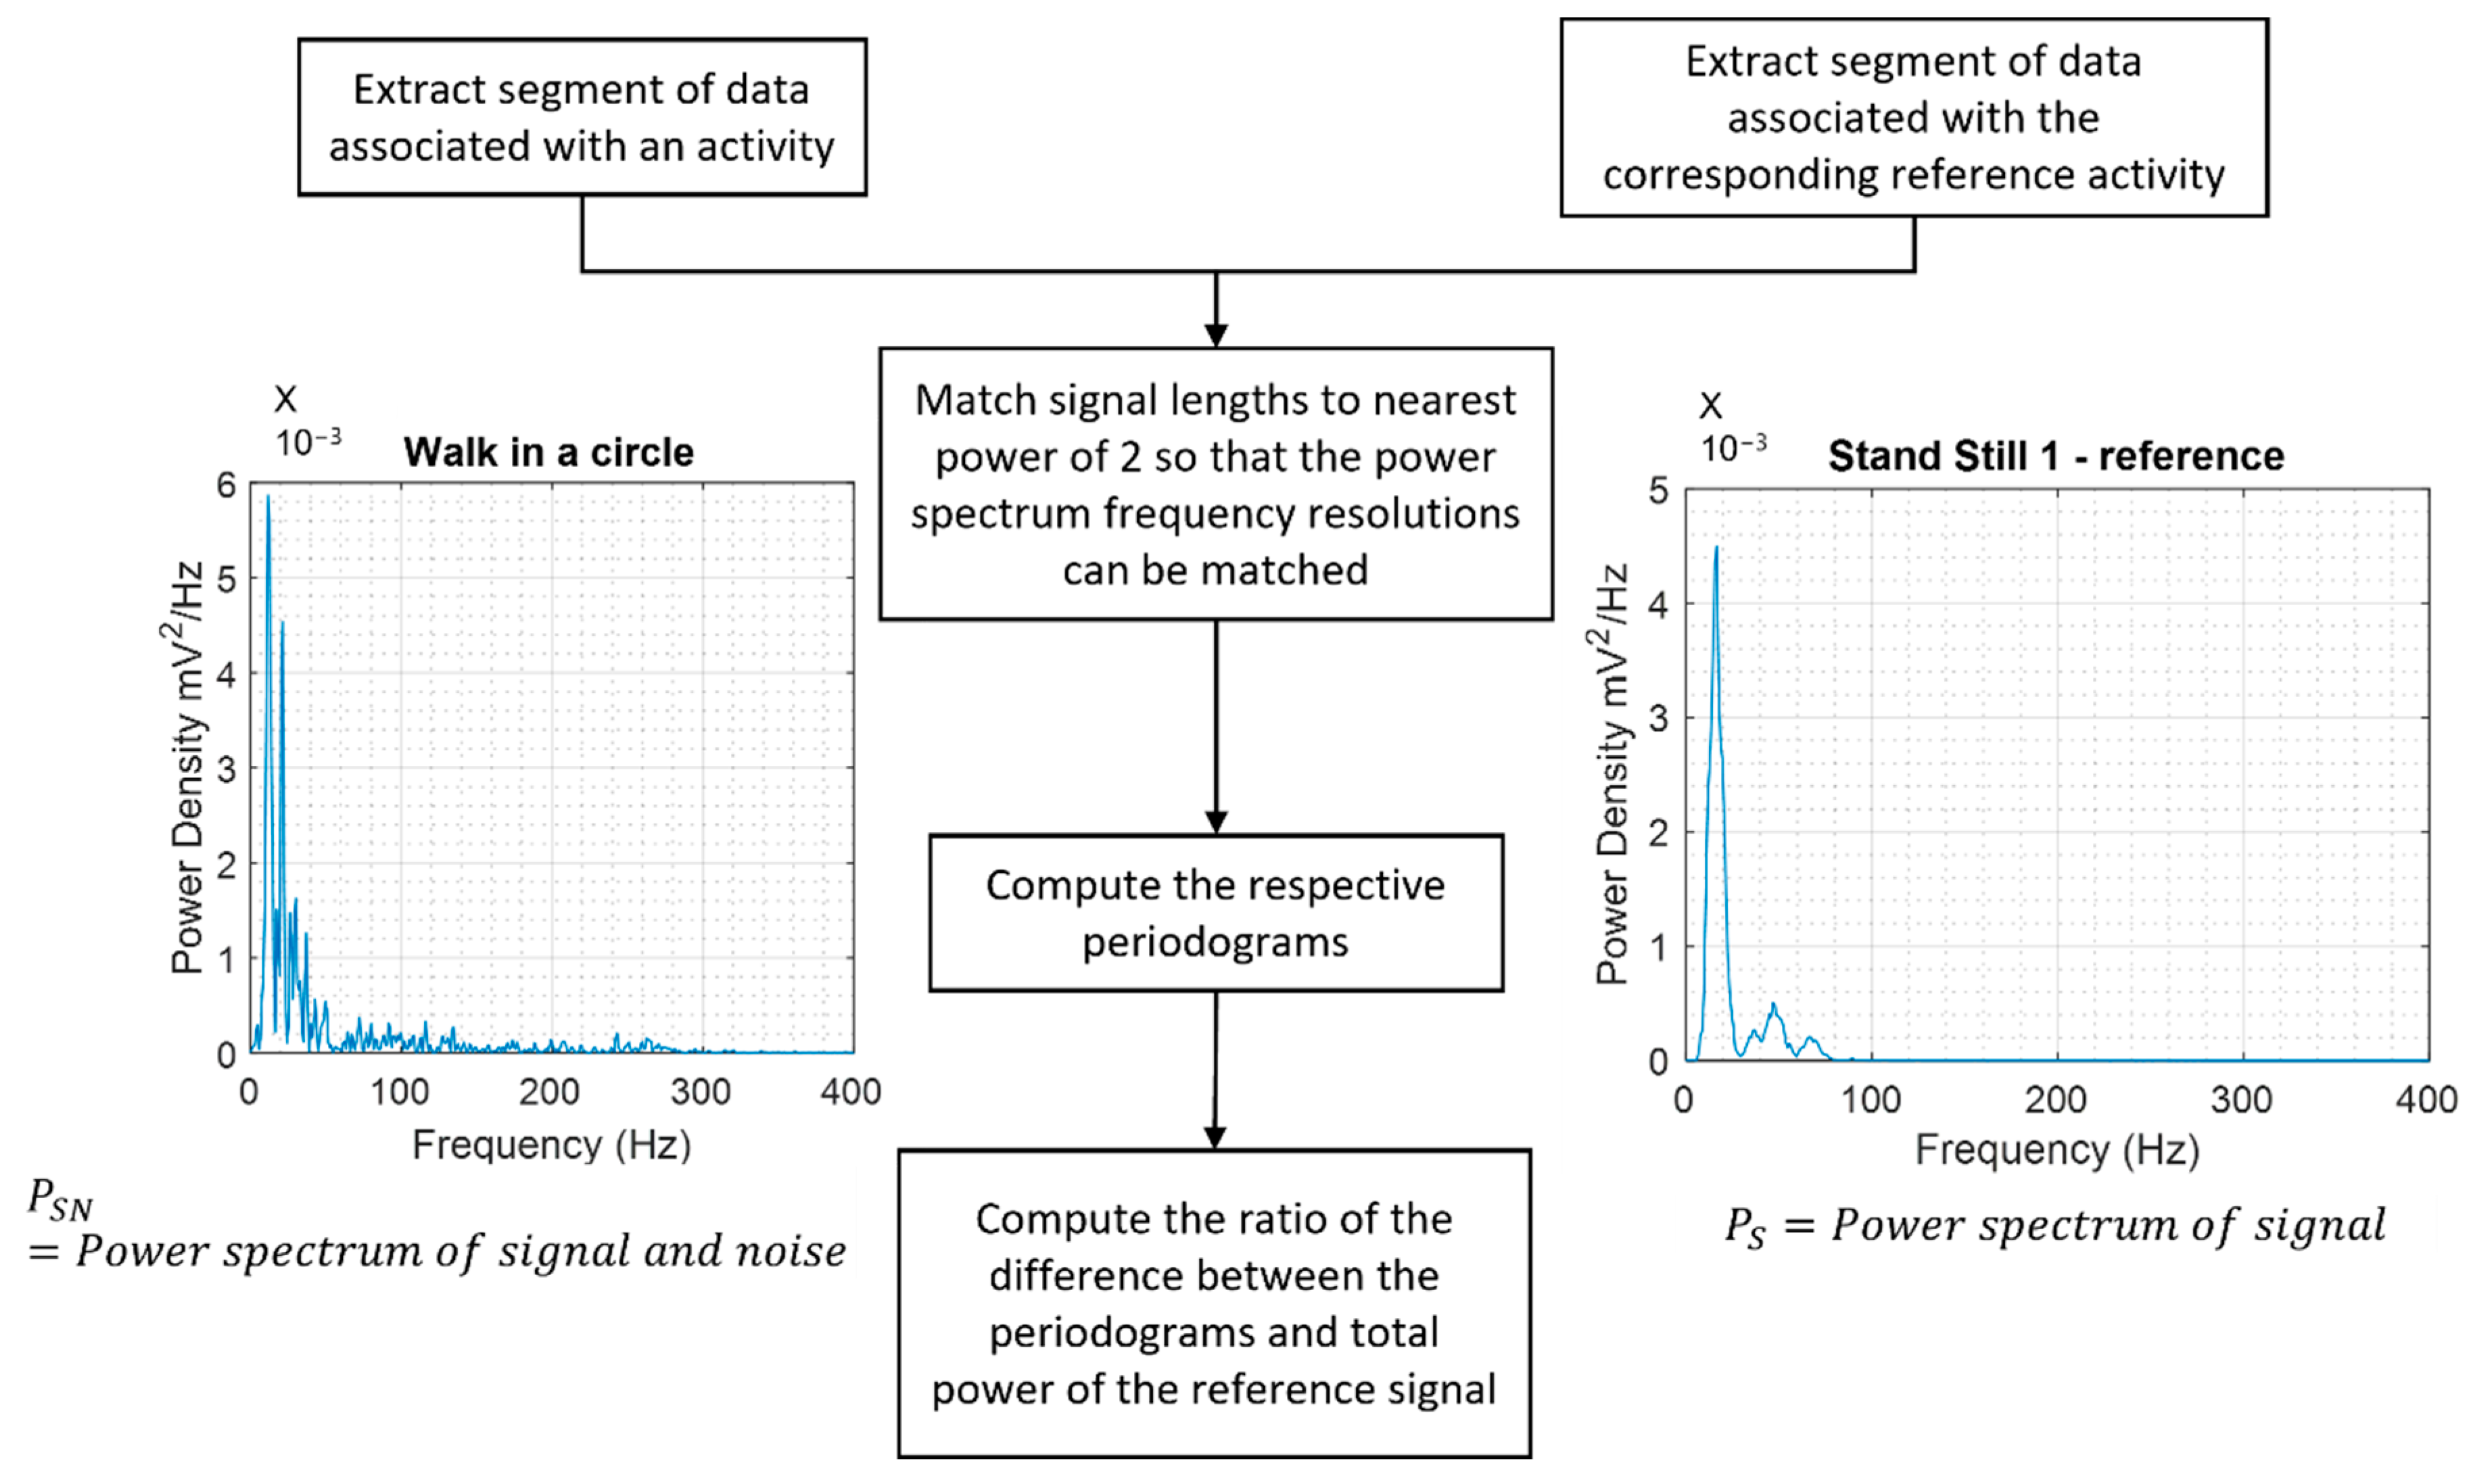
  • Analysis of the noise levels in the measured heart sounds during movement compared to the corresponding reference measurements when standing still.
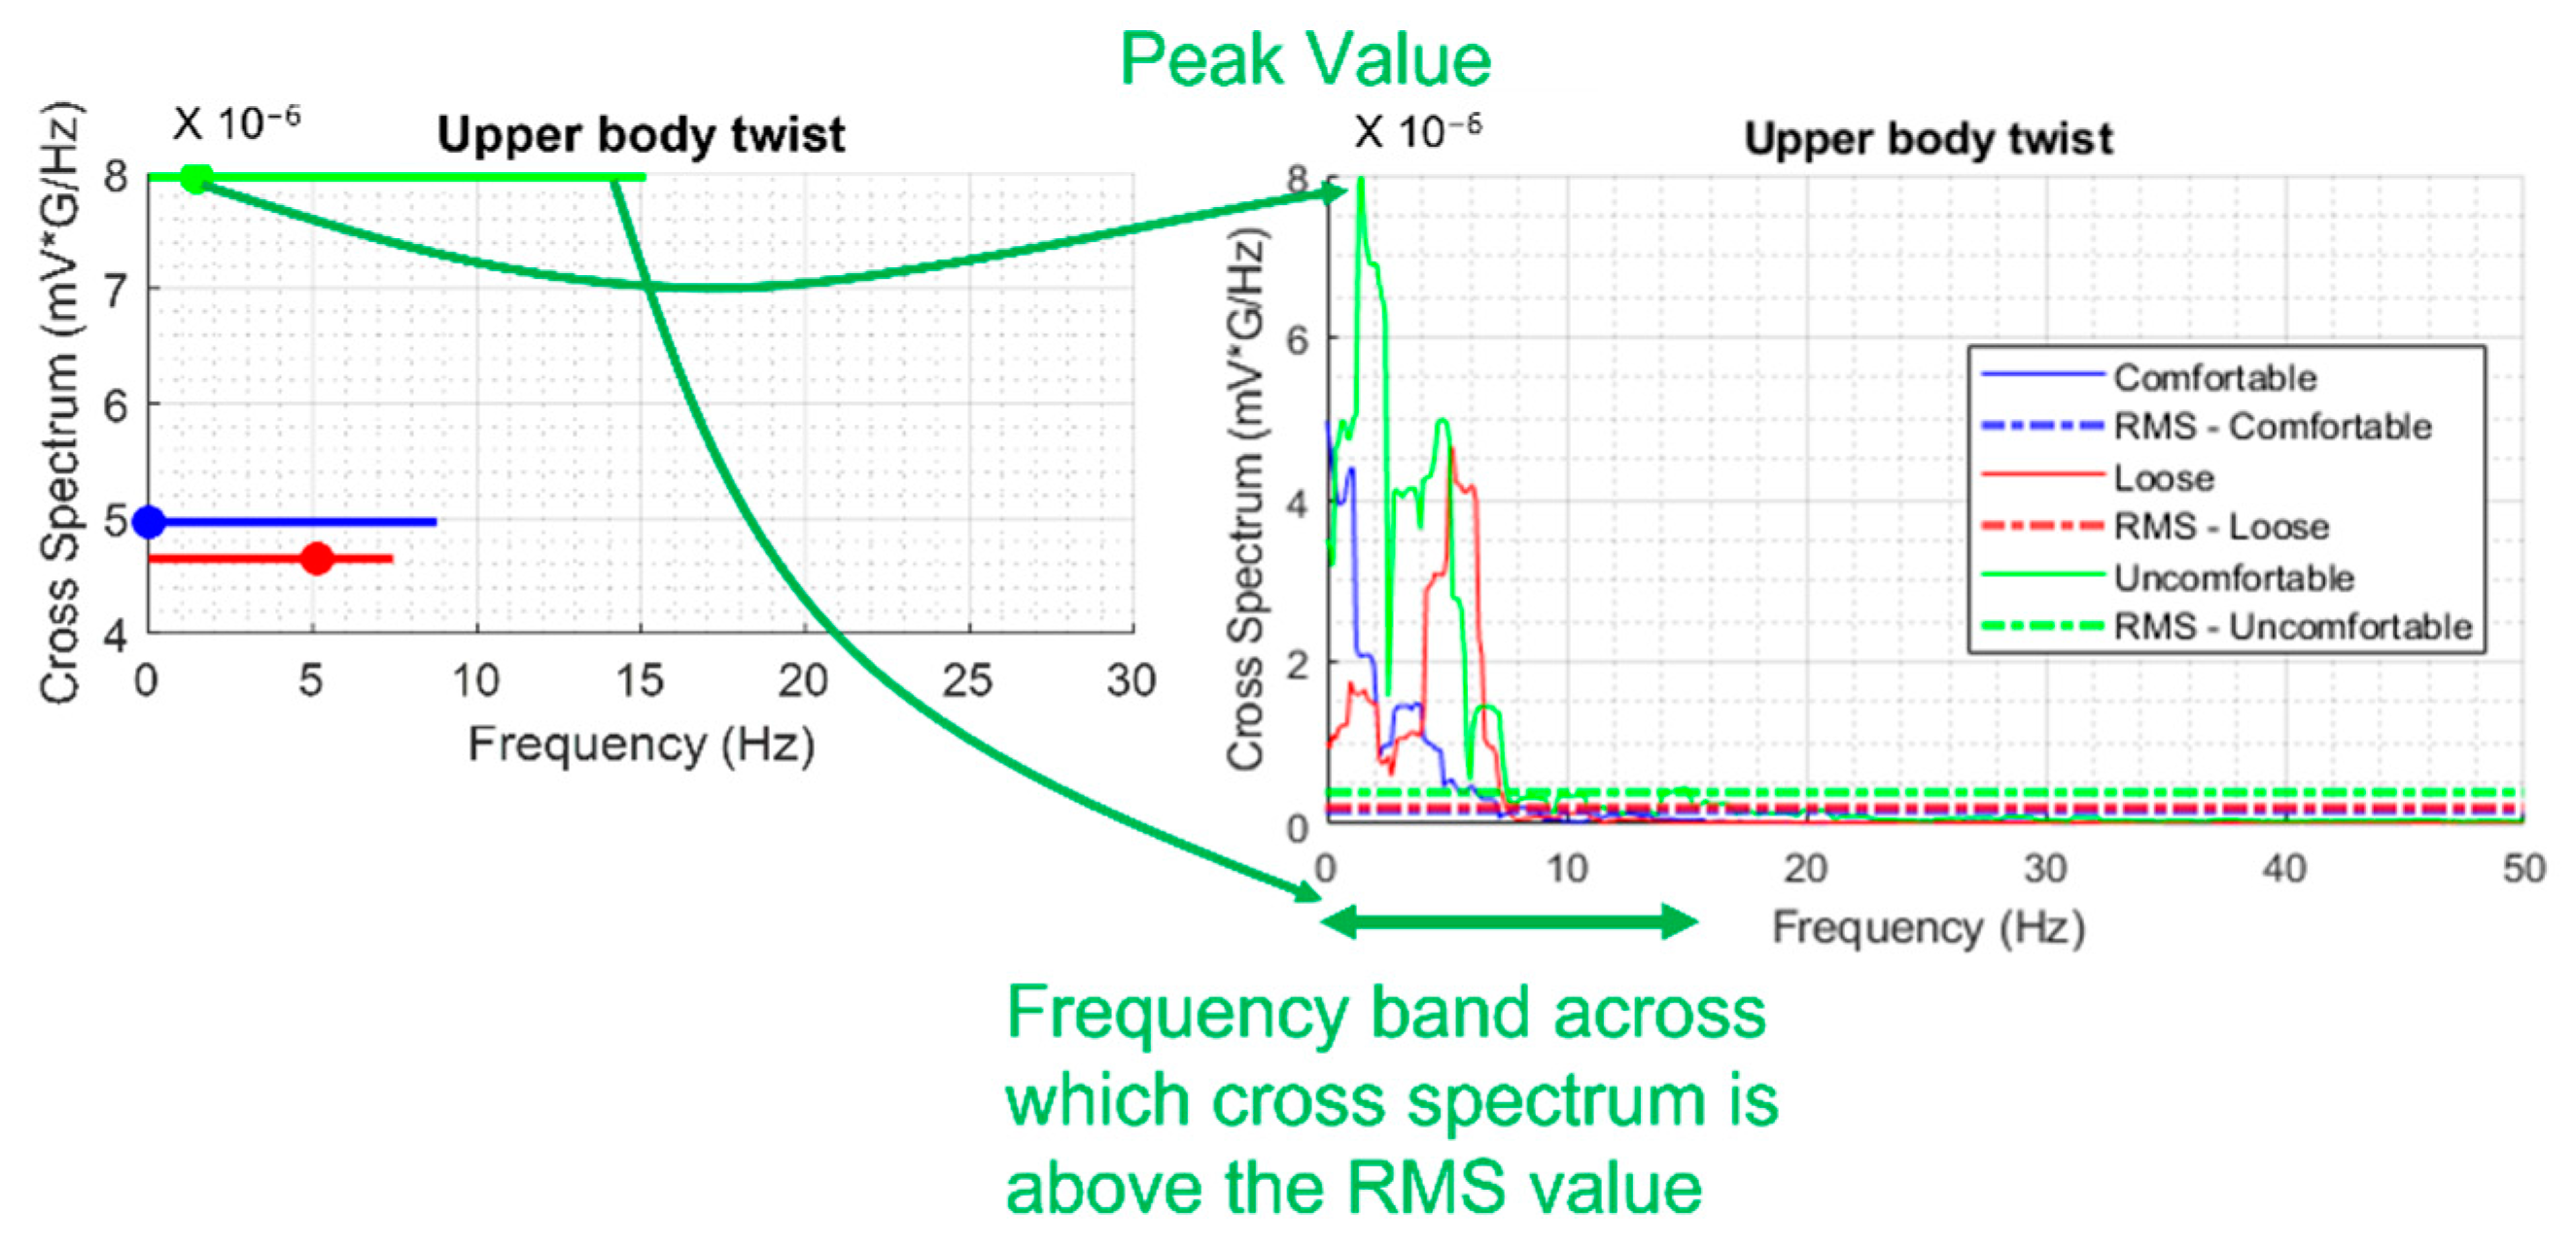
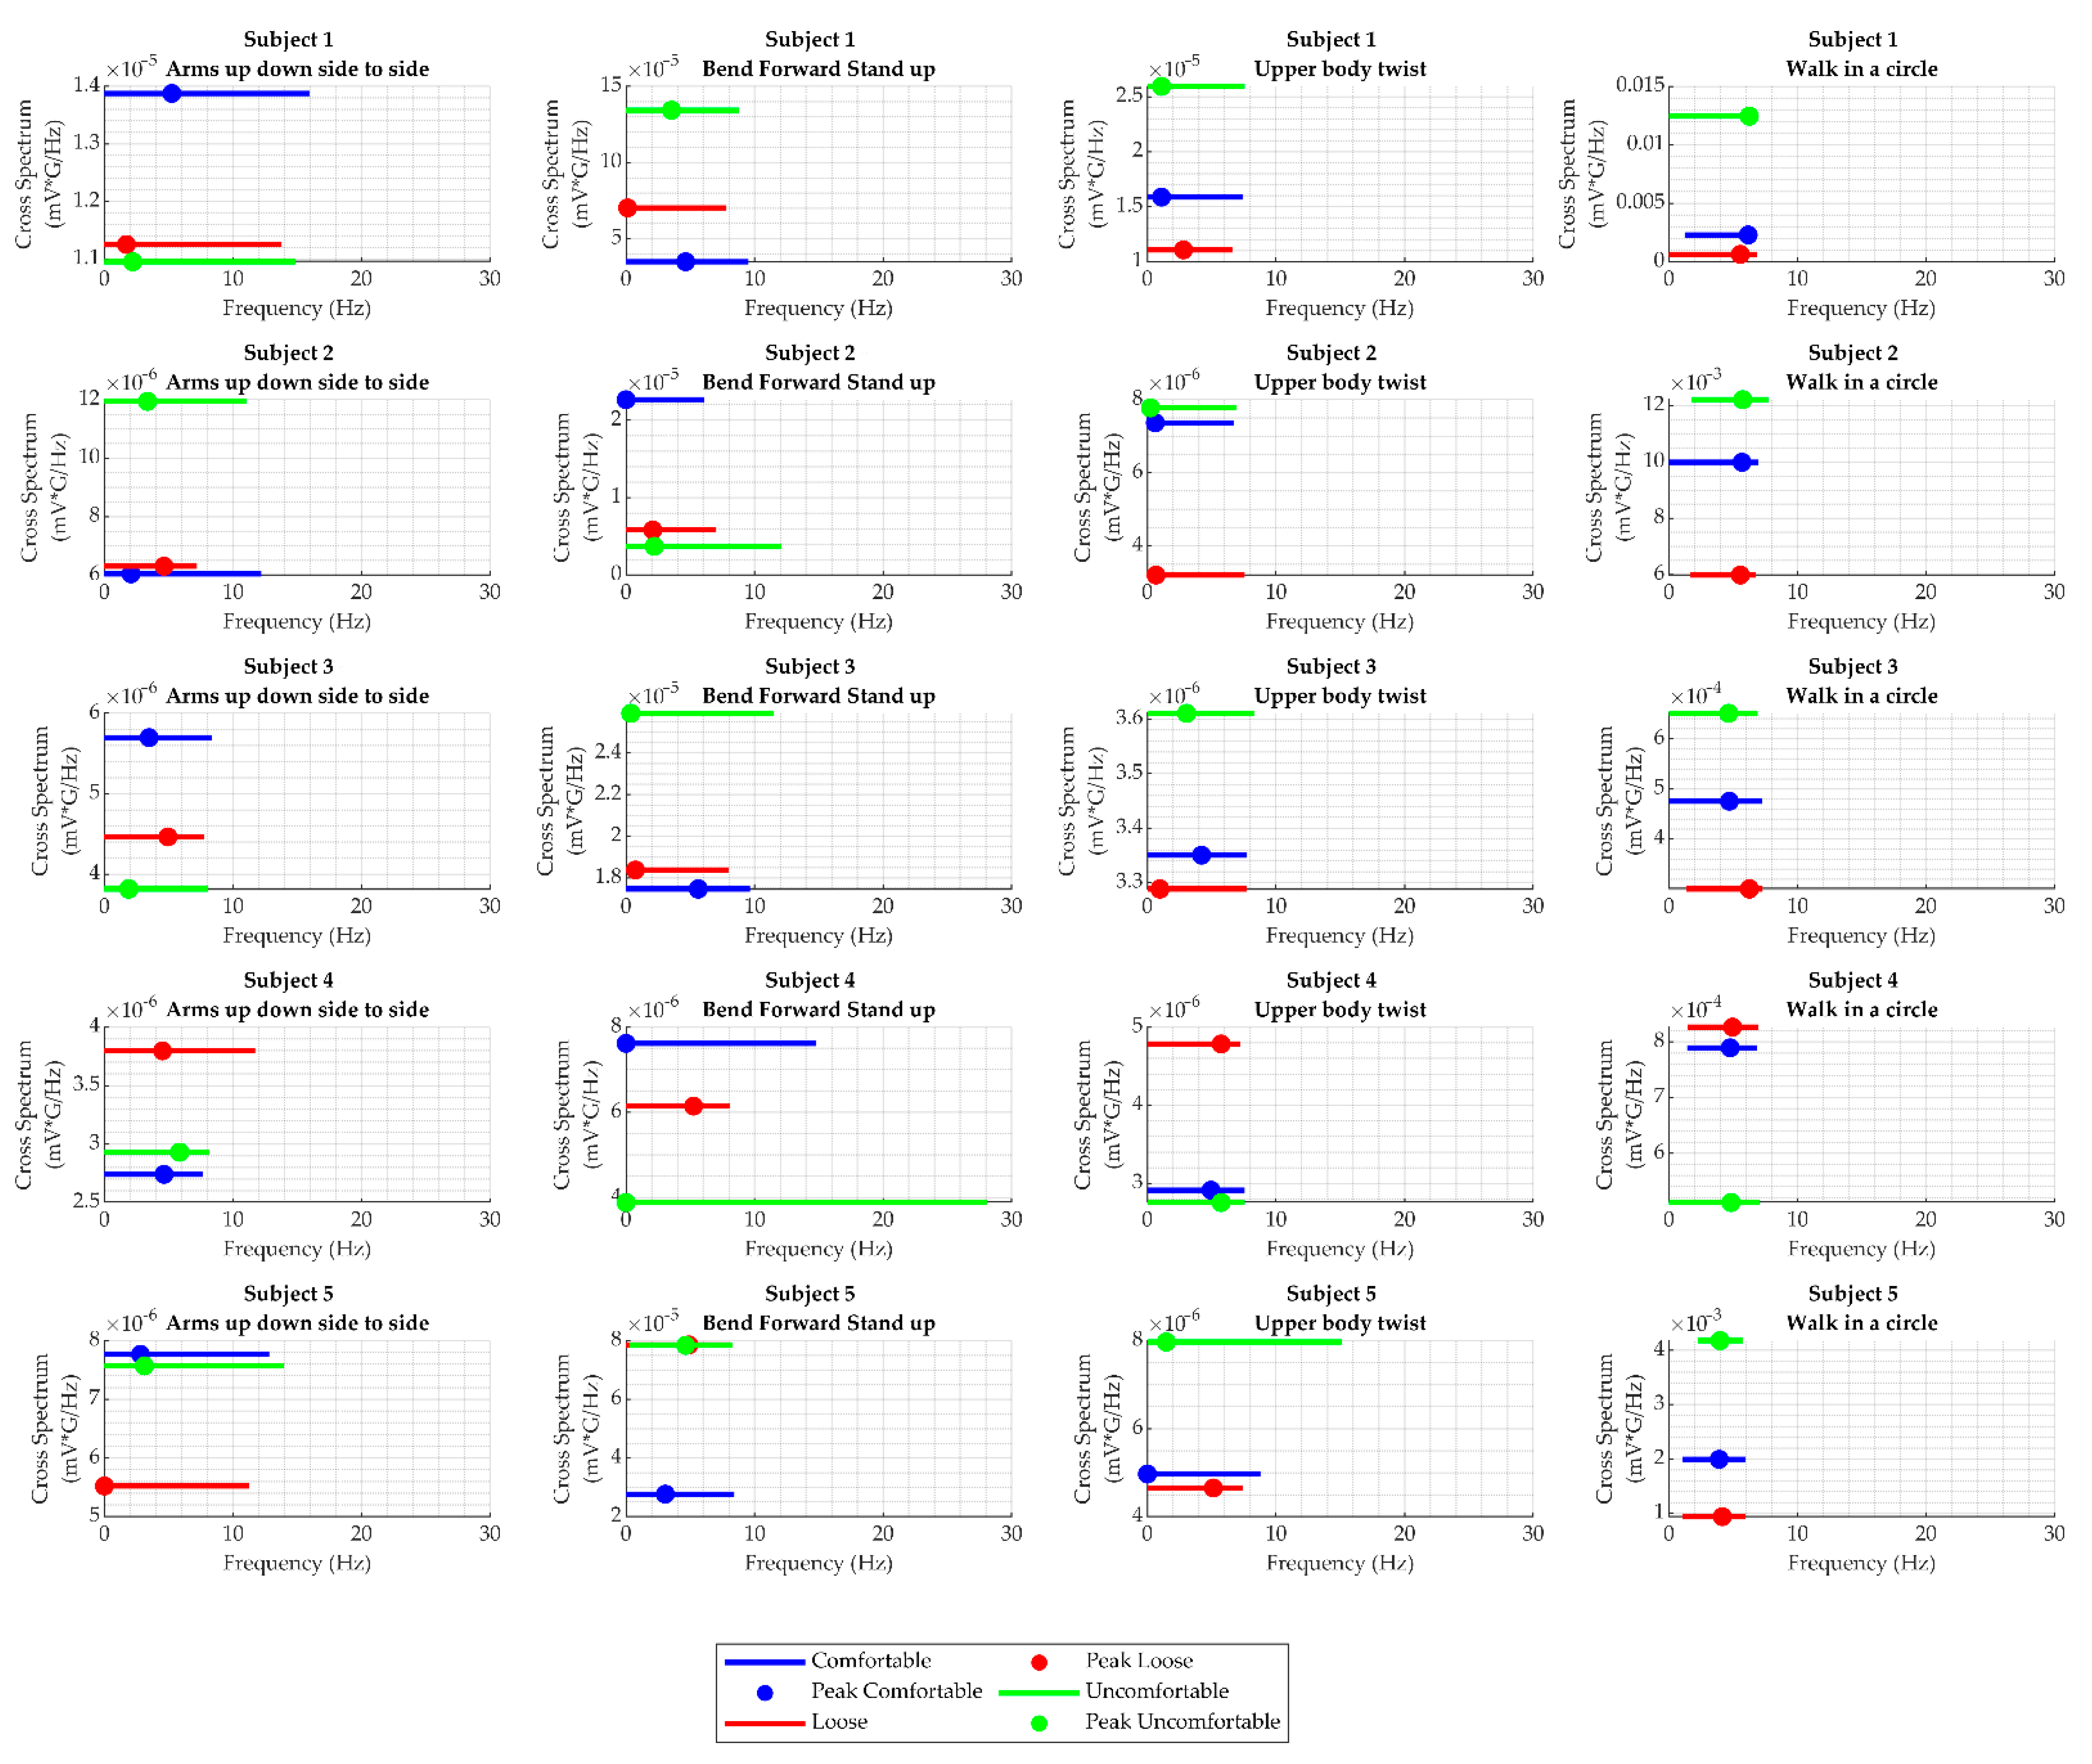
  • Analysis of cross-spectral coherence between activity and heart sound for activities involving movements.
  • Evaluation of the WPAS system for recording PCGs:
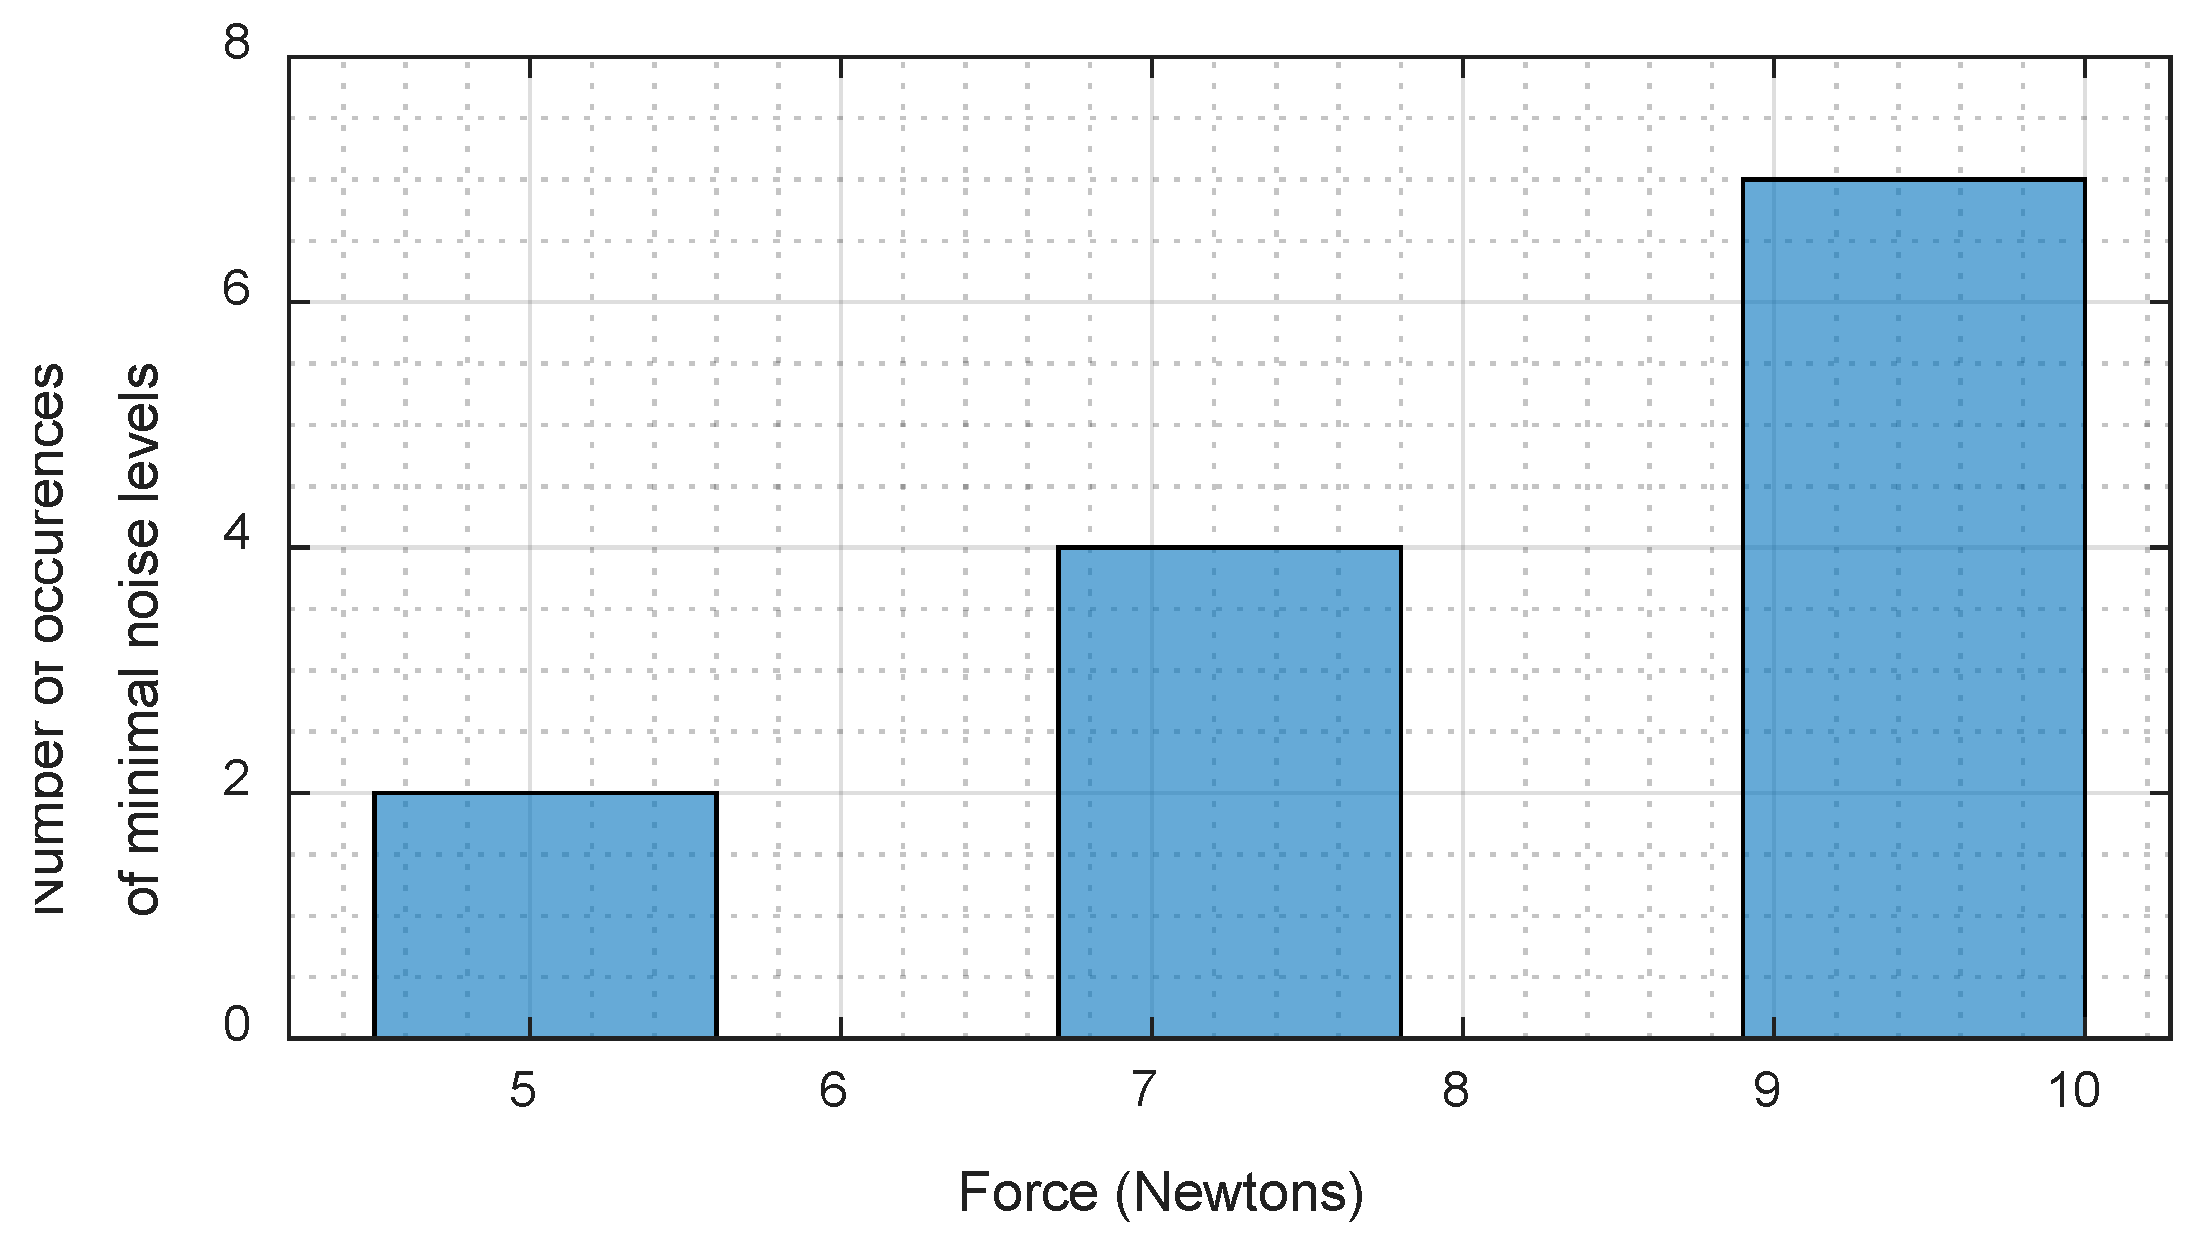
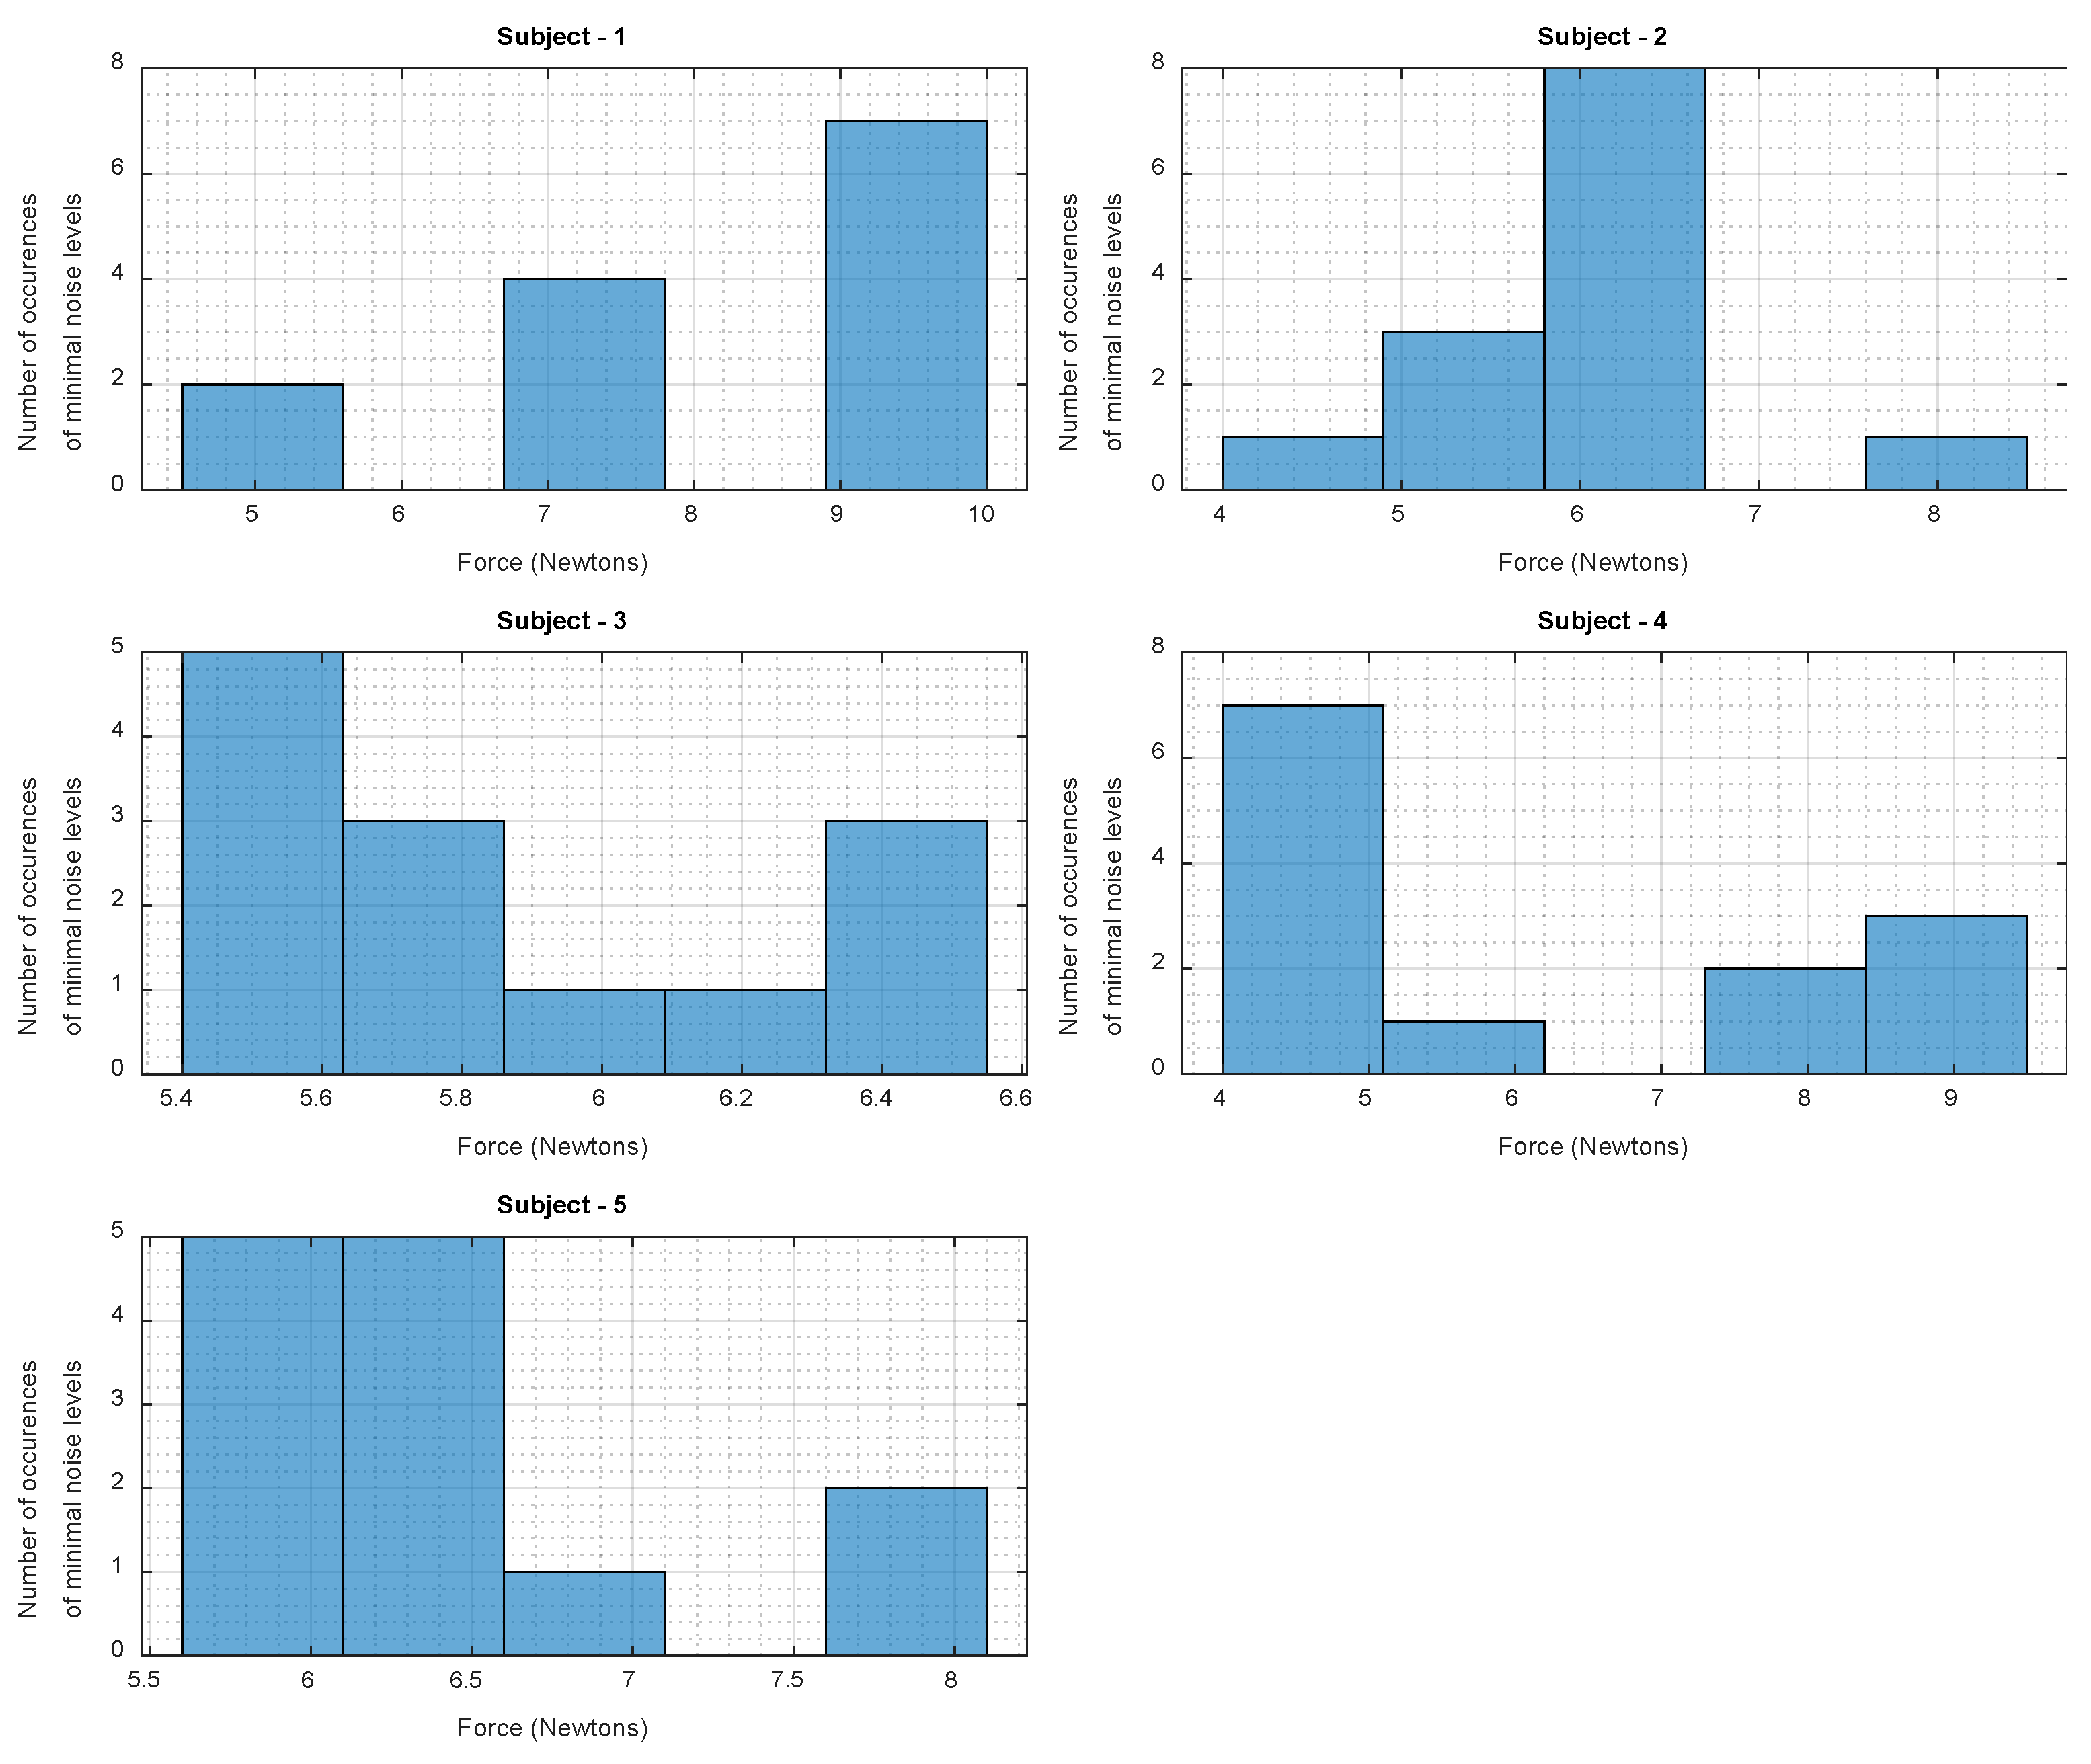
  • Search for an individualized optimal force reading to minimize noise levels for each subject.

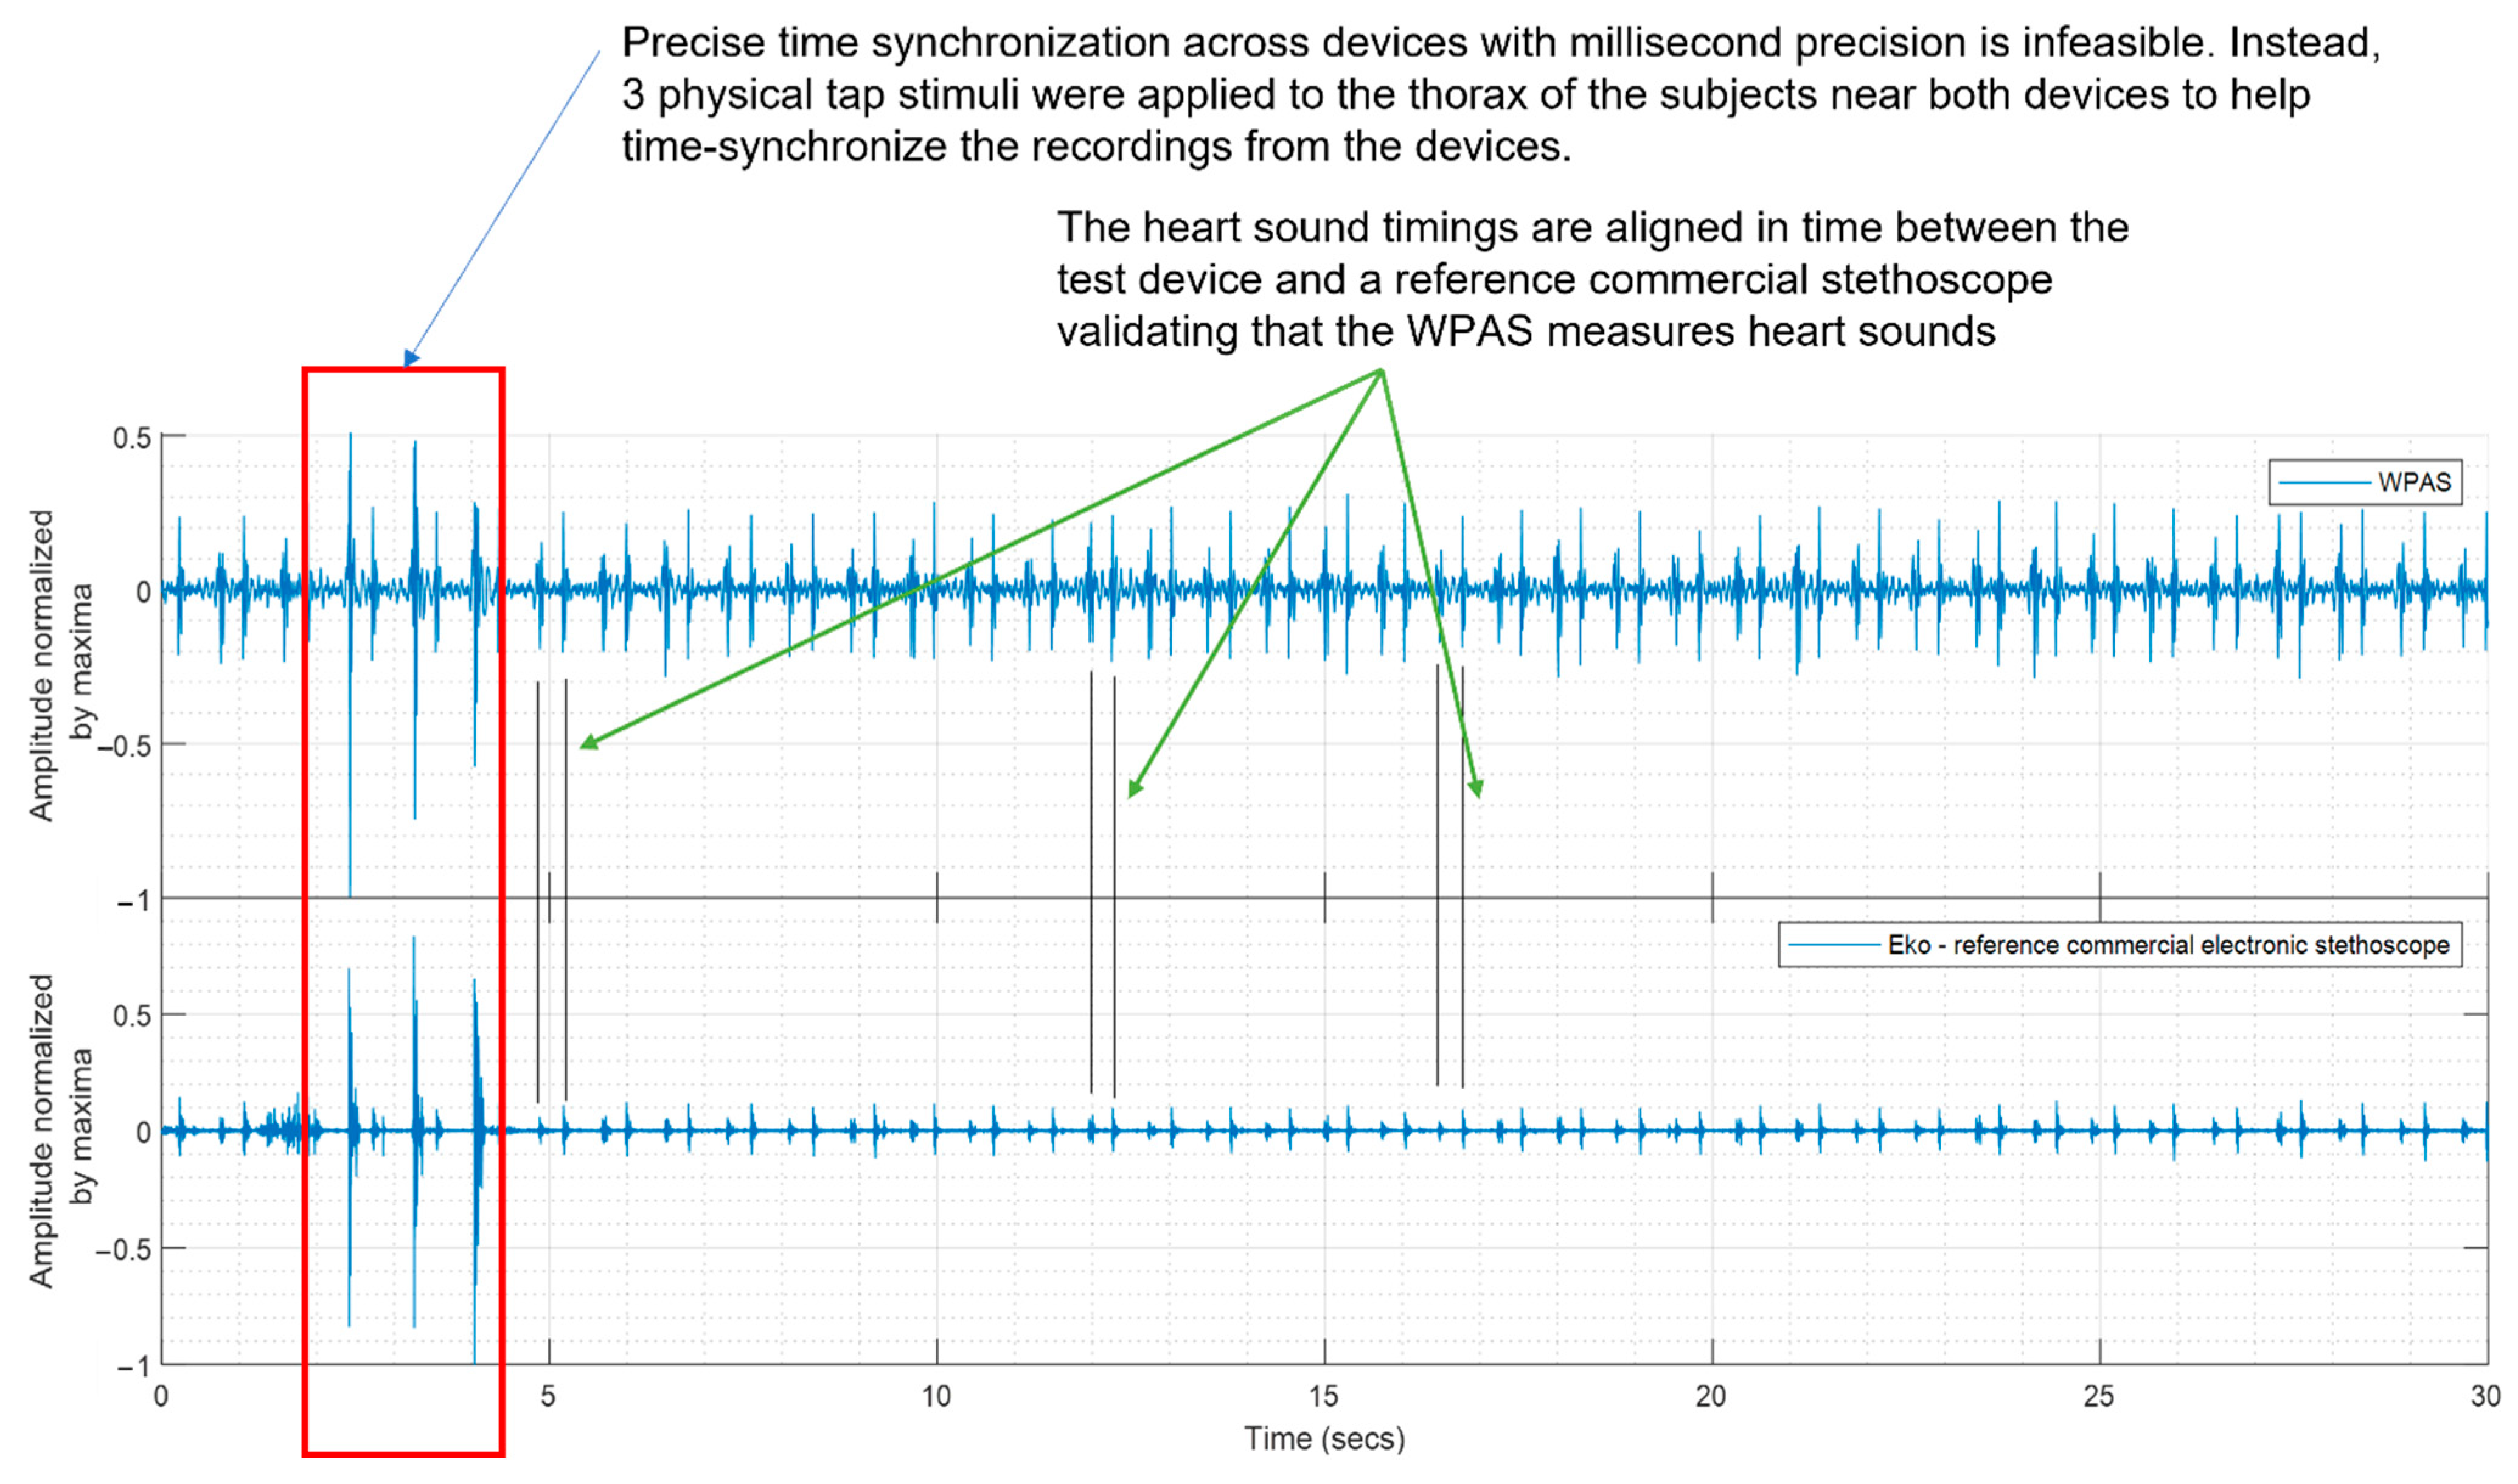
2.3.1. Comparison of WPAS with a Reference Commercial Electronic Stethoscope

The purpose of this analysis was to validate the ability of the WPAS to capture heart sounds, namely, S1 and S2 sounds, with comparable accuracy to a commercial digital stethoscope. The commercial digital stethoscope chosen for this validation was an Eko Core (Eko devices Inc. Berkeley, CA, USA). The synchronization of sound measurements across two devices that do not share a clock source is technically infeasible. The methodology applied involved two stages. First, a delay approximation method was used to find the time delay between the heart sounds. The delay approximation method relies on finding the lag associated with the maxima in the absolute value of the cross-correlation between the signals [15]. Second, as the delay approximation method yielded an estimate of the delay between the signals from the two devices, the first occurrence of S1 and S2 immediately following the three physical tap stimuli was aligned manually. Heart rate variability is a highly non-stationary process [16,17]. Therefore, a sequence of consecutive heartbeats, even if acquired from the same subject at different times, will not be aligned in time unless they are observed and recorded simultaneously. For validation, the signals aligned following the delay estimation method were charted concurrently in order to verify that each heartbeat and its associated S1 and S2 sounds were synchronized in time across the two devices for at least 10 s.

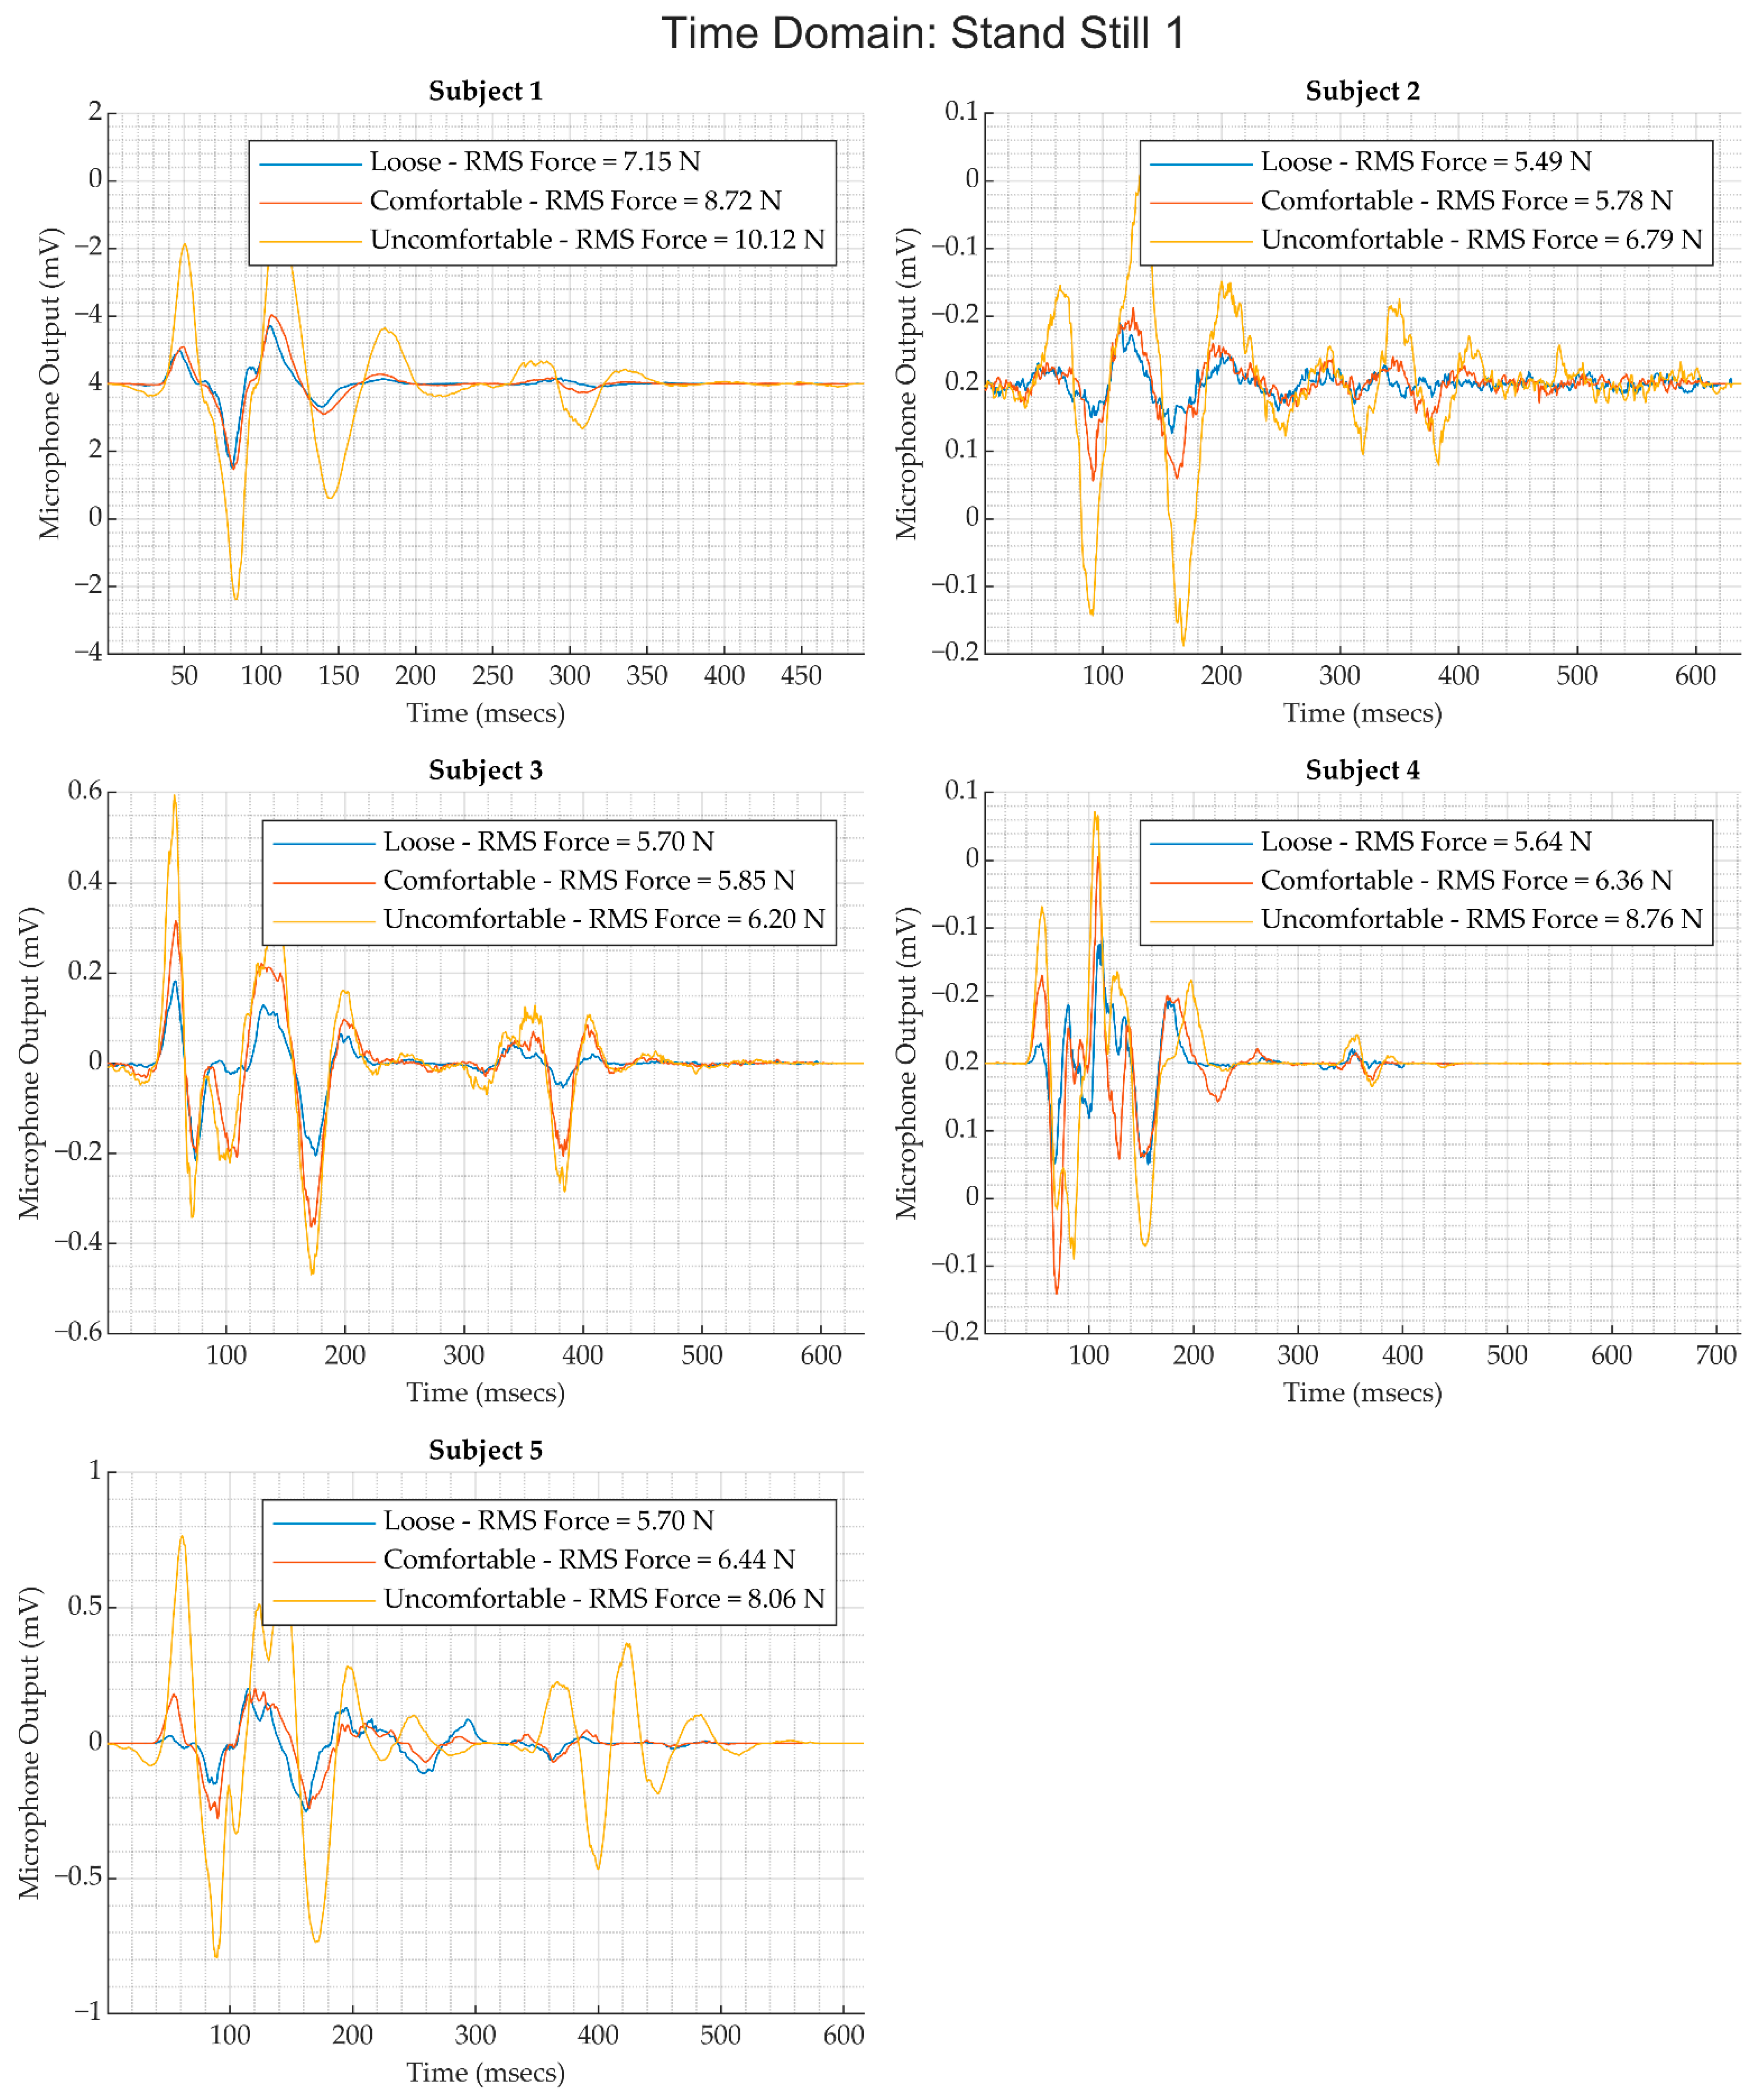
2.3.2. Time-Domain and Frequency Domain Analysis

Three types of analysis were performed in the time and frequency domains to answer questions based on the data acquired during the study.
First, we investigated the force values associated with each subjective or qualitative level of force or tightness applied to each subject.
Subjects enrolled in the study were asked to wear the WPAS device at three levels of tightness based on their perception of “loose”, “comfortable”, and “uncomfortable but bearable”. The force experienced by the WPAS sensing element was continuously captured throughout the time taken to execute the protocol. Therefore, the force levels could be interpreted retrospectively to determine the extent to which the values differed between the three subject-selected levels of tightness.
Respiration introduces a sinusoidal pattern that is consistent with inhalation and exhalation for each breath in the measured force. Therefore, the RMS value of the force for the duration of a given activity was calculated and used as the representative value for an activity for a subject. The relationship between force and tightness levels chosen by the subjects was analyzed by charting the RMS force values against the levels of tightness for each subject across each activity.
Second, we investigated the relationship between the measured force from the WPAS sensing element and the loudness of the heart sounds measured during each of the activities for each subject.
To address this question, the following steps were performed:
  • For each subject, the heart sound segments associated with each activity were extracted and associated with that subject and activity.
  • The heart sound signals were filtered using a second-order Butterworth filter with a passband between 10 and 900 Hz.
  • Wavelet denoising has been proposed for removing noise from heart sounds by several researchers [18,19,20]. In this analysis, heart sounds were decomposed to three levels using the ‘coif5′ wavelet; a soft threshold was applied using an adaptive threshold value (Equation (1)) as described by Jain et al. [19]:
    T = { m e d 75 [ 1 ( v m e d 75 ) ]   i f ( m e d 75 < v ) m e d 75   i f   ( ( m e d 75 > v ) & & ( m e d 75 < m ) ) m e d 75 + ( m e d 75 m )   i f   ( m e d 75 > m )
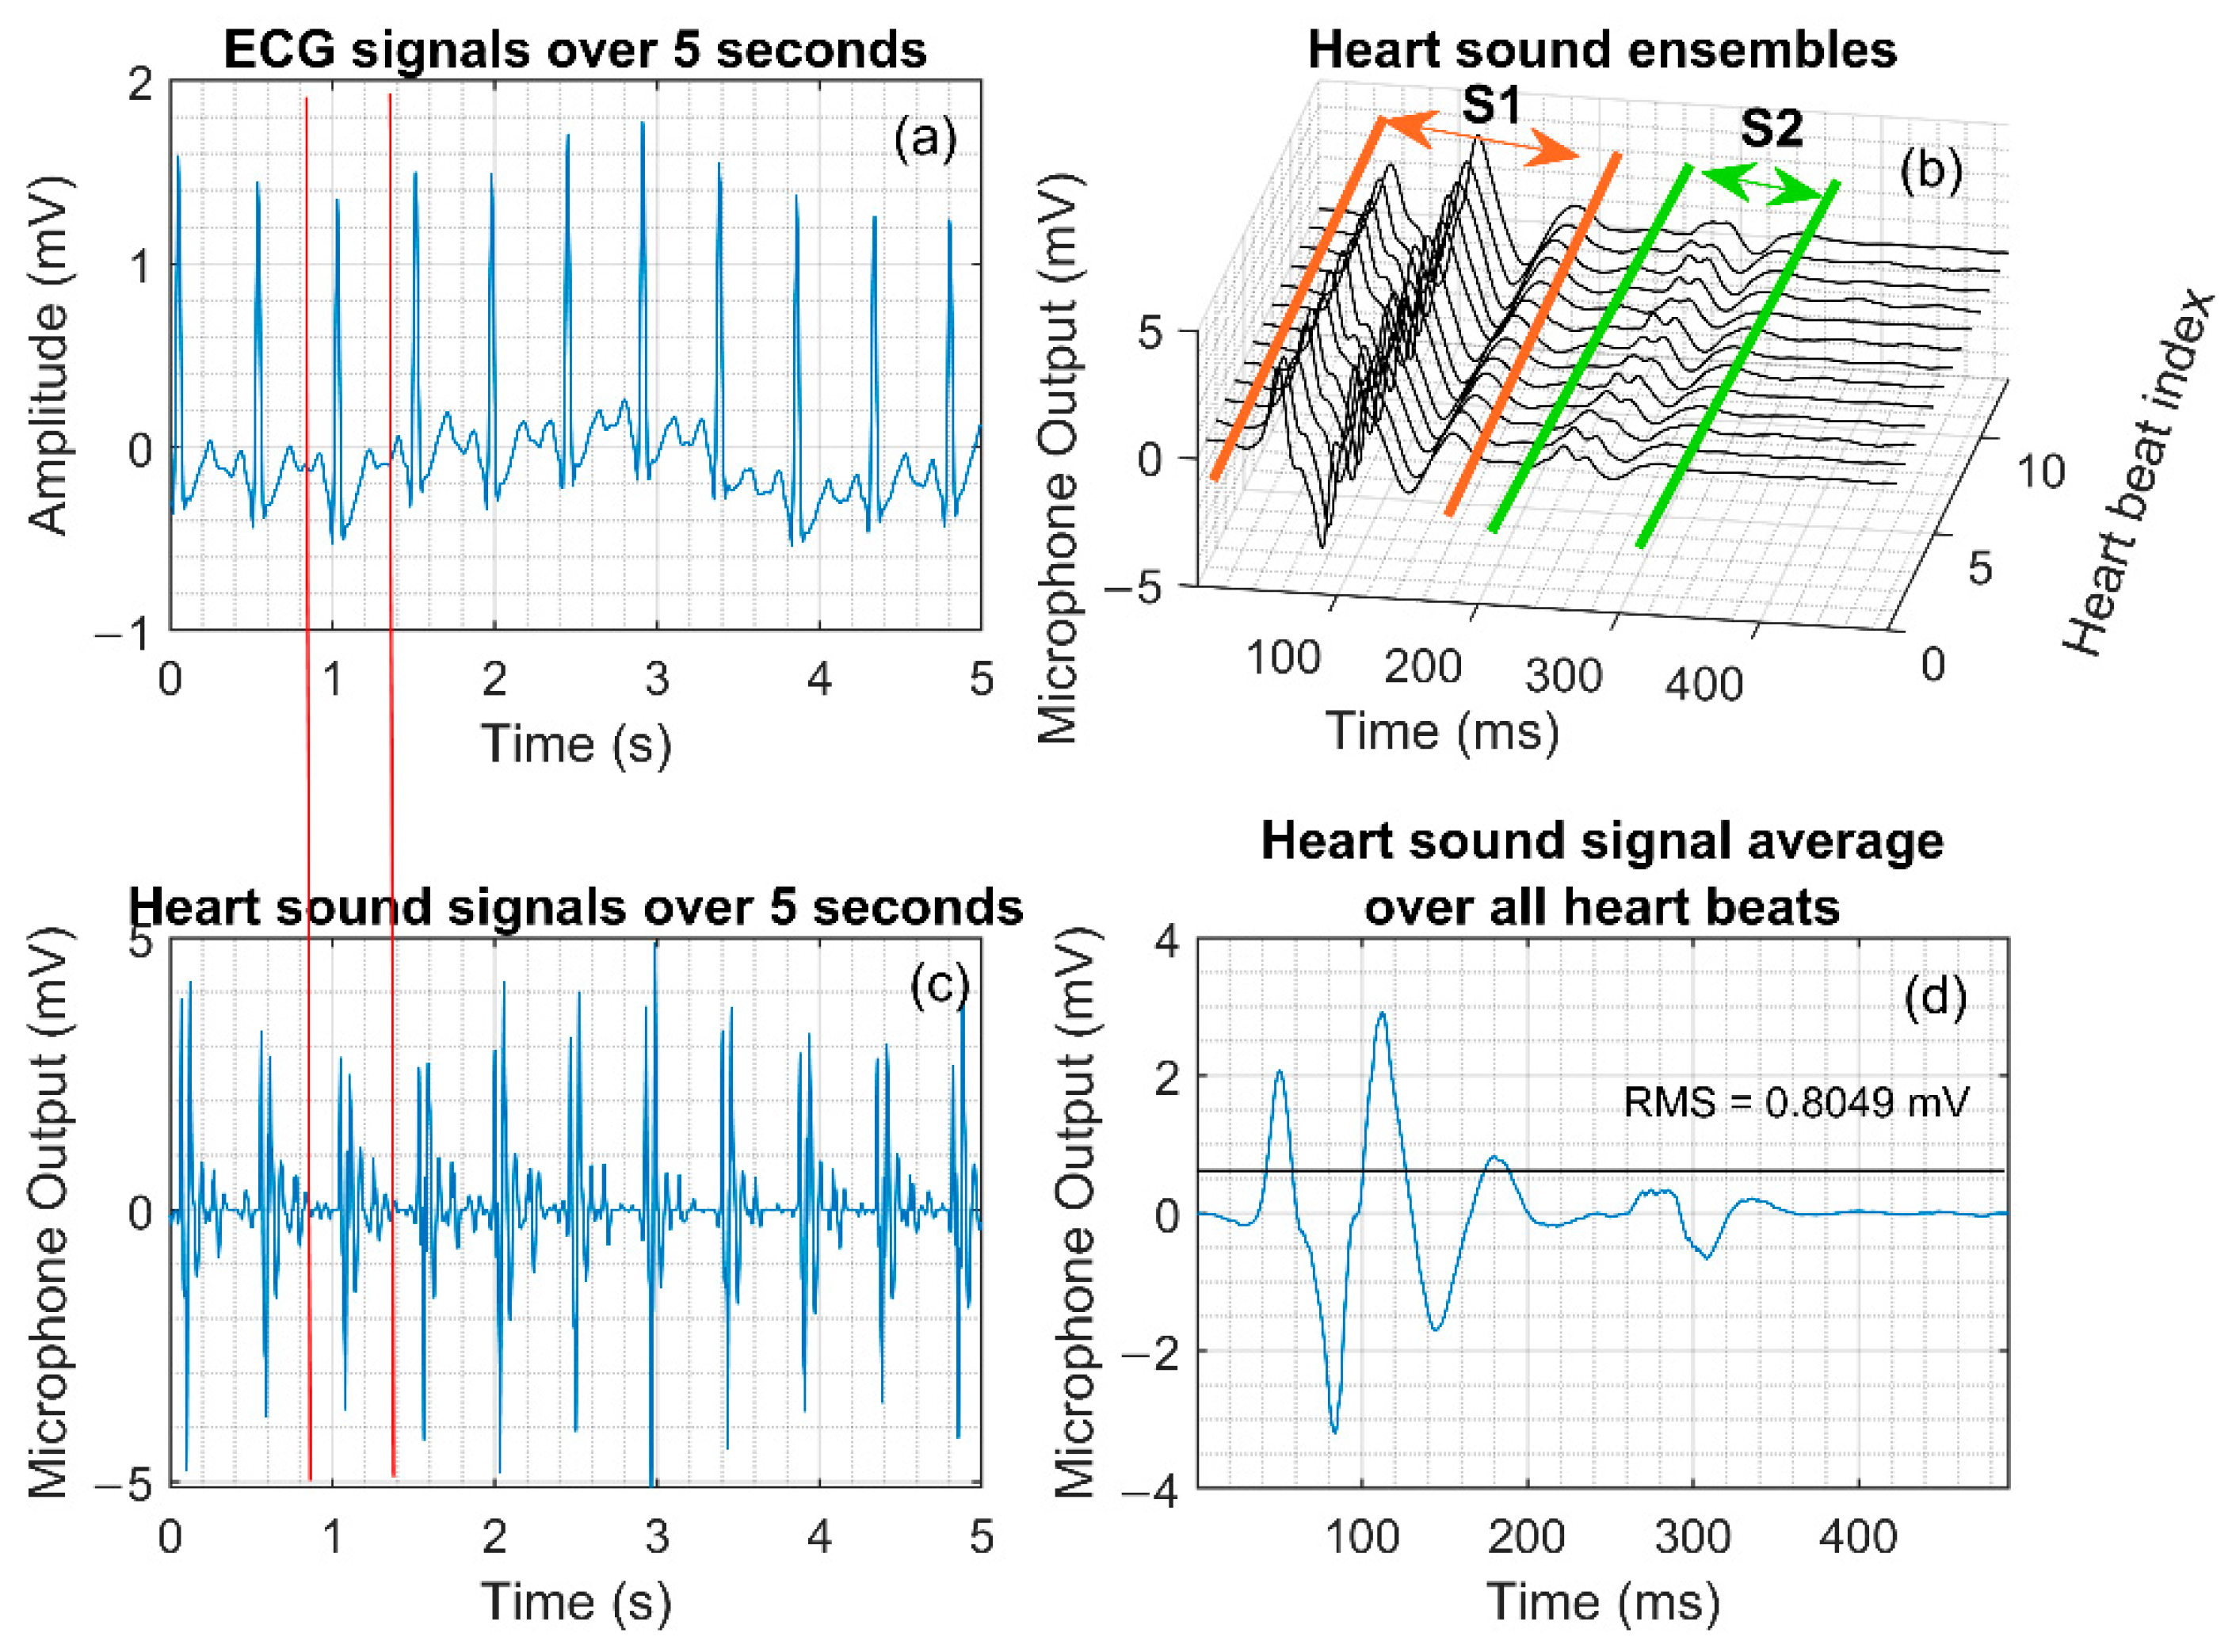
  • To calculate of the signal average or ensemble average, we applied the Pan and Tompkins R-peak detection algorithm [21] on the simultaneously acquired ECG data to find the timestamps of R peak occurrence in the ECG. These peaks serve as fiducial points for each heartbeat. The RR intervals associated with each heartbeat were calculated by computing the first-order difference of the timestamp sequence associated with R peaks in the ECG waveform. A delay offset of 0.05 ( RR   interval ) was applied to the RR interval sequence to obtain a beat-to-beat interval from the p-wave to the subsequent p-wave. The corresponding timestamps of the heart sound signal were then extracted and an ensemble was generated, as shown in Figure 5b. The ensemble median was then used as the representative heart sound signal associated with an activity for a subject.
  • For each activity and subject, the corresponding data segments were segmented using the timestamps captured during the execution of the protocol and manual tuning as needed to find the timestamp for the end of an activity. Ensembles were extracted from these segments for each subject and activity over segments 5 s long, and the corresponding RMS value of the heart sound and the force values were calculated.
The relationship between force and RMS loudness was analyzed using charts of the RMS loudness of ensembles vs. the force RMS values. Linear fit lines applied to these charts were used to estimate the trends in the relationship between force and loudness.
Third, we investigated the relationship between noise levels in measuring heart sounds for each of the activities and the force measured by the WPAS sensing element.
Noise levels are not directly quantifiable in recorded heart sounds, as both the heart sound signal and the noise present in the signals are non-deterministic. Instead of assuming noise variance or manually determining noise levels in the signals, the heart sound signals associated with a set of stationary activities were chosen as the reference signals and any deviation from these reference signals was treated as noise. Table 3 list the activities and the corresponding reference signals used for noise estimation.
The noise level computation procedure is illustrated in Figure 6. Because the length of the signals corresponding to each activity and subject were not the same, the shorter segments were zero-padded to ensure that power spectral density calculations for the noisy segment and the reference segments resulted in an identical frequency resolution. After the power spectral densities were computed, the noise level was computed as follows:
N o i s e   l e v e l = f = 0 f = F s a m p l i n g 2 P S N ( f ) P S ( f ) f = 0 f = F s a m p l i n g 2 P S ( f )
where F s a m p l i n g is the sampling frequency of the heart sound signal (2000 Hz), P S N is the power spectral density of the signal and noise measured during an activity, and P S is the power spectral density of the heart sound signal captured during the corresponding reference activity.
The goal of this type of analysis is to quantify the amount of noise introduced by each activity. In an ideal device, there should be no change in the noise level regardless of the type of activity performed by the subject. Pragmatically, the amount of noise introduced by an activity may have an optimally low level depending on how the WPAS is worn by the subject, specifically in terms of the chosen tightness of the belt in this study. However, this methodology for obtaining individual specific assessments of noise levels and quantifying the same may be extensible to assessment of any other attribute of a wearable device being studied as a modulator of PCG quality during activities.

2.3.3. Cross-Spectral Coherence Analysis

Cross-spectral coherence (CSC) is defined as the Hadamard product of the cross-spectral density and the squared magnitude of the coherence of two signals, x and y .
The cross-spectral density is obtained through a windowed and averaged power spectral estimation method, namely, Welch’s periodogram, applied to the cross-correlation sequence estimate between the signals x and y :
P x y ( ω ) = m = c x y ( m ) w ( m ) . e j ω m
where c x y ( m ) , the cross-correlation sequence, is defined as
c x y = E { x n + m y n }
where E { . } is the expected value operator [22].
The magnitude squared coherence [23] is computed as follows:
C x y = | P x y | 2 P x x P y y
Cross-spectral coherence is calculated as
S x y = P x y C x y
CSC has been used to assess the coupling between heart rate and blood pressure variability [24] and heart rate and respiration in sleep analysis [25]. In this analysis, the signals are heart sounds and activity across subjects for each activity involving movement. CSC was computed for each level of tightness and activity performed by each subject charted using a point and line chart, as illustrated in Figure 7. The point represents the peak value of the spectrum, and the line represents the frequency range over which the cross spectrum is above the RMS value of the overall cross spectrum. These associations are indicated using green arrows in Figure 7.
The goal of the CSC analysis method used here was to quantify the extent of coupling between the activity performed by each subject wearing the WPAS and the PCG signals captured during those activities. Ideally, the CSC should be zero or infinitesimally small down to machine precision, indicating that the activity captured by the accelerometer has no coherence with the PCG signals captured by the device. Pragmatically, there may be a level of tightness as assessed by the force sensors in the WPAS that is associated with the least amount of coherence between the accelerometer activity and PCG. The methodology used to chart the CSC using a point and line chart was intended to produce a simple visualization of the results of CSC for the purpose of comparison across subjects. This method was used in order to evaluate the possibility that there might be a level of tightness when wearing the WPAS that consistently provided the maximal decoupling between the activity being performed and the PCG signals recorded by the WPAS. This methodology can be extended to evaluate other aspects of a wearable PCG device that may be suspected to modulate PCG signal quality during the performance of activities. In this study, the modulator that we chose to study was the tightness of the WPAS.

2.3.4. Search for Optimal Force for Each Subject

The search for the optimal force level that should be maintained to acquire the best quality of heart sounds from the WPAS was carried out by minimizing the RMS noise levels with respect to the RMS force. The noise RMS levels and associated force RMS levels were computed for each activity and subject as described in Section 2.3.2.
For each subject and activity, the RMS force value associated with the lowest noise level was found and a histogram was generated for each subject, with five bins for the RMS force values associated with minimal noise levels across all activities. The RMS force range associated with the most significant number of minimal noise levels was chosen as the optimal range of RMS force for the WPAS in order to acquire the best quality of heart sound signals for that subject. Figure 4, Figure 5, Figure 6, Figure 7, Figure 8 and Figure 9 present an example histogram for one of the subjects.

3. Results

A total of five healthy subjects were recruited (four males and one female). All subjects signed the informed consent form and completed the study. No data were excluded from the analysis. The hypothesis that a generalizable method of donning the WPAS can be applicable to all potential users was not supported by the data collected from the five subjects. Therefore, further enrollment was not justified. However, the personalized calibration method proposed in Section 3.5 requires an increased study population size in order to validate its utility in the general population.

3.1. Comparison of WPAS and Reference Electronic Stethoscope

The heart sound recordings from the WPAS and Eko Core device were synchronized following the procedure described in Section 2.3.1. The heart sounds were then plotted synchronously to manually evaluate the level of alignment and validate that the WPAS device accurately captured heart sounds from all subjects. Figure 9 presents the synchronized charting of data. From Figure 9, the time of occurrence and relative amplitude characteristics of heart sounds (S1 and S2) are synchronized. Therefore, the WPAS captures heart sounds comparable to the Eko device.

3.2. Relationship between WPAS Force RMS and Heart Sound Loudness

As a first step, validation was necessary to confirm that the subjects’ tightness levels increased the force RMS values measured by the force sensors incorporated in the WPAS sensing element. Figure 10 presents a chart of the force RMS values for each level of tightness across subjects and activities. A positive slope trend is observed for all activities across all subjects, with the exception of the prone activity.
The ensemble medians for each activity and each subject were computed. The RMS values of the heart sounds were determined from the ensemble medians for each subject and activity. Figure 11 presents the results of the computation of the ensemble medians for the three levels of tightness for the Stand Still 1 activity for each subject.
In all subjects, an increase in the tightness level, and consequently an increase in the force RMS measured by WPAS, led to an increase in the overall loudness of the heart sounds measured. The relationship between RMS force and heart sound amplitude is further explored in Figure 12 across all activities and subjects. Green backgrounds indicate positive slopes and red indicates negative slopes.
The consistent increase in the RMS amplitudes of heart sounds with RMS of force measured by WPAS is observed for all Stand Still activities (1 through 4) and for walking in a circle. However, the results from the other activities are inconsistent. The slopes of the line fits are not strictly positive for activities other than standing still and walking in a circle. This observation suggests that there may be differences in the relationship between force RMS and heart sound amplitude RMS introduced by confounding factors. One confounding factor may be differences in subject body habitus and the movements introduced by differences in body habitus.

3.3. Relationship between WPAS Force RMS and Noise Levels

Analysis was performed to assess the relationship between force RMS from WPAS and the corresponding noise levels in the acquired heart sounds, as described in Section 2.3.2. Figure 13 shows the result of this analysis.
There are consistent negative slopes for four of the five subjects for left lateral and supine activities. However, subject 5 shows only a marginal inclination towards a negative slope between the force RMS and noise levels in left lateral activity. Similarly, the only marginally negative trend in supine activity is observed for subjects 1, 2, and 5. These findings suggest that the trends across subjects are inconsistent, and a generalized relationship between WPAS force RMS and heart sound levels is not easily discernible.

3.4. Cross-Spectral Coherence between WPAS Activity and Heart Sounds

Analysis of cross-spectral coherence between activities was carried out to discern whether a range of WPAS force values across subjects could decouple activity from the measured heart sounds and reduce the noise introduced by activity. The inherent nature of the activity in question and its dependence on body habitus differentiates the absolute values of cross-coherence between activity and heart sounds across subjects. For example, the bending forward and standing up activity results in greater acceleration and net displacement if the subject performing the activity is tall compared to a shorter subject. A comparison of the absolute values was thus not pursued. Instead, we evaluated whether an increased force RMS as measured by the WPAS shows the same decoupling or coupling pattern between activity and measured heart sounds across subjects. The results as presented in Figure 14 indicate that the pattern of interaction or coupling between activity and the WPAS RMS force is inconsistent across subjects. This further reinforces the conclusion that a generalized choice of force RMS for all subjects is not supported based on the data collected in this study. It is notable that among the activities involving movement, walking in a circle and upper body twist show consistent patterns across four of the five subjects.

3.5. Search for Optimal WPAS Force for Each Subject

Following the observations described in Section 3.2, Section 3.3 and Section 3.4, the impact of force RMS from WPAS on the quality of heart sounds was inconsistent across subjects. On this basis, a personalized approach was warranted to determine the optimal force RMS for each subject. The approach to finding the optimal force RMS range is described in Section 2.3.4. Figure 15 shows the histogram of the force RMS levels associated with the lowest noise levels across activities for each subject.
Using the force RMS bin associated with maximal members as the optimal range, an optimal force RMS range was determined for each subject. Table 4 lists the optimal range compared to the full range of forces evaluated.

4. Discussion

The WPAS device was designed to capture multiple signals considered potential PCG quality modulators, including activity, posture, ECG, and WPAS force. First, the WPAS measured signals are uncorrelated in terms of their origin and manifestation, meaning that potential interactions with the origin of the PCG, that is, the heart’s mechanical activity, could be ignored. Activity and posture are physical measures of movement, while WPAS force is a physical measurement of the state of the sensing element in the WPAS. As all of the subjects in this study were normal and healthy, the ECG can unequivocally specify the time of occurrence of heartbeats. Second, retrospective time segmentation of the activities in the protocol could be performed programmatically using entered time stamps and verified through manual scanning of the activity signals and static acceleration due to gravity. The latter could then be used to infer the subjects’ posture. Future studies might consider including additional locations of measurements of force and activity, allowing more nuanced differences between the same movements performed by subjects with different body habitus to be studied as potential confounders when associating calibration signals (in this case, force RMS) with the quality of recorded PCGs.
During the execution of the protocol, it was observed that the WPAS belt is susceptible to sliding up or down because of the movements such as bending forward and standing up if worn lower or higher than the level of the sternum. The activities in the protocol did not lead to the belt moving up or down from the initial location if this positioning was ensured. Commercially available devices such as the Zephyr BioHarness (Medtronic. Inc., Boulder, CO, USA) and Equivital LifeMonitor (Equivital Inc., New York, NY, USA) have mechanisms that include an over-the-shoulder harness or incorporation into a compression garment to help maintain the position of the horizontal sensing elements [26]. These solutions may help to secure belt-type devices to the thorax. A further observation regarding the use of a loop and Velcro mechanism to change the tightness of the belt is that fastening the belt more tightly does not apply compression force evenly across the entire belt. As the sensing element cannot be placed near the loop buckle of the belt due to the hard plastic tapping against the sensing element during movement, with higher BMI subjects the tightening of the belt led to discomfort at the site of the loop even before higher force values of 7–9 N could be achieved.
Detailed analysis of the relationship between Force RMS and PCG noise level and between the Force RMS and RMS of the PCG was not pursued as part of this work. Simple linear fit models were presented to assess the extent to which the relationships between Force RMS and PCG noise levels, and Force RMS and RMS of the PCG, are similar across subjects rather than attempting to fit the data to find a relationship. Future studies might focus on developing these relationships in order to better understand WPAS performance.

5. Conclusions

This study explored one of the primary criteria for the comfort of a belt-type wearable PCG device, namely, tightness, as well as how it impacts PCG signal quality. Variation in body habitus across subjects and differences in subjective preferences in how wearable devices are worn can introduce different noise levels and variability into the quality of the measured data. It was observed through analysis of the data that a globally preferred level of force RMS from the WPAS could not be found across the subjects who participated in this study. Therefore, it is desirable to determine a methodology for calibrating wearable phonocardiogram devices with a mechanism to capture the characteristics of particular instances of device use by individual wearers. While the force experienced by the sensing element can serve as a repeatable measure for calibration to each subject, thus is not generalizable across subjects. We have demonstrated the use of force measurements and controlled activities performed while recording to determine optimal wearing characteristics, which can lead to personalized calibration for individual users.

Author Contributions

Conceptualization: P.S.K., M.R. and V.K.V.; methodology, data analysis, and visualizations: P.S.K. and M.R.; writing—original draft: P.S.K.; writing—review, editing, and supervision: M.R. and V.K.V. All authors have read and agreed to the published version of the manuscript.

Funding

This research received no external funding.

Institutional Review Board Statement

The study was conducted in accordance with the Declaration of Helsinki, and approved by the Institutional Review Board of The Pennsylvania State University (protocol code-STUDY00018016 and date of approval—28 July 2021).

Informed Consent Statement

Informed consent was obtained from all subjects involved in the study.

Data Availability Statement

Data collected during this study are not publicly available, but can be prepared for sharing upon written request to the corresponding author.

Conflicts of Interest

The authors declare no conflict of interest.

References

  1. Klum, M.; Leib, F.; Oberschelp, C.; Martens, D.; Pielmus, A.G.; Tigges, T.; Penzel, T.; Orglmeister, R. Wearable Multimodal Stethoscope Patch for Wireless Biosignal Acquisition and Long-Term Auscultation. In Proceedings of the 2019 41st Annual International Conference of the IEEE Engineering in Medicine and Biology Society (EMBC), Berlin, Germany, 23–27 July 2019; pp. 5781–5785. [Google Scholar]
  2. Klum, M.; Urban, M.; Tigges, T.; Pielmus, A.-G.; Feldheiser, A.; Schmitt, T.; Orglmeister, R. Wearable Cardiorespiratory Monitoring Employing a Multimodal Digital Patch Stethoscope: Estimation of ECG, PEP, LVET and Respiration Using a 55 mm Single-Lead ECG and Phonocardiogram. Sensors 2020, 20, 2033. [Google Scholar] [CrossRef] [PubMed]
  3. Behere, S.; Baffa, J.M.; Penfil, S.; Slamon, N. Real-World Evaluation of the Eko Electronic Teleauscultation System. Pediatr. Cardiol. 2019, 40, 154–160. [Google Scholar] [CrossRef] [PubMed]
  4. Sapsanis, C.; Welsh, N.; Pozin, M.; Garreau, G.; Tognetti, G.; Bakhshaee, H.; Pouliquen, P.O.; Mitral, R.; Thompson, W.R.; Andreou, A.G. StethoVest: A simultaneous multichannel wearable system for cardiac acoustic mapping. In Proceedings of the 2018 IEEE Biomedical Circuits and Systems Conference (BioCAS), Cleveland, OH, USA, 17–19 October 2018; pp. 1–4. [Google Scholar]
  5. Hwang, I.; Kim, H.N.; Seong, M.; Lee, S.-H.; Kang, M.; Yi, H.; Bae, W.G.; Kwak, M.K.; Jeong, H.E. Multifunctional Smart Skin Adhesive Patches for Advanced Health Care. Adv. Healthc. Mater. 2018, 7, 1800275. [Google Scholar] [CrossRef] [PubMed]
  6. Hu, Y.; Xu, Y. An ultra-sensitive wearable accelerometer for continuous heart and lung sound monitoring. In Proceedings of the 2012 Annual International Conference of the IEEE Engineering in Medicine and Biology Society, San Diego, CA, USA, 28 August–1 September 2012; pp. 694–697. [Google Scholar]
  7. Shi, W.Y.; Mays, J.; Chiao, J. Wireless stethoscope for recording heart and lung sound. In Proceedings of the 2016 IEEE Topical Conference on Biomedical Wireless Technologies, Networks, and Sensing Systems (BioWireleSS), Austin, TX, USA, 24–27 January 2016; pp. 1–4. [Google Scholar]
  8. Chen, Z.; Chen, D.; Xue, L.; Chen, L. A Piezoelectric Heart Sound Sensor for Wearable Healthcare Monitoring Devices. In EAI International Conference on Body Area Networks; Springer: Cham, Switzerland, 2019; pp. 12–23. [Google Scholar]
  9. Marzorati, D.; Bovio, D.; Salito, C.; Mainardi, L.; Cerveri, P. Chest Wearable Apparatus for Cuffless Continuous Blood Pressure Measurements Based on PPG and PCG Signals. IEEE Access 2020, 8, 55424–55437. [Google Scholar] [CrossRef]
  10. Wu, K.; Zhang, H.; Chen, Y.; Luo, Q.; Xu, K. All-Silicon Microdisplay Using Efficient Hot-Carrier Electroluminescence in Standard 0.18μm CMOS Technology. IEEE Electron. Device Lett. 2021, 42, 541–544. [Google Scholar] [CrossRef]
  11. Xu, K. Silicon electro-optic micro-modulator fabricated in standard CMOS technology as components for all silicon monolithic integrated optoelectronic systems. J. Micromech. Microeng. 2021, 31, 054001. [Google Scholar] [CrossRef]
  12. Rosa, B.G.; Anastasova, S.; Lo, B. Small-form wearable device for long-term monitoring of cardiac sounds on the body surface. In Proceedings of the 2021 IEEE 17th International Conference on Wearable and Implantable Body Sensor Networks (BSN), Athens, Greece, 27–30 July 2021; pp. 1–4. [Google Scholar]
  13. Wang, T.; Gong, M.; Yu, X.; Lan, G.; Shi, Y. Acoustic-pressure sensor array system for cardiac-sound acquisition. Biomed. Signal Process. Control 2021, 69, 102836. [Google Scholar] [CrossRef]
  14. Gupta, P.; Moghimi, M.J.; Jeong, Y.; Gupta, D.; Inan, O.T.; Ayazi, F. Precision wearable accelerometer contact microphones for longitudinal monitoring of mechano-acoustic cardiopulmonary signals. NPJ Digit. Med. 2020, 3, 19. [Google Scholar] [CrossRef] [PubMed]
  15. Azaria, M.; Hertz, D. Time delay estimation by generalized cross correlation methods. IEEE Trans. Acoust. Speech Signal Process. 1984, 32, 280–285. [Google Scholar] [CrossRef]
  16. Gao, J.; Gurbaxani, B.M.; Hu, J.; Heilman, K.J.; Emanuele Ii, V.A.; Lewis, G.F.; Davila, M.; Unger, E.R.; Lin, J.-M.S. Multiscale analysis of heart rate variability in non-stationary environments. Front. Physiol. 2013, 4, 119. [Google Scholar] [CrossRef] [Green Version]
  17. Task Force of the European Society of Cardiology the North American Society of Pacing Electrophysiology. Heart Rate Variability. Circulation 1996, 93, 1043–1065. [Google Scholar] [CrossRef]
  18. Messer, S.R.; Agzarian, J.; Abbott, D. Optimal wavelet denoising for phonocardiograms. Microelectron. J. 2001, 32, 931–941. [Google Scholar] [CrossRef]
  19. Jain, P.K.; Tiwari, A.K. An adaptive thresholding method for the wavelet based denoising of phonocardiogram signal. Biomed. Signal Process. Control 2017, 38, 388–399. [Google Scholar] [CrossRef]
  20. Gradolewski, D.; Redlarski, G. Wavelet-based denoising method for real phonocardiography signal recorded by mobile devices in noisy environment. Comput. Biol. Med. 2014, 52, 119–129. [Google Scholar] [CrossRef]
  21. Pan, J.; Tompkins, W.J. A Real-Time QRS Detection Algorithm. IEEE Trans. Biomed. Eng. 1985, BME-32, 230–236. [Google Scholar] [CrossRef] [PubMed]
  22. Oppenheim, A.V.; Schafer, R.W.; Buck, J.R. Discrete-Time Signal Processing, 2nd ed.; Prentice-Hall, Inc.: Hoboken, NJ, USA, 1999. [Google Scholar]
  23. Kay, S.M. Modern Spectral Estimation: Theory and Application; Prentice-Hall: Englewood Cliffs, NJ, USA, 1988. [Google Scholar]
  24. Baselli, G.; Cerutti, S.; Civardi, S.; Liberati, D.; Lombardi, F.; Malliani, A.; Pagani, M. Spectral and cross-spectral analysis of heart rate and arterial blood pressure variability signals. Comput. Biomed. Res. 1986, 19, 520–534. [Google Scholar] [CrossRef]
  25. Thomas, R.J.; Wood, C.; Bianchi, M.T. Cardiopulmonary coupling spectrogram as an ambulatory clinical biomarker of sleep stability and quality in health, sleep apnea, and insomnia. Sleep 2018, 41, zsx196. [Google Scholar] [CrossRef] [PubMed]
  26. Patel, V.; Austin, C.; Legner, C.M.; Pandey, S. Trends in Workplace Wearable Technologies and Connected-Worker Solutions for Next-Generation Occupational Safety, Health, and Productivity. Adv. Intell. Syst. 2022, 4, 2100099. [Google Scholar] [CrossRef]
Figure 1. Illustration of the WPAS sensing component mounted on a belt.
Electronics 11 02655 g001
Figure 2. On the left, illustration of the standard clinical auscultation placements on the thorax; right, the positioning of the electrodes and sensing element of the WPAS system.
Electronics 11 02655 g002
Figure 3. Study Workflow.
Electronics 11 02655 g003
Figure 4. Manifestation of the physical tap as recorded by the WPAS and Eko device.
Electronics 11 02655 g004
Figure 5. (a) ECG signal with sample beat-to-beat interval; (b) ensembles of heart sounds and illustration of the segmentation of S1 and S2; (c) heart sounds corresponding to the ECG with red vertical lines demarcating a single heartbeat; (d) ensemble median of waveforms in (b) and the RMS value of the ensemble median.
Electronics 11 02655 g005
Figure 6. Procedure for estimating noise level of the measured heart sounds for each activity.
Electronics 11 02655 g006
Figure 7. Method of creating charts for assessment of CSC across subjects for each activity.
Electronics 11 02655 g007
Figure 8. Histogram of RMS force levels associated with minimal noise levels across activities.
Electronics 11 02655 g008
Figure 9. Time-synchronized occurrence of S1 and S2 as captured by Eko Core device and WPAS.
Electronics 11 02655 g009
Figure 10. Force RMS vs. WPAS tightness levels for all subjects across activities.
Electronics 11 02655 g010
Figure 11. Overlapping plots in time domain of the ensemble medians representing heart sounds collected during activity Stand Still 1 at three levels of tightness for each subject.
Electronics 11 02655 g011
Figure 12. WPAS RMS force vs. RMS of heart sound amplitudes across activities for each subject.
Electronics 11 02655 g012
Figure 13. Relationship between WPAS force RMS and heart sound noise level.
Electronics 11 02655 g013
Figure 14. Cross-Spectral Coherence between activity and heart sounds measured by WPAS.
Electronics 11 02655 g014
Figure 15. Histogram of WPAS force RMS values associated with low noise levels in heart sounds across activities for each subject.
Electronics 11 02655 g015
Table 1. Previous research works in the literature related to the current work.
ReferenceWearable Device CharacteristicsData Reported for Movement of Activity
Hu et al., 2012 [6]
  • Custom high-sensitivity accelerometer sensor
  • Stethoscope @ 20 KHz
No protocol described for wearable use scenario; only one snapshot of recording provided
Shi W. Y. et al., 2016 [7]
  • Diaphragm microphone
  • Sensor mounting is not described
  • Stethoscope @ 9.6 KHz
Recordings performed in static posture; no protocol described for wearable use scenario
Chen Z et al., 2019 [8]
  • Customized piezoelectric membrane sensor
  • Sensor mounted on a belt or strap
  • Stethoscope @ 2 KHz
No protocol described for wearable use scenario; only one snapshot of recording provided.
Klum M et al., 2019 [1] & Klum M et al., 2020 [2]
  • Gel adhesive electrodes
  • Device supported by adhesives
  • ECG 3 leads @ 1 KHz
  • Stethoscope @ 10 KHz
  • Impedance @ 1 KHz
  • Ambient noise @ 10 KHz
  • Nine-axial IMU @ 950 Hz
Data reported for supine, lateral, and prone position; no data reported for activity.
Marzorati et al., 2020 [9]
  • Pressure sensor
  • Sensor mounted on a belt or strap
  • Stethoscope @ 2 KHz
Recordings performed on subjects in a seated posture; testing intent was to produce a device for blood pressure estimation.
This Work
  • MEMs microphone
  • Sensor mounted on a belt or strap
  • Stethoscope @ 2 KHz
Protocol involved movements that emulate daily activities
Table 2. List of activities and their duration and/or repetitions.
Activity NumberActivityDuration of Activity (minutes)/Number of Repetitions
1Stand Still 11
2Walk around in a circle1
3Stand Still 21
4Bend forward and stand up straight10 repetitions
5Stand still 31
6Upper body twist (left to right)10 repetitions
7Stand Still 41
8Arms Up/down and Arms Side/side10 repetitions
9Read Paragraph from Penn State Wikipedia pageOne paragraph at conversational loudness.
10Supine1
11Left Lateral1
12Right Lateral1
13Prone1
Table 3. List of activities that introduce noise in the heart sound signal and the corresponding reference activities that represent the signal.
ActivityReference for Activity
Walk in a circleStand Still 1
Bend forward and stand upStand Still 2
Upper Body TwistStand Still 3
Arms up/down, and side to sideStand Still 4
Read ParagraphStand Still 4
Lying SupineStand Still 4
Lying Left LateralStand Still 4
Lying Right LateralStand Still 4
Lying ProneStand Still 4
Table 4. The full range of force RMS measured by the WPAS for each subject and the corresponding optimal ranges obtained.
Subject Full Range of Force RMS (N)Optimal Range of Force RMS (N)
1[5.14, 11.08][8.9, 10]
2[3.98, 8.37] [5.8, 6.7]
3[5.03, 6.80][5.4, 5.63]
4[3.97, 9.58][4, 5.1]
5[4.34, 8.18][5.6, 6.6]
Publisher’s Note: MDPI stays neutral with regard to jurisdictional claims in published maps and institutional affiliations.

