1. Introduction
Future communication systems are expected to bring a paradigm shift, especially with reference to system speed, user capacity, latency, and energy efficiency. Power Line Communication (PLC) is an efficient, robust, and cost-effective data communication technology that provides an extensive coverage area by utilizing existing electrical power transmission infrastructure. PLC is popular for smart grid and in-home networking applications. It has become significant in many indoor scenarios, such as basements and buildings with metal or concrete walls, where wireless signals suffer from high losses. As the basic purpose of power lines is not to carry communication signals, PLC systems have major challenges, which include non-Gaussian noise, frequency selectivity, and low signal power due to electromagnetic compatibility issues. Based on data speeds, PLC is categorized into three different technologies, namely, ultra-narrowband PLC, narrowband PLC, and Broadband PLC (BPL) [
1]. We refer to the case of BPL for communication system evaluation and design in this research work. BPL aims for higher data rates, and several Multiple Access (MA) schemes for this technology are discussed in the literature, most of which are Orthogonal Multiple Access (OMA) techniques [
1,
2]. Orthogonal Frequency Division Multiple Access (OFDMA) deals with non-Gaussian noise and the frequency-selective channel of PLC. The spectrum efficiency of OFDM subchannels can be further increased with the application of Nonorthogonal Multiple Access (NOMA) technique, which is validated from recent research, especially for multiuser cases [
2].
The type of Multiple Access (MA) scheme, applied to a particular generation of communication systems, has special significance in differentiating the performance of various communication systems [
3]. The conventional MA techniques that encompass the OMA schemes employ orthogonal resources either in the time, frequency, or code domain to avoid interuser interference. Even though OMA approaches have relatively lower complexity, they have limited performance in terms of user connectivity and throughput. Hence, the OMA techniques are unable to meet the requirements of the future communication era of the internet of things. To address the challenges, some powerful solutions, for instance, massive multiple-input multiple-output, millimeter wave communications, ultradense networks, and NOMA have been proposed in the literature [
4,
5].
NOMA is predicted to become popular in beyond fifth-generation cellular communications because of efficient spectrum utilization and cost-effectiveness [
6]. It is useful for the PLC environment as well to support different devices for communication at different data speeds [
2]. In NOMA techniques, simultaneous users can transmit data over the same frequency but at different power levels or by using multiple codes [
7]. NOMA is a spectral efficient system without compromising the data rates. There are various types of NOMA, including Power-Domain (PD) NOMA and Code-Domain (CD) NOMA. PD-NOMA and CD-NOMA are differentiated by the user multiplexing method. The former employs power-domain multiplexing while the latter utilizes code-domain multiplexing [
8]. PD-NOMA is suggested as a useful technique for wireless channel [
9]. To cope with modern demands of massive connectivity and spectrum incompetency of OMA, NOMA can also be applied in PLC as well [
2,
3,
4,
5,
6,
7,
8,
9,
10]. Research works related to PLC-NOMA can be found in [
10,
11,
12]. Signals from several users are superimposed in this method at the same frequency and time slot but with different power levels based on their relative distance from the base station. This superimposed signal is then transmitted, and at the receiver, a Successive Interference Cancellation (SIC) helps to separate the signal for the intended user. The performance of SIC deteriorates in terms of user detection and throughput as the number of users increases. Sparse Code Multiple Access (SCMA) can provide a solution for high connectivity as compared with PD-NOMA with desirable data rates [
8]. It employs the nonorthogonality of the codes. It is one of the CD-NOMA techniques that use three-dimensional codebooks, designed from the rotation of the constellation [
13]. Each user is assigned a separate codebook for data encoding [
14]. Data from multiple users are encoded using individual sparse codebooks and then superimposed for transmission. A complex receiver, such as a Message Passing Algorithm (MPA) based on maximum likelihood detection, is utilized to extract the desired signal [
15]. The SCMA provides massive connectivity with higher data rates, but it also increases Interuser Interference (IUI) within the SCMA system [
16,
17,
18,
19].
Multicarrier (MC) transmission is a prominent multiplexing and modulation technology in digital communications. Single-carrier modulated transmission may result in the loss of the entire data packet if the data are distorted owing to noise in the channel. MC transmission, on the other hand, provides flexibility and reliability in data transmission. The PLC channel is considered inherently a noisy channel and is also prone to electromagnetic interference. Therefore, MC transmission—i.e., OFDM—is beneficial in terms of robustness and reliability of communication [
1]. Different standards for PLC are available in literature, such as IEEE 1901, which utilizes Fast Fourier Transformed (FFT) Orthogonal Frequency Division Multiplexing (FFT-OFDM) as well as Discrete Wavelet Transform (DWT) OFDM [
1]. As power cables were originally designed to transmit power instead of data, the communication medium is vulnerable to channel impairments such as frequency selective fading [
20]. One of the most significant interferences for PLC systems is harmonic oscillation induced by switching devices [
21]. SINR decreases as a result of the certain noise level of high-frequency harmonics. Although FFT is one of the simplest and most effective techniques for harmonic detection, it has drawbacks such as spectrum leakage, challenges with nonstationary signal analysis, and only provides frequency domain visualization. Unlike the FFT, the DWT’s time–frequency localization properties can adapt to the changes. DWT is frequently employed in the harmonic analysis of power systems because it can maintain all of the temporal and frequency information of the signal [
22]. The use of DWT results in a reduction in noise. Furthermore, by splitting the spectrum to enable multiresolution analysis, DWT minimizes computation complexity compared with FFT, which performs computation at every frequency point [
23,
24]. DWT has a pulse shape with low power in side-lobes, which helps to reduce Intersymbol Interference (ISI) and ICI without appending a Cyclic Prefix (CP), making it spectral-efficient [
25,
26]. DWT-OFDM for PLC was investigated in [
22,
27] and shown to outperform FFT-OFDM in terms of BER. FFT-OFDM and DWT-OFDM can also be integrated with SCMA to enhance their performance. In this document, FFT-OFDM-based SCMA is termed as FFT-SCMA, whereas SCMA employing DWT-OFDM will be referred to as DWT-SCMA for the PLC channel. The scenario without pulse shaping in wireless and PLC environments is represented in this article by SCMA and PLC-SCMA, respectively.
The spectrum efficiency of NOMA is affected by IUI. The IUI can be reduced with pulse-shaping techniques such as FFT and DWT. FFT-OFDM has been combined with PD-NOMA (FFT-NOMA) [
28] and SCMA [
29], resulting in higher data rates and improved BER performance. FFT-SCMA has several intrinsic issues such as a high Peak-to-Average-Power Ratio (PAPR), which is harmful to power amplifiers, spectral inefficiency due to the use of CP, and limited data visualizations of FFT to handle the interference appropriately [
29]. To obtain better data decomposition and reconstruction as compared with FFT, there are other methods such as DWT and Wavelet Packet Transform (WPT) [
30,
31]. The transceiver, employing the DWT-OFDM scheme for resource allocation in PD-NOMA, was proposed in [
32,
33]. DWT-NOMA provides better performance as compared with conventional FFT-NOMA in terms of interference mitigation, multiuser capacity, spectrum confinement, and efficiency [
28,
29,
30,
31,
32,
33]. In [
30], cognitive radio capabilities were explored for the SCMA system. In order to reduce mutual interference between other operating networks, such as WiGig and cognitive users for a 5G network, this system incorporated cognitive traits including spectrum sensing, interference estimates, and subcarrier adaption. Instead of Fourier-transform-based spectrum sensing, Wavelet Packet Transform (WPT) spectrum sensing was employed to conduct an improved estimation of frequency holes. This article presents DWT-SCMA for PLC systems, which is the first study of its kind to the best of our knowledge.
1.1. Contribution
To the best of our knowledge, no research on interference reduction for PLC-SCMA has been conducted in the literature. Following are the major contributions of this research work:
In this paper, the authors suggest DWT-SCMA for the PLC system. Instead of WPT, DWT is adopted due to its sparse structure.
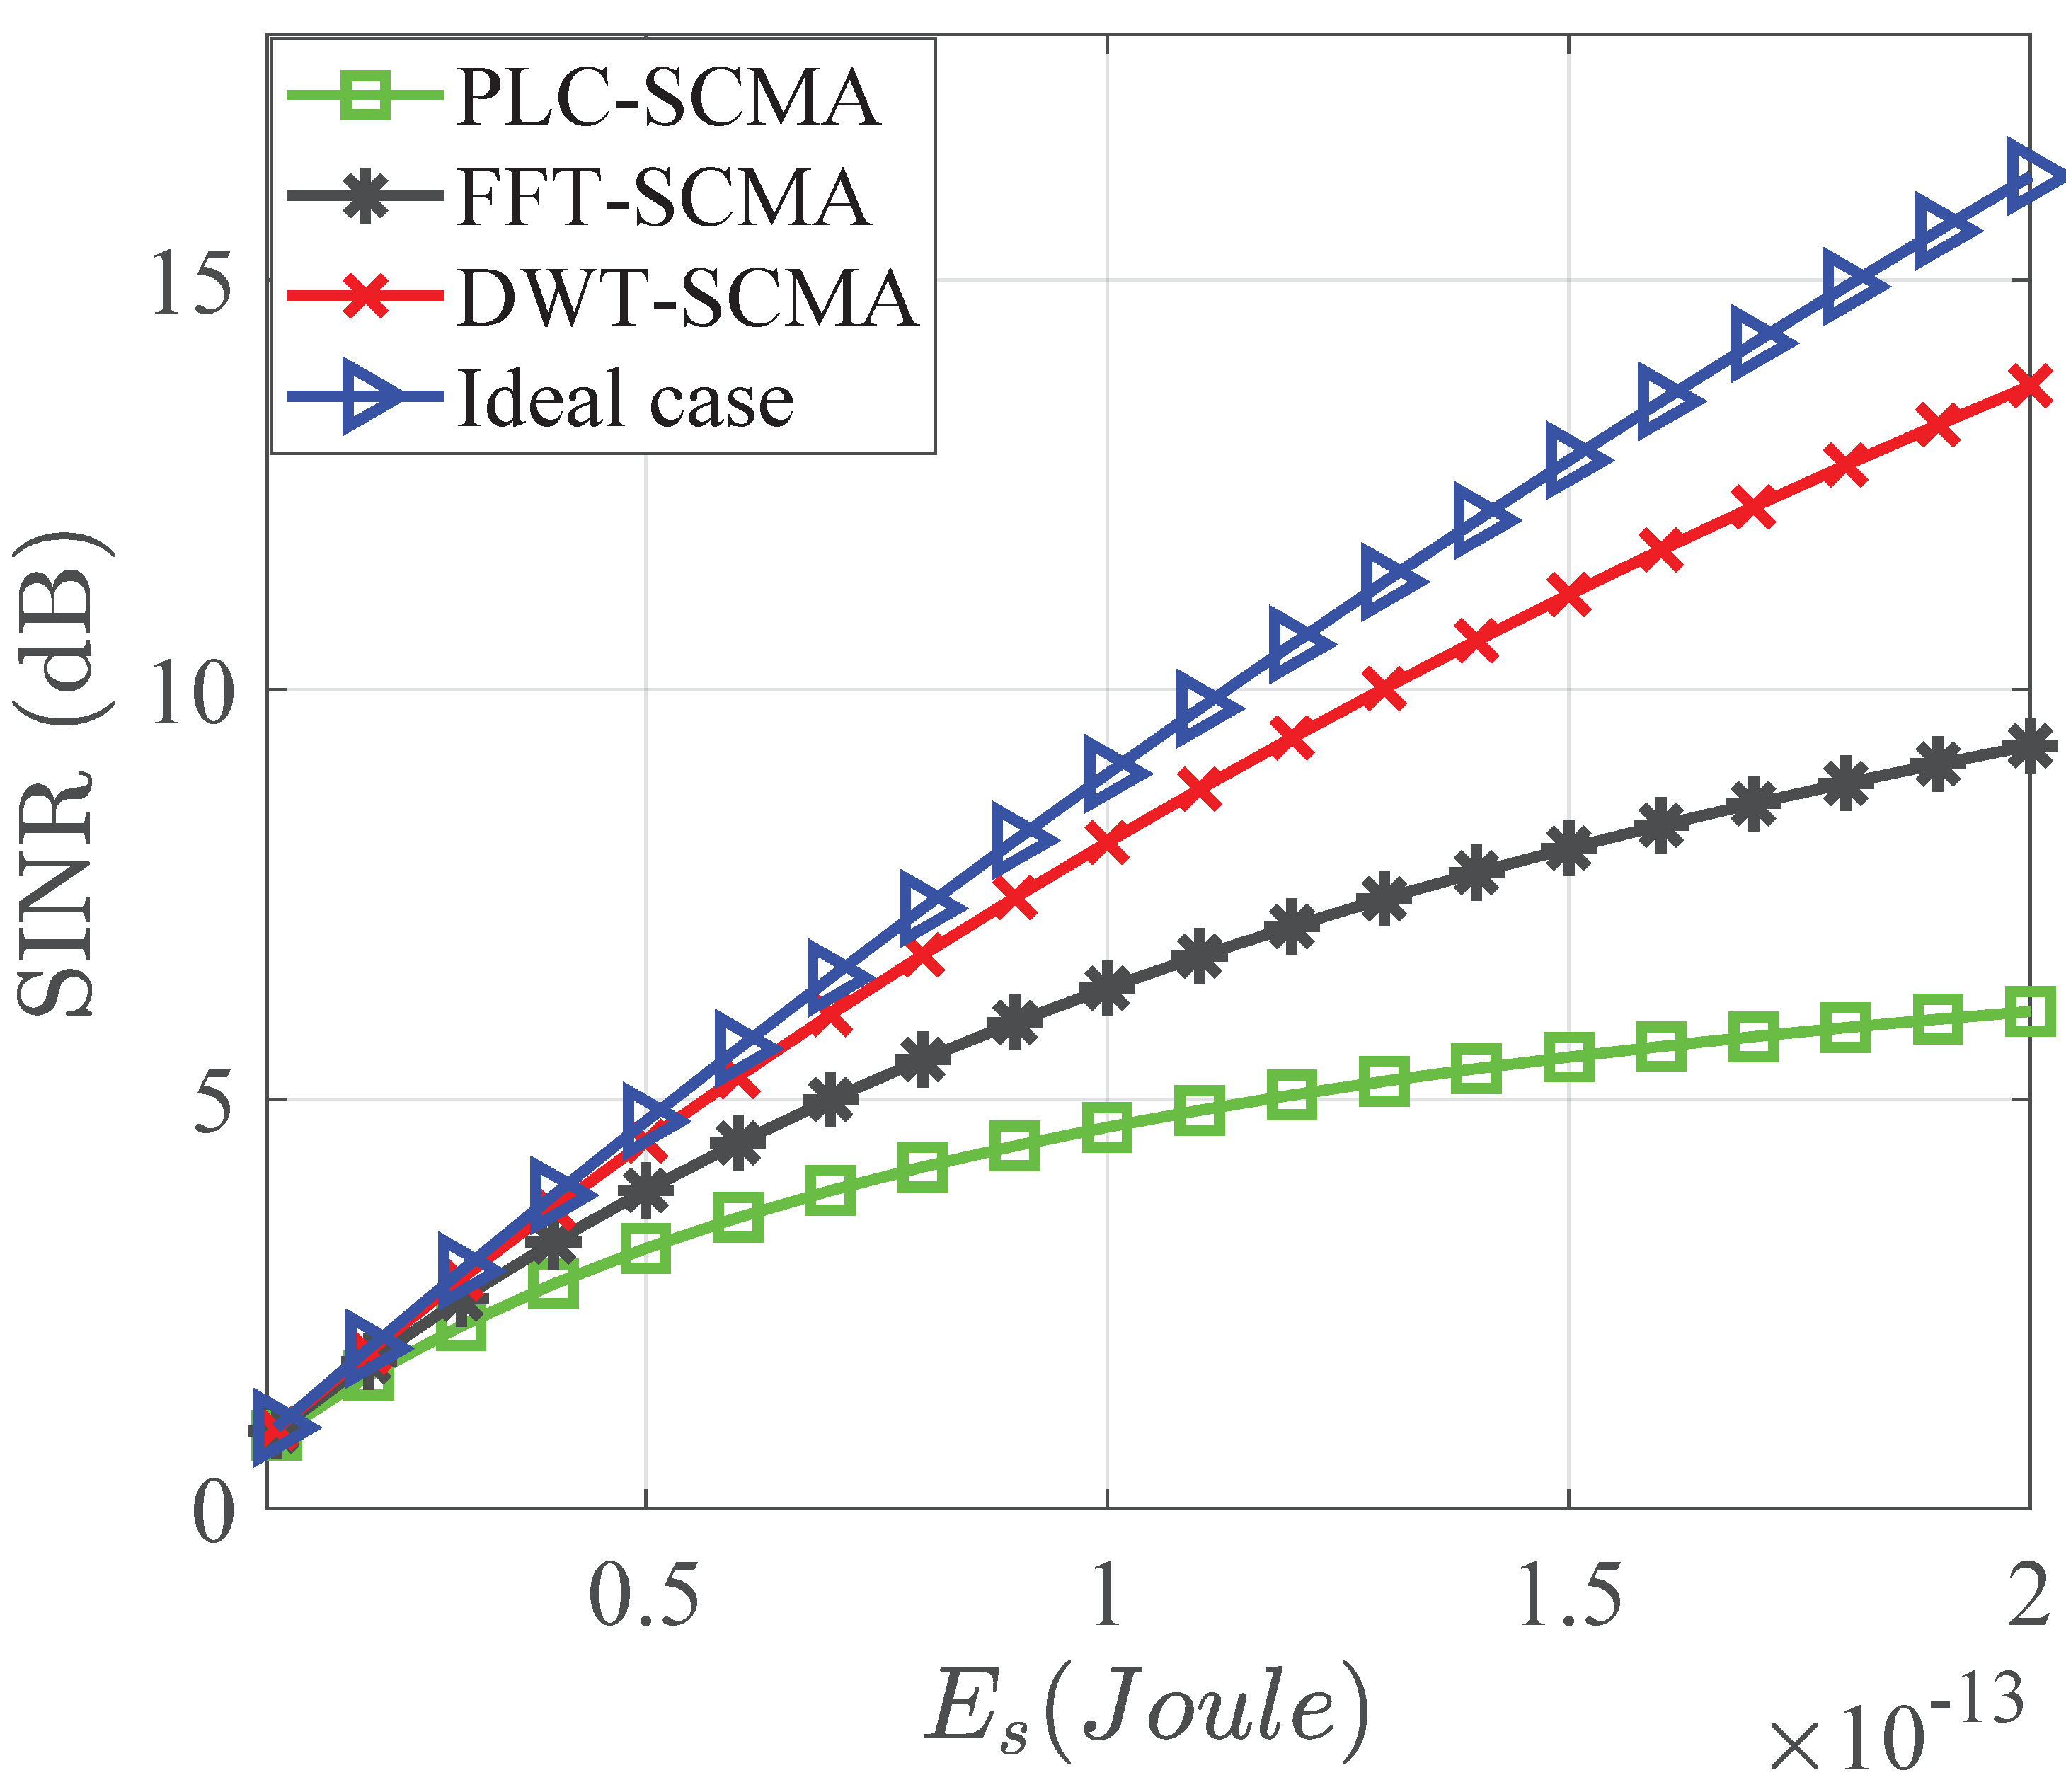
FFT-SCMA uses MC transmission to reduce multipath fading effects and IUI, although it still has Intercarrier Interference (ICI). The pulse-shaping with DWT instead of FFT can lower ICI, resulting in a higher Signal-to-Interference-Plus-Noise Ratio (SINR).
In this work, a mathematical expression for SINR is derived for FFT-SCMA and DWT-SCMA. The impact of both techniques on noise and interference is demonstrated through mathematical equations.
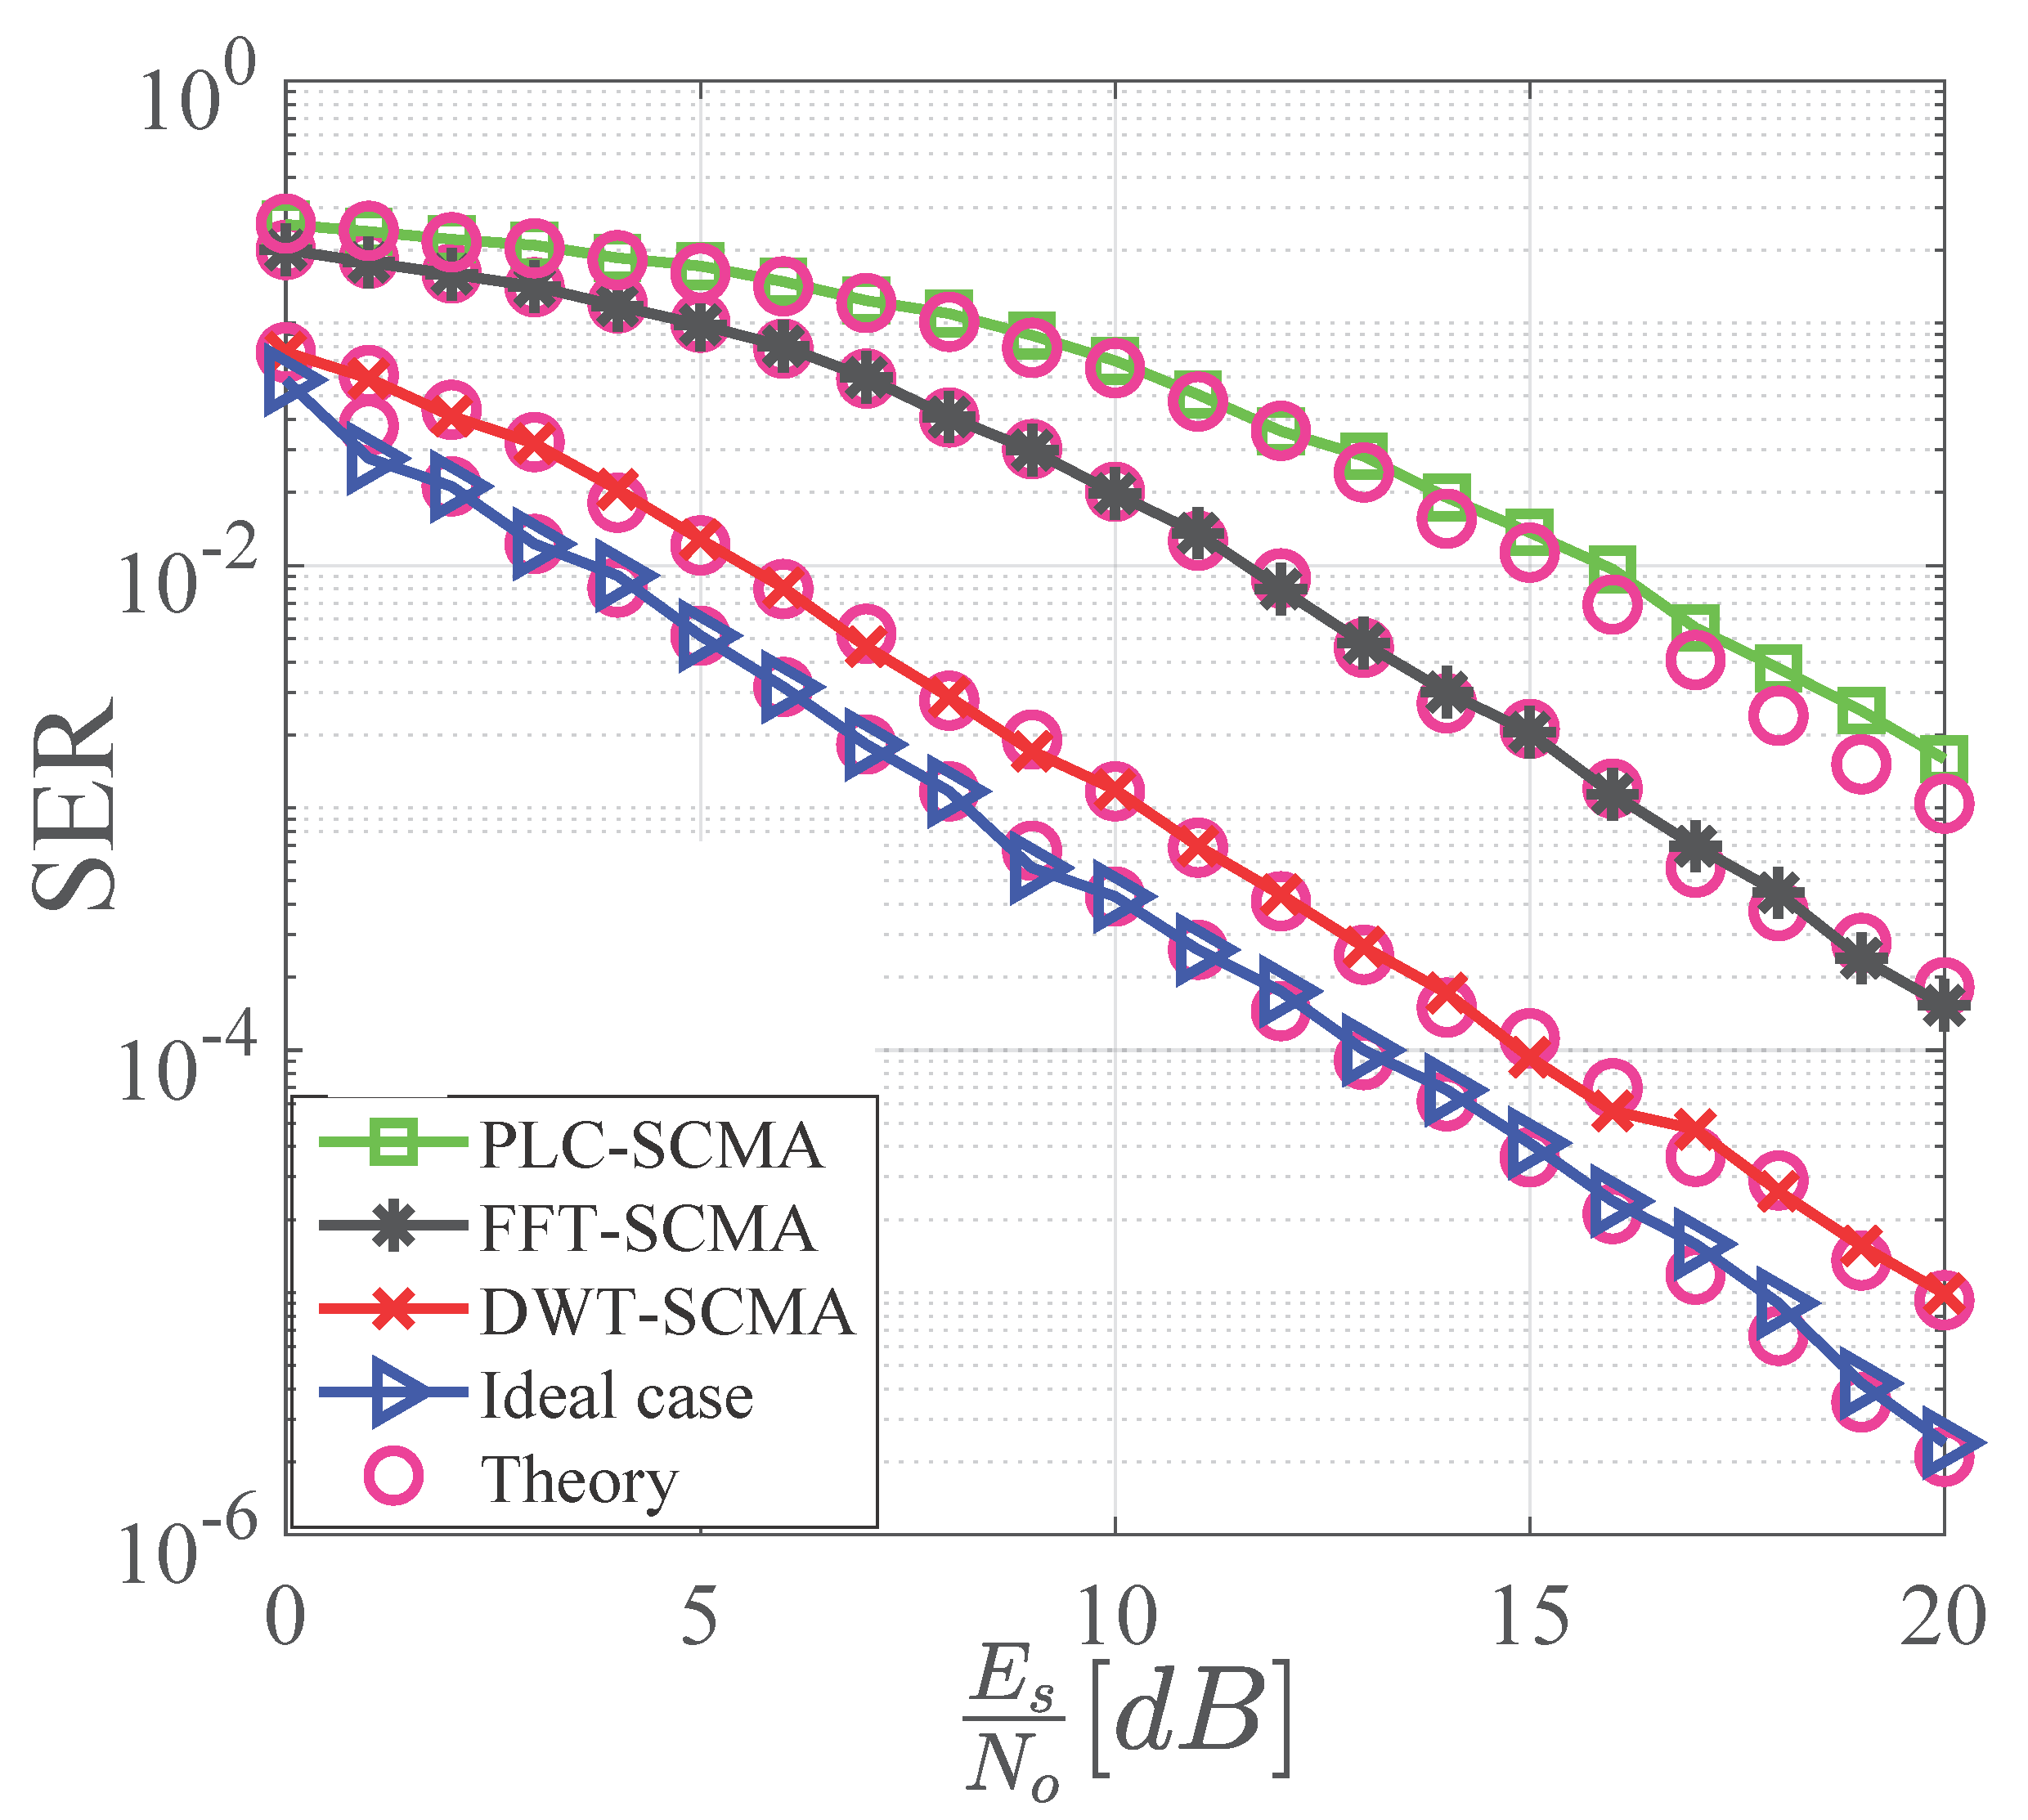
The authors have computed numerical results of FFT-SCMA and DWT-SCMA by taking the PLC channel into consideration. SINR, throughput, PAPR, and Symbol-Error-Rate (SER) are used to evaluate performance in the PLC channel, revealing that DWT-SCMA outperforms FFT-SCMA.
1.2. Organization
Section 2 describes the system model. It explains the conventional PLC channel, the mathematical model for PLC-SCMA, the IUI problem, FFT-SCMA, and DWT-SCMA for PLC in
Section 2.1,
Section 2.2,
Section 2.4,
Section 2.5, and
Section 2.6, respectively. In
Section 2.7,
Section 2.8,
Section 2.9, the mathematical expressions of capacity, SER, and PAPR are described, respectively.
Section 3 discusses the results of SINR, capacity, PAPR, and SER for FFT-SCMA and DWT-SCMA applications in a PLC environment with and without pulse-shaping mechanisms. The article is concluded in
Section 4.
2. System Model Description
2.1. Channel Response of PLC
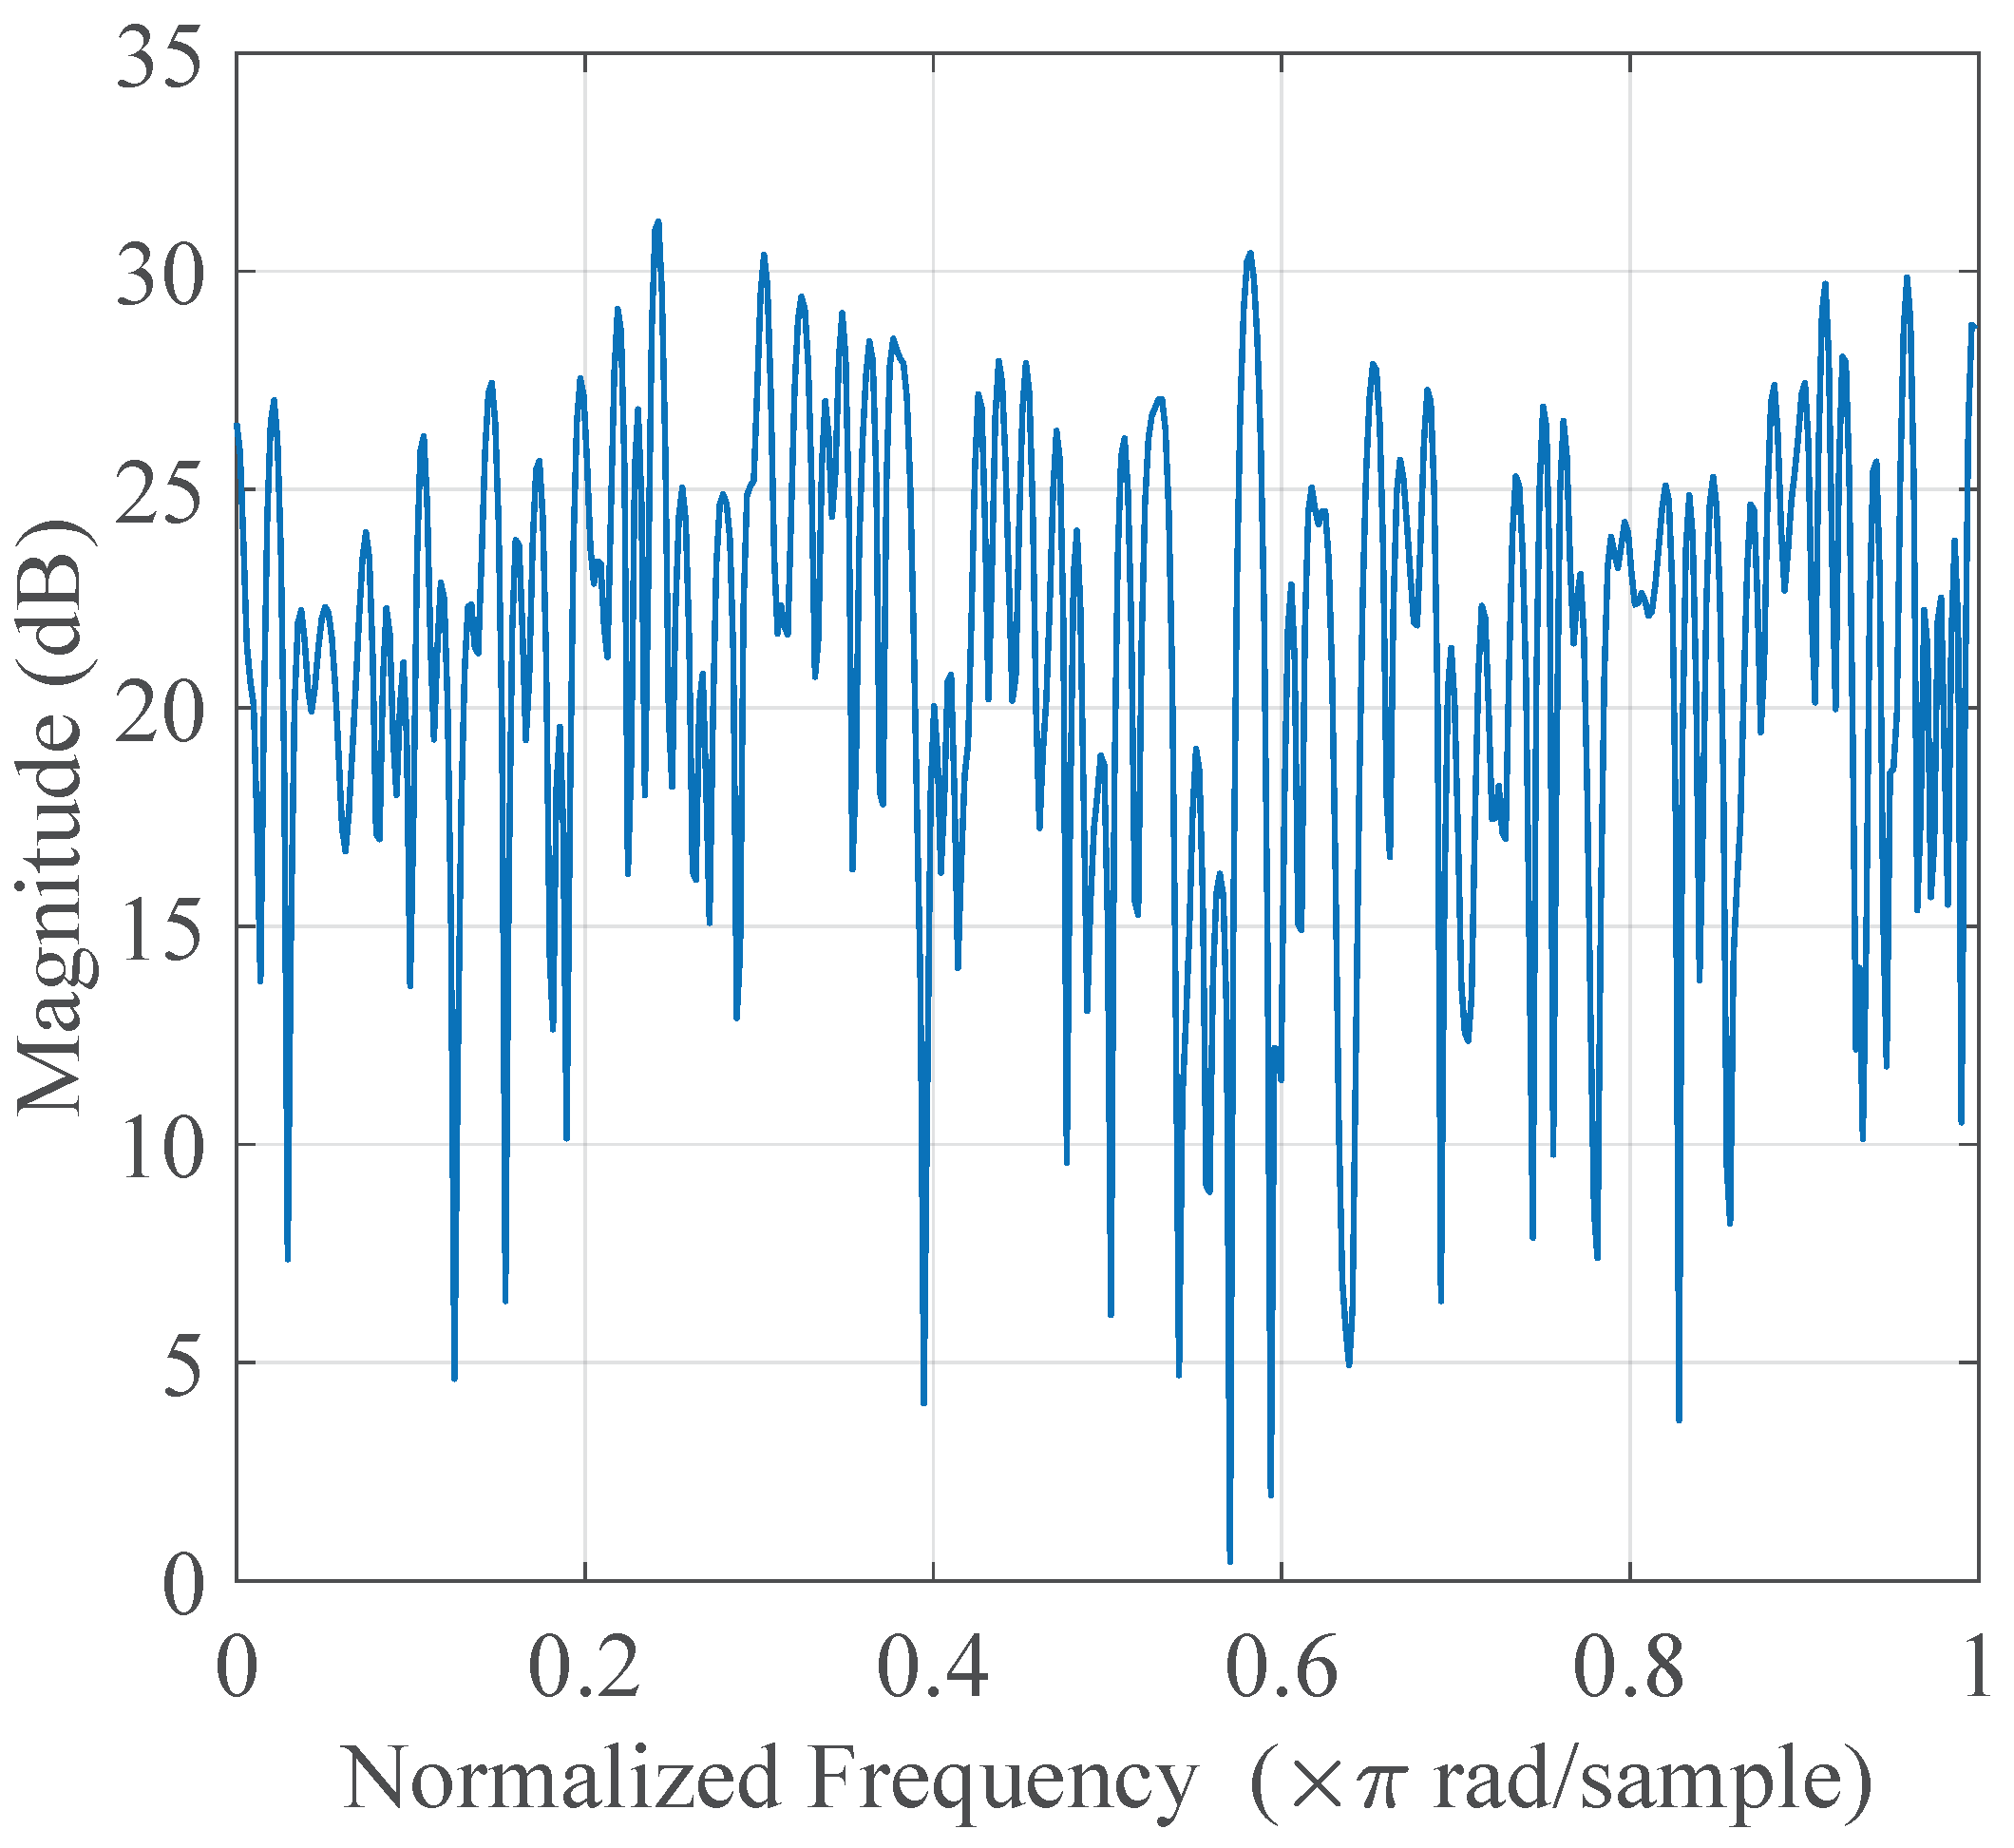
Power cables employed for communication are originally connected to various load impedances, which can give rise to impedance mismatch at different branches, resulting in reflected versions of the transmitted signal. Impulsive noise, synchronous and asynchronous noise, narrowband noise, and attenuation are significant characteristics of the power line channel. Mathematical and simulation models presented in various research works for PLC demonstrate that a power line channel has narrowband fading, as depicted in
Figure 1 [
20,
34]. The PLC channel frequency response appears selectively faded with narrowband notches over the entire frequency range. The complex transfer function of the PLC channel, which specifies the universally applicable and practical form, is expressed as [
35],
where the first and second exponentials signify the attenuation and echo scenarios, respectively. The model is defined by the superposition of signals from
D different paths, each with a
weighting factor,
length, and
v propagation speed. Frequency-dependent attenuation is modeled using parameters derived from the magnitude of the frequency response, such as attenuation offset
, attenuation increase
, and exponent of attenuation
z.
In PLC-SCMA, FFT-OFDM signals employ Sine and Cosine basis functions to split a wide channel into multiple subchannels, for which the PLC channel’s narrowband fading seems to be flat fading. DWT-OFDM signaling for PLC-SCMA is comparatively better than FFT-OFDM signal because it utilizes basis functions such as Shannon or Symlet, which are less prone to sidelobe attenuation and help to minimize noise and interference.
2.2. SCMA System Model for PLC
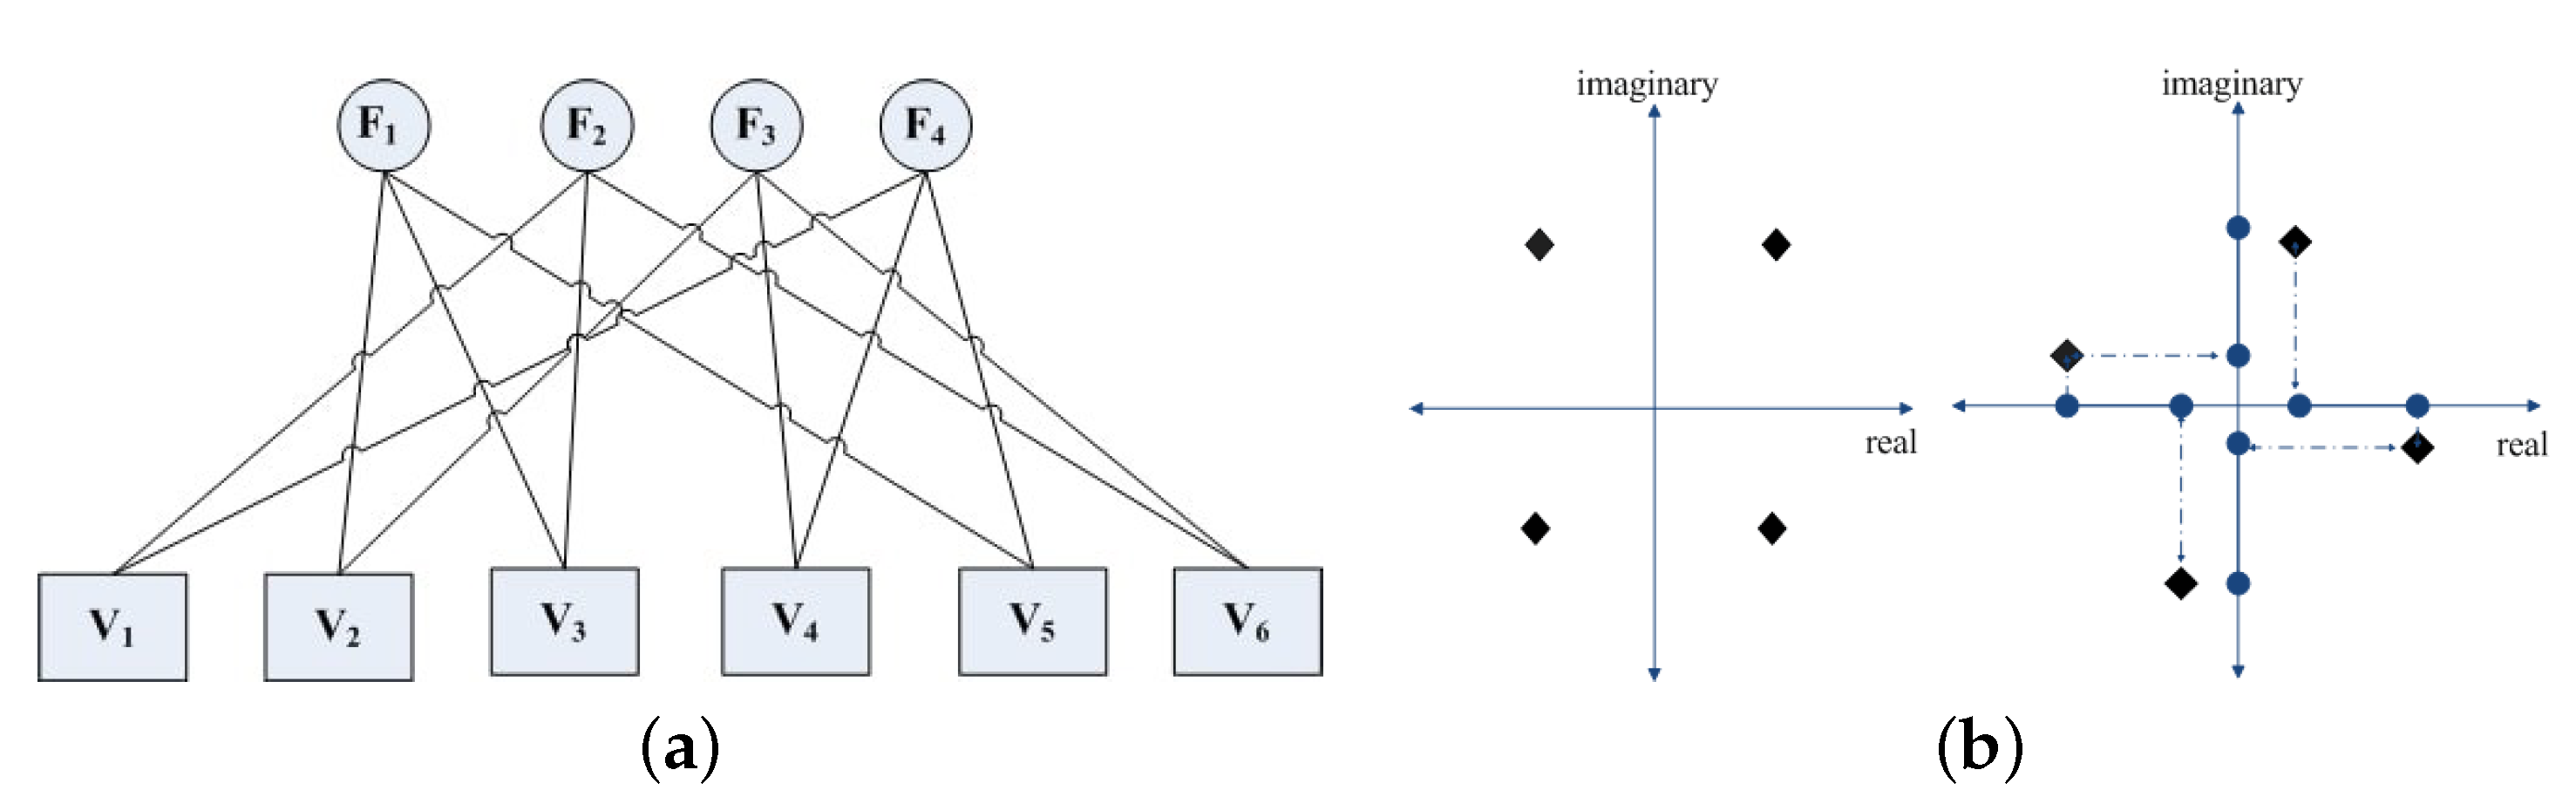
SCMA utilizes sparse resource (frequency) allocation and nonorthogonal three-dimensional codebooks to increase spectrum efficiency. The encoded data is mapped on available frequency resources in a sparse manner to support overload conditions.
Figure 2a presents a factor graph that elaborates the user mapping on resources. Assume that
K represents the number of users and
N denotes the number of subchannels or resources. The overloading factor is given as
, with
. In the factor graph, each user node is referred to as a “Variable Node (VN)”, whereas a resource is known as a “Function Node (FN)”. The following matrix
represents an example of a sparse mapping between FN and VN for
users and
resources.
Each row of the matrix
contains three nonzero elements representing multiple users; the data on a resource correspond to the row number. In this matrix,
and
, which denote the VN degree and FN degree, respectively.
represents the number of subchannels employed by one user. On the other hand, the function node degree
indicates the number of users that a resource can accommodate. The ones of the
matrix will be replaced by channel coefficients in the case of Independent Identically Distributed (IID) Additive White Gaussian Noise (AWGN). Now, the channel matrix
that corresponds to the factor graph can be written as follows:
The channel matrix
for six users and four frequency resources is made up of twelve distinct links that represent an IID AWGN scenario. The channel coefficients
for PLC system are characterized by signal attenuation, delay, and phase shift, as discussed in
Section 2.1. Each channel coefficient in the matrix
corresponds to a link between
nth resource and
kth user such as
, which is expressed as follows:
The rotated constellation diagram is used to generate nonorthogonal complex codes, which are then multiplied by user data. The following equation can be used to represent the SCMA codebook design [
13],
where
M is the order of modulation for each user,
represents the matrix function related to the variables in (
5), and
gives the performance measure in the codebook design. Here,
denotes a code-word matrix that consists of complex numbers obtained from the rotation of the constellation diagram (i.e., QPSK or QAM), as shown in
Figure 2b.
can be written based on the following equation:
where
is an element of the matrix
, whereas
A and
represent the amplitude and the rotation angle for a code-word, respectively. For the fourth-order modulation, the amplitudes of 00, 01, 10, and 11 are set to
V,
V,
V, and
V, respectively. Here,
takes the following form (referring to (
6)):
On the basis of
, six different complex sparse codebooks can be designed as given in [
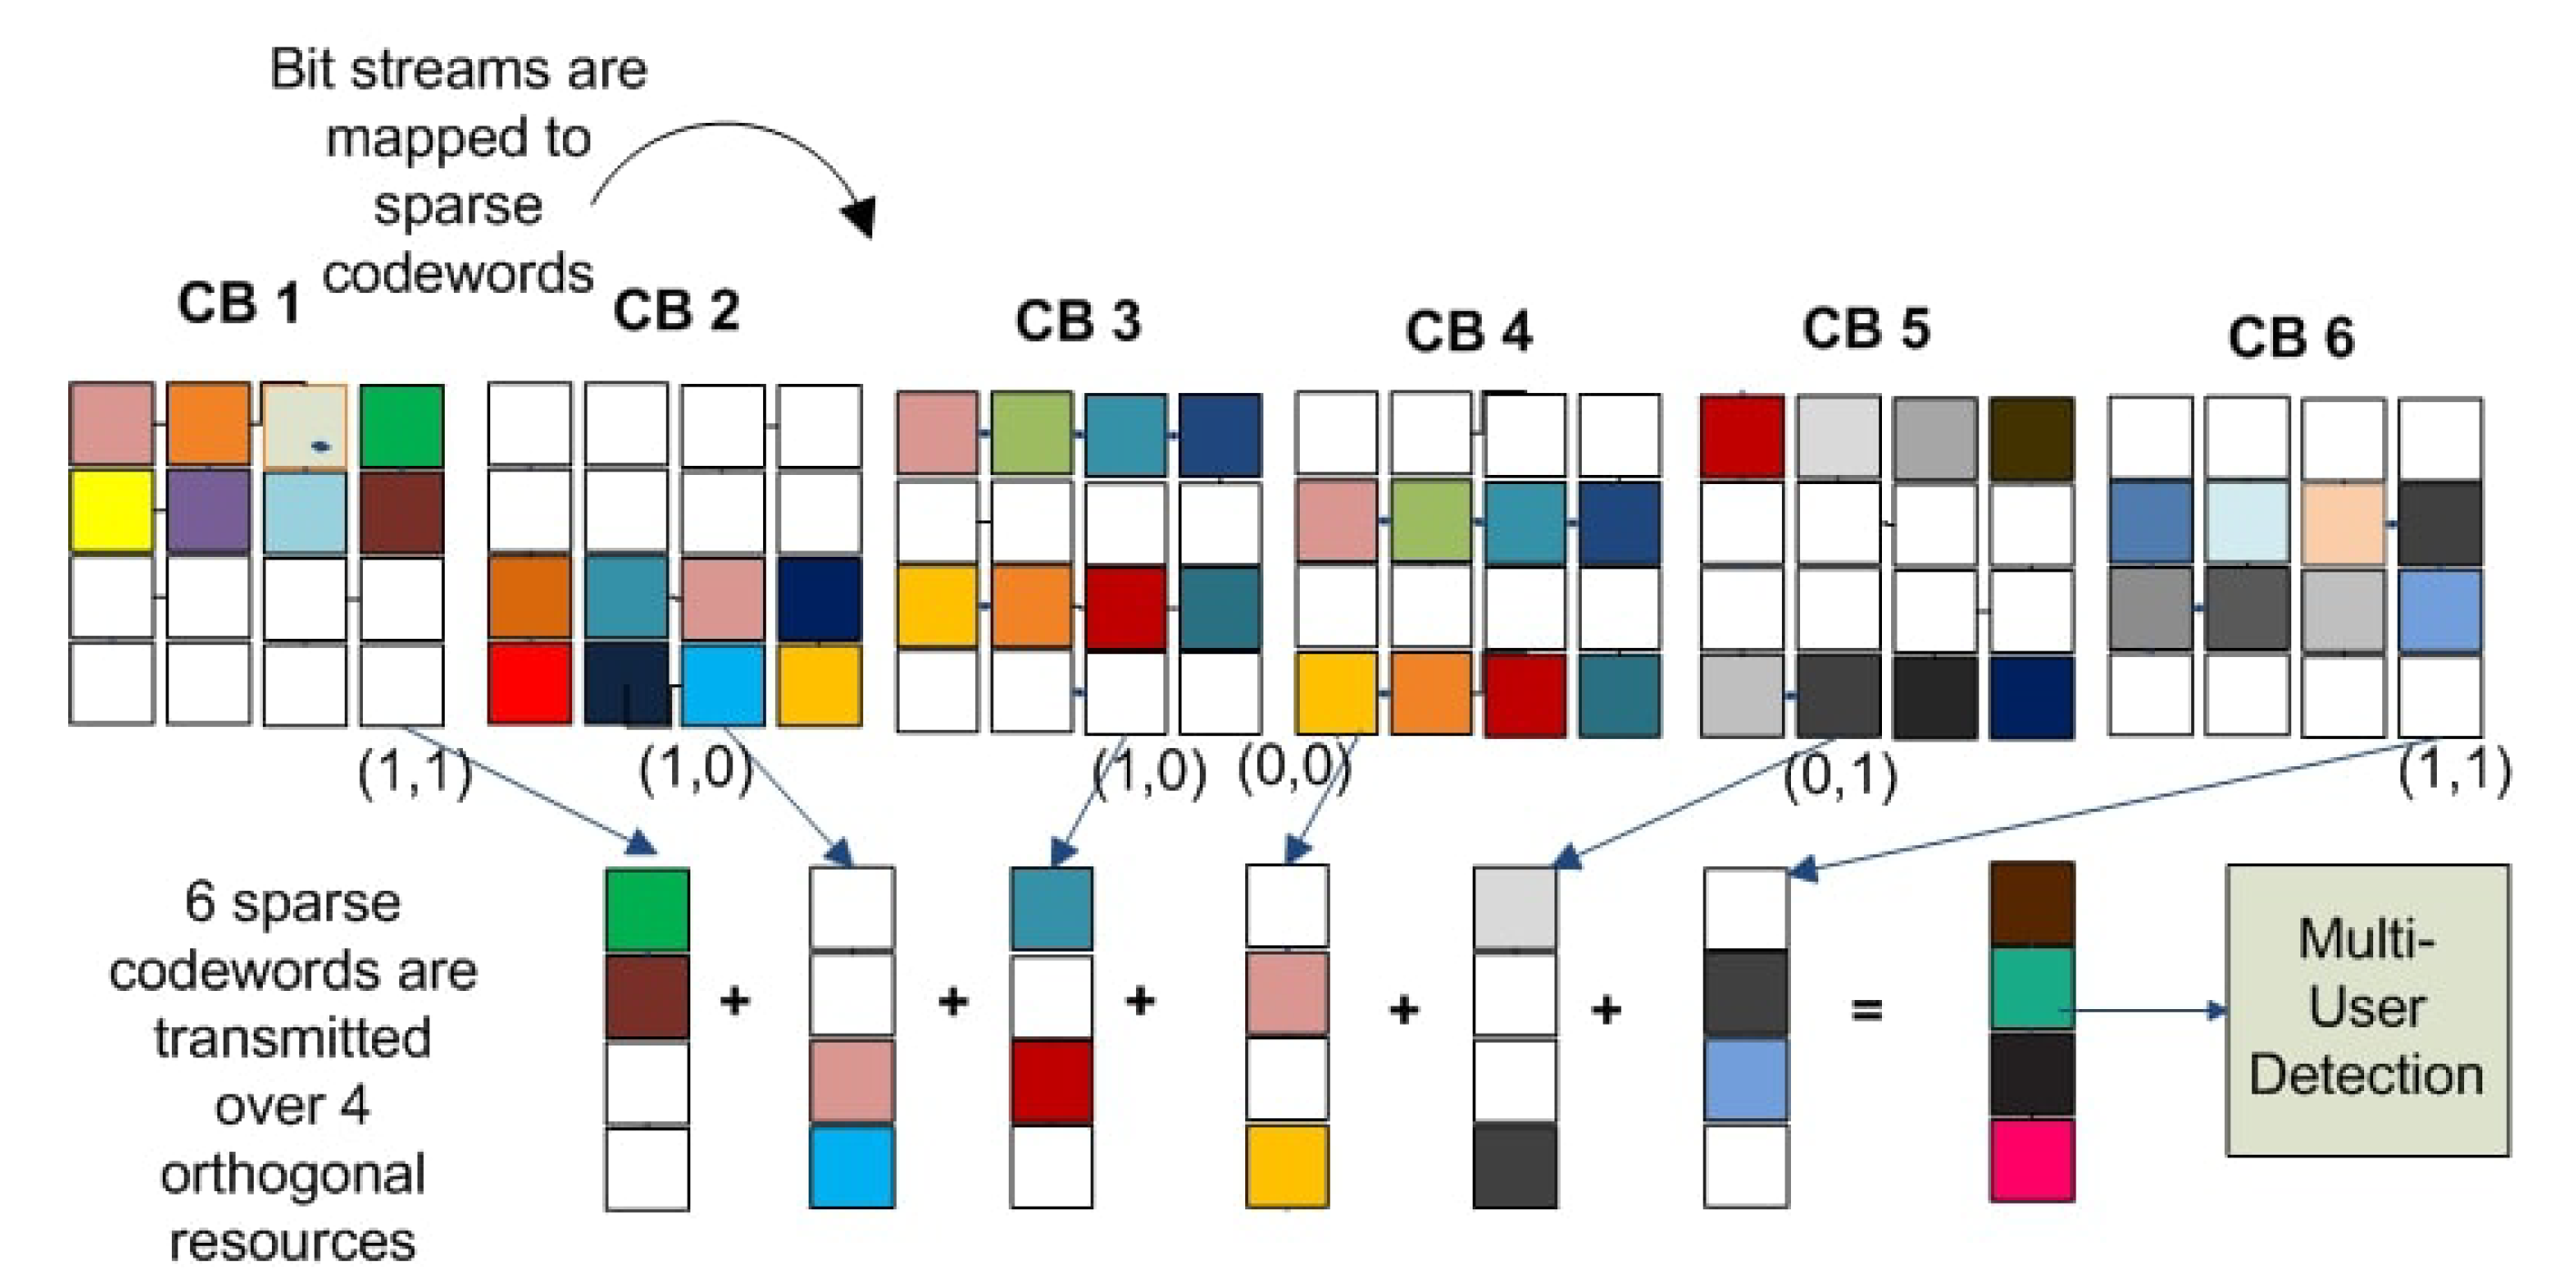
36]. A graphical representation of a PLC-SCMA encoder and user codebooks is depicted in
Figure 3. Here, six codebooks are illustrated with two nonzero entries in each column. The length of each column is four, which is equal to the number of available resources. Each codebook is multiplied by the user data based on the number of bits required to send for that user. The decoder receives this encoded data, after it has been superimposed and transmitted through the channel, as presented in
Figure 3.
The PLC-SCMA encoded signal is represented by
, where
and
denote the codebook and the information bits, respectively. The received signal
is written below,
where
represents the channel matrix in (
4) and
is IID AWGN with zero mean and variance
.
2.3. Decoding for SCMA
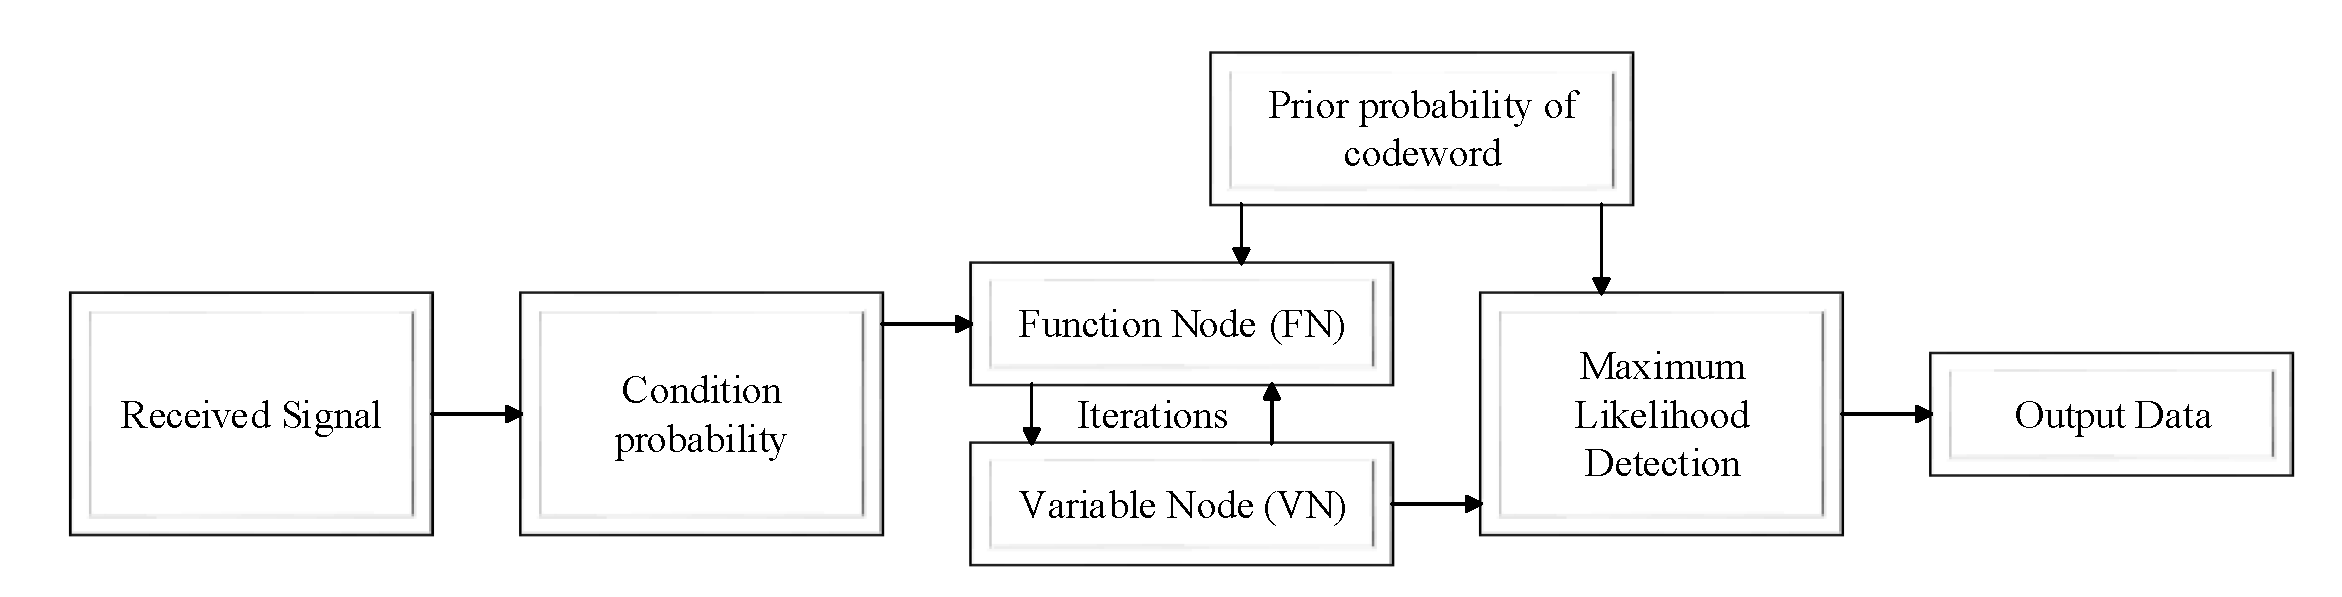
The traditional MPA decoder is used in this study, which is well-known in the literature and can be found in [
37,
38,
39,
40,
41]. Since no novel decoder is suggested in this investigation, the MPA is just given a brief. The flow diagram of the MPA decoder is illustrated in
Figure 4. The MPA assists in extracting data from each user after the factor graph is known and assumes that the receiver possesses Channel-State-Information (CSI). The FN (resources) and VN (users) iteratively pass messages in the form of log probabilities along the edges of the factor graph based on the received signal
. The messages passing from VN to UN are initialized first as
, where
. The messages delivered from FN to VN are written as [
38]
where
is defined below [
38]
The channel and encoded symbol between the kth user and the nth resource are represented by and , respectively. denotes the noise variance and is the received signal at nth resource. Furthermore, VNs are updated as and the decision is made as .
2.4. Interuser Interference in PLC-SCMA
The IUI of the PLC-SCMA system model is presented in this section. A scenario with
,
,
, and
is considered as an example.
signifies the symbol for
kth user over
nth resource, which can be specified with the aid of (
2); the encoded vector
is written as follows:
For the abovementioned scenario,
in (
8) can be expanded as follows:
This case is termed an overloaded scenario, where
and the interference observed by the single user are computed here. In the given case, each frequency resource allows three users to map their data at a time; so, every resource has one desired user with two interferers. For instance, user-to-resource mapping is depicted in
Figure 2a with the factor graph representation, where data from user node
are mapped on
along with the data of
and
. Similarly,
also receives data of
in addition to
and
. Maximal-Ratio-Combining (MRC) is applied on the received signal
in (
12) to combine the signal of the
kth user (for example, User 1, in this case) for the analysis of the effect of IUI over a single user, as expressed here,
where
in (
13) represents the received signal strength for a user, from which received SINR is defined as follows:
where
is related to the desired signal,
H shows IUI, and
indicates noise variance. These are given in Equations (
15), (
16), and (
17), respectively.
Here, and are related to , which shows IID AWGN of the link between nth resource and kth user.
With an appropriate pulse-shaping approach, PLC-SCMA combined with OFDM can add to the system’s spectrum efficiency and resilience to noise and interference. Moreover, selective fading of PLC will appear as flat fading due to OFDM signaling.
2.5. FFT-SCMA System Model for PLC
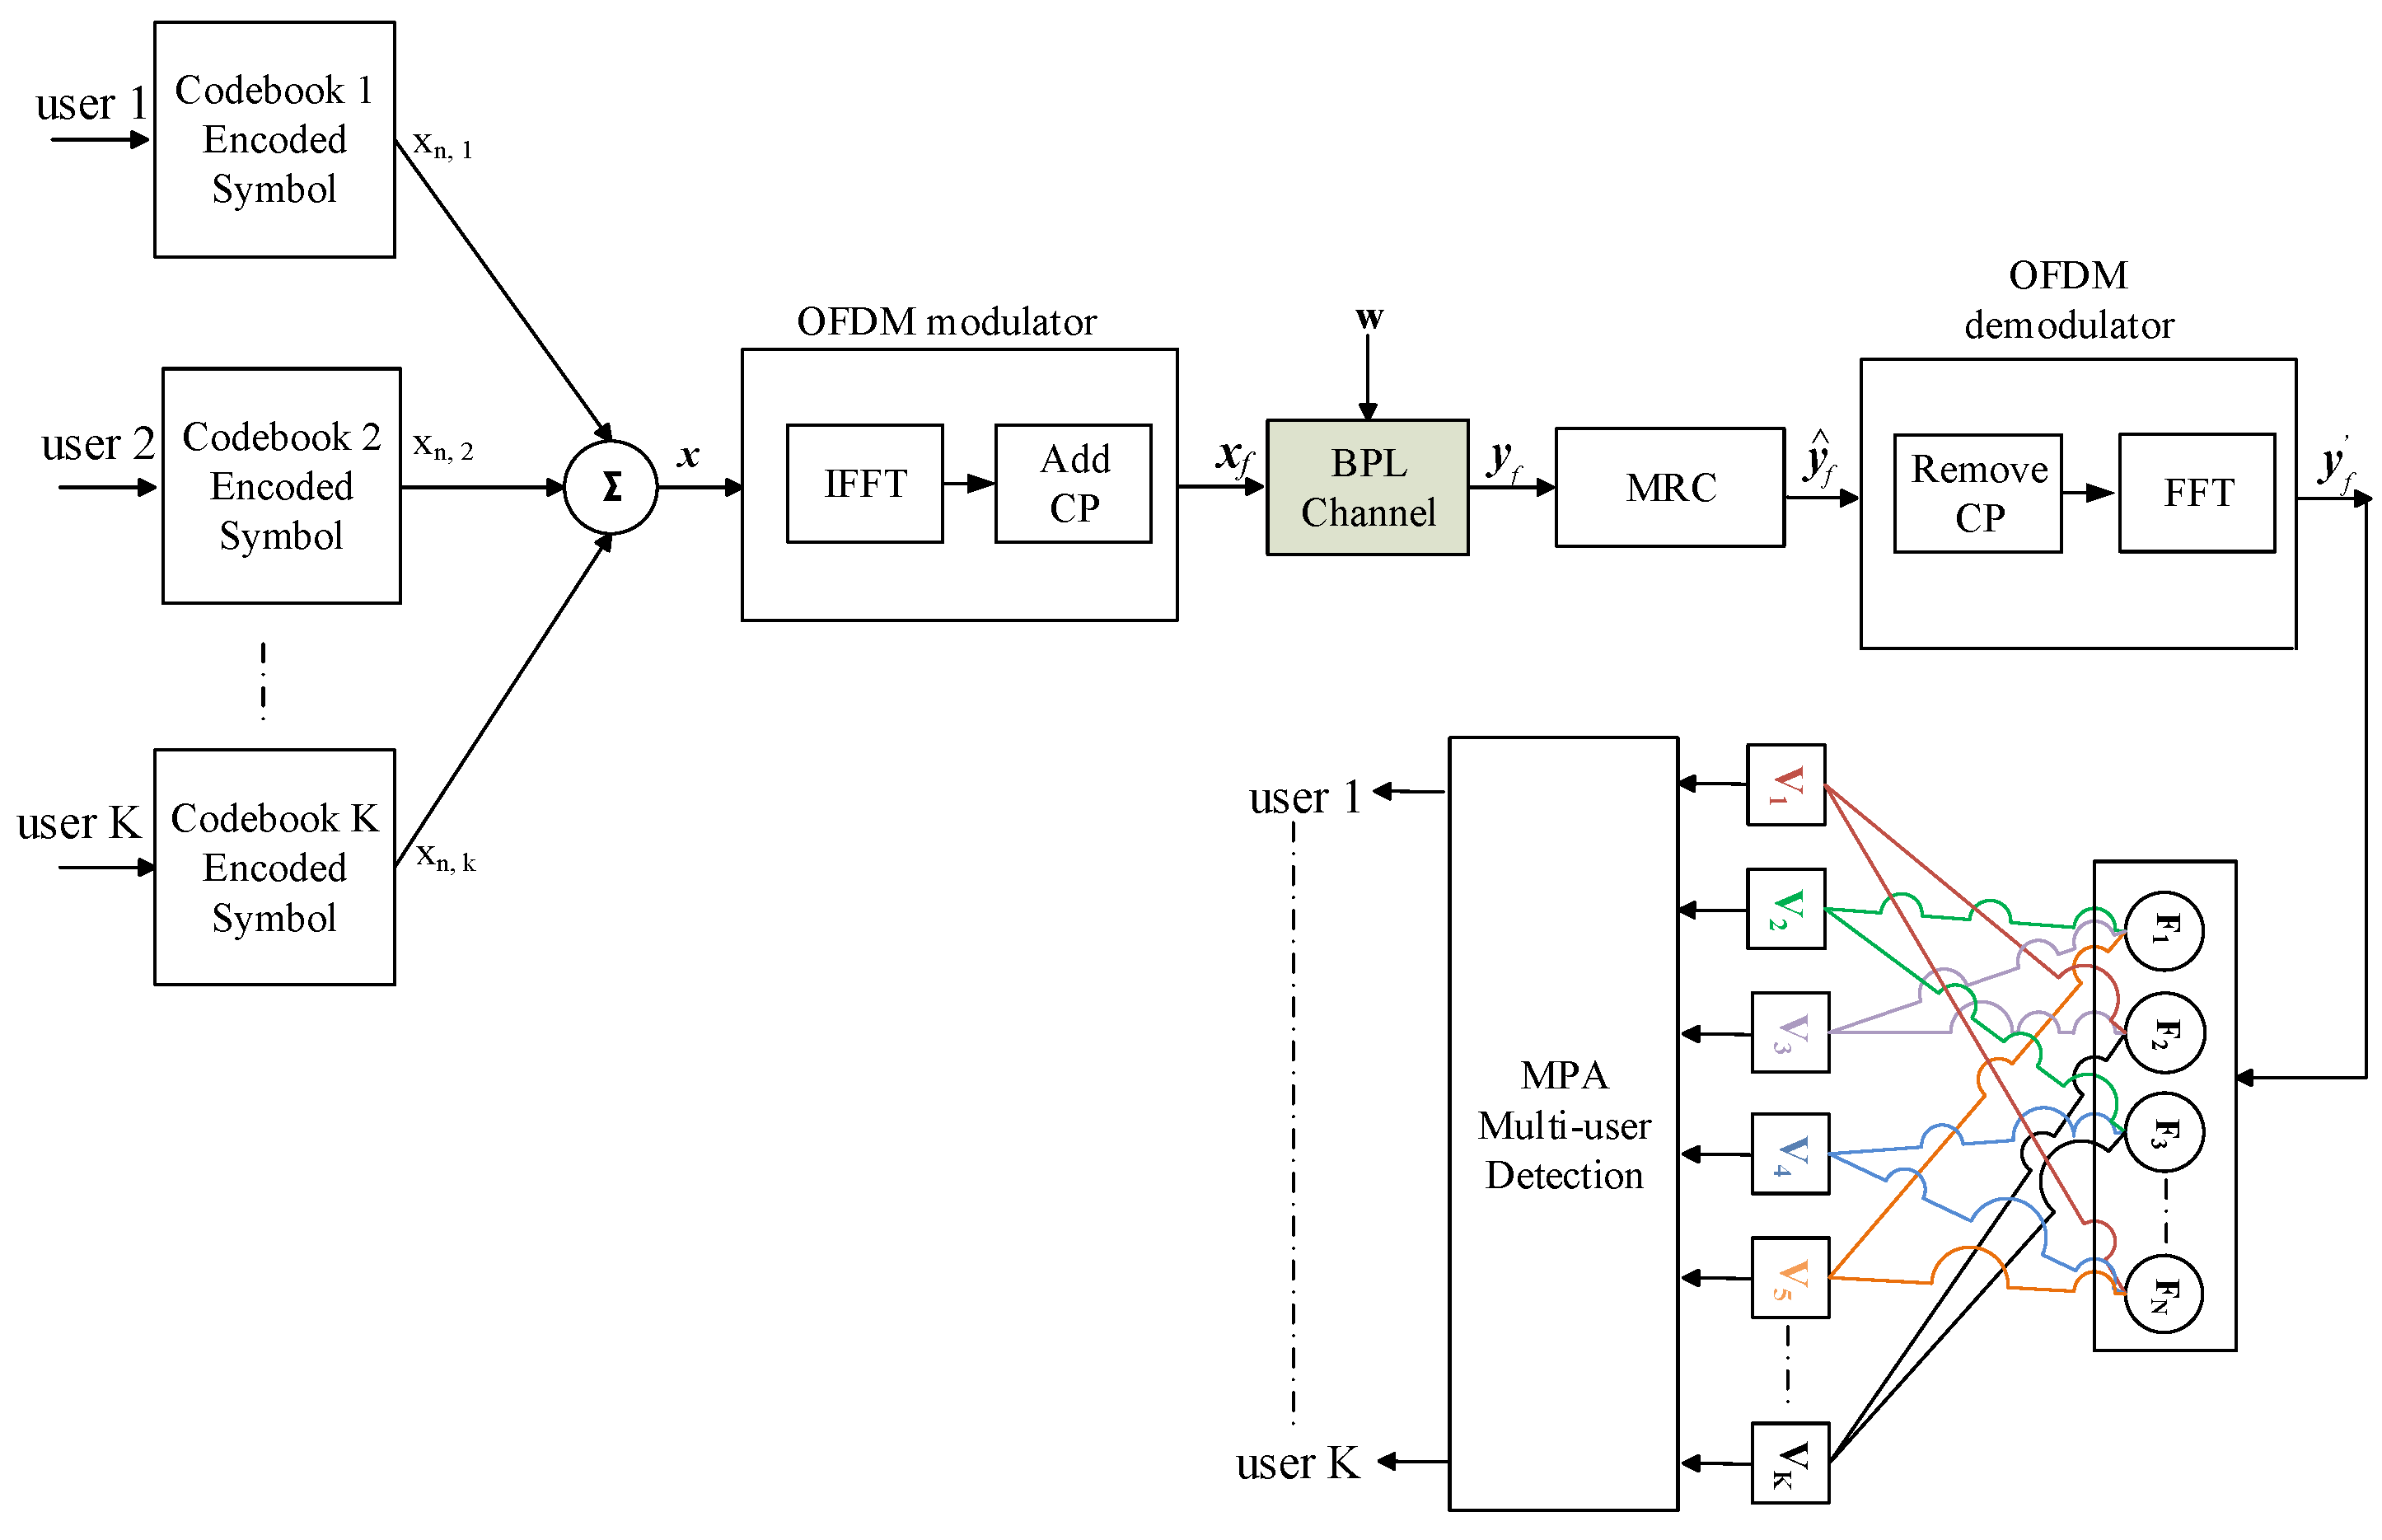
The block representation of FFT-SCMA is illustrated in
Figure 5. The incoming bits
from
K different users are first encoded by using individual codebooks. These encoded symbols
are superimposed and then passed through the OFDM modulator to prepare the signal for multicarrier transmission. An Inverse Fast Fourier Transform (IFFT) operation is applied to the encoded signal to attain time-domain samples before transmission and is expressed as follows:
where
denotes the
ith time-domain sample of
and
M indicates the number of subcarriers. The signal received through the PLC channel is denoted as
. It is expressed as
where
is referred to (
4) and
denotes the IID AWGN noise of each link between the resource and the user, each link being independent of the others as specified in (
12).
The received signal is combined through MRC for each user as described in (
13). Therefore,
is defined as the IFFT filtered version of (
13). Then, FFT is applied after the removal of CP to obtain the following signal
,
The received SINR of the FFT-SCMA system is deduced as follows:
where
denotes the desired signal,
shows IUI, and
indicates the link noise variance. Furthermore,
H,
, and
are defined in (
15), (
16), and (
17), respectively, for a simple scenario of six users.
2.6. DWT-SCMA System Model for PLC
FFT is suitable specifically for signals whose frequency content does not change with time. DWT has the ability to zoom the time-domain signal in both the frequency and time windows. As a result, it provides better visualization of a signal, which helps in analyzing and reducing the noise content in a signal. The high-frequency components are removed during multiresolution analysis, resulting in less interference and noise in the incoming signal. It improves the received SINR of the proposed system. Moreover, the pulse shape of DWT offers spectral efficiency by eliminating the need for CP and minimum data loss in signal reconstruction as compared with FFT. DWT can characterize a signal accurately. It is utilized efficiently in digital communications for channel modeling, with OFDM modulation, and interference mitigation.
The following equation provides the Continuous Wavelet Transform (CWT)
where
and
s are the translation and scaling parameters, respectively.
is the signal to be examined,
is the mother wavelet or the basis function such as Haar, Daubechies, Symlets, and Coiflets.
The DWT, on the other hand, is simply a sampled version of the CWT. In CWT, the signals are analyzed using a set of basis functions that are related to one another via simple scaling and translation. In the instance of DWT, digital filtering techniques are used to obtain a time-domain representation of the digital signal. The DWT of the discrete type signal
of length
R can be computed using a recursive cascade structure consisting of down-samplers ↓ 2, low-pass (
G) filters, and high-pass (
H) filters that are uniquely associated with a wavelet. The signal is decomposed iteratively through a filter bank to attain its DWT. This results in a novel interpretation of the wavelet decomposition by splitting the signal into frequency bands. At each level, the signal is decomposed into approximated
and detailed
versions of the wavelet function
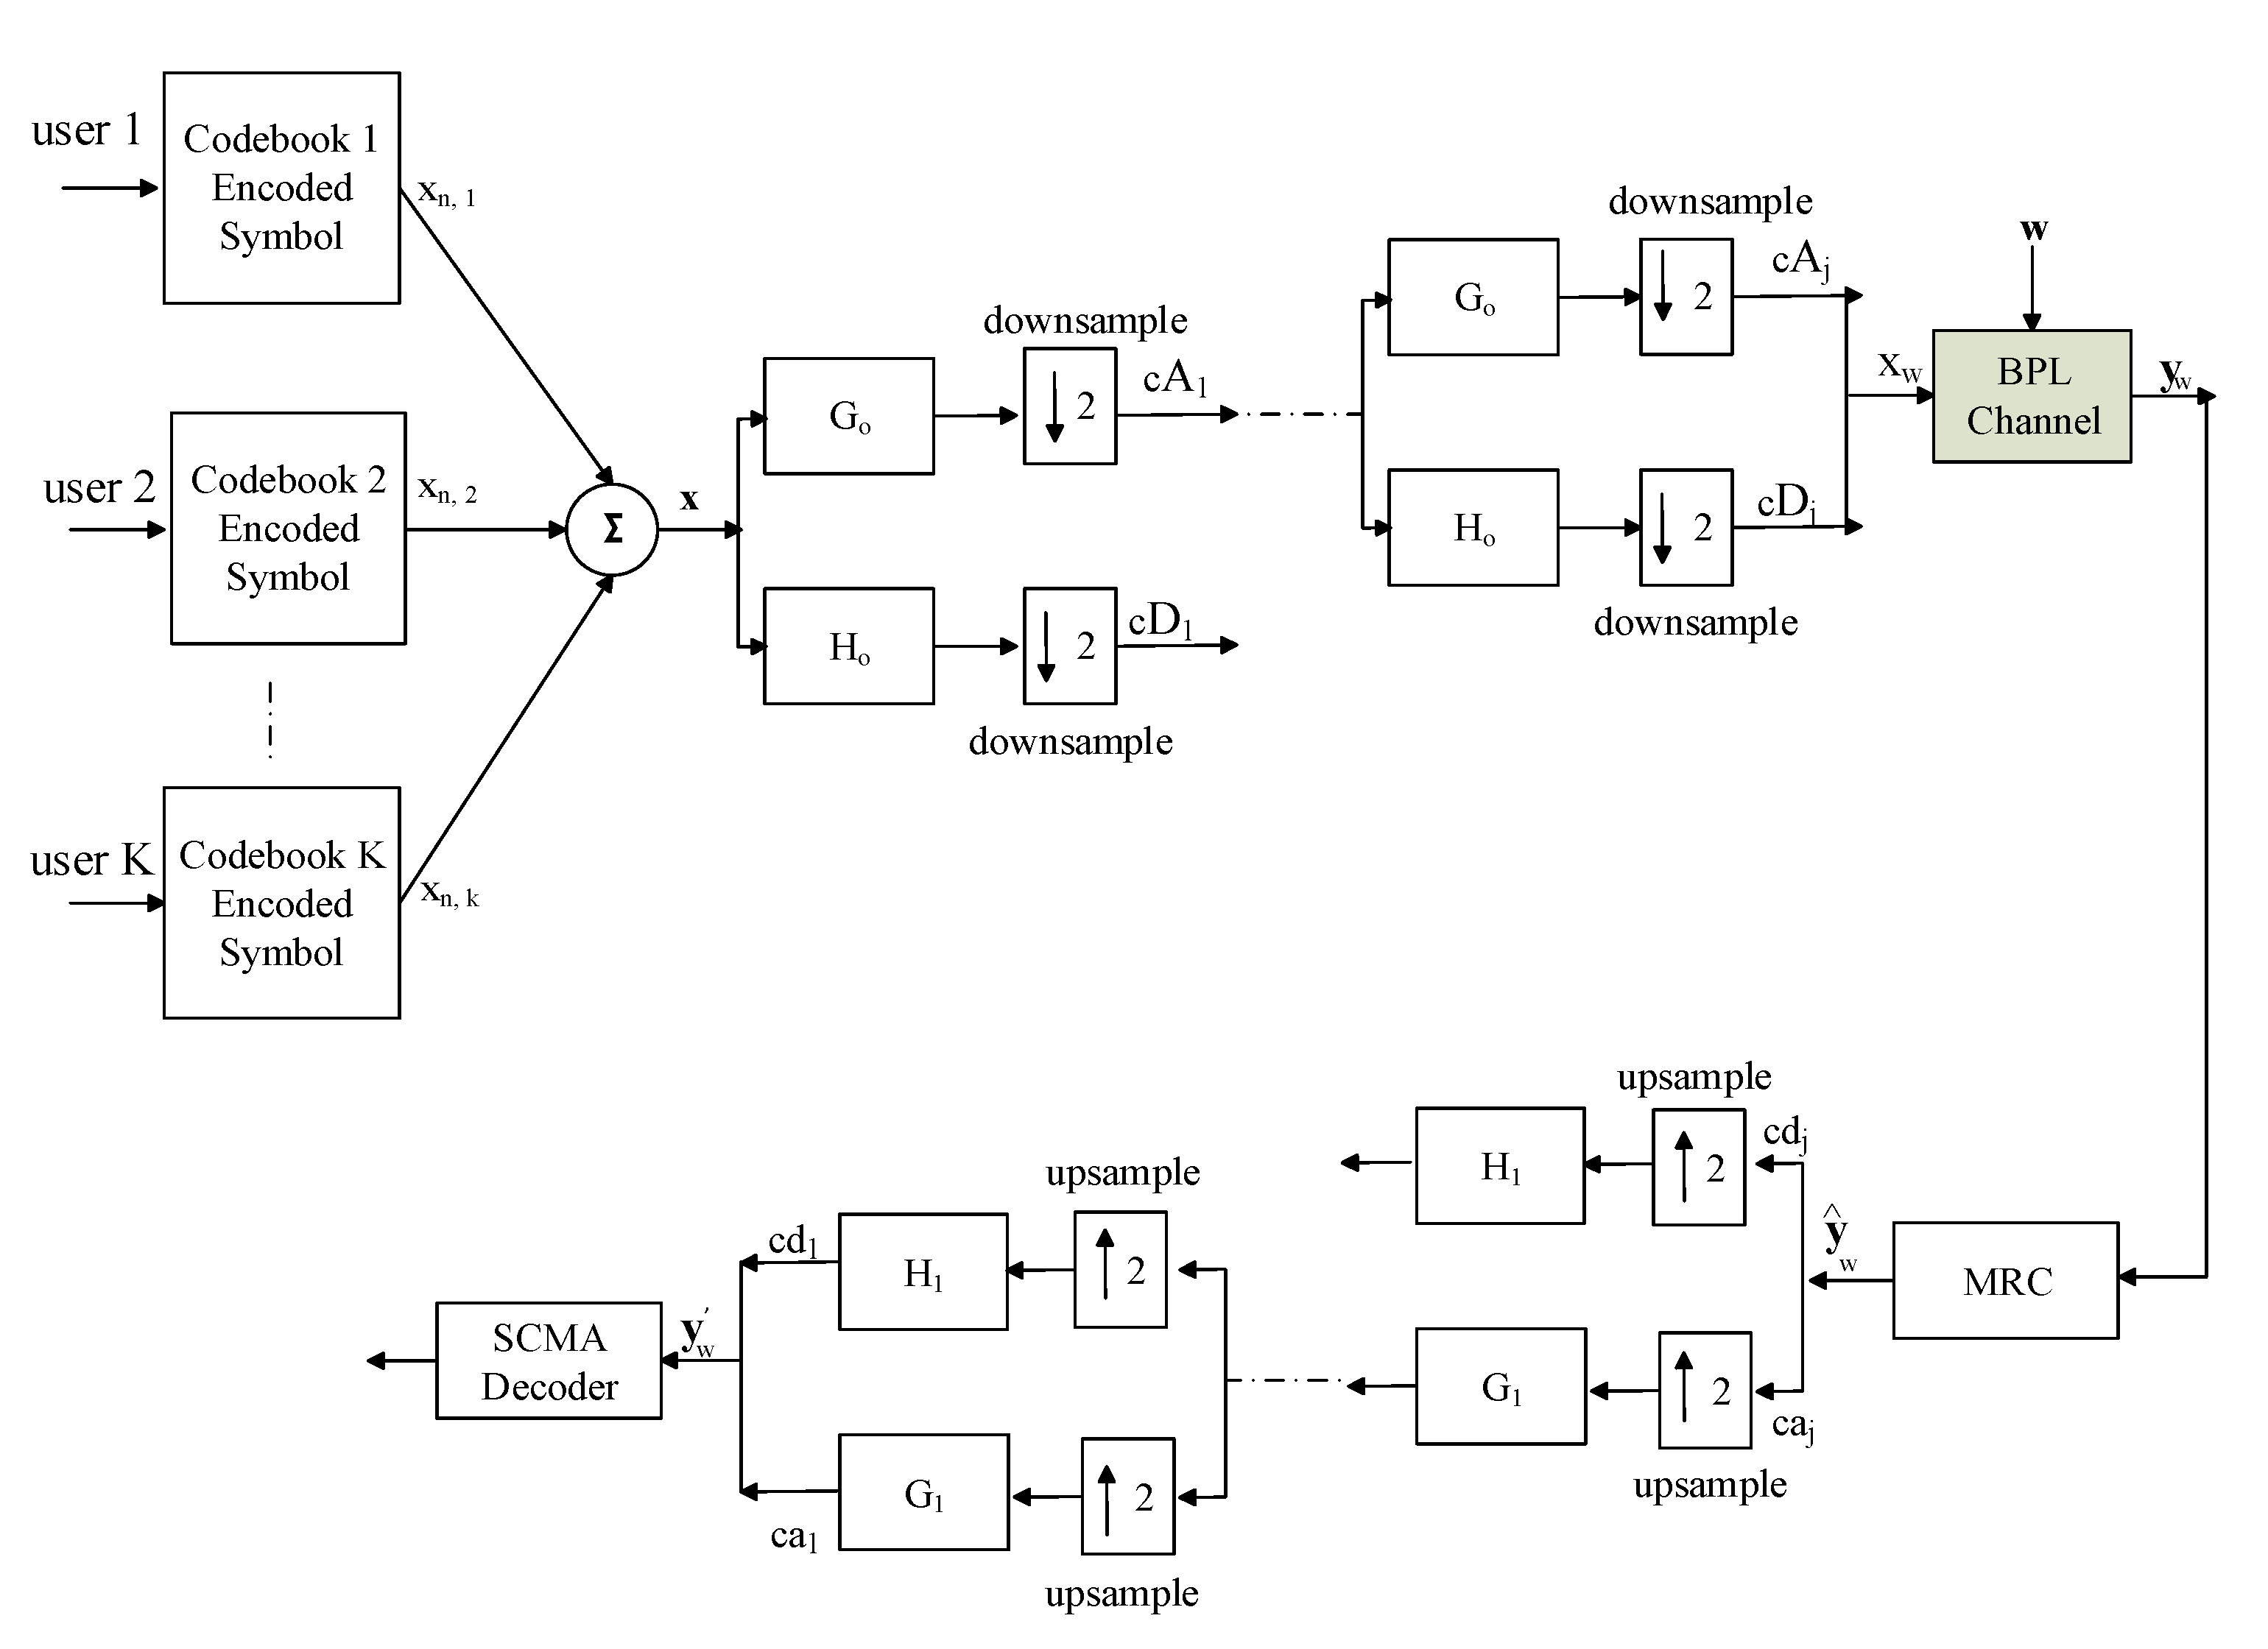
through low-pass and high-pass filters, respectively. The output of the low-pass filter is used as the input to a new pair of filters in hierarchical decomposition. DWT is applied in the proposed system, which is depicted in
Figure 6 (factor graph and decoder is the same as shown in
Figure 5). The coefficients of the filters that correspond to scaling and wavelet functions are related by
, where
L symbolizes the filter length. The filter length and values of approximated and detailed coefficients change amongst wavelet families. The
rth sample of the SCMA-encoded signal is decomposed as follows:
The signal before transmission is a combination of each
jth branch’s low-pass filter output and a summed-up version of all
j branches’ high-pass filters, as shown below.
where
is obtained after taking the Inverse Discrete Wavelet Transform (IDWT) of the encoded SCMA signal and then it passes through the PLC channel, the received signal can be written as follows:
where
M denotes the number of the subcarriers and
is referred to (
4).
is specified in (
12) as IID AWGN. The received signal is combined through MRC, which is described as
, where
is mentioned in (
13). The signal is then analyzed through DWT and written below after passing through multilevel filters,
is the variance of IID AWGN for the proposed scheme. The received SINR of
kth user is expressed as
where
shows interference and
denotes the desired signal gain. Moreover,
H and
are provided in (
15) and (
16) for a particular example, respectively.
2.7. Capacity
The maximum number of bits that may be sent without errors is known as the capacity. Therefore, capacity for PLC-SCMA is calculated as the maximization of mutual information over the Probability-Density-Function (PDF)
of all possible transmitted vectors,
where mutual information is further defined in terms of differential entropy
. It is assumed that CSI is known at the receiver; therefore,
will reduce to
due to
. Furthermore, the zero-mean complex Gaussian distribution
is the one that maximizes the entropy. The following form for (
29) is obtained by solving the respective differential entropy,
where the variance of
is provided as
,
and
P refers to variance of IID AWGN and signal power, respectively. After simplification, the final form of capacity for
kth user is expressed as follows:
where
M represents the number of subcarriers and
is derived for FFT-SCMA and DWT-SCMA in
Section 2.5 and
Section 2.6, respectively. Moreover,
denotes the length of the CP in the FFT-SCMA system, which is omitted in DWT-SCMA and becomes zero.
2.8. Theoretical Symbol-Error-Rate
Theoretical values of SER can be computed by taking the Q-function of SINR expressions in Equations (
14), (
21), and (
28), respectively. The SERs for SCMA, FFT-SCMA, and DWT SCMA are given as
,
and
, respectively.
2.9. Peak-to-Average-Power Ratio
This section discusses the PAPR of wavelet filter banks in DWT-SCMA. The multicarrier systems based on FFT-OFDM contend with a high PAPR because of the characteristics of IFFT/FFT operations. This signal is a combination of narrowband signals of various tones. When these
M subcarriers are combined constructively, the instantaneous power of these peaks exceeds the average signal power. As a result, the peak power of the FFT-OFDM signal is
M times higher than the average power. The high PAPR degrades the performance of power amplifiers, resulting in intermodulation distortion and energy inefficiency [
42].
The PAPR of a reconstructed signal using IDWT is defined as follows:
where max
represents the highest value of time index
n among all the indices and
indicates the ensemble average calculated over a single symbol’s duration. The Cumulative-Distribution-Function (CDF) is given as
As the PAPR of an MC system is determined by the pulse shape, it can be lowered by selecting a suitable pulse shape as
. Here,
symbolizes the scaling function. To characterize the statistical properties of PAPR, a Complementary CDF (CCDF) is commonly defined as
. For an IDWT frame, CCDF is provided as follows for a constant value
,


 ,
, 


