Article

Time-Dependent Prediction of Microblog Propagation Trends Based on Group Features

1
Department of Computer, Shanghai Normal University, Shanghai 201418, China
2
Key Innovation Group of Digital Humanities Resource and Research, Shanghai Municipal Education Commission, Shanghai 200234, China
3
Key Laboratory of Embedded Systems and Service Computing of Ministry of Education, Tongji University, Shanghai 201804, China
*
Author to whom correspondence should be addressed.
Electronics 2022, 11(16), 2585; https://doi.org/10.3390/electronics11162585
Submission received: 28 July 2022 / Revised: 13 August 2022 / Accepted: 16 August 2022 / Published: 18 August 2022
(This article belongs to the Special Issue Security and Privacy for Modern Wireless Communication Systems)

Abstract

:
The conventional machine learning-based method for the prediction of microblogs’ reposting number mainly focuses on the extraction and representation of static features of the source microblogs such as user attributes and content attributes, without taking into account the problem that the microblog propagation network is dynamic. Moreover, it neglects dynamic features such as the change of the spatial and temporal background in the process of microblog propagation, leading to the inaccurate description of microblog features, which reduces the performance of prediction. In this paper, we contribute to the study on microblog propagation trends, and propose a new microblog feature presentation and time-dependent prediction method based on group features, using a reposting number which reflects the scale of microblog reposting to quantitatively describe the spreading effect and trends of the microblog. We extract some dynamic features created in the process of microblog propagation and development, and incorporate them with some traditional static features as group features to make a more accurate presentation of microblog features than a traditional machine learning-based research. Subsequently, based on the group features, we construct a time-dependent model with the LSTM network for further learning its hidden features and temporal features, and eventually carry out the prediction of microblog propagation trends. Experimental results show that our approach has better performance than the state-of-the-art methods.

1. Introduction

With the rapid development of the Internet in China, a Sina microblog has now become an indispensable way for people to obtain and issue information. On the microblog platform, users can express their own opinions with freedom which will be spread and propagated through other users’ browsing and reposting. As the microblogs being continuously reposted by other users, some microblogs will finally lead to their explosive spread and become a hot topic, the priority among people’s discussion, while some others will never. Therefore, in order to make a microblog better serve the public in many fields such as public opinion supervision, advertising, information push, and corporate marketing [1], the prediction of potential hot microblogs becomes a key research object among people, namely the prediction of microblog propagation trends.
The conventional machine learning-based methods for the prediction of a microblog reposting number mainly conduct extraction and representation of the static features of user attributes and content attributes of the source microblogs to construct its machine learning prediction model, but neglect the dynamic features generated in the process of microblog propagation.
In this paper, we contribute to the study on microblog propagation trends, and inspired by our previous works [2,3,4], we propose a new microblog feature description and time-dependent prediction method based on group features. When predicting the scale of reposting, In an innovative way, we extract and take some dynamic features generated in the process of microblog propagation and development into account, together with some traditional static features such as user features and microblog features as group features to solve the problem of inaccurate microblog feature descriptions of a traditional machine-learning based research and also to improve the accuracy of reposting number prediction. We first make a description of microblog group features, which specifically includes features from three aspects, namely, commonly used individual features, reposting comment features, and group influence features, and they are all extracted through their corresponding feature extraction methods. Commonly used individual features are extracted through manually constructed feature engineering. We use feature extraction models based on cluster and Dilated CNN to extract reposting comment features, and PageRank algorithm is used to extract group influence features. Finally, with the extracted microblog group features, we construct a time-dependent prediction model for reposting number and conduct the prediction of microblog propagation trends.
The remainder of the paper is organized as follows: Section 2 briefly introduces the domestic and foreign research progress of microblog propagation trend prediction, and the related technologies mainly involved in this paper. On the basis of traditional static feature representation, Section 3 proposes a microblog feature representation and a time-dependent prediction method for a microblog propagation trend based on group features. In Section 4, we conduct relevant experiments and evaluations on the proposed method with real datasets of Sina microblogs. Finally, in Section 5, we outline our contributions, conclude the paper, and forecast our future work.

2. Related Work

2.1. The Domestic and Foreign Research Progress

The traditional prediction methods for microblog reposting number mainly include three approaches, which are the prediction methods based on topological structure [5], the methods based on machine learning [6], and the methods based on points [7], respectively.
The traditional topological structure-based models originate from the Information Diffusion Theory, which is widely applied, mainly in the fields such as recommendation, and monitoring. For the study on the prediction problem of Sina microblog propagation trends, the most typical models include infectious disease models and information cascade models. These prediction methods fully consider the role of the forwarders in the social network formed by microblog users; however, due to the large number of nodes in the network, the complexity of the methods is higher.
The traditional machine learning-based models mainly use machine learning models to learn the hidden features that affect the microblog reposting number so as to carry out predictions [8]. These methods analyze the relevant factors that affect the microblog reposting number, with which extract the relevant features of the source microblog, and then convert the prediction problem into a classification or regression problem. Through the learning of historical data and extracted features, the machine learning-based models are constructed and trained, and finally make predictions to obtain the corresponding target value.
The point-based prediction methods mainly introduce the idea of time decay. Relevant researchers believe that whether the microblog will be popular is related to time, and the propagation trends of microblog usually change from slow to fast, then from fast to slow, and eventually cease to perish. The basic idea is to regard the event of microblog propagation trends variation as a life cycle event of a microblog, and then predict the probability of the occurrence of a microblog’s stopping reposting and death, and finally obtain the propagation scale through the maximum likelihood method.

2.2. Related Techniques

2.2.1. Key Information Extraction Technology Based on TF-IDF

TF-IDF [9] is a simple but effective key information extraction technology used to evaluate the importance of a term to one of the documents in a document set. TF-IDF actually calculates the product of the value of TF and the value of IDF. TF is term frequency, which means the frequency of the appearance of terms in a document, while IDF is inverse document frequency, which measures how many documents in the document set contain the term, and is a measure of the general importance of the term in the document set. The fundamental principle of TF-IDF is that, if a term appears frequently in a document but not frequently in other documents in the document set, then we can consider that, for this document, compared to other terms in it, this term is more important and has better distinguishing ability. The calculation of TF-IDF seen in Equations (1) and (2) is as follows:
T F = t s
I D F = l o g ( D d + 0.1 )
where t represents the number of times the term appears in the document, and s represents the sum of the number of times all terms appear in the document, while h and d respectively represent the total number of documents in the document set and the number of documents which contain the term in the document set.

2.2.2. Dilated Convolutional Neural Network (DCNN)

DCNN is a special convolutional network. Compared to the conventional CNN, DCNN contains a parameter called dilation rate [10], which is mainly used to indicate the size of the dilation. DCNN have the same convolution kernel size as ordinary CNN, so, during DCNN’s convolution calculation process, no additional convolution kernel parameters are needed. However, due to the existence of dilation rate, DCNN shares a larger range of parameters and a larger receptive field without reducing the resolution or coverage [11].
As is shown in Figure 1, for DCNN with a convolution kernel size of 3 × 3 and dilation rate of 2, the size of its receptive field is the same as the one of ordinary CNN with a convolution kernel size of 5 × 5. However, during DCNN’s calculation process, only nine parameters are used, 36% of the parameter number of ordinary CNN with a convolution kernel size of 5 × 5, which is equivalent to providing a wider receptive field with the same convolution calculation cost.
DCNN has applications in many fields such as image segmentation, speech synthesis, structural condition inspection, and target detection [12,13,14,15]. Due to the fact that high-level convolutional feature maps of the convolution network have larger receptive field and more abstract features, while low-level ones have a smaller receptive field and more detailed features, the usage of the combination of multi-scale feature maps in tasks can contain more information. Therefore, DCNN used in the paper contains multiple sizes of dilated convolutions [16].

2.2.3. Neural Network RNN and LSTM

In the application of machine learning, some tasks require a better ability to process information sequence when a Recurrent Neural Network (RNN) is needed. RNN has a strong ability to process time series data [17], while the process of microblog propagation we studied on in this paper is just a time series process, hence RNN is very suitable as the prediction model in this paper. Although RNN can learn sequential dependency of data, but due to the existence of its gradient vanishing problem, RNN has the defect to store and learn long-term dependence. For this reason, we choose an improved kind of RNN, called Long Short Term Memory Network (LSTM), to construct the prediction model in this paper. LSTM has made up for the shortcomings of the original RNN and is currently one of the most successful and popular RNN architectures, which has been applied to various time series tasks such as natural language processing and sound data processing.
In order to improve the defect that it is difficult for RNN to store and learn long-term dependence, LSTM adds a cell memory controller c to learn long-term features, as is shown in Figure 2. At time t, LSTM has three inputs, which are the current input value x t , the previous output value h t 1 , and the previous cell state c t 1 , as well as two outputs, respectively, which are the current output value h t and the current cell state c t . Through three gate structures, namely input gate, forget gate, and output gate, LSTM maintains and updates the cell state [18]. In LSTM, temporal information is added or deleted from the cell state by gate structures, which selectively allows information to pass through. Neurons can feed data to the upper layer or the same layer [19].
With the current input and the previous cell state, LSTM gradually updates its cell state. Then, the output of the merged layer is trained through the “Relu” layer. Finally, the output layer produces predicted values [20].

3. Methods

In this paper, we use reposting number, which reflects the scale of microblog reposting to quantitatively describe the propagation effect of microblogs on the issue of study on microblog propagation trends. In order to make up for the problem that feature description of traditional machine learning-based prediction methods for reposting number is inaccurate, we mainly use microblog group features, including user and content features, group influence features, and reposting comment features to model [21]. We further learn its hidden features and time-dependent features relying on an LSTM network, and finally predict microblog reposting number.

3.1. Microblog Group Feature Representation

3.1.1. Bloggers and Microblog Content Features

Commonly used microblog features for prediction in current research are mainly divided into two categories [22,23,24]. The first one is features of users themselves, namely the blogger features, and the second one is features of blogs themselves, namely microblog content features. For Sina microblog, blogger features include the number of blogger’s fans, blogger influence, blogger’s recent microblog heat [22,25,26], and for microblog content features, current research usually focuses on points including whether the original microblogs contain links, and its hashtags.
The blogger features and microblog content features specifically used in this paper are shown in Table 1, including feature tags, specific meanings, and value ranges.
For some important features, their brief descriptions are as follows:
(1) The blogger’s recent microblog heat: There is a certain logical relationship between the heat of one microblog and the heat of its blogger’s other microblogs recently issued. Therefore, we use the heat of 10 other microblogs recently issued by the blogger as one basis of the calculation of the blogger’s recent microblog heat. The calculation is shown in Equation (3):
h = 1 10 m = 1 10 ( r m + c m + l m )
where h represents the required feature of the blogger’s recent microblog heat. For the m-th other microblog recently issued by the blogger, r m represents the reposting number of the microblog, c m represents the number of microblog comments, and l m represents the praise score of the microblog.
(2) Blogger influence: The microblog propagation trends will be directly affected by the strength of the influence of its blogger, namely, with larger blogger influence, it is easier for the microblog to be spread. Since the following relationship between microblog users is similar to the links between web pages in the Internet, the idea of PageRank algorithm can be used to evaluate the influence of users. The basic idea is that the user’s influence is larger followed by more influential users, the user’s influence is larger with more fans, and the user’s influence is larger with more fans and follow fewer users. According to the research on the topological structure and information propagation of Sina microblog [23], it is found that it has an obvious small-world experiment, and its degree distribution obeys a power-law distribution. According to the idea that messages can be sent to other people on the network with fewer hops, the calculation of user influence is shown in Equation (4):
I ( u i ) = ( 1 d ) + d j = F ( u i ) N 1 I ( u j ) o u t ( u i )
where I ( u i ) represents the required influence of user i. d is the damping factor, which represents the probability of transferring from one given user to another random user, with its value range between 0 and 1, and the value of d is usually 0.85. F ( u i ) represents all user nodes that have an outbound link to the blogger node, namely the user’s fan group. N represents the number of all user nodes that have an outbound link to the blogger node, namely the number of user’s fans. O u t ( u i ) represents the out degree of user node u i .
(3) Microblog length: Microblogs issued by most users are short and fragmented daily life and emotional catharsis, which is hard to result in widespread resonance and reposting. In contrast, those microblogs with more complete expression are more likely to gain the understanding and resonance of other users, and easier to spread. Therefore, we consider the microblog length as one of the microblog content features, and set the classification criteria as whether the length of microblog is more than 15 words.
(4) Whether to include usernames or hashtags: Regarding microblog content features, we consider the problem of whether usernames or hashtags is included. In a microblog, usernames are used to directly quote other users, or to address or talk about a certain user, and hashtags are used to mark specific topics.
(5) Special marks: We consider whether there is an exclamation mark “!” or a question mark “?” at the end of a microblog as part of microblog content features. The exclamation mark is used to mark emotional statements in the text, and the question mark represents a problem in the text. The existence of both marks is more likely to result in the blogger’s passing his own emotions to other users or arousing other users responding, which contributes to the spread of the blog.

3.1.2. Key Comment Features Based on Cluster and DCNN

A microblog often expresses different meanings in different temporal and spatial contexts, and sometimes may even contain irony, metaphors, and other information. In this regard, forwarder comments are often needed as supplement to the information of the source microblog to provide temporal and spatial background information which the original microblog lacks. At the same time, users are usually susceptible to comments from other users. Therefore, in this paper, we consider extracting comment features of forwarder group to improve the accuracy of machine learning-based prediction methods.
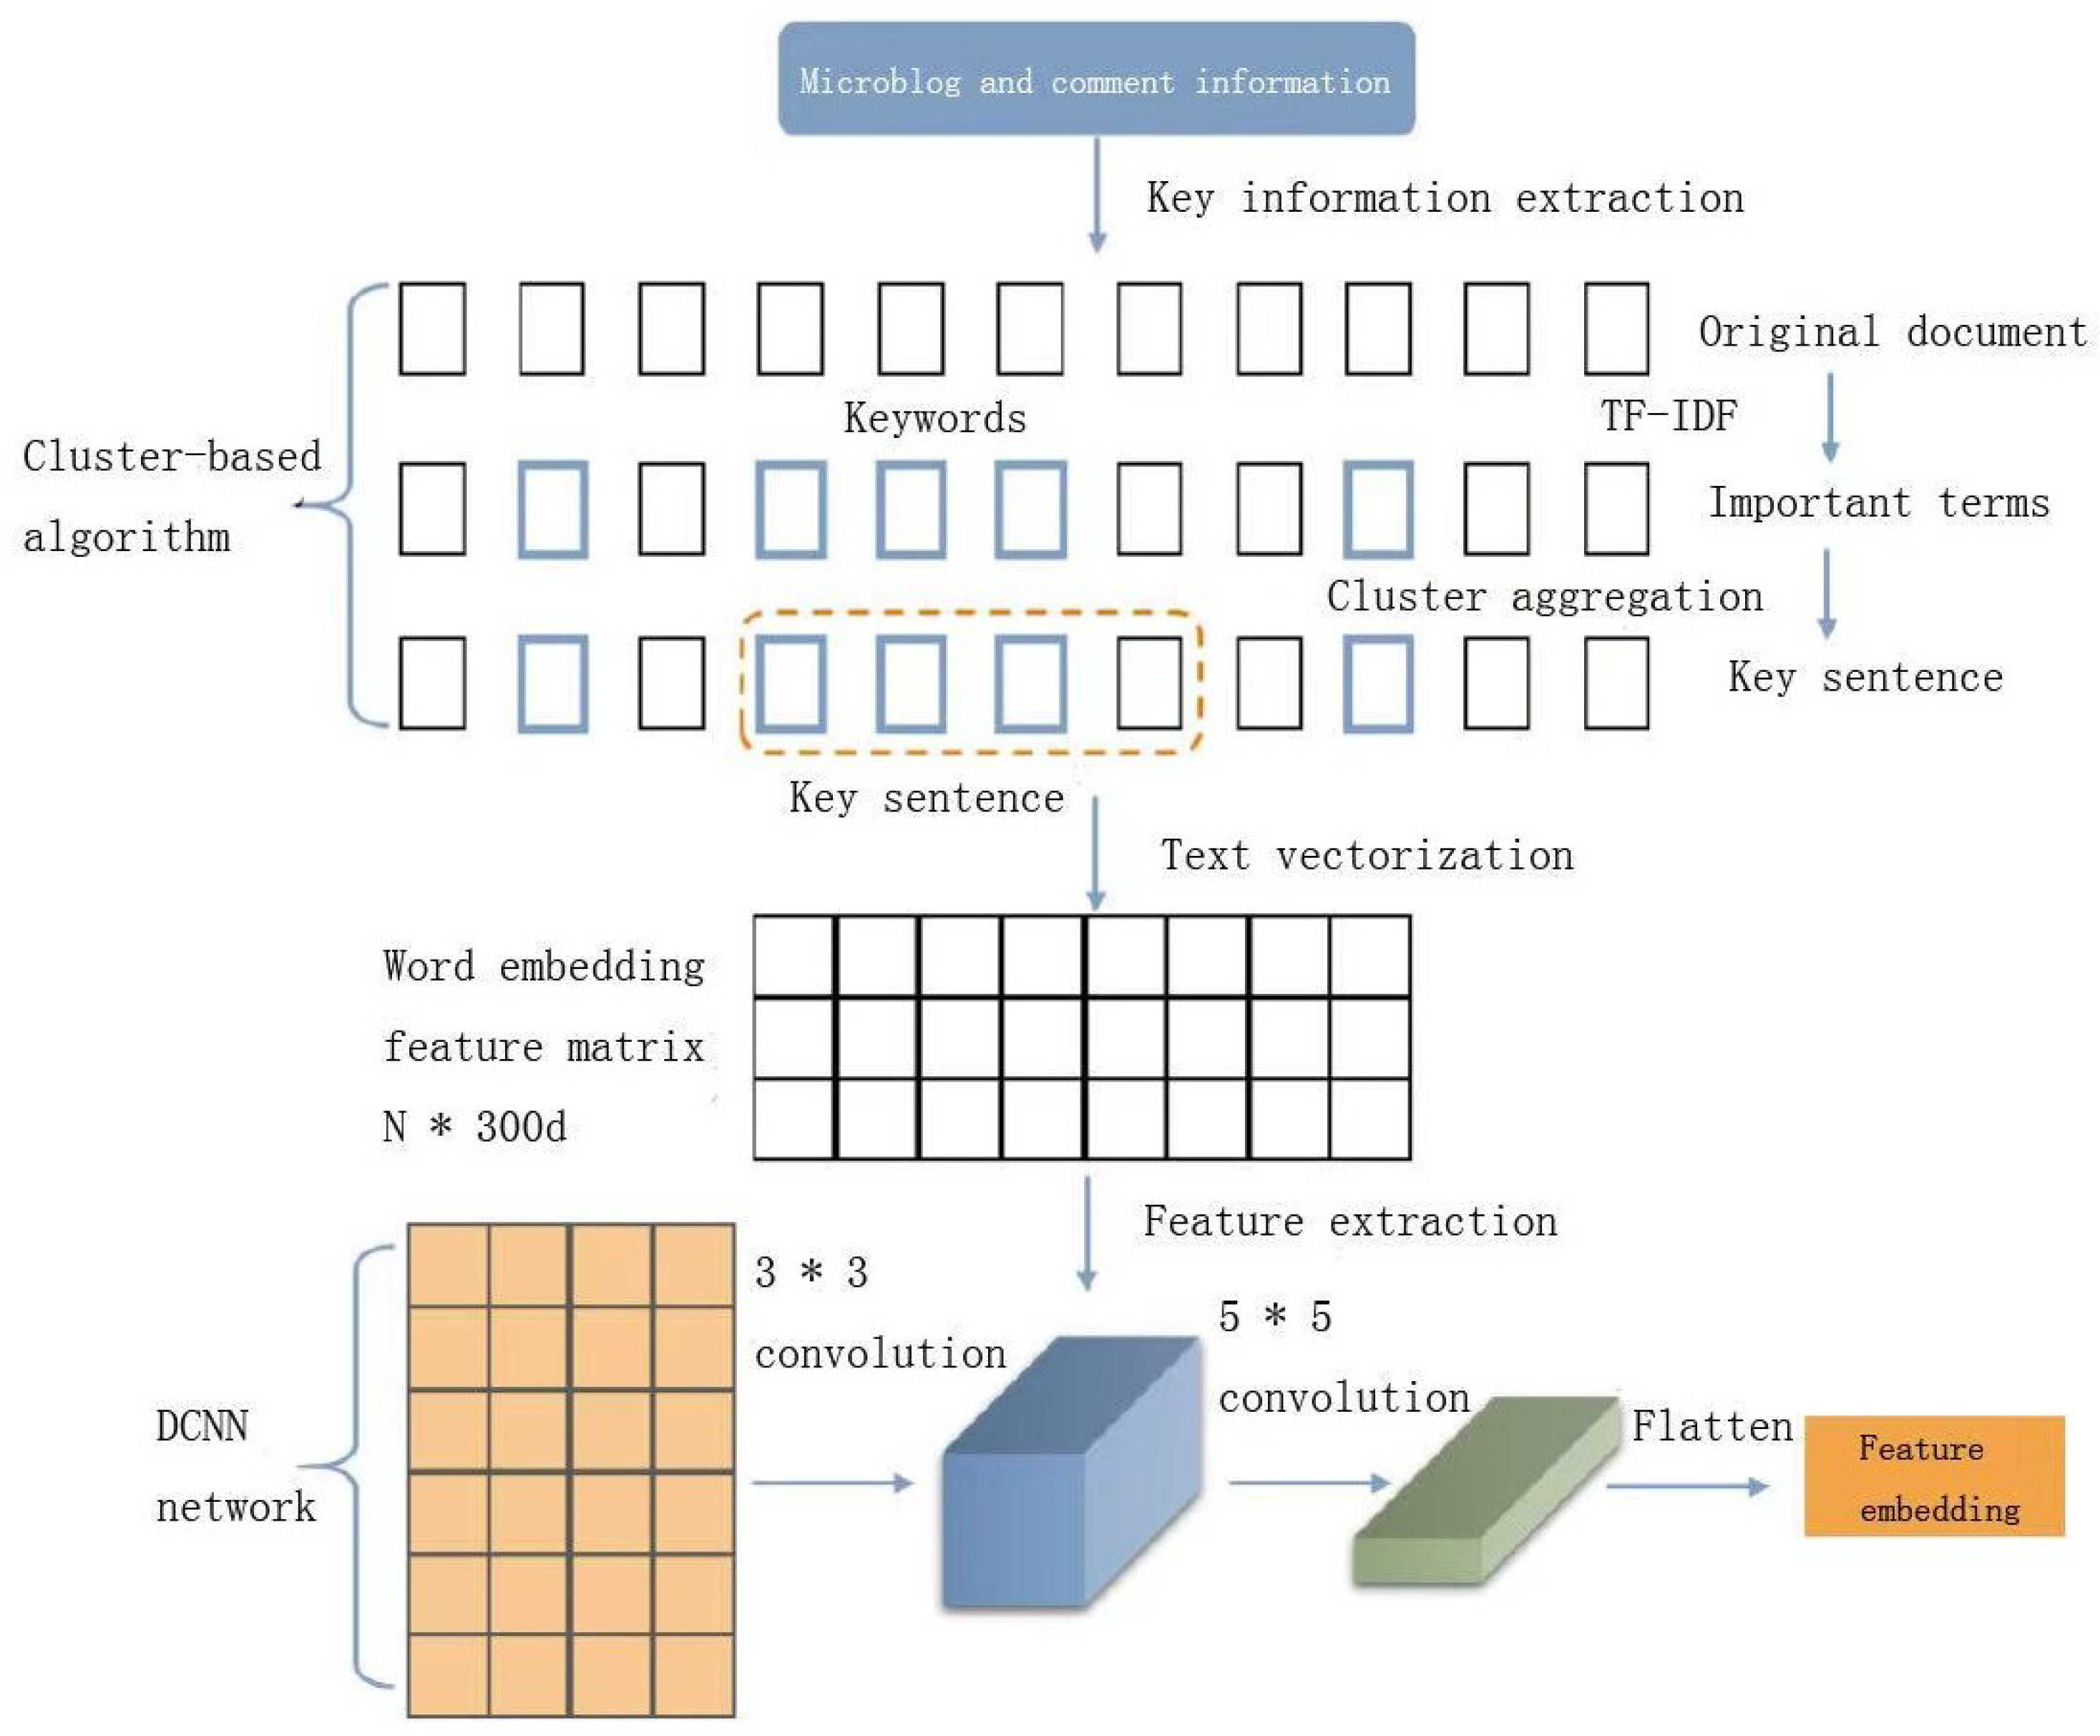
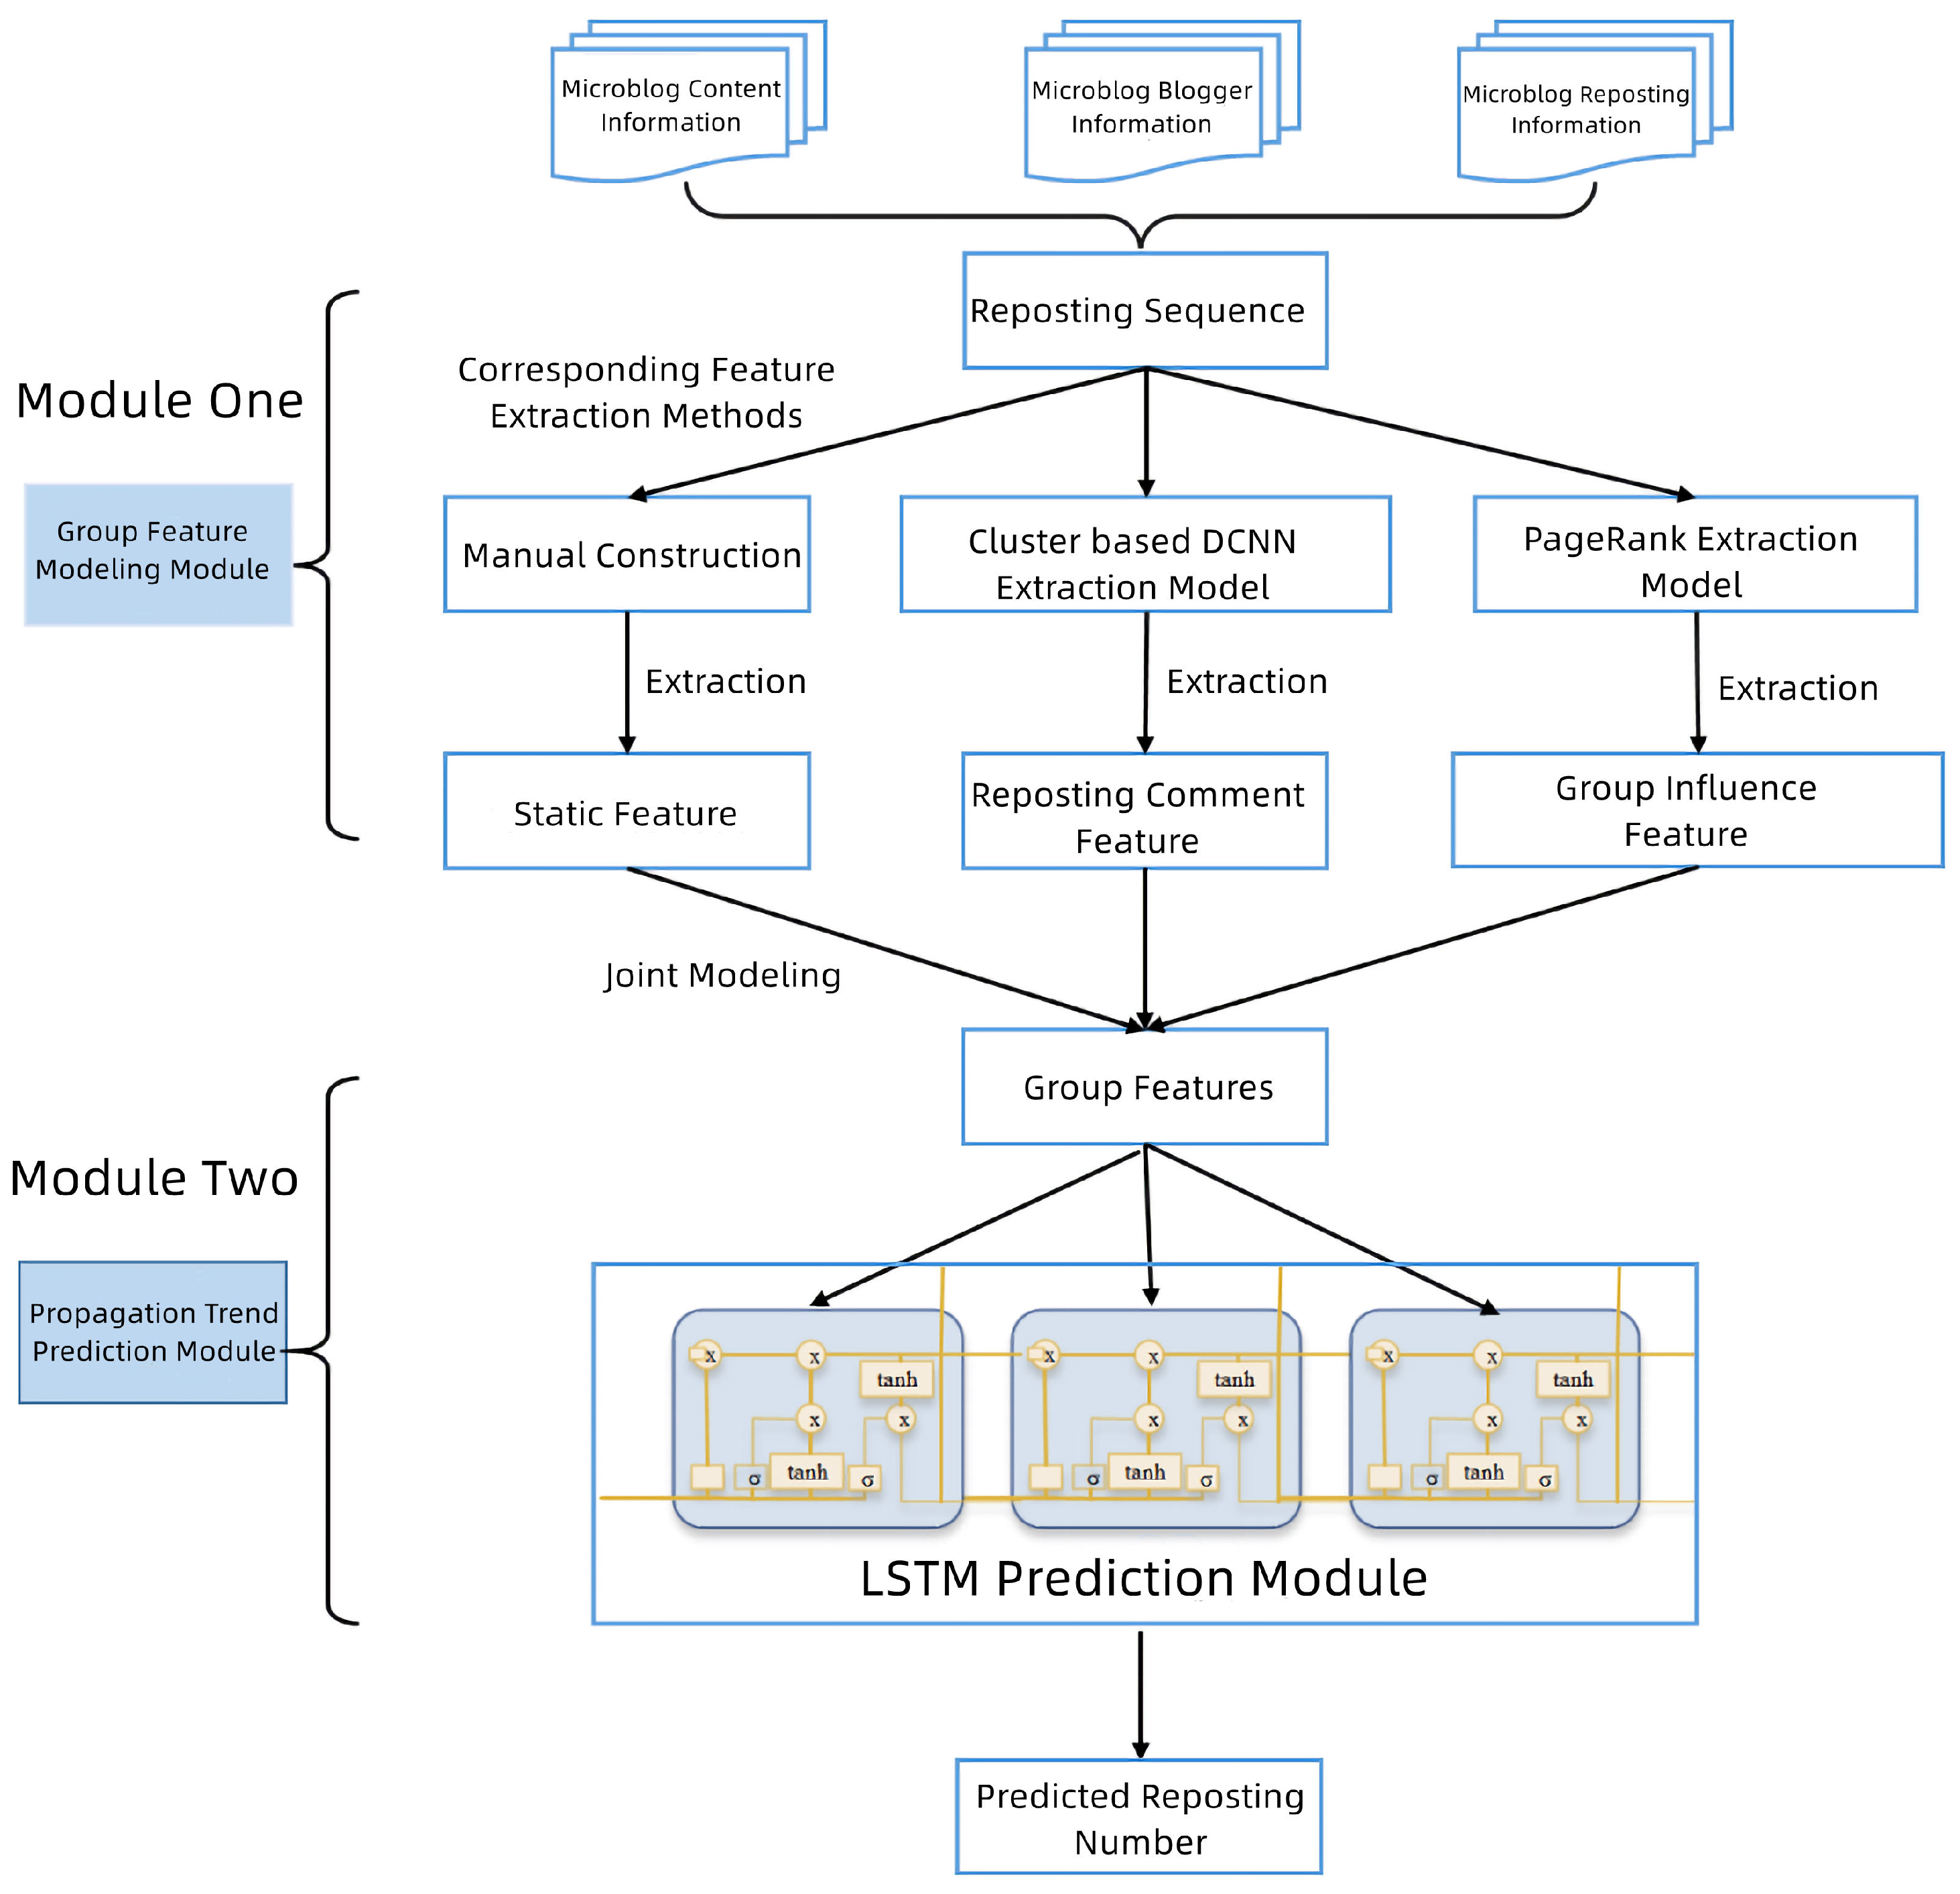
Since there are too many forwarder comments on a microblog, it is necessary to extract important information of the comments first, and then encode and vectorize them into group comment features of the blog. The process of feature extraction is shown in Figure 3, where there are generally three steps: (1) First, we use the cluster-based key information extraction model to extract key information from the group comments of microblog forwarders; (2) Encoding and vectorizing group comment information into sentence embeddings; and (3) Inputting the sentence embeddings to the DCNN convolution layer for feature extraction and compression. Finally, feature embeddings of the forwarder group comments are extracted, which contains temporal and spatial background information and is a supplement to the source microblog.
The specific work of each step is as follows:
Step 1: Key information extraction based on clusters
Forwarder comments are composed of sentences. In the process of microblog propagation, forwarder group comments contain a large number of sentences, so key information of the comments needs to be extracted first. In this paper, we use the cluster-based key information extraction technology to extract the corresponding feature sentences [
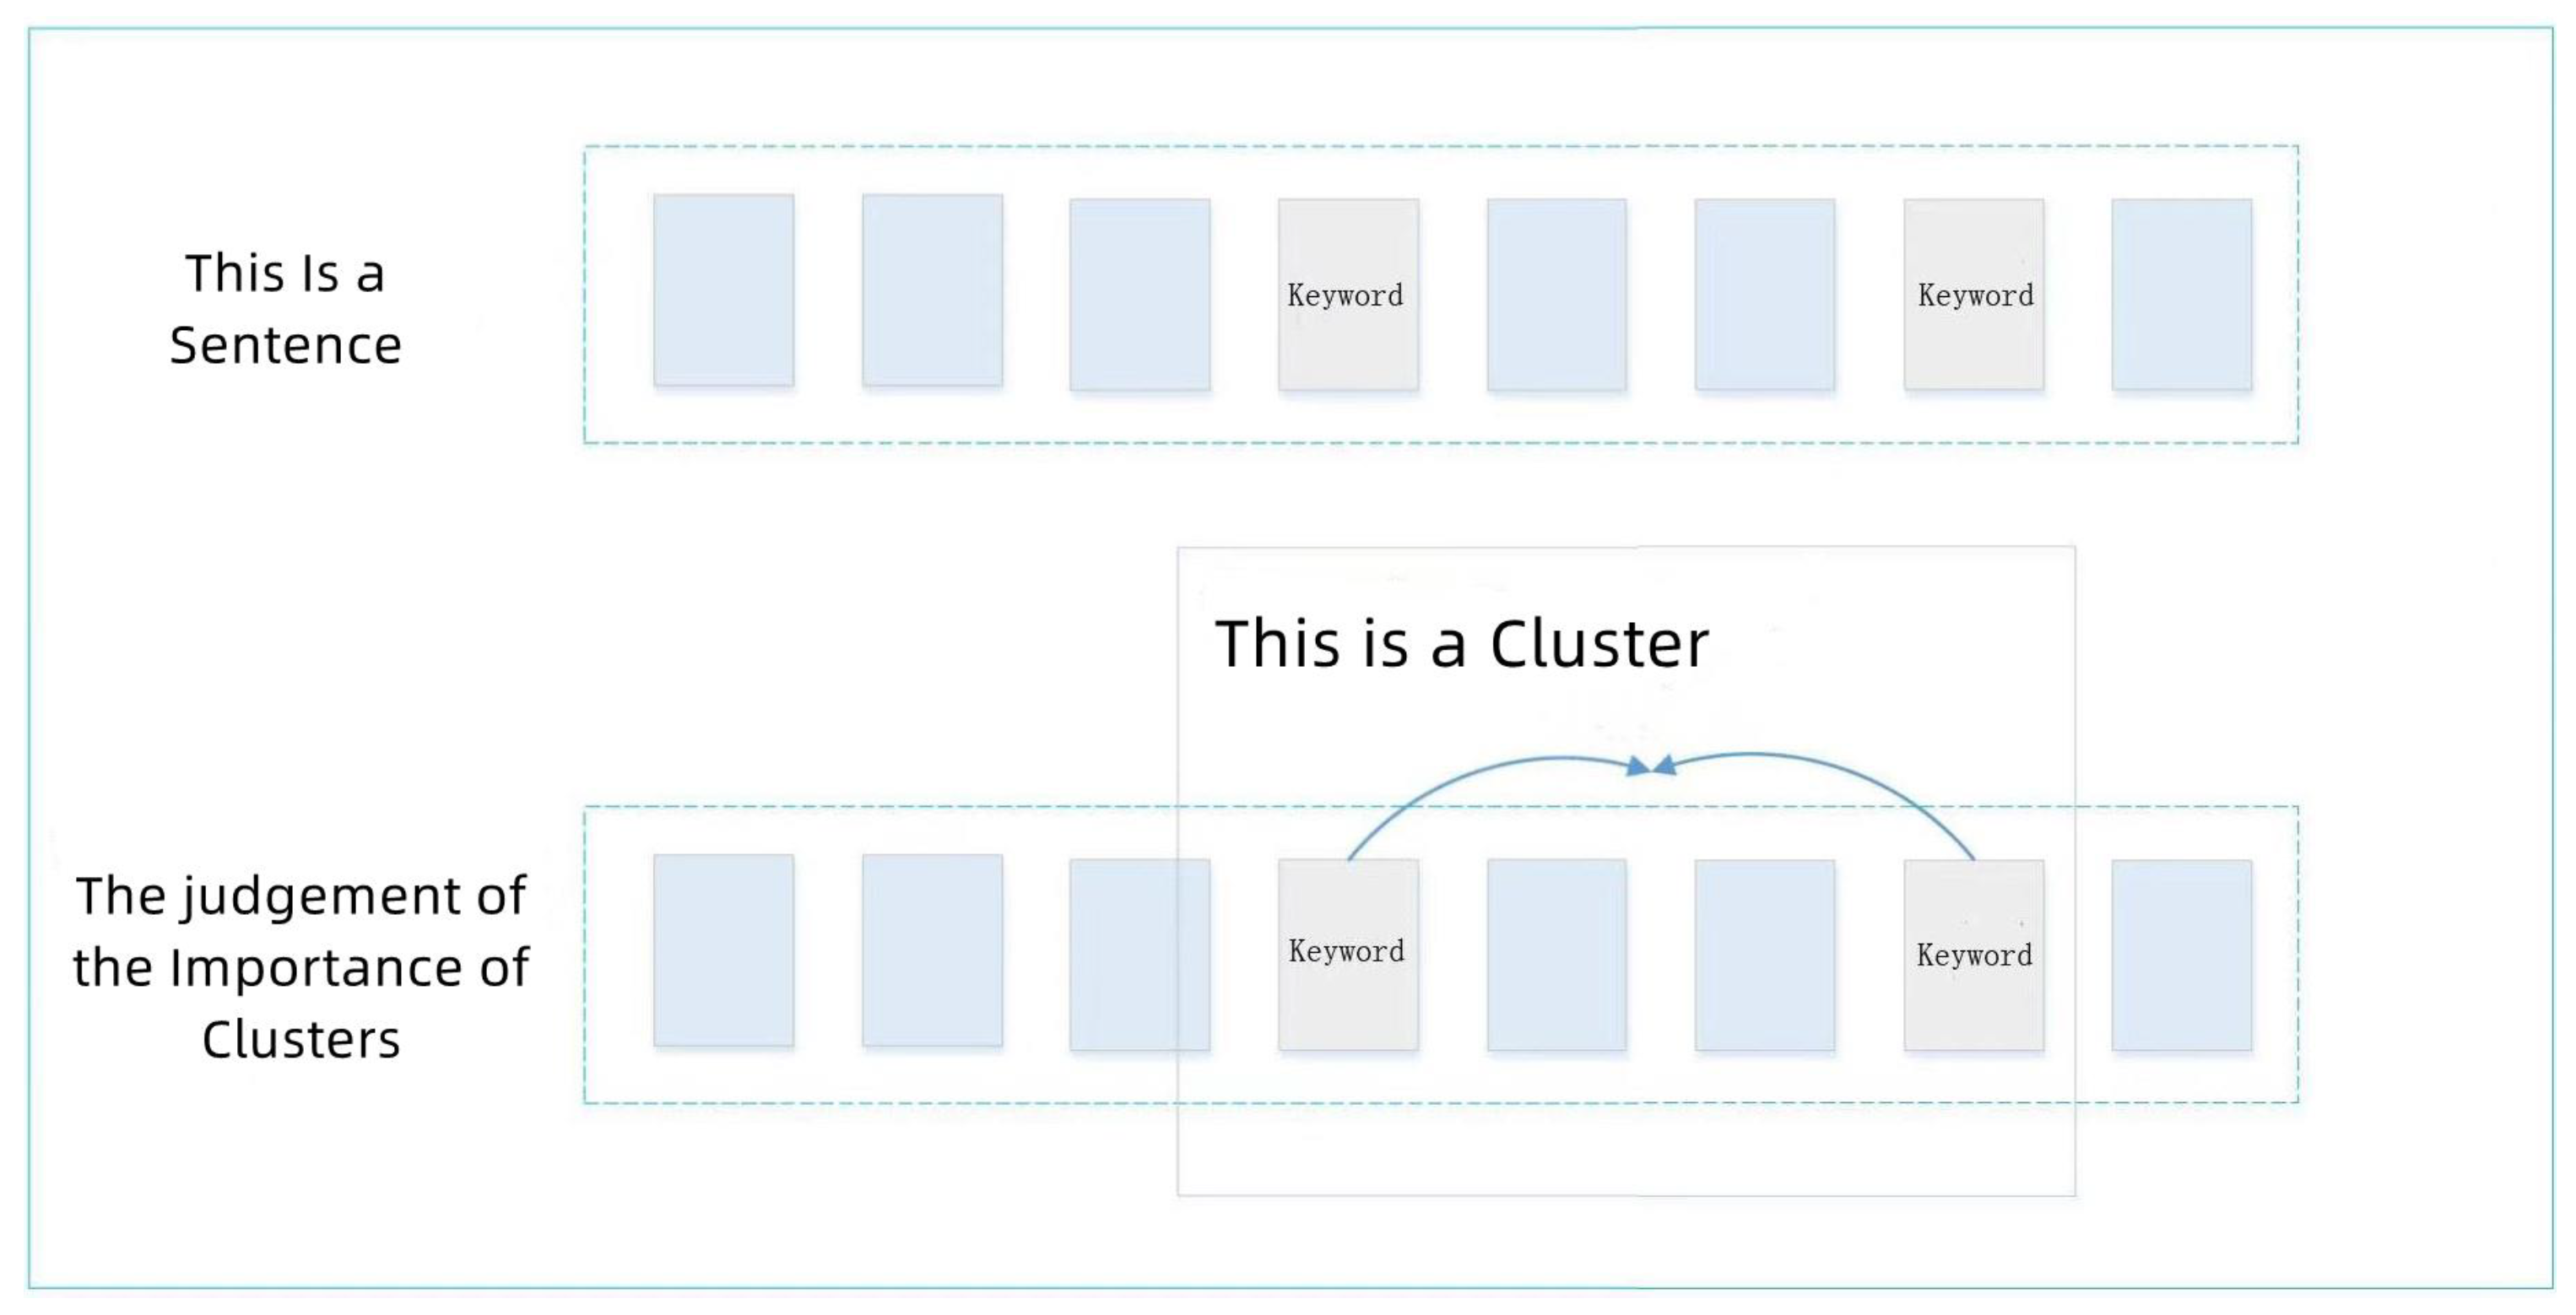
27]. Our concept of “cluster” in this paper refers to the aggregation of keywords, namely, sentence fragments which contain multiple keywords.
It can be seen in Figure 4 that the framed part in the figure represents a cluster, where the keywords are obtained by calculating the TF-IDF score of terms of the comment sentences. If the distance between two keywords is less than the threshold, then these two keywords are classified into the same cluster. We set the threshold to 4 in this paper. In other words, if there are more than four other terms between two keywords, then these two keywords will be divided into two clusters. Then, we calculate the importance score of the clusters, the calculation of Equation (5) is as follows:
C _ I M P = ( N K e y s ) 2 l e n
where C _ I m p represents the required importance score of clusters. N K e y s represents the number of keywords in the cluster. L e n represents the number of terms in the cluster. Taking Figure 4 as an example, in the figure, the cluster in the frame has a total of four terms, two of which are keywords. Therefore, the importance score of this cluster is ( 2 2 ) / 4 = 1 . After that, we extract the 10 sentences with the highest cluster scores, and combine them together as the finally extracted comments containing key information which can be further processed later.
Step 2: Feature encoding and vectorization
Since the computer cannot directly understand the meanings of text information, it is necessary to encode and vectorize the extracted comment features containing key information into a multi-dimensional embedding to facilitate subsequent further processing. The basic idea of word embeddings originates from NNLM [24] (Neural Network Language Model) proposed by Bengio. In this paper, we use open source tool Word2vec of Google in 2013 to solve the word embedding representation problem of microblog comments. Word2vec can quickly and effectively replace text sentences with multi-dimensional embeddings based on a given corpus.
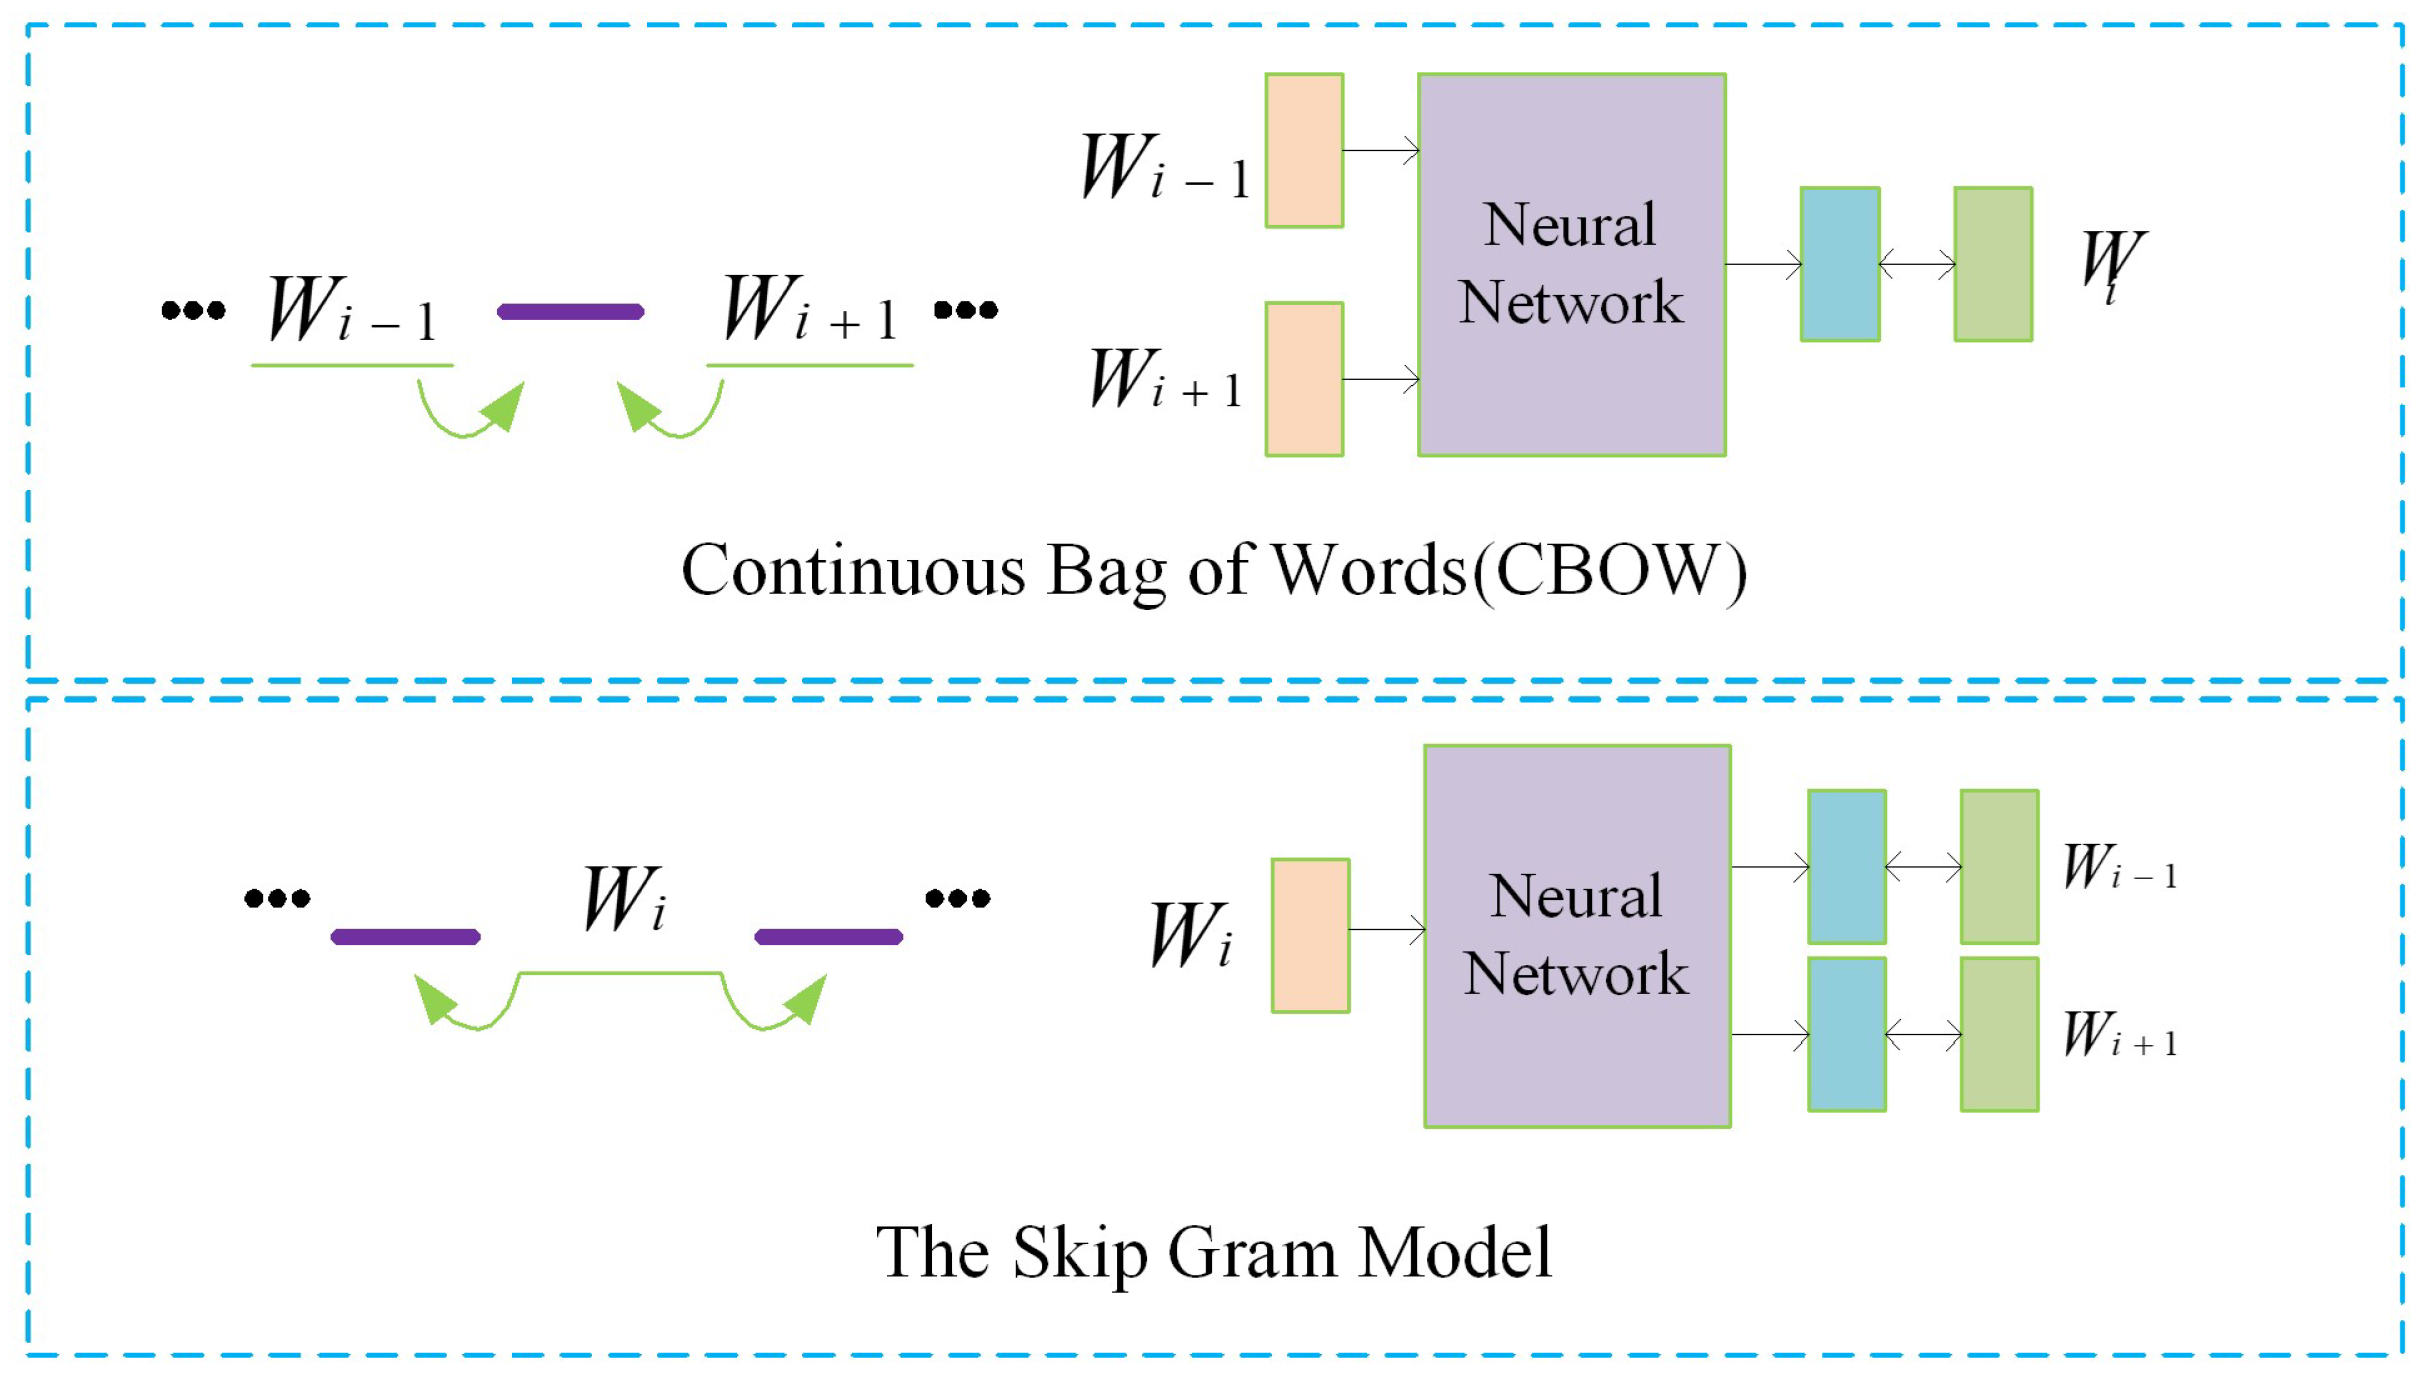
There are two models for Word2vec, which, respectively, are the Continuous Bag-of-Words (CBOW) model and the Skip-Gram (SG) model, whose structures are shown in Figure 5. For a sentence containing L words, where …, w i 1 , w i w L , respectively, represent the word embedding of each word in the sentence. In the CBOW model, a total of n words before and after the current word w i (here n = 2) are used to predict the current word w i . In contrast, the Skip-Gram model uses the word w i to predict the n words before and after it. Both CBOW and Skip-Gram models include input layer [24], hidden layer, and output layer.
After preprocessing reposting comments containing key information, Word2vec is used to encode them into multi-dimensional embeddings. We train the Word2vec model, update the weights through the backpropagation algorithm, and use the stochastic gradient descent method to reduce the loss value, and finally obtain the byproduct, word embeddings of the model. Based on the word embeddings trained by the tool word2vec, we convert the words into microblog forwarder comments into word embeddings, and finally convert the key sentences of the comments into sentence embeddings.
Step 3: Feature extraction and compression of DCNN convolutional layer
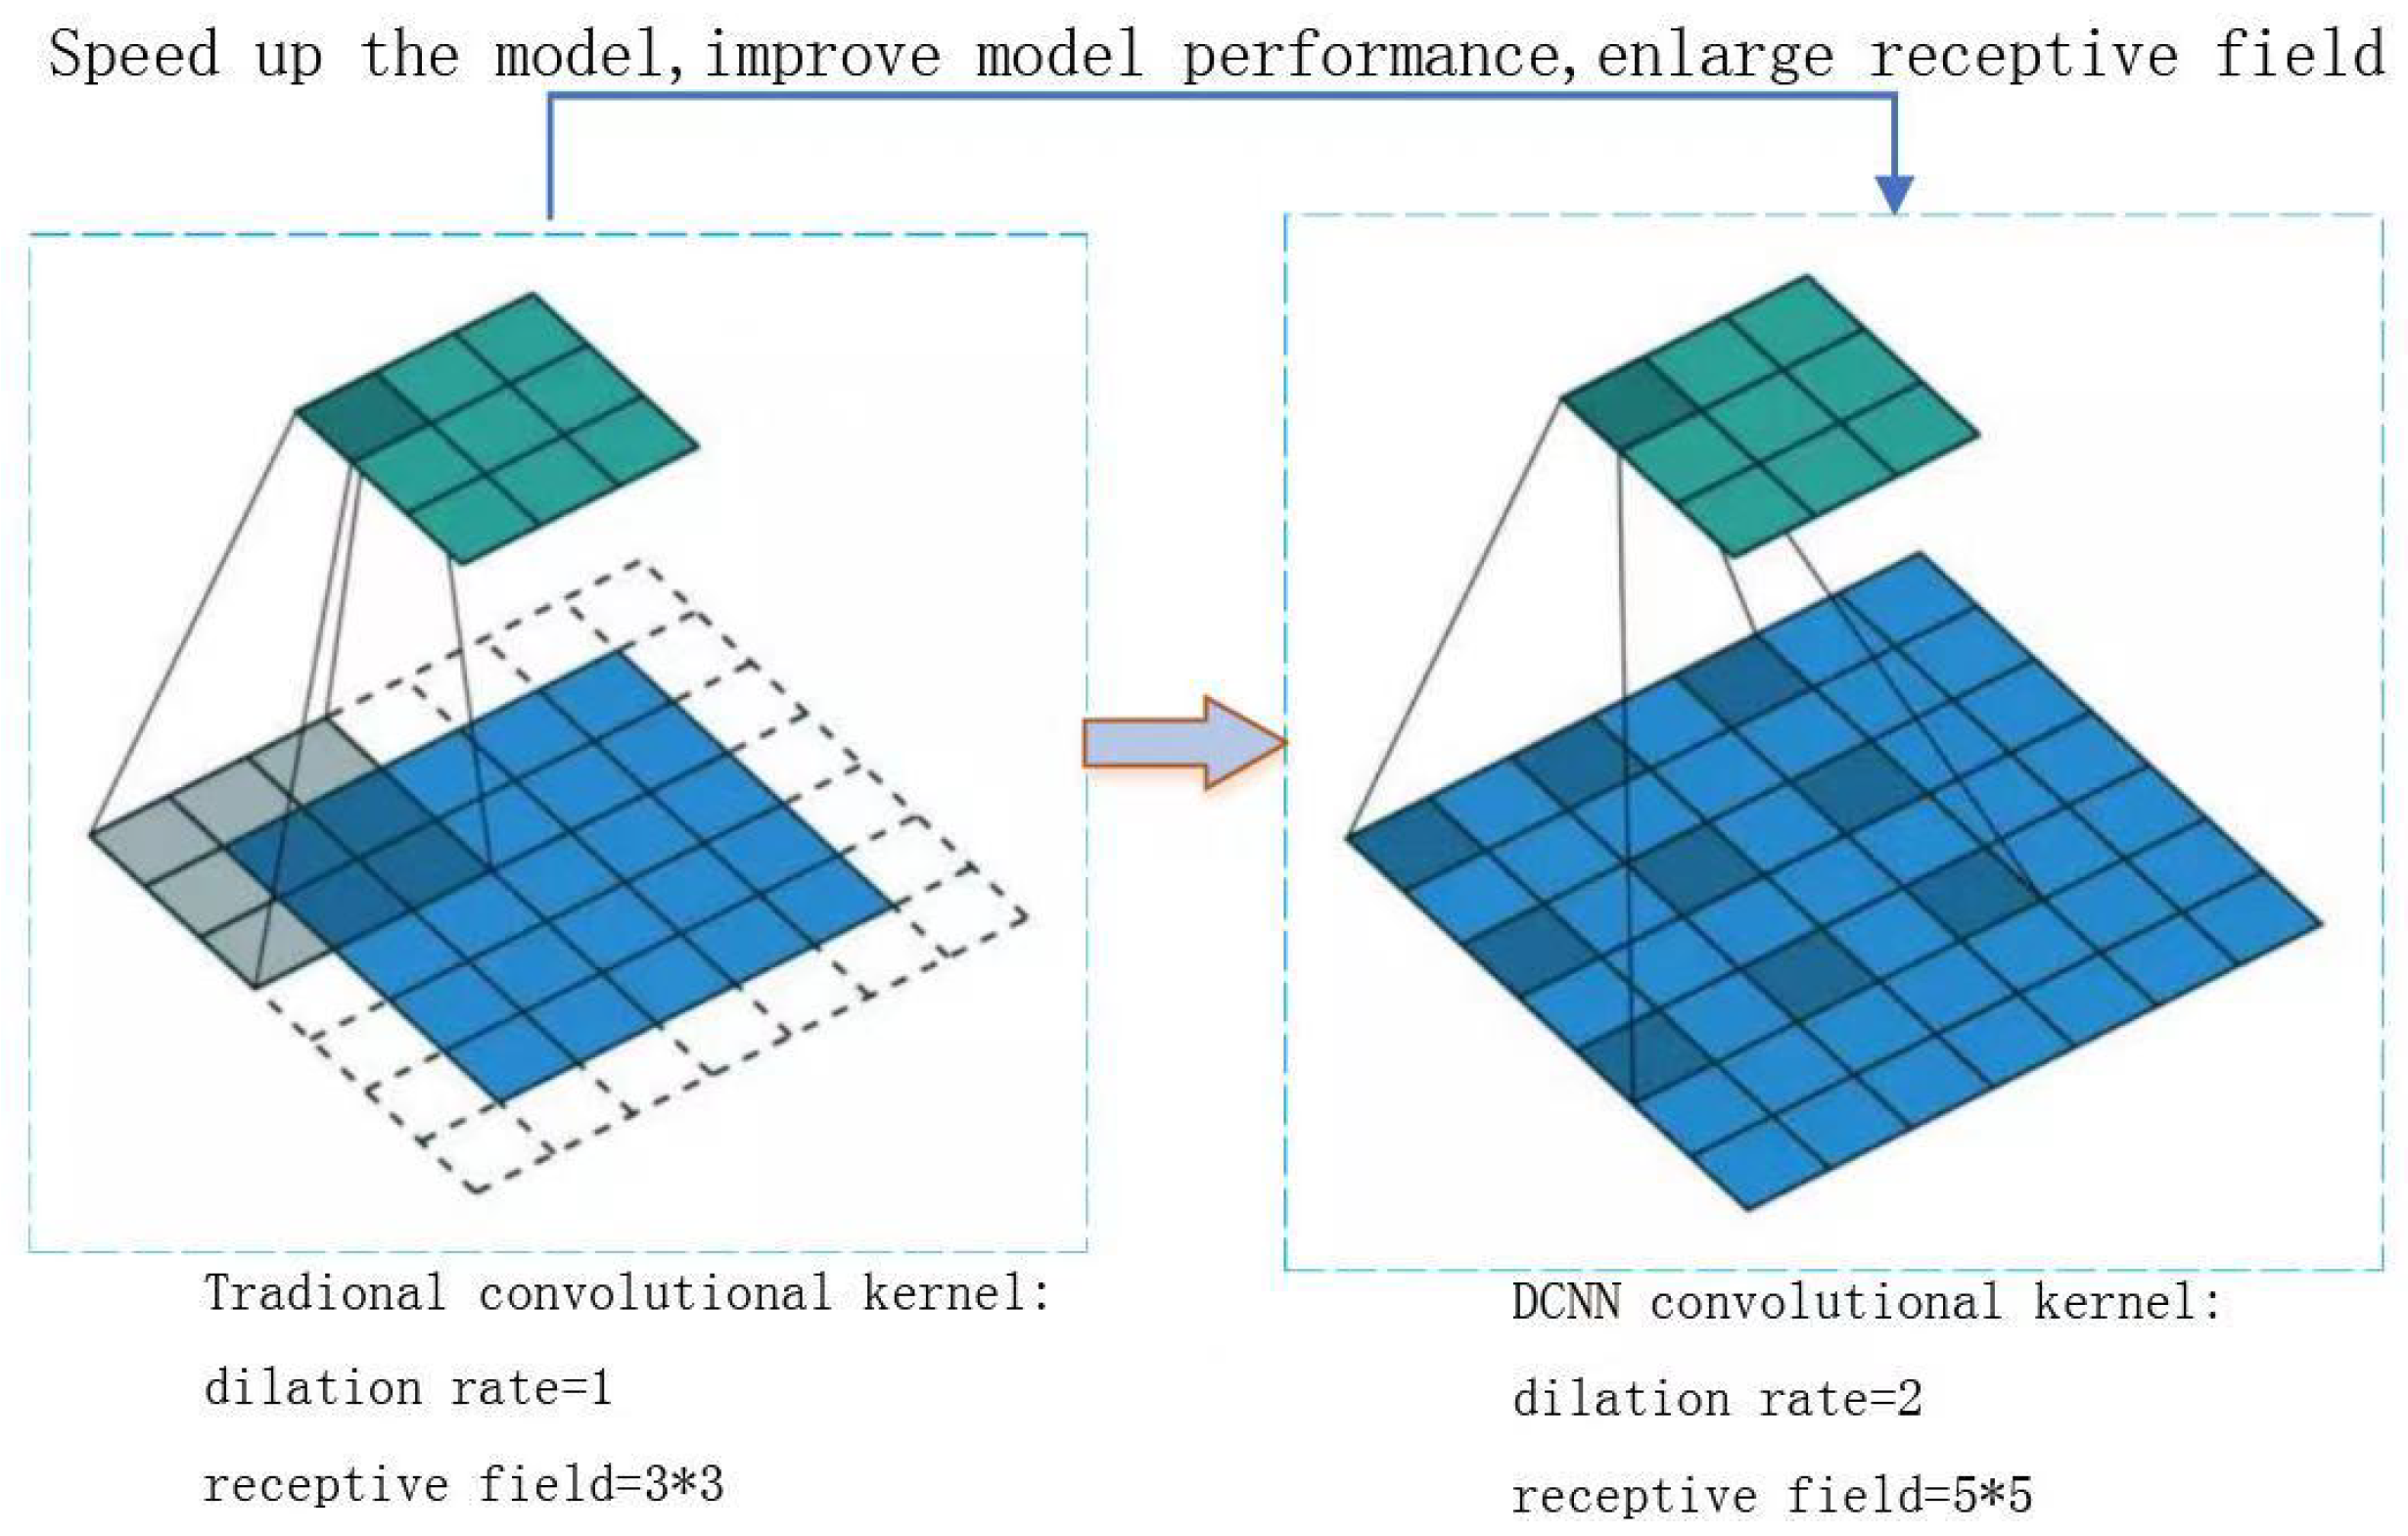
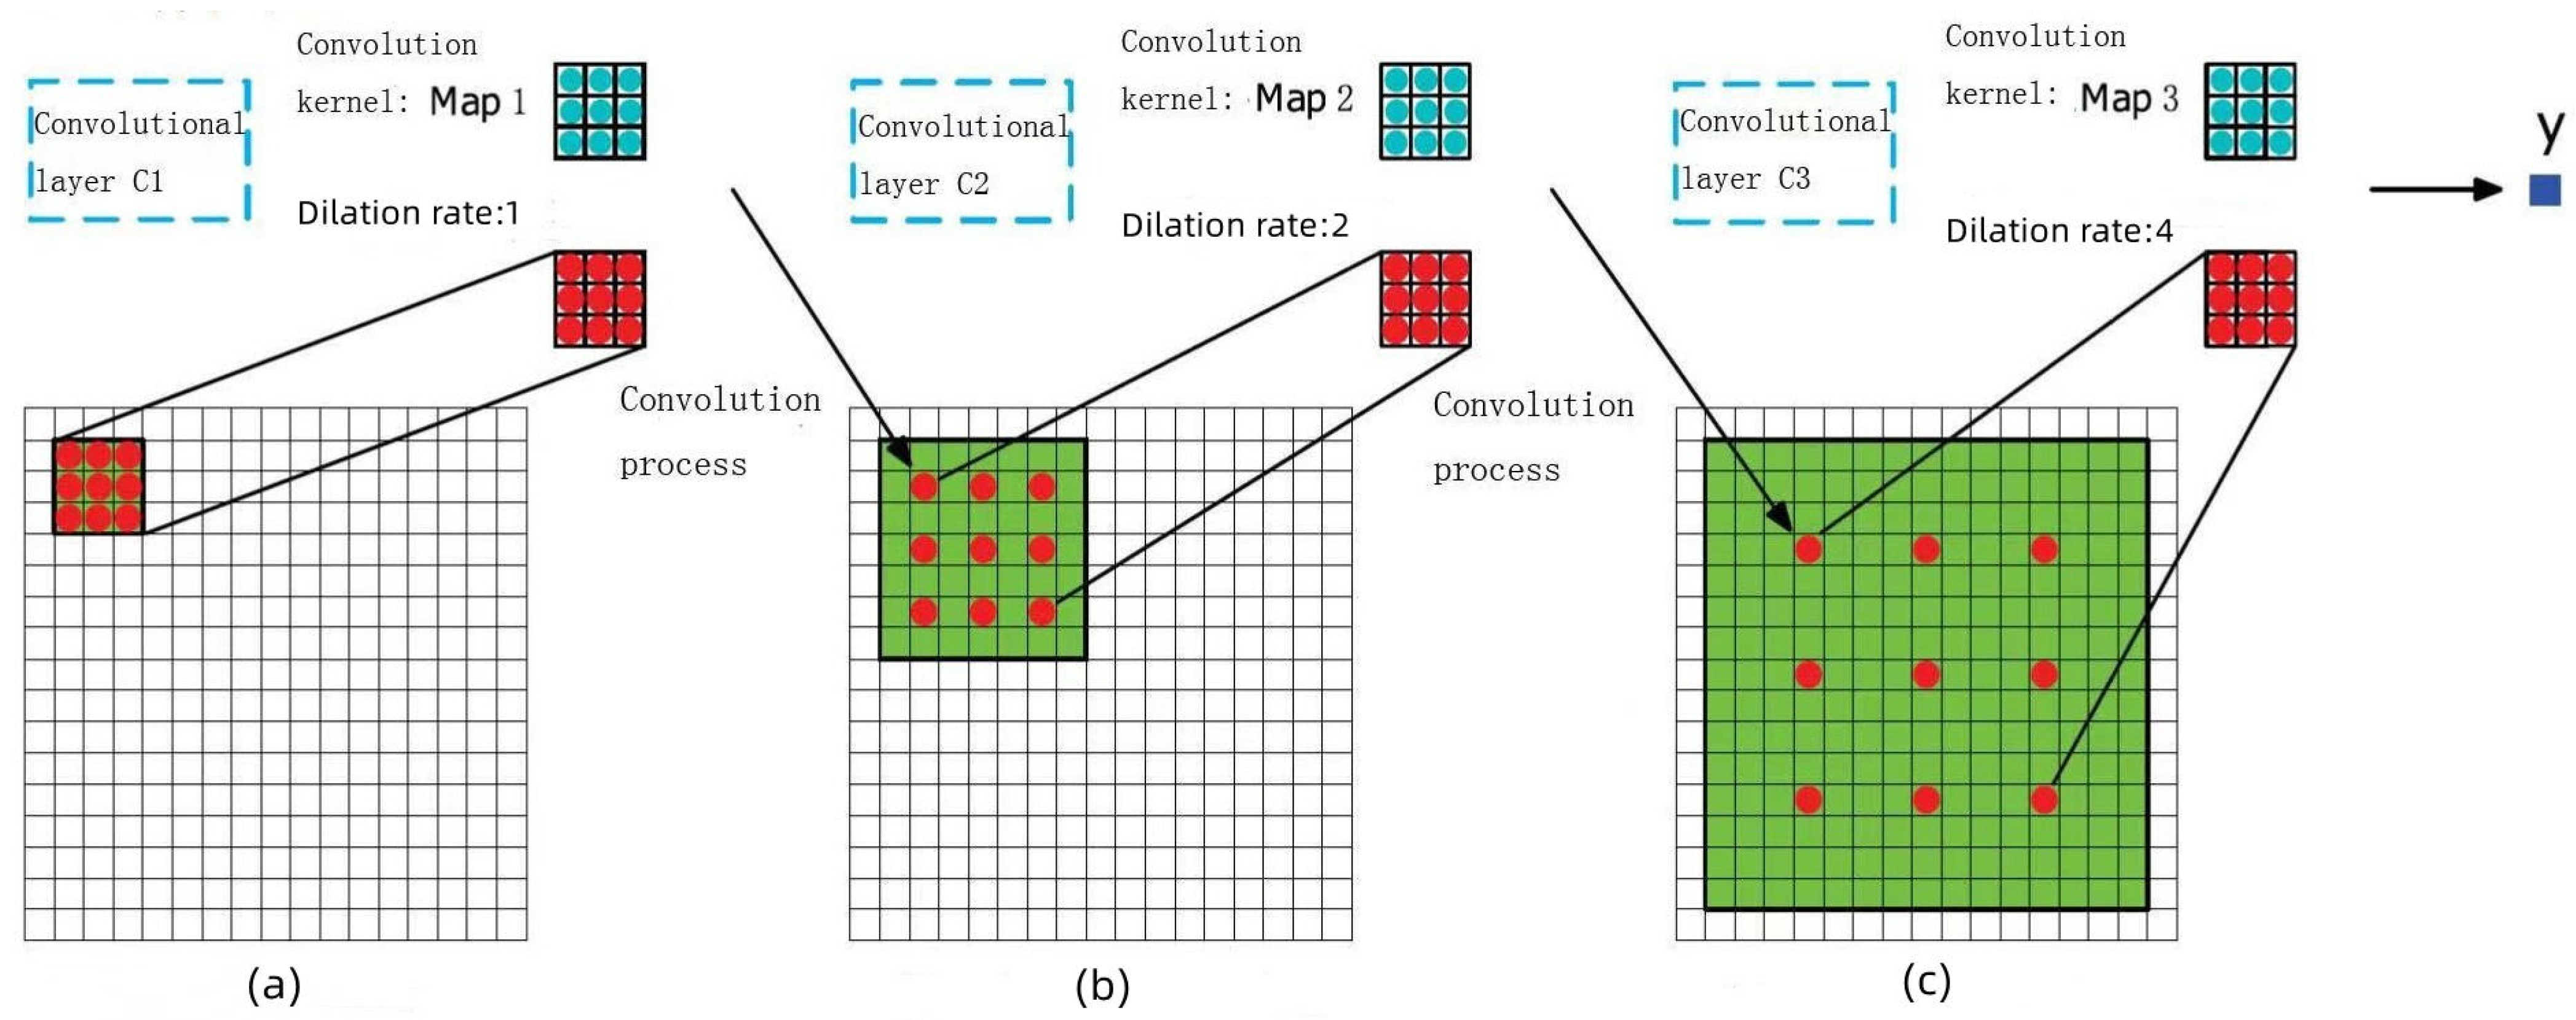
Finally, we conduct feature extraction and compression on the forwarder comment embeddings. Due to the complexity of microblog language, the effect of usage of ordinary convolutional networks for feature extraction and compression is limited, and there are too many model parameters. Therefore, we choose to use Dilated Convolutional Neural Network (DCNN) and input the sentence embedding representation of reposting comments into the DCNN convolutional layer for feature extraction and feature compression. The three dilated convolutional layers we use are shown in Figure 6.
In the figure, for the three dilated convolutional layers C1, C2, and C3, their convolution kernels Map1, Map2, and Map3 are of the same size, which are all 3 × 3 matrices, but the dilation rates of the three convolution kernels are different, with values of 1, 2, and 4. In subgraph (a), a convolution kernel with dilation rate of 1 is used to convolve the input embeddings, and we input the result feature map as the output of C1 to the convolutional layer C2. In subgraph (b), a convolution kernel with dilation rate of 2 is used to convolve the feature map output by the C1 layer, and we input the result feature map as the output of C2 to the convolutional layer C3. In subgraph (c), a convolution kernel with dilation rate of 4 is used to convolve the feature map output by the C2 layer. At this time, the receptive field of the elements in the output y of the convolutional layer C3 has reached 15 × 15 , while, with the ordinary convolution operation, the receptive field will only be 7 × 7 .
The calculation process of the DCNN convolutional layer is shown in Equation (6).
c ( t ) = f ( W T [ X t T + X t + 1 T + + X t + h 1 T ] T + b )
For the forwarder comment embeddings, the convolution kernel W of dilated convolutional layer is applied to a window of terms of length h, and local features are generated after dilated convolution. In Equation (6), c ( t ) is the feature value calculated at position t. b is the deviation of the current filter, and f ( ) is the nonlinear activation function (ReLU). We use zero padding to ensure that the size of the matrix after convolution meets requirements of the calculation. Then, the pooling operation is performed on each feature map through the maximum pooling layer to perform feature compression on the feature embeddings, and output embedding p ( j ) with a fixed length. The calculation is shown in Equation (7):
p ( j ) = m a x t { c j ( t ) }
As is shown in Figure 6, our model uses multiple filters (with different window sizes) to obtain multiple features, and then outputs a multi-dimensional embedding at the maximum pooling layer network stage. The calculation is as shown in Equation (8):
C V = f ( W T [ p ( j ) 1 T , p ( j ) 2 T p ( j ) 10 T ] + b )
where f ( ) represents convolution and pooling operations. As a result, the feature embedding representation C V of forwarder key comments is finally obtained, which contains spatial and temporal background information and is a supplement to the source microblog information.

3.1.3. Group Influence Features

User influence refers to the ability of a user’s opinions, comments, or behaviors to change the behaviors or opinions of other users. In microblog social networks, user influence has a direct impact on microblog propagation trends. Traditional machine learning-based prediction methods usually consider the personal influence of bloggers, without considering the influence of reposting users group in the process of microblog propagation. For example, if a celebrity user with huge influence reposts a microblog, then the propagation scale of this microblog is likely to be greatly improved [24]. In this paper, we use the PageRank algorithm [28] to calculate group influence to make up for the defect of blogger personal influence in traditional prediction methods.
Some scholars regard the microblog social network as a specific directed graph based on graph theory, each node of which corresponds to each user, and the directed edges in the graph represent the relationship “follow” and “followed” in the microblog network. Since the following relationship between users represented with directed edges is similar to the links between web pages on the Internet, we use the idea of PageRank algorithm to evaluate and calculate user influence. The main idea is that the user’s influence is larger followed by more influential users, the user’s influence is larger with more fans, and the user’s influence is larger with more fans and follow fewer users. The algorithm comprehensively considers the structure of the microblog social network, and the final calculated user influence value can also reflect the user’s influence objectively. The calculation Equation (9) of the PageRank value of user influence is as follows:
I ( u i ) = ( 1 d ) + d j = F ( u i ) N 1 I ( u j ) o u t ( u i )
where I ( u i ) represents the required influence of user i. d is the damping factor, which represents the probability of transferring from one given user to another random user, with its value range between 0 and 1, and the value of d is usually 0.85 . F ( u i ) represents all user nodes that have an outbound link to the blogger node, namely the user’s fan group. S represents the number of all user nodes that have an outbound link to the blogger node, namely the number of user’s fans. O u t ( u i ) represents the out degree of user node u i .
After calculating the personal influence of reposting users through the PageRank algorithm in the microblog propagation process, we accumulate the individual PageRank values of the users in the reposting group, calculate the group influence of reposting users, and serve the combination of group influence features and blogger personal influence features as the final influence features. The calculation of full influence is shown in Equation (10), which calculates the accumulation of the influence of all reposting users before time t m :
F I ( u i ) = t = t 1 t m j = F ( u i ) N 1 I ( u j )

3.2. The Construction of the Prediction Model for Reposting Number

Taking into account the time dependence of the change of microblog propagation trends, in this paper, we choose the extracted microblog group features combined with Long Short Term Memory Network (LSTM) to construct the prediction model. The overall framework of our LSTM prediction model in this paper is shown in Figure 7, which contains four functional models, including input layer, LSTM hidden layer, output layer, and network training, where the input layer is responsible for preprocessing the microblog feature data set to meet requirements of the network input. The LSTM hidden layer is composed of a multi-layer recurrent neural network constructed by LSTM units. The output layer provides the final prediction results of reposting number, and we train the prediction network through the Adam optimization algorithm to update model weights iteratively.
Adam optimization is an effective gradient-based stochastic optimization method, which combines the advantages of AdaGrad and RMSProp optimization algorithms and has excellent performance in network training. Compared to other stochastic optimization methods, Adam is better in terms of speed and calculated amount, occupies fewer computing and storage resources, and the overall performance in practical applications is relatively better.
In Figure 7, the upper right corner is the detailed structure of the LSTM unit. LSTM maintains and updates the cell state of the cell memory controller c through three gate structures, including input gate, forget gate, and output gate, and learns long-term features. The internal formulas of LSTM we used are shown in Equations (11)–(15):
c t = f t c t 1 + i t t a n h ( W x c x t + W h c h t 1 + b c )
O t = σ ( W x o x t + W h o h t 1 + b o )
f t = σ ( W x f x t + W h i h t 1 + b f )
h t = o t t a n h ( c t )
c t = f t c t 1 + i t t a n h ( W x c x t + W h c h t 1 + b c )
where σ is the activation function, and i t , o t , f t , c t , and h t represent, respectively, the input gate, output gate, forget gate, cell state, and the final output of LSTM.
First, we preprocess the multi-dimensional group features of microblog in the input layer. The original microblog feature sequence is defined as F o = f 1 , f 2 , , f n in the order of timestamps. The multi-dimensional microblog features are preprocessed, time slices are divided, and data set is divided into training set and test set. Supposing that the input length is L, the processed microblog data set is denoted as the sample feature X, the actual reposting number Y, and the corresponding predicted reposting number Y p output by the output layer, the representations of which respectively correspond to the following Equations (16)–(18):
X = { x 1 , x 2 , , x L }
Y = { y 1 , y 2 , , y k }
Y p = { y 1 , y 2 , , y k }
where the value of k is 3. The calculation of root mean square error, namely the loss function, is shown in Equation (19):
l o s s = 1 m i = 1 m ( Y Y p ) 2
The calculation and training of the prediction network are mainly done through the back propagation algorithm through time (BPTT) [25], as is shown in Figure 8.
The training flow chart of the model is shown in Figure 9. The training process is generally divided into four steps, the specific process of which is as follows:
(1) First, we calculate the output value of the LSTM unit structure according to the forward propagation.
(2) Secondly, we calculate the error terms of all LSTM unit structures through backpropagation, where the error terms include two propagation directions in terms of time and network structure, respectively.
(3) Then, the network automatically calculates the gradient of corresponding weight according to the calculated error value.
(4) Finally, after setting parameters such as the learning rate, we train the network, and through the gradient-based Adam optimization algorithm, we update the network weights iteratively until the network converges.
To sum up, the overall structure of our prediction method for microblog reposting number based on group features in this paper is shown in Figure 10.

4. Experiments and Results

4.1. Experiment Preparation and Data Preprocessing

4.1.1. Experimental Environment

The environment and configuration of the hardware and software used in the experiment are as follows:
(1) Hardware Configuration:
1. CPU: inter(R) Core(TM) i5-8265u cpu @160GHz 180GHz RAM: 8GB Memory: 256 Solid+1TB Portable Hard Disk System: windows 10
2. GPU: NVIDA-GeFore GTX1080-Cuda Memory: 700GB Hard Disk System: Ubuntu 15.6
(2) Software Configuration:
Compiler: Python 3.7 Developing tool: Anaconda, Jupyter Notebook, Pycharm Community.

4.1.2. Dataset and Data Preprocessing

In this paper, we use real data from the Sina microblog collected and issued by the team of Tang Jie of Tsinghua University (http://arnetminer.org/Influencelocality, accessed on 15 August 2022). The overview of the original data set is shown in Table 2.
We select some data from the original data set for our experiments, which contain relevant information such as microblog content and creation time. For the microblog data set, we establish a reposting chain ranked by time according to its reposting time and content. When sampling the data set, in order to ensure the integrity of the reposting chain, the reposting process of each microblog event should already be ended. In Table 3, some relevant attributes obtained through statistical analysis of the data set are shown.
In Figure 11, the distribution of reposting number of the microblog data set is shown. As can be seen from the figure, the distribution shows a clear power-law distribution trend that is plotted on the scale of logarithm.
To make the original data set meet the requirements of the prediction network input, the data need to be preprocessed accordingly first. The work of preprocessing mainly includes storing microblog data, processing missing values, removing stop words, and word segmentation, where non-numerical data need to be processed as numerical ones first, such as male and female gender replaced with 0 and 1, respectively, and normalization as well as other processing operations are required for numerical data.
Since the proposed model is a time-dependent prediction model, and the requirement of the LSTM network input is a 3D format, namely, [samples, timesteps, features], so, after preprocessing of the input data, the format of data needs to be reshaped into a 3D one, and the data be divided into time slices. The specific time slice division process of the data are shown in Figure 12. We select 10, 20, 30, 120 min as a time slice, respectively. Finally, we divide the data set into training set, test set, and validation set.

4.2. Prediction Model for Reposting Number

4.2.1. The Analysis of Some of Group Features

In Section 3, we have provided a detailed explanation of the group features, where group influence feature is the sum of users’ influence values calculated by PageRank in the microblog forwarder group. The users with top 10 personal influence are shown in Table 4, and Table 5 shows the influence data of some users, where the * is used to protect the user privacy.
In Figure 13, the relationship between the amount of reposting and user influence is counted, where the horizontal axis and vertical one, respectively, indicate the magnitude of influence and the average amount of microblog reposting. It can be seen from the figure that, as the user influence decreases, the reposting amount of microblog also decreases, indicating a positive correlation between user influence and the reposting amount of microblogs.
In addition, some other extracted features of bloggers and blogs are also very important. Taking the publishing time period as an example, as is shown in Figure 14, the different publishing times each day also have an impact on the reposting amount of microblog.

4.2.2. Training Process and Parameter Selection

In the experiment, we input our extracted features into the model for training and prediction. The hyperparameters of our model, including epoch and learning rate, need to be selected and adjusted through experients, otherwise the performance of our model will decrease. Here, we take hyperparameter epoch and learning rate as an example.
(1) Generally, the generalization ability of the model will increase as the epoch increases. However, an excessively large epoch may lead to the problem of over-fitting, which may decrease the generalization ability of the model on the contrary. Figure 15 shows the performance curve of our model under different epochs. As can be seen from the figure, when the epoch reaches 150, the loss of the model no longer decreases.
(2) The learning rate is another hyperparameter of our model. If the learning rate is too small, the training time of the model will be too long, while, with a learning rate that is too large, it is easy to exceed the threshold, making the model unstable and reducing its performance. Figure 16 shows the relationship curve between learning rate and RMSE. From the figure, it can be found that it is the most appropriate for the learning rate to be 0.1.
Finally, Table 6 shows the final value of all the hyperparameters we use determined through comparative experiments, including epoch and learning rate. Among them, the final learning rate is 0.1 . The size of the forwarder comment embedding is 300. The size of the model input is 120. The convolution layer has two layers, the convolution kernel size of which is 3 × 3 and 5 × 5 , and the number is 128 and 64, respectively. In addition, the number of LSTM prediction units is 30.

4.2.3. Results

(1) Evaluation Metrics and Benchmark Methods
We use three evaluation metrics, M A E , M A P E , and R M S E , to measure the performance of our model, where M A E is used to measure the mean absolute error between the predicted value and the actual value on the data set. For a test set containing n microblog messages, the definition of M A E is in Equation (20):
M A E = 1 n t = 1 n | a c t u a l ( t ) f o r e c a s t ( t ) |
M A P E is used to measure the mean absolute percentage error between the predicted value and the actual value on the data set. The definition of M A P E is in Equation (21):
M A P E = 1 n t = 1 n | a c t u a l ( t ) f o r e c a s t ( t ) a c t u a l ( t ) | × 100 %
R M S E is used to measure the root mean square error between the predicted value and the actual value on the data set. The definition of R M S E is in Equation (22):
R M S E = t = 1 n | a c t u a l ( t ) f o r e c a s t ( t ) | 2 n
We compare our proposed method with several benchmark models. The benchmark models are briefly introduced as follows:
RPP is a model based on an enhanced Poisson process, which integrates three aspects of factors, respectively, which are the strength of the message, the time relaxation equation for the message which decays over time, and the enhancement equation for the preferential link phenomenon in message propagation.
The model LR is a simple but efficient classification model in machine learning, which is widely used in practice.
The model S-H is an epidemic prediction model based on logarithm linear regression of a variable proposed by Szabo et al.
The fundamental principle of BP network is to modify the weight and threshold along the direction of rapidly reducing the objective function.
The traditional LSTM network uses static features to predict the reposting number, without considering the dynamic features generated in the process of microblog propagation.
The model MP5 combines the characteristics of decision trees and multiple linear regression, each leaf node of which is a linear regression model. Therefore, the model MP5 can be used for regression problems of continuous value.
The model T-P divides the prediction problem of reposting number into two procedures. In the first procedure, T-P classifies microblog based on the potential reposting number, and, in the second procedure, T-P conduct regression in each subcategory separately.
The model BCI considers the characteristics of two factors, namely historical behavior and content relevance, to predict the problem of reposting number.
(2) Experiment on Real Data Set
The experiment is carried out on the real microblog data set in two parts. In the first part, 80% of the data set is divided into the training set and 20% is divided into the test set. In the second part, 70% of the data set is divided into the training set, and 30% is divided into the test set. Table 7 shows the experiment on the proposed model with benchmark models such as LR, S-H, and RPP, as well as the results of corresponding evaluation metrics RMSE, MAPE, and MAE. It can be seen from the table that, when 70% of the data set is divided into the training set, the RMSE of our proposed model is 7.335, the MAPE is 23.21, and the MAE is 18.77, whose performance is better than the one of any other benchmark models. When 80% of the data set is divided into the training set, the RMSE of our proposed model is 7.233, the MAPE is 22.89, and the MAE is 17.99. Not only does it outperform other benchmark models on every evaluation metric, but compared to results of the case that 70% of the data set is divided into the training set, the results of the situation in which 80% of the data set divided into the training set are also obviously better.
In this paper, we also select some benchmark models at random for additional tests with our proposed method on the data set, and plot the prediction curve of the reposting number, as is shown in Figure 17, where (a), (b), and (c), respectively, are different reposting scales. It can be seen from the figure that, under three different reposting scales, compared to other benchmark models, our proposed method performs better, which explicitly verifies that not only do our extracted microblog group feature representations contain more comprehensive and accurate information, but our proposed time-dependent prediction method based on group features is also more excellent.

5. Conclusions

In this paper, we study the propagation trends of microblog events, and, aiming at the problem of inaccurate feature descriptions of traditional machine learning-based predicting methods, in Section 3, a new microblog feature description and time-dependent prediction method of propagation trends based on group features are proposed. The proposed method is evaluated by an experiment on the real dataset of Sina microblog, the results of which prove that not only does the microblog group feature representation extracted in this paper contain more comprehensive and accurate information, but the proposed time-dependent prediction method based on a group feature also has better performance, higher accuracy, faster speed, and better robustness than traditional methods.
The method proposed in this paper also has much room for improvement. In our future work, it is necessary to conduct a further correlation analysis on the main factors and characteristics that affect the trends of microblog propagation, in order to use fewer features as group features in subsequent studies to construct our prediction model, with better performance in experiments at the same time. In addition, we construct our prediction model of microblog propagation trends on the basis of the basic LSTM prediction model, with not enough further improvement on the model itself, which will be a main perspective of our follow-up work. Furthermore, when evaluating our final prediction effects of microblog propagation trends, we use traditional evaluation metrics which lack our consideration on evaluation metrics that characterize other aspects of microblog propagation effects, such as the depth and breadth of propagation. Therefore, we will conduct further research on the establishment of a more comprehensive evaluation metrics system of microblog propagation trends.

Author Contributions

Conceptualization, Q.Z. and J.P.; methodology, Q.Z.; software, Z.Z.; validation, Z.Z. and S.J.; formal analysis, Z.Z.; investigation, S.J.; resources, S.J.; data curation, J.L.; writing—original draft preparation, Z.Z.; writing—review and editing, Q.Z.; visualization, Z.Z.; supervision, Q.Z.; project administration, J.P.; funding acquisition, Q.Z. All authors have read and agreed to the published version of the manuscript.

Funding

This work was supported in part by the National Natural Science Foundation of China under Grant No.61702333, in part by the Opening Topic of the Key Laboratory of Embedded Systems and Service Computing of Ministry of Education under Grant ESSCKF 2019-03, and in part by the Natural Science Foundation of Shanghai under Grant No. 20ZR1455600.

Institutional Review Board Statement

Not applicable.

Data Availability Statement

Not applicable.

Acknowledgments

This work was supported by the Key Innovation Group of Digital Humanities Resource and Research of Shanghai Normal University, and by the Research Base of Online Education for Shanghai Middle and Primary Schools, Shanghai Normal University, both funded by Shanghai Municipal Education Commission, and also by Shanghai Engineering Research Center of Intelligent Education and Bigdata, Shanghai Normal University, funded by Shanghai Municipal Science and Technology Commission.

Conflicts of Interest

The authors declare no conflict of interest.

References

  1. Konstas, I.; Stathopoulos, V.; Jose, J.M. On social networks and collaborative recommendation. In Proceedings of the 32nd international ACM SIGIR Conference on Research and Development in Information Retrieval, Boston, MA, USA, 19–23 July 2009; pp. 195–202. [Google Scholar]
  2. Zhao, Q.; Wang, C.; Wang, P.; Zhou, M.; Jiang, C. A novel method on information recommendation via hybrid similarity. IEEE Trans. Syst. Man, Cybern. Syst. 2016, 48, 448–459. [Google Scholar] [CrossRef]
  3. Zhang, B.; Zhang, L.; Mu, C.; Zhao, Q.; Song, Q.; Hong, X. A most influential node group discovery method for influence maximization in social networks: A trust-based perspective. Data Knowl. Eng. 2019, 121, 71–87. [Google Scholar] [CrossRef]
  4. Huang, S.; Zhao, Q.; Xu, X.Z.; Zhang, B.; Wang, D. Emojis-based recurrent neural network for Chinese microblogs sentiment analysis. In Proceedings of the 2019 IEEE International Conference on Service Operations and Logistics, and Informatics (SOLI), Zhengzhou, China, 6–8 November 2019; pp. 59–64. [Google Scholar]
  5. Chakrabarti, D.; Wang, Y.; Wang, C.; Leskovec, J.; Faloutsos, C. Epidemic thresholds in real networks. ACM Trans. Inf. Syst. Secur. (TISSEC) 2008, 10, 13. [Google Scholar] [CrossRef]
  6. Shen, H.; Wang, D.; Song, C.; Barabási, A.L. Modeling and predicting popularity dynamics via reinforced poisson processes. In Proceedings of the AAAI Conference on Artificial Intelligence, Quebec City, QC, Canada, 27–31 July 2014; Volume 28. [Google Scholar]
  7. Li, Y.; Yu, H.; Liu, L. Predictive Algorithm of Micro-blog Retweet Scale Based on SVM. Appl. Res. Comput. 2013, 30, 2594–2597. [Google Scholar]
  8. Zhang, J.; Tang, J.; Li, J.; Liu, Y.; Xing, C. Who influenced you? predicting retweet via social influence locality. ACM Trans. Knowl. Discov. Data (TKDD) 2015, 9, 1–26. [Google Scholar] [CrossRef]
  9. Turian, J.; Ratinov, L.; Bengio, Y. Word representations: A simple and general method for semi-supervised learning. In Proceedings of the 48th Annual Meeting of the Association for Computational Linguistics, Uppsala, Sweden, 11–16 July 2010; pp. 384–394. [Google Scholar]
  10. Li, H.; Liang, X.; Song, X.; Cai, Q. Visual Analysis of Spatio-Temporal Distribution and Retweet Relation in Weibo Event. In Proceedings of the 2018 IEEE International Conference on Big Data and Smart Computing (BigComp), Shanghai, China, 15–17 January 2018; pp. 9–16. [Google Scholar]
  11. Amati, G.; Angelini, S.; Gambosi, G.; Rossi, G.; Vocca, P. Influential users in Twitter: Detection and evolution analysis. Multimed. Tools Appl. 2019, 78, 3395–3407. [Google Scholar] [CrossRef]
  12. Ribeiro, M.H.; Calais, P.H.; Santos, Y.A.; Almeida, V.A.; Meira Jr, W. Characterizing and detecting hateful users on twitter. In Proceedings of the Twelfth International AAAI Conference on Web and Social Media, Palo Alto, CA, USA, 25–28 June 2018. [Google Scholar]
  13. Zhu, H.; Ren, G.; Qin, D.; Wang, W.; Wei, F.; Cao, Y. Predicting user retweet behaviors based on energy optimization. In Proceedings of the 2016 12th International Conference on Computational Intelligence and Security (CIS), Wuxi, China, 16–19 December 2016; pp. 327–330. [Google Scholar]
  14. Yu, Y.; Rashidi, M.; Samali, B.; Mohammadi, M.; Nguyen, T.N.; Zhou, X. Crack detection of concrete structures using deep convolutional neural networks optimized by enhanced chicken swarm algorithm. Struct. Health Monit. 2022. preprint. [Google Scholar] [CrossRef]
  15. Firdaus, S.N.; Ding, C.; Sadeghian, A. Retweet prediction considering user’s difference as an author and retweeter. In Proceedings of the 2016 IEEE/ACM International Conference on Advances in Social Networks Analysis and Mining (ASONAM), San Francisco, CA, USA, 18–21 August 2016; pp. 852–859. [Google Scholar]
  16. Pramanik, S.; Wang, Q.; Danisch, M.; Guillaume, J.L.; Mitra, B. Modeling cascade formation in Twitter amidst mentions and retweets. Soc. Netw. Anal. Min. 2017, 7, 41. [Google Scholar] [CrossRef]
  17. Symeonidis, S.; Effrosynidis, D.; Arampatzis, A. A comparative evaluation of pre-processing techniques and their interactions for twitter sentiment analysis. Expert Syst. Appl. 2018, 110, 298–310. [Google Scholar] [CrossRef]
  18. Liu, G.; Shi, C.; Chen, Q.; Wu, B.; Qi, J. A two-phase model for retweet number prediction. In Proceedings of the International Conference on Web-Age Information Management, Macau, China, 16–18 June 2014; pp. 781–792. [Google Scholar]
  19. Li, B.; He, M.; Dai, Y.; Cheng, X.; Chen, Y. 3D skeleton based action recognition by video-domain translation-scale invariant mapping and multi-scale dilated CNN. Multimed. Tools Appl. 2018, 77, 22901–22921. [Google Scholar] [CrossRef]
  20. Lu, X.; Yu, Z.; Guo, B.; Zhou, X. Modeling and predicting the re-post behavior in Sina Weibo. In Proceedings of the 2013 IEEE International Conference on Green Computing and Communications and IEEE Internet of Things and IEEE Cyber, Physical and Social Computing, Beijing, China, 20–23 August 2013; pp. 962–969. [Google Scholar]
  21. Xu, Z.; Ru, L.; Xiang, L.; Yang, Q. Discovering user interest on twitter with a modified author-topic model. In Proceedings of the 2011 IEEE/WIC/ACM International Conferences on Web Intelligence and Intelligent Agent Technology, Lyon, France, 22–27 August 2011; Volume 1, pp. 422–429. [Google Scholar]
  22. Gruhl, D.; Guha, R.; Kumar, R.; Novak, J.; Tomkins, A. The predictive power of online chatter. In Proceedings of the Eleventh ACM SIGKDD International Conference on Knowledge Discovery in Data Mining, Chicago, IL, USA, 21–24 August 2005; pp. 78–87. [Google Scholar]
  23. Peng, H.K.; Zhu, J.; Piao, D.; Yan, R.; Zhang, Y. Retweet modeling using conditional random fields. In Proceedings of the 2011 IEEE 11th International Conference on Data Mining Workshops, Vancouver, BC, Canada, 11 December 2011; pp. 336–343. [Google Scholar]
  24. Bengio, Y.; Ducharme, R.; Vincent, P. A neural probabilistic language model. Adv. Neural Inf. Process. Syst. 2000, 13, 1137–1155. [Google Scholar]
  25. Stieglitz, S.; Dang-Xuan, L. Emotions and information diffusion in social media—Sentiment of microblogs and sharing behavior. J. Manag. Inf. Syst. 2013, 29, 217–248. [Google Scholar] [CrossRef]
  26. Lampos, V.; Bie, T.D.; Cristianini, N. Flu detector-tracking epidemics on Twitter. In Proceedings of the Joint European Conference on Machine Learning and Knowledge Discovery in Databases, Barcelona, Spain, 19–23 September 2010; pp. 599–602. [Google Scholar]
  27. Kempe, D.; Kleinberg, J.; Tardos, É. Maximizing the spread of influence through a social network. In Proceedings of the ninth ACM SIGKDD International Conference on Knowledge Discovery and Data Mining, Washington, DC, USA, 24–27 August 2003; pp. 137–146. [Google Scholar]
  28. Langville, A.N.; Meyer, C.D. Deeper inside pagerank. Internet Math. 2004, 1, 335–380. [Google Scholar] [CrossRef]
Figure 1. The diagram of the dilated convolution.
Electronics 11 02585 g001
Figure 2. The structure of RNN and LSTM. (a) the structure of RNN unit; (b) the structure of LSTM unit.
Electronics 11 02585 g002
Figure 3. The learning of group comment features.
Electronics 11 02585 g003
Figure 4. Key sentence extraction based on cluster.
Electronics 11 02585 g004
Figure 5. Two models for vectorization.
Electronics 11 02585 g005
Figure 6. The dilated convolutional layer. (ac) are, respectively, the convolution process with dilation rate k = 1, k = 2, and k = 4.
Electronics 11 02585 g006
Figure 7. The framework diagram of the LSTM prediction model.
Electronics 11 02585 g007
Figure 8. The diagram of BPTT algorithm.
Electronics 11 02585 g008
Figure 9. The training flow chart.
Electronics 11 02585 g009
Figure 10. Time-dependent prediction process based on group information.
Electronics 11 02585 g010
Figure 11. The distribution of a reposting number of the microblog data set.
Electronics 11 02585 g011
Figure 12. The time slice division of dataset.
Electronics 11 02585 g012
Figure 13. The relationship between the amount of reposting and user influence.
Electronics 11 02585 g013
Figure 14. The influence of the publishing time of microblogs.
Electronics 11 02585 g014
Figure 15. The relationship between Epochs and Loss.
Electronics 11 02585 g015
Figure 16. The relationship between Learning rate and RMSE.
Electronics 11 02585 g016
Figure 17. The comparison of model performance. (ac), respectively, are different reposting scales.
Electronics 11 02585 g017
Table 1. Common microblog features.
FeatureDescriptionValue
BIDBlogger identity(0,1)
BIFBlogger influence{0–1}
BRHThe blogger’s recent microblog heat[0–1}
BRTBlogger registration time[1–10]
MLMicroblog length{0,1}
EXExclamation{0,1}
NOCNumber of concerns[0–1]
NOFNumber of fans[0–1]
QMQuestion marks{0–1}
TTTopic tags[0–100]
PTPPublishing time period(0, 1, 2, 3, 4, 5)
IUIncludes URL{0,1}
IHIncludes hashtags{0,1}
IUInclude username{0,1}
Table 2. Original data set.
Dataset#Users#Follow#Original#Retweets
Sina microblog17,776,950308,489,739300,00023,755,810
Table 3. Some attributes of the data set.
Attributes of Source MicroblogNumber
Number of original microblog312,310
Reposting time23,755,812
Number of users176,695
Average reposting number78
Table 4. The ranking of user influence.
Overall RankingUser
1xin***ji
2hua***bao
3hong***k
4jing***lu
5xing***yu
6li***fu
7xin***kan
8ai***er
9qi***zhi
10wei***xia
Table 5. Some data of microblog influence.
UsernameNumber of FansNumber of FollowingNumber of MicroblogInfluenceRate of Being Reposted
guai***E13780210.350.165233
fa***a125603010.320.190243
X***xiao108551730.300.153745
t***cao80551120.220.139732
rong***y73531530.220.122463
dong***er5018250.180.102345
D***d3653800.170.112310
tang***y3717290.130.103345
han***yi27851000.130.093542
B***zhong3280130.140.152582
Table 6. The parameter setting of the model.
HyperparameterValue
epochs150
learning rate0.1
Dropout0.5
Embedding Size300
BatchSize120
kennel size128 (5 × 5) + 64 (3 × 3)
LSTM unit2 × 30
Table 7. The results of experiment on propagation trends.
Method   70%      80%   
   RMSEMAPEMAERMSEMAPEMAE
LR35.8442.1036.5436.0338.0735.55
S-H34.0350.1327.0336.0249.4426.51
BP27.0928.4826.0526.8328.2327.32
RPP17.9225.4125.5917.9225.4125.59
BCI16.8223.5525.1116.3223.1524.21
MP512.0835.0418.0211.8332.0418.17
T-P10.4523.6625.0110.2223.2324.11
LSTM9.86224.9919.389.08523.4218.34
Proposed model7.33523.2118.777.23322.8917.99
Publisher’s Note: MDPI stays neutral with regard to jurisdictional claims in published maps and institutional affiliations.

