1. Introduction
Video monitoring systems (VMSs) are one of the most important electronic security systems (ESS). They operate in buildings, open areas, parking lots, logistics bases, airports, etc., and extensive public and railway areas [
1,
2,
3]. Depending on the operational mode within extensive areas in warehouse and railway facilities, VMSs can be divided into two groups:
Stationary, i.e., operated in facilities permanently set on the ground (foundations), e.g., railway stations, platforms, tunnels, level crossings, turnpikes, underground passages, warehouses and logistics bases storing spare parts, repair workshops, parking spaces—parking lots, warehouse buildings, driveways, etc. [
4,
5,
6];
Non-stationary (facilities not permanently fixed to the ground)—e.g., locomotives, electric multiple units, electric locomotives, passenger and freight carriages, trucks, mass transit vehicles and vehicles intended for transporting various materials, etc. [
7,
8,
9].
Both VMS and all ESSs (especially the fire alarm system—FAS) must send information on their ongoing technical status via two independent telecommunication channels to an Alarm Receiving Centre (ARC) or the State Fire Service (PSP) [
10]. The most important ESS operational technical states include the states of alerting, monitoring and damage, whereas the latter is sent only to ARC in the case of FAS [
11]. The use of two independent telecommunications channels to exchange information within security systems is associated with ensuring a certain level of reliability, especially in the case of alerting states [
12]. In the case of stationary and non-stationary VMSs within a railway area, the facilities of which are classified as the so-called state critical infrastructure (SCI), it is essential to ensure proper organization of the entire system notifying of threats within a railway area and not only the VMSs [
12,
13]. This is why the following telecommunications lines are set up for stationary and non-stationary VMSs:
Stationary VMS—Permanent telecommunications link in the form of a leased telephone line using a railway optical fibre network (protected against wide-frequency band electromagnetic interference within the railway area), as well as a wireless (encrypted) link with a modular signal, which is IT-protected against an intentional third-party and internal attack [
14,
15];
Non-stationary VMS—Two independent wireless telecommunications links utilizing various transmitter carrier frequencies, modulated with a digital signal in alarm control units (ACU), which are resistant to electromagnetic interference generated within an extensive railway area, encrypted with appropriate transceiving antenna characteristics [
16,
17].
In addition, in the case of stationary and non-stationary VMSs, all technical facilities that utilize this system shall be equipped with a local device for recording video-recorder signals of specified external memory size, the technical parameters of which are set out in domestic regulations (e.g., stadiums) [
18,
19,
20].
A supplementary and very important issue associated with the VMS and ESS operation process is ensuring specific power supply reliability for these systems operated in a stationary and non-stationary manner [
21,
22]. ESS shall have ensured basic power supply—from an industrial power grid (stationary facilities) or via transducers from a railway overhead contact line (3 kV DC) (non-stationary facilities) [
23,
24]. Backup power supply, most often in the form of a battery bank of specific capacity determined by the power balance, is organized in order to guarantee proper ESS functioning in the event of basic power supply failure. This guarantees the functioning of these systems in the monitoring and alerting modes for a time specified by regulations and standards [
25,
26]. Information on the technical condition of a backup power supply (e.g., battery bank or UPS voltage level, etc.) shall be monitored continuously by the security system alarm control unit, and the information regarding this parameter should be sent to ARC, just like other security signals. In addition, battery banks are located in a metal housing with ACU. The metal housing is locked with a coded lock. In addition, it is monitored with an anti-tampering contact, which generates an alert signal in the event of an unauthorized opening [
12,
25].
An extensive railway area experiences a distorted electromagnetic environment generated by stationary (radio transmitters and TV transmitters, GSM-R, power supply and overhead contact network, etc.) or non-stationary (electric multiple units, rail carriages, portable security system transmitters, etc.) radiation sources [
27,
28]. Electromagnetic radiation within a railway area is generated intentionally—e.g., wireless signals of security systems, cellular telephony such as GSM—these signals will be used by authorized railway services. Other sources generate unintentional electromagnetic radiation—e.g., power supply, railway overhead traction lines, high current and voltage consumers—e.g., traction converters, locomotive motors present within these areas [
29,
30]. Electromagnetic interference generated within a railway area is characterized by a very broad spectrum, from low (single Hz) to very high (single GHz) frequencies. This is due to this railway system accumulating various sources of radiation used by railway workers, as well as power supply and overhead contact line systems used by the pantographs of electric locomotives to draw high-value current (in the order of several dozen kA) upon startup for a short period. It is a serious problem related to the distortion of the electromagnetic environment within such a railway area. Therefore, conducted and radiated interference shall be considered [
31,
32,
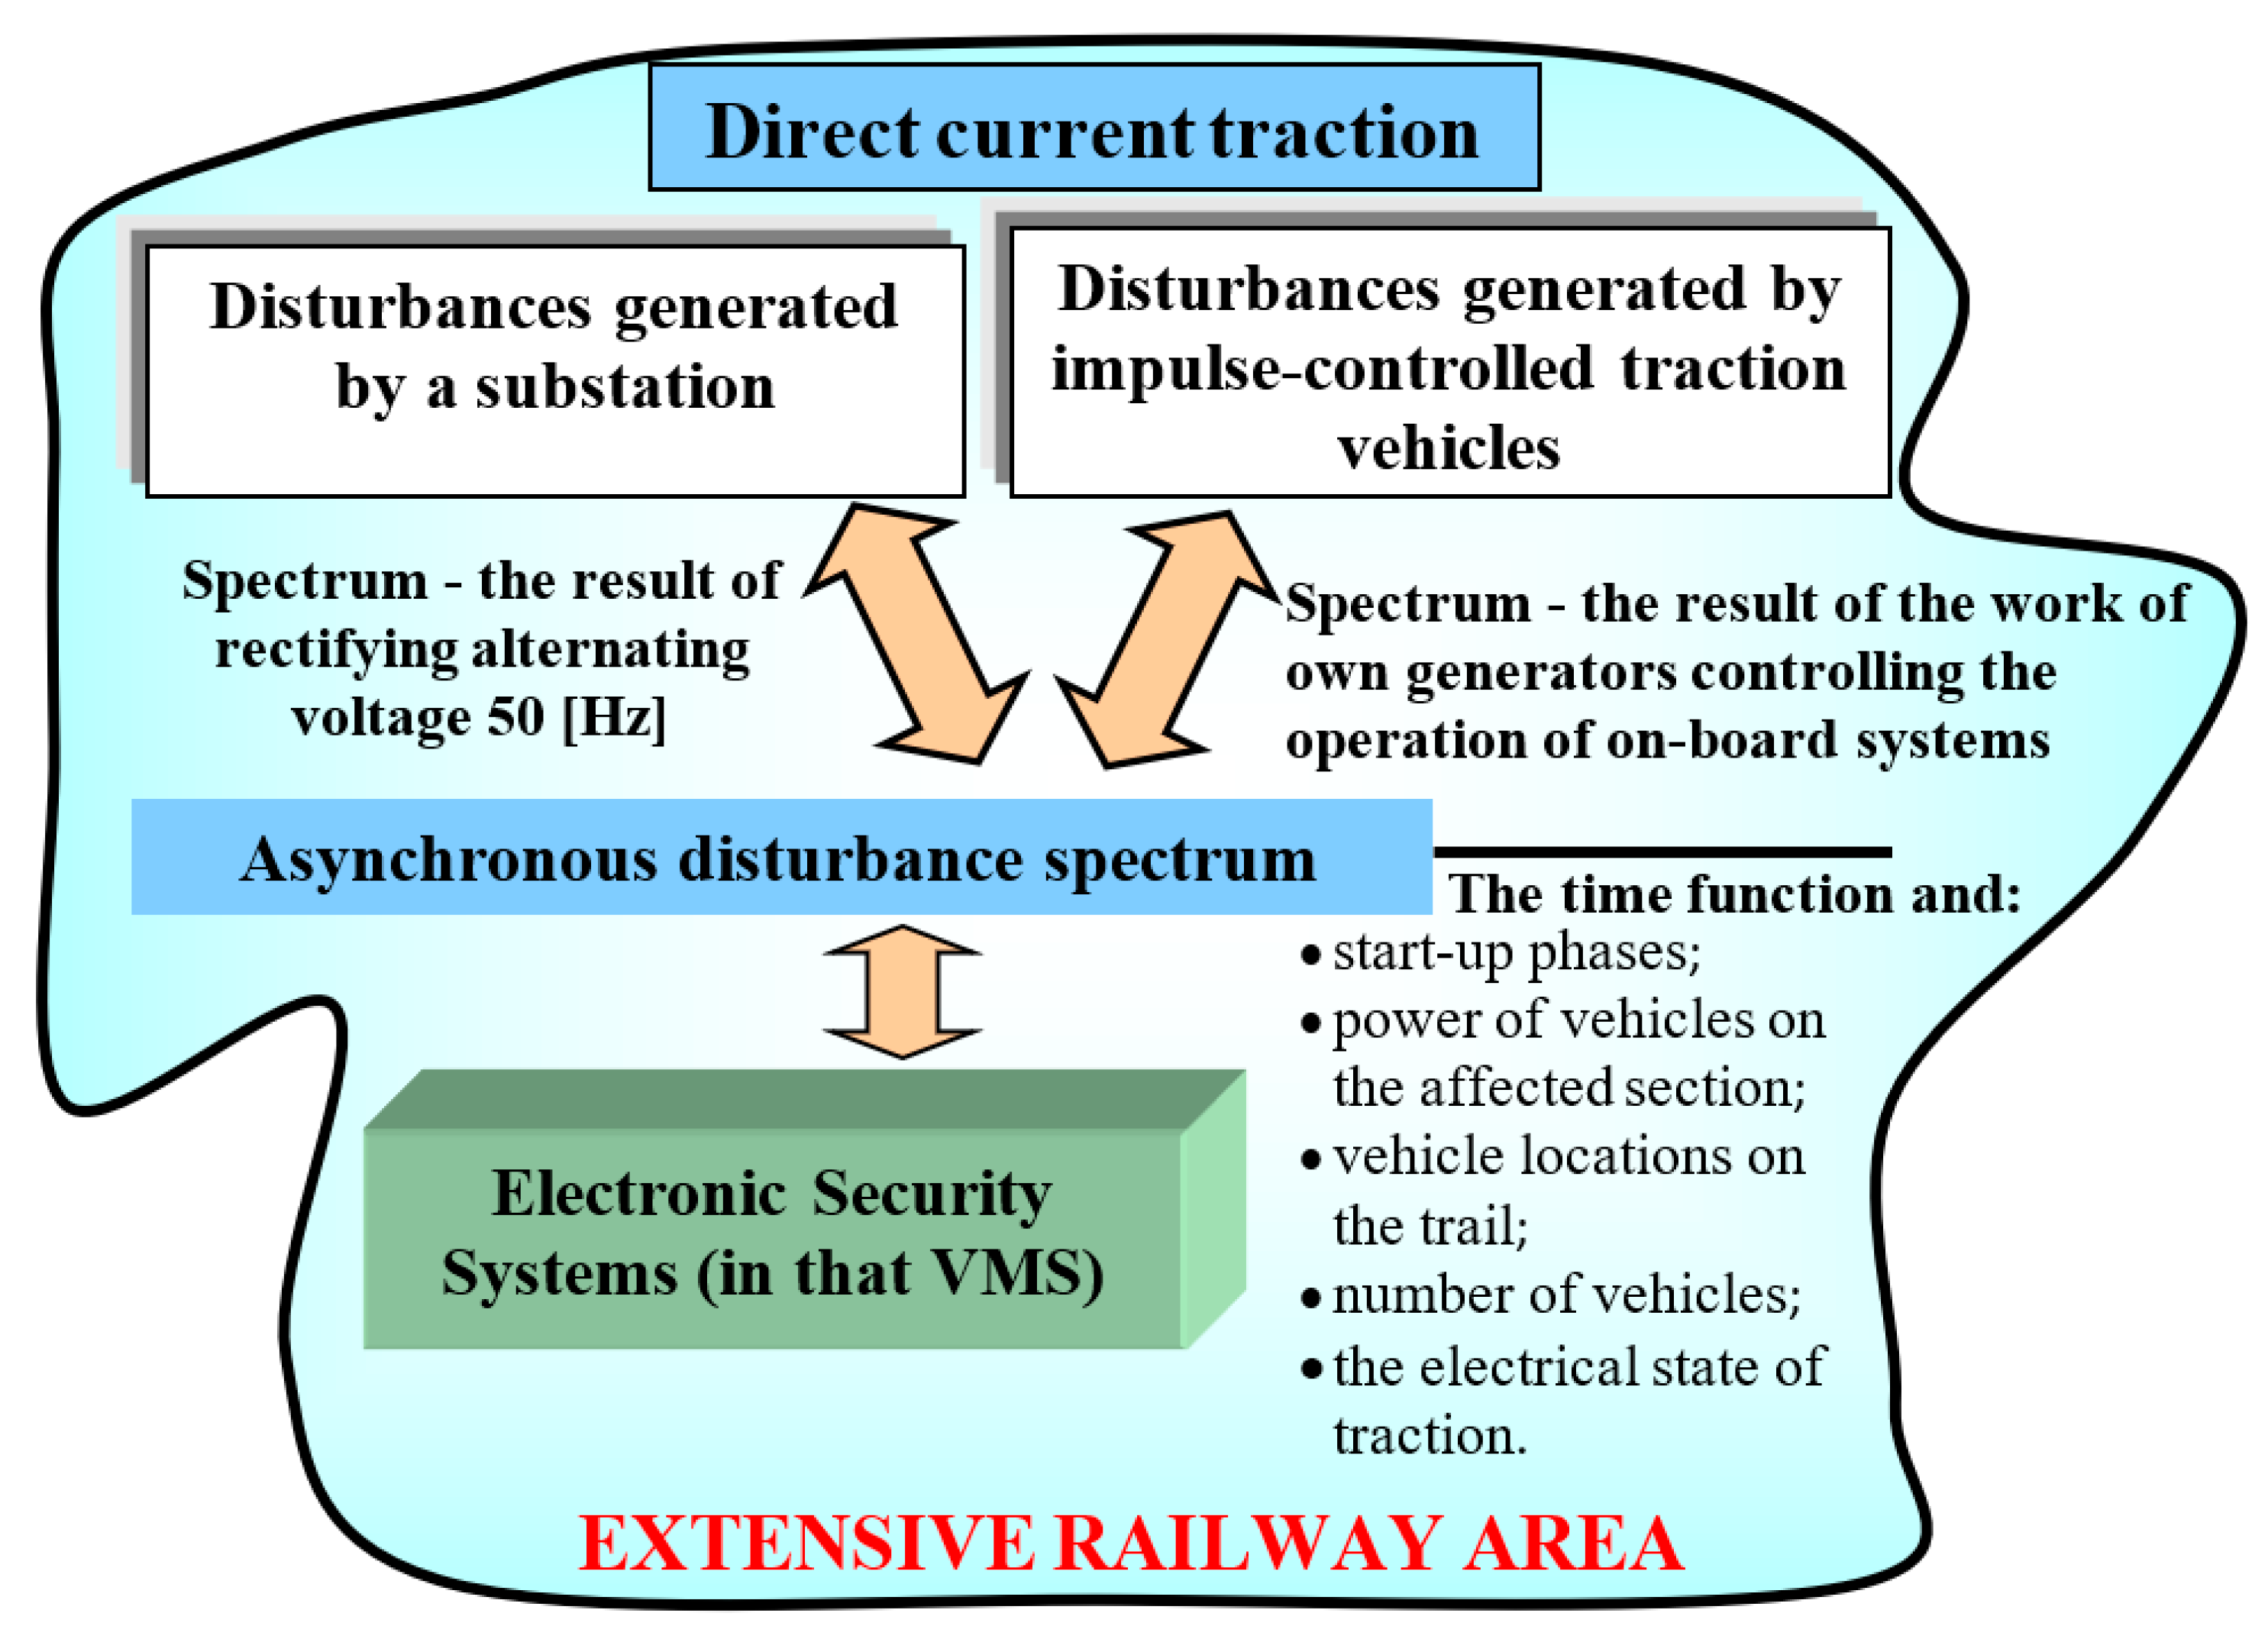
33]. The selected aforementioned issues of ESS and VMS operation throughout an extensive railway area are presented in
Figure 1.
Figure 1 shows only the selected operational aspects of ESS use within an extensive railway area. The geometric figure in No. 12 shows examples of regions with low and high-frequency band electromagnetic interference originating only from overhead contact lines and systems supplying the entire railway area. High-frequency band electromagnetic interference, so-called radiated interference, occurs throughout the railway area, and its value depends on, among others, distance from the source of a signal generated intentionally or unintentionally.
The rest of this article is organized as follows.
Section 2 is a critical review of the source literature on the current state of the issue in question. The analysis of fundamental issues related to the measurement method and test results involving interfering electromagnetic signals make up
Section 3.
Section 4 presents a reliability and operation simulation of a CCTV system for selected damage intensities. It also contains simulation results. The final, fifth chapter contains conclusions arising from the conducted tests and computer simulations.
2. Literature Review
Variable environmental conditions, a change in low- and high-frequency electromagnetic interference level in particular (conducted, coupled L, C and radiated interference) is one of the significant factors [
34,
35,
36] leading to a direct change in the damage intensity
λ. This operating parameter
λ directly impacts the reliability of VMS elements, modules and devices, as well as VMS functioning. Therefore, the authors of [
37,
38,
39] discussed electromagnetic interference from the entire frequency band generated within an extensive railway area, specifying their levels, amplitudes and spectra [
40,
41]; however, they failed to analyse their impact on the reliability of individual system elements (e.g., camera, recorded, switch, etc.) or the entire VMS.
Variable, pulsed, and non-linear power supply line loads of high inrush currents can present within an overhead railway line and lead to current harmonics appearing in power supply lines [
42,
43,
44]. They can cause VMS and ESS functioning interference and be the reason for additional losses in transformer cores and traction vehicle startup motors. The pulsed loads occurring within the power supply and overhead contact networks also cause changed rated voltages [
45,
46]. This may lead to unacceptable changes in the guaranteed voltage level (U = 12 V) for individual VMS elements [
43,
47]. The presence of harmonics in a power supply and overhead contact network [
48,
49] also means additional losses in the cables themselves, especially the ones supplying individual VMS and ESS elements (e.g., cameras), which are distributed throughout an extensive railway area (e.g., failure to satisfy the condition of permissible supply line voltage dip) [
50,
51,
52]. The presented source literature on the phenomena in power supply lines does not reference a change in damage intensity
λ. The studies conducted by the article’s authors enable assessing the impact of the aforementioned interference on VMS reliability.
A variable, pulsed load in an overhead contact line and power lines supplying an extensive railway area cause electromagnetic interference of large amplitudes from within the entire frequency band [
53,
54,
55]. The occurring electromagnetic interference that causes conducted interference (e.g., common grounding impedance), inductance coupling or parasitic capacitances for VMS elements or devices through signal lines or cables providing the supply voltage [
56,
57,
58]. Conducted interference from a higher frequency band (above 30 MHz) propagates into the surrounding space within a railway area through the generally available environment [
59,
60]. Individual VMS elements and devices with external conduits or metal housings with openings and wide bandwidth antennas are treated by these interfering signals as parasitic signal receivers [
61]. In their articles, the authors did not analyse the impact of interference on the reliability of electronic components. In the case of non-linear elements that comprise VMS, these signals may interfere with or change the processing characteristics or cause the presence of intermodulation phenomena [
62,
63]. In the course of studying the characteristics of radiated interference generated within a railway area, a method was proposed that would enable the determination of a change in the intensity index
λ for VMS elements or equipment operated within such a railway area.
An important issue related to security systems, including VMS, is also the process of diagnosing their technical condition [
64,
65,
66]. Generally available articles and studies present general assumptions of measurement systems that implement this important operational process under the following static and dynamic conditions, employing various diagnostic techniques and technical solutions [
12,
17,
67]. However, these studies do not take into account the impact of natural or artificial electromagnetic interference present within a railway area. They result from, e.g., long signal loops of cameras, control lines for PTZ cameras and devices transmitting an alert or damage state [
17,
68,
69]. The authors of the said papers mitigated these errors contributed by interfering signals [
12,
70]. Testing the electromagnetic interference present in a railway environment, as well as the observation and measurement of output signals in alarm control units where the decision-making process takes place—i.e., conditioning and working out output waveforms—enables determining the impact of the aforementioned factors, e.g., on the output signal informing about the monitoring, alerting or damage state, or other forced operation process [
12,
17,
65,
71].
An important issue associated with the VMS operation processes is the transmission of video, alerting, monitoring, or damage signals to ARC [
12,
72,
73]. The authors of published articles took only the basic problems into account. This included reliability, availability, quality or, e.g., transmission time to ARC [
17,
74,
75]. In contrast, the authors of the developed article also conducted an analysis of notification and ARC service response to a damage signal [
12,
17,
76]. The calculations conducted as part of this article included this parameter, e.g., in VMS recovery intensity µ [
12,
17,
77]. It is an issue that is particularly important for restoring a VMS to an original (initial) state—i.e., the state of fitness of an entire system [
78,
79,
80,
81].
The authors were unable to find cases (research, results, as well as theoretical analysis) focusing on the impact of unintentional electromagnetic field emissions within this frequency range on the operation process of electronic systems, VMS in this case, within the analysed articles presented in the critical source literature review. A railway VMS system is responsible for traffic safety. It is one of the priority systems besides the railway traffic control system. The article is the first of its kind in this field, which addresses issues associated with the impact of unintentional electromagnetic field emissions within a selected frequency range on the operation process, i.e., reliability or the availability factor. This is preliminary research, and the authors plan to extend it to various rail vehicles.
3. Analysis of Basic Issues Related to the Method of Measuring Radiated Interfering Electromagnetic Signals and Test Results
The intensities of radiated electromagnetic fields generated over an extensive railway area were measured in accordance with applicable legal regulations, namely the PN-EN 50121 series of standards applicable in Poland and the European Union. The tests were conducted within the premises of the Railway Institute Test Track Operation Centre (OETD) for cases of an electric locomotive travelling at a specific speed, over a railway track, and in a static, i.e., parking, state, in accordance with the PN-EN 50121-3-1 and PN-EN 50121-2 standards. Satisfying specific technical requirements is important in order to conduct the tests (position of the measuring point at the OETD).
Determining the magnitude of low-frequency and radiated electromagnetic interference occurring within a vast railway area requires identifying the following technical parameters exhibited by power supply circuits:
So-called high-current power supply circuits, i.e., traction substations, overhead contact line, traction vehicle consumer network;
So-called low-current power supply circuits, e.g., rail traffic control systems, telecommunications systems, electronic security systems—including VMS surveillance TV, etc.
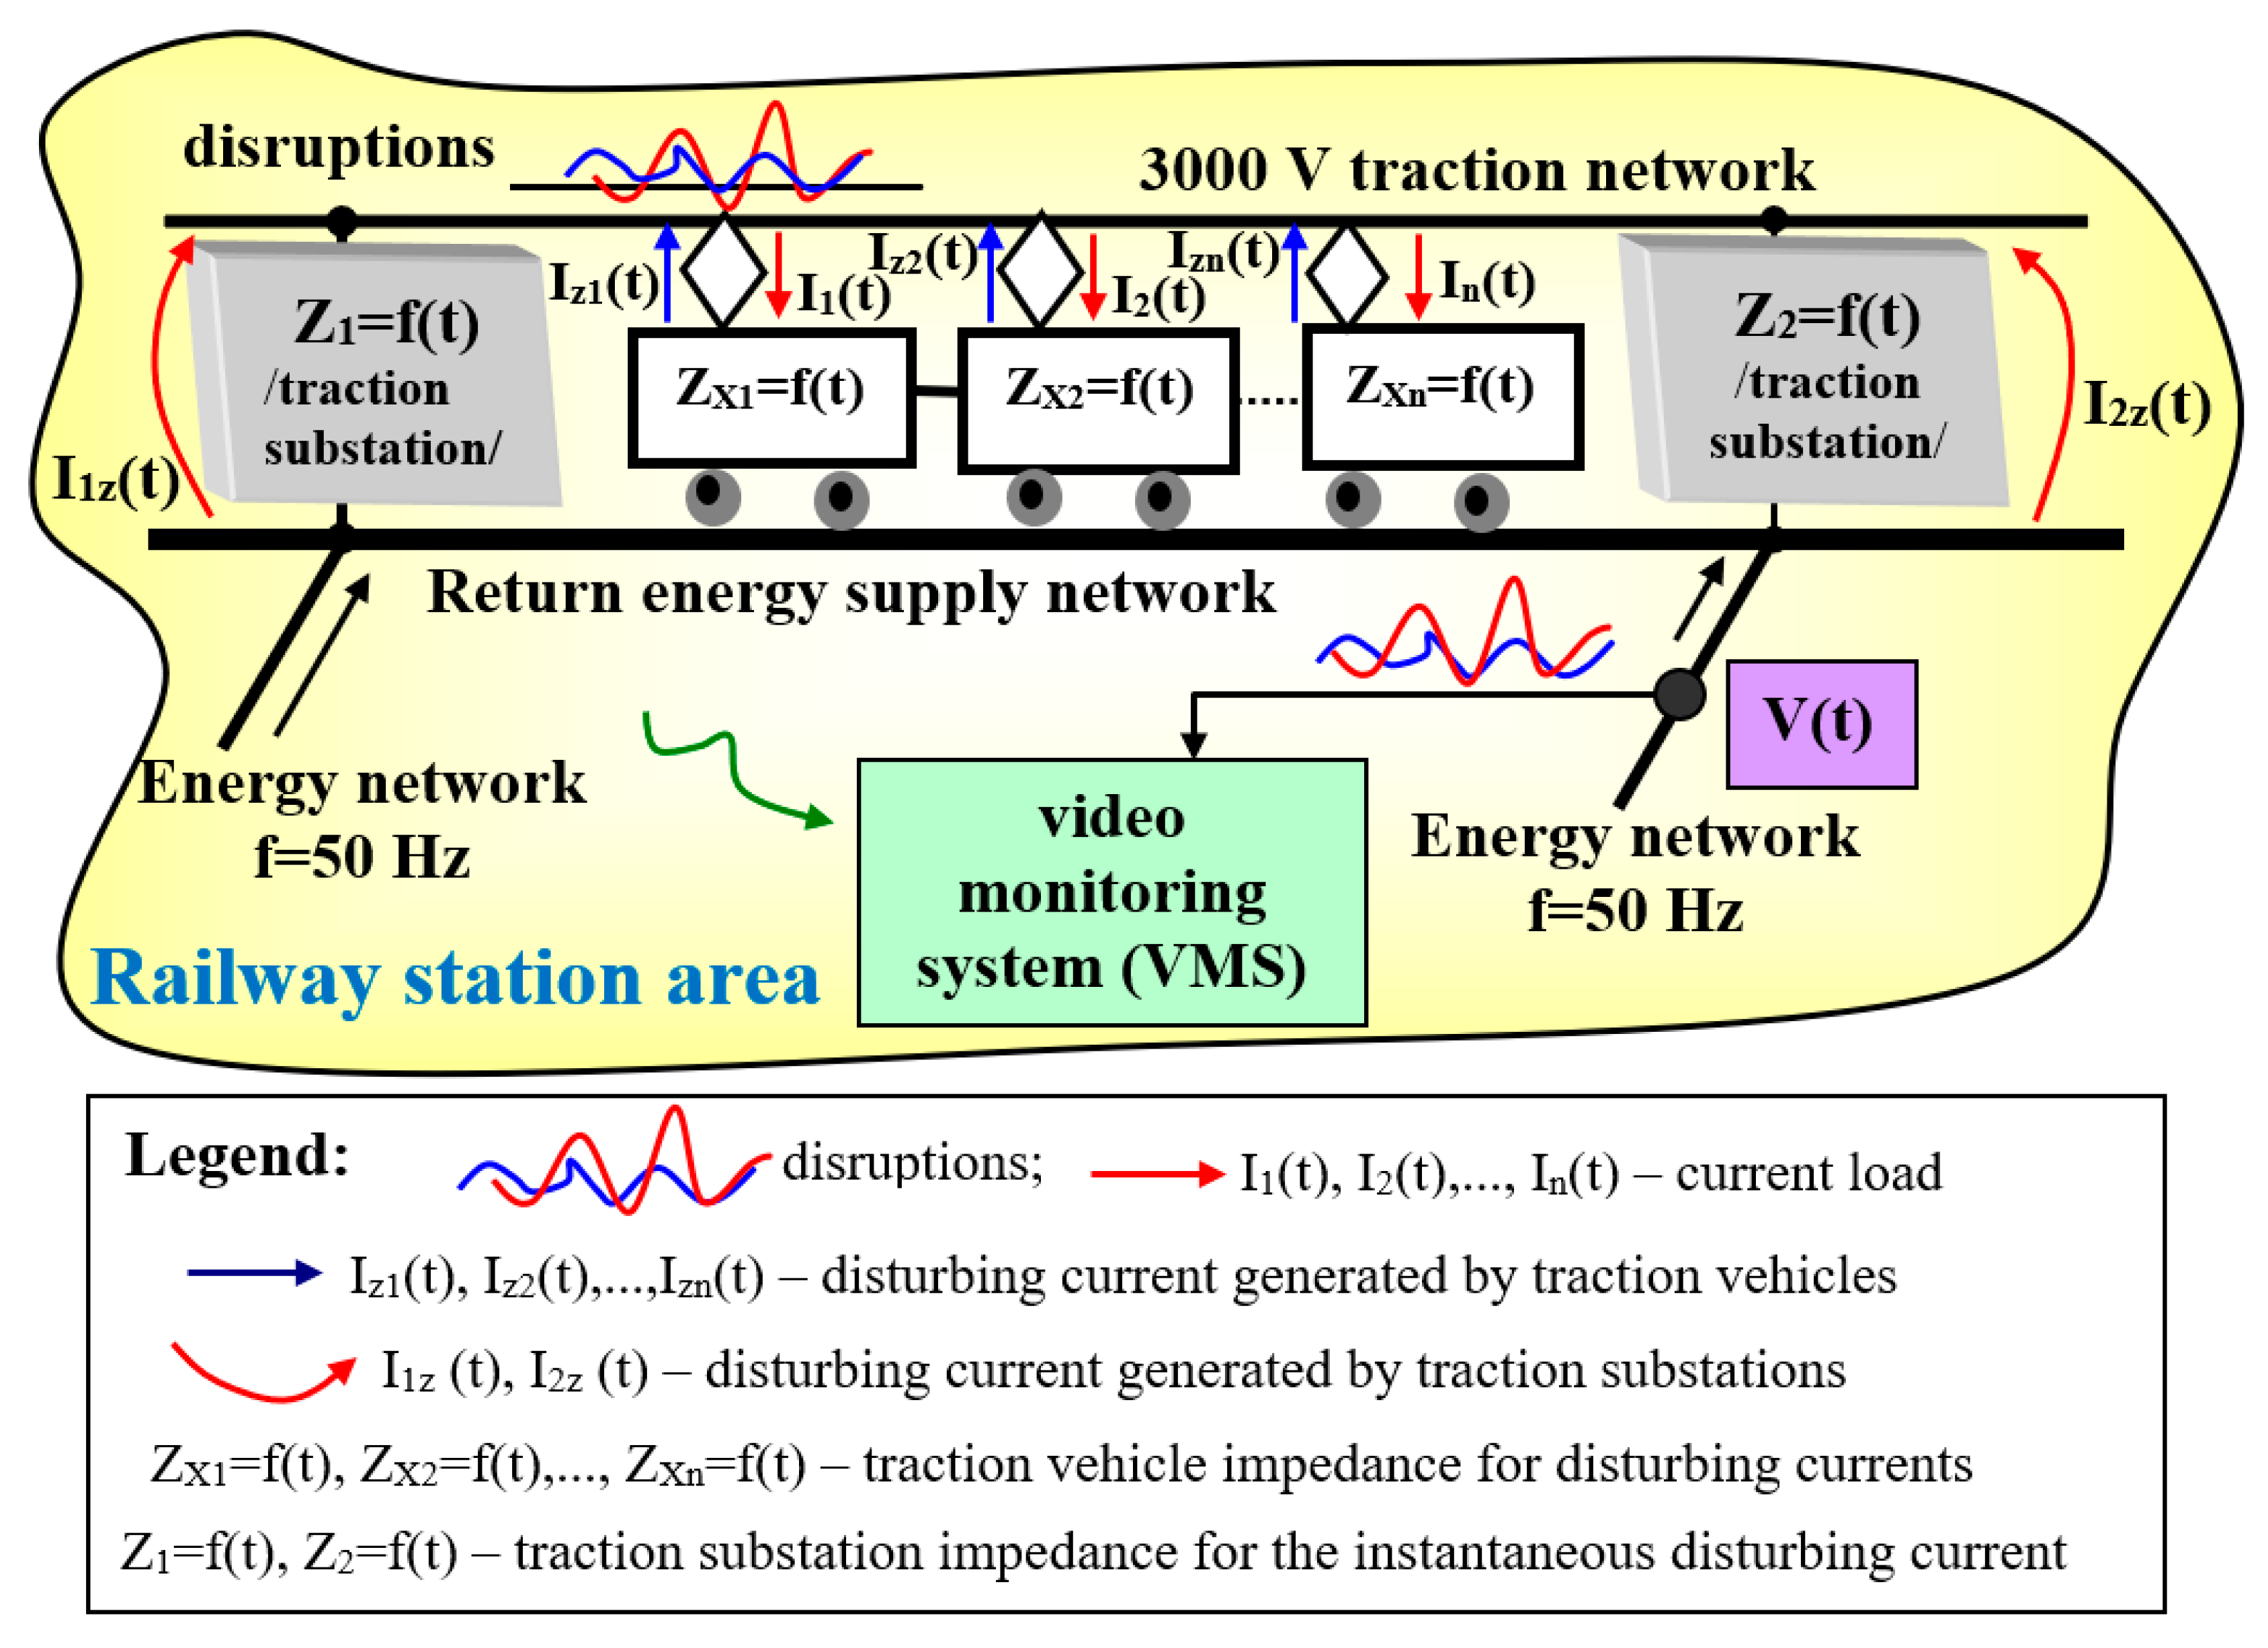
Electromagnetic interference generated by a substation and traction vehicles is asynchronous due to the DC railway overhead traction line, unlike AC overhead contract lines, which experience synchronous interference, as shown in
Figure 2. An AC traction has a one-sided power supply, which means that each next railway overhead contact line is powered from a different phase. The interference (interference spectrum) generated within an overhead contact line and by traction vehicles are synchronized with the fundamental frequency for a given traction power supply system.
Within an overhead contact line supplying railway vehicles, the value and shape of the interfering variable component and the radiated electromagnetic field emissions are impacted by the following parameters:
Values of currents generated by individual consumer sources ZX1 = f(t), ZX2 = f(t), …, ZXn = f(t)—impedances for individual traction vehicles within a railway line;
Interfering variable components generated by overhead contact line power supply substations Z1 = f(t), Z2 = f(t) under the influence of a variable load and having its own load signal processing characteristics I1(t), I2(t), …, In(t).
The value of radiated interference occurring within an overhead contact line is also impacted by the current location of a given traction vehicle within the line and its impedance relative to this point. Individual radiated emission interfering signals generated by current consumers (traction vehicles) also depend on the amplitudes and phases of harmonics originating from individual traction substations Z
1 = f(t), Z
2 = f(t), as shown in
Figure 3.
The most important issues related to the position of the measurement stand and the lack of external environmental impact [
82,
83,
84,
85] on measurement accuracy include:
No large vegetation, shrubs, and trees in the nearest vicinity (approximately 30 m) around the measuring point, which would significantly distort the electric field for different frequency bands;
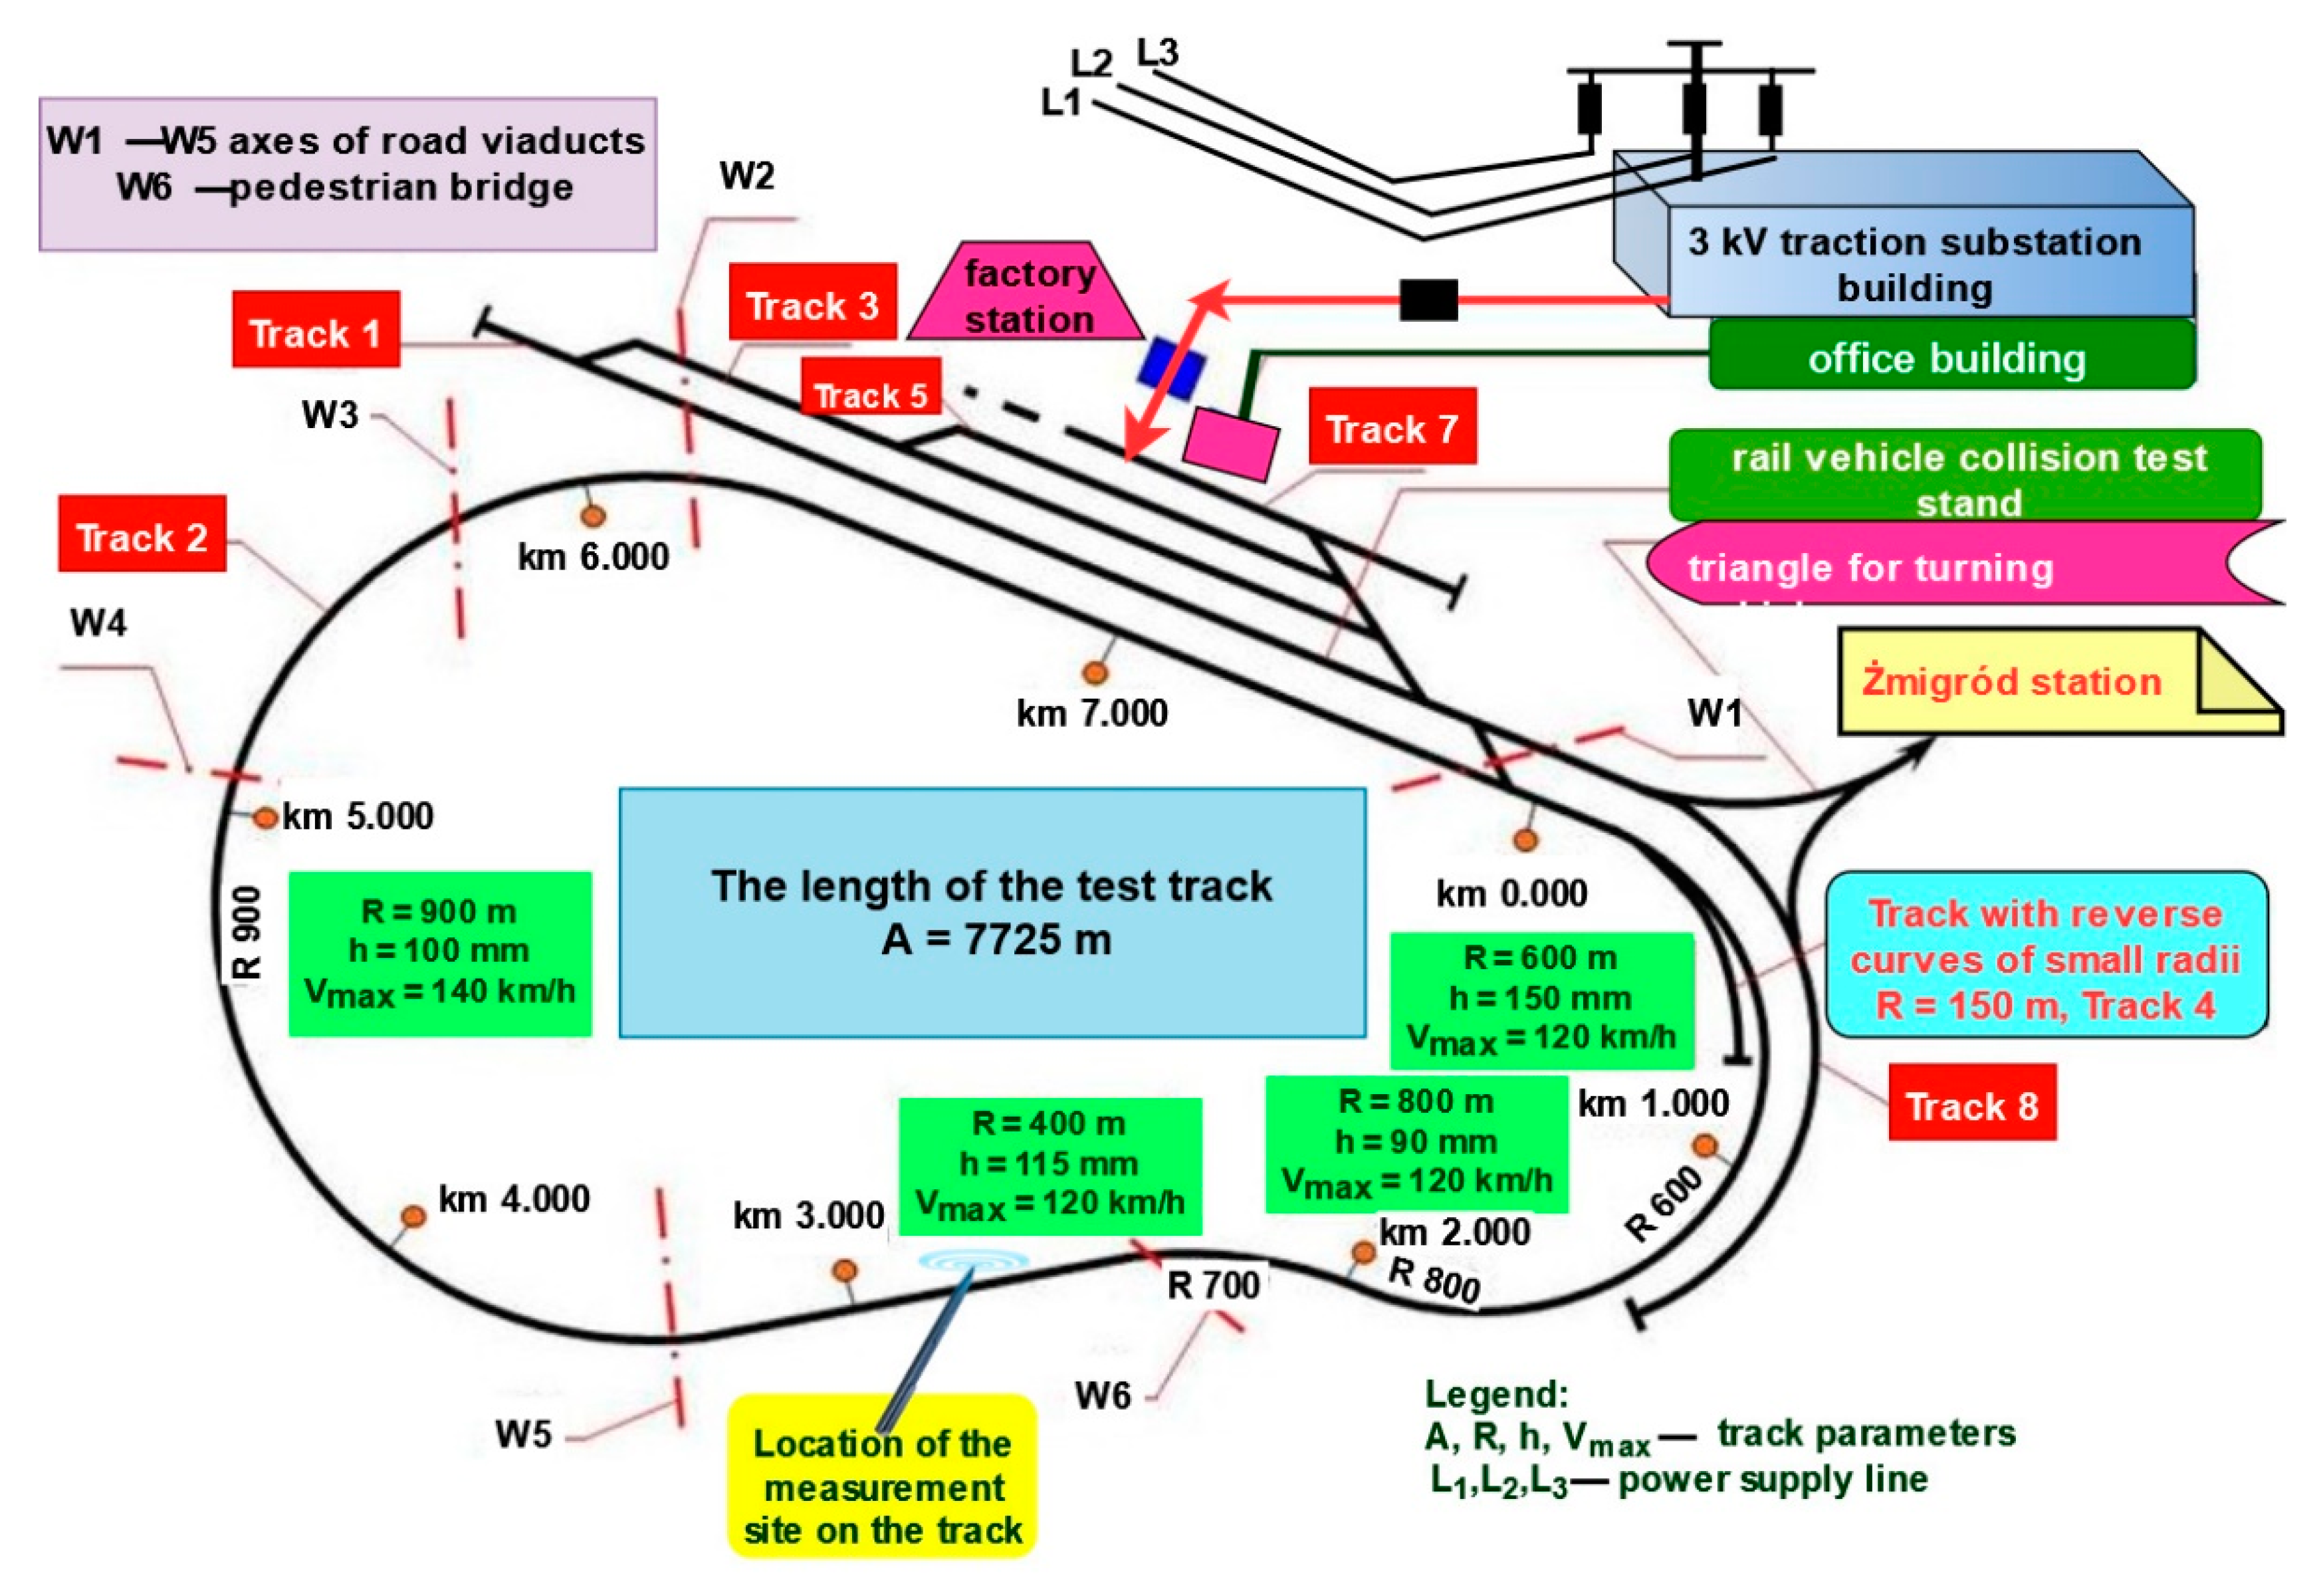
No railway buildings, metal fences, traction substations or power grid transformer stations would adversely impact the electromagnetic environment throughout the entire frequency range, as shown in
Figure 4;
No other systems, e.g., railway traffic control systems, blocks, or line control systems (LCS);
No other traction vehicles in the vicinity of a measurement point, moving along the same tracks or in a state of parking, which may or may not be powered from an overhead contact line. Rail vehicles may be the source of secondary electromagnetic radiation (wave reflection, interference, etc.) or may spontaneously and unintentionally generate their own electromagnetic field that will impact the accuracy of conducted measurements.
The electromagnetic compatibility tests discussed in the article were conducted at the Railway Institute Test Track located near Żmigród, as shown in
Figure 4. It is a curvilinear, closed, circular and 7725 m long track. It has a straight section of more than 1 km, which enables testing the dynamic behaviour of rail vehicles, with a rail track speed limit equal to 160 km/h, as shown in
Figure 4.
Approving a rail vehicle to traffic on a railway route, in accordance with legal regulations applicable in Poland, requires, among others, measuring the emission of radiated interference. It is one of the frequency ranges of unintentional electromagnetic radiation generated by a rail vehicle travelling on a track. It is associated with the high electricity consumption by the pantograph from an overhead line (3 kV DC) and the processing of signals in drive systems (devices)—traction converters and motors [
86,
87,
88,
89]. Electromagnetic compatibility (EMC) tests not only involve radiated interference frequency but also require measuring the magnetic and electric field within the low-frequency ranges—up to 100 kHz. This article refers to the impact of higher frequency ranges on one of the security systems installed and commonly operated within a railway area, namely, a CCTV system. When considering the impact of the electromagnetic field from the entire spectrum of interfering signals on electronic elements and devices, individual frequency subranges should be taken into account separately [
10,
90]. These ranges should be divided in accordance with the current division applicable to the method for measuring electromagnetic compatibility. Electromagnetic interference penetrates electronic elements and devices of ESS in various ways, e.g., mutual low-frequency range impedance, parasitic inductances or PCB capacitances or the phenomenon of interfering electromagnetic field radiation. In this case, a travelling railway vehicle is a common source of undesired signals. One of the many electromagnetic compatibility tests required by appropriate authorities (e.g., Office of Rail Transport) to approve a vehicle to operate within the Polish railway infrastructure is the test involving radiated interfering electromagnetic signals. The test should be conducted in accordance with the methodology set out in PN-EN 50121-3-1 and PN-EN 50121-2, within a strictly defined frequency band, from 150 kHz to 1 GHz, using specialized measuring antennas that take into account the division into two measurement subranges:
Measurement of the magnetic component of electromagnetic field strength in the frequency range: 150 kHz ÷ 30 MHz using a frame (loop) antenna;
Measurement of the electric component of electromagnetic field strength in the frequency range: 30 MHz ÷ 1 GHz using two antennas: biconical and log-periodic.
Whereas the traction unit itself is tested in two operating modes:
During parking (stationary), with all power consumers onboard the rail vehicle switched on and consuming maximum power;
During travel (dynamic) with the permissible speed equal to 50 ± 10 km/h.
During the measurement of the electromagnetic compatibility for the two-rail vehicle operating modes referred to above, all devices and systems installed onboard the vehicle, i.e., A/C system, ETCS, passenger information system, internal and external lighting, including electronic security systems installed within such a technical structure are switched on. The traction vehicle should then be consuming maximum power (current) from the 3 kV supply overhead line. In the event of in-parking tests, the measurement point is set where the highest level of the vehicle’s radiated interference is emitted. It is determined using trial runs and a measuring antenna. Measurement during parking is conducted using a quasi-peak detector. Whereas in the travel mode, the traction vehicle should accelerate or decelerate, using 1/3 of the maximum tractive force, within a strictly defined speed range. In order to eliminate interference originating from the 3 kV overhead line current collector, the in-test speed was limited to 50 km/h and the power to 1/3 of the maximum tractive force.
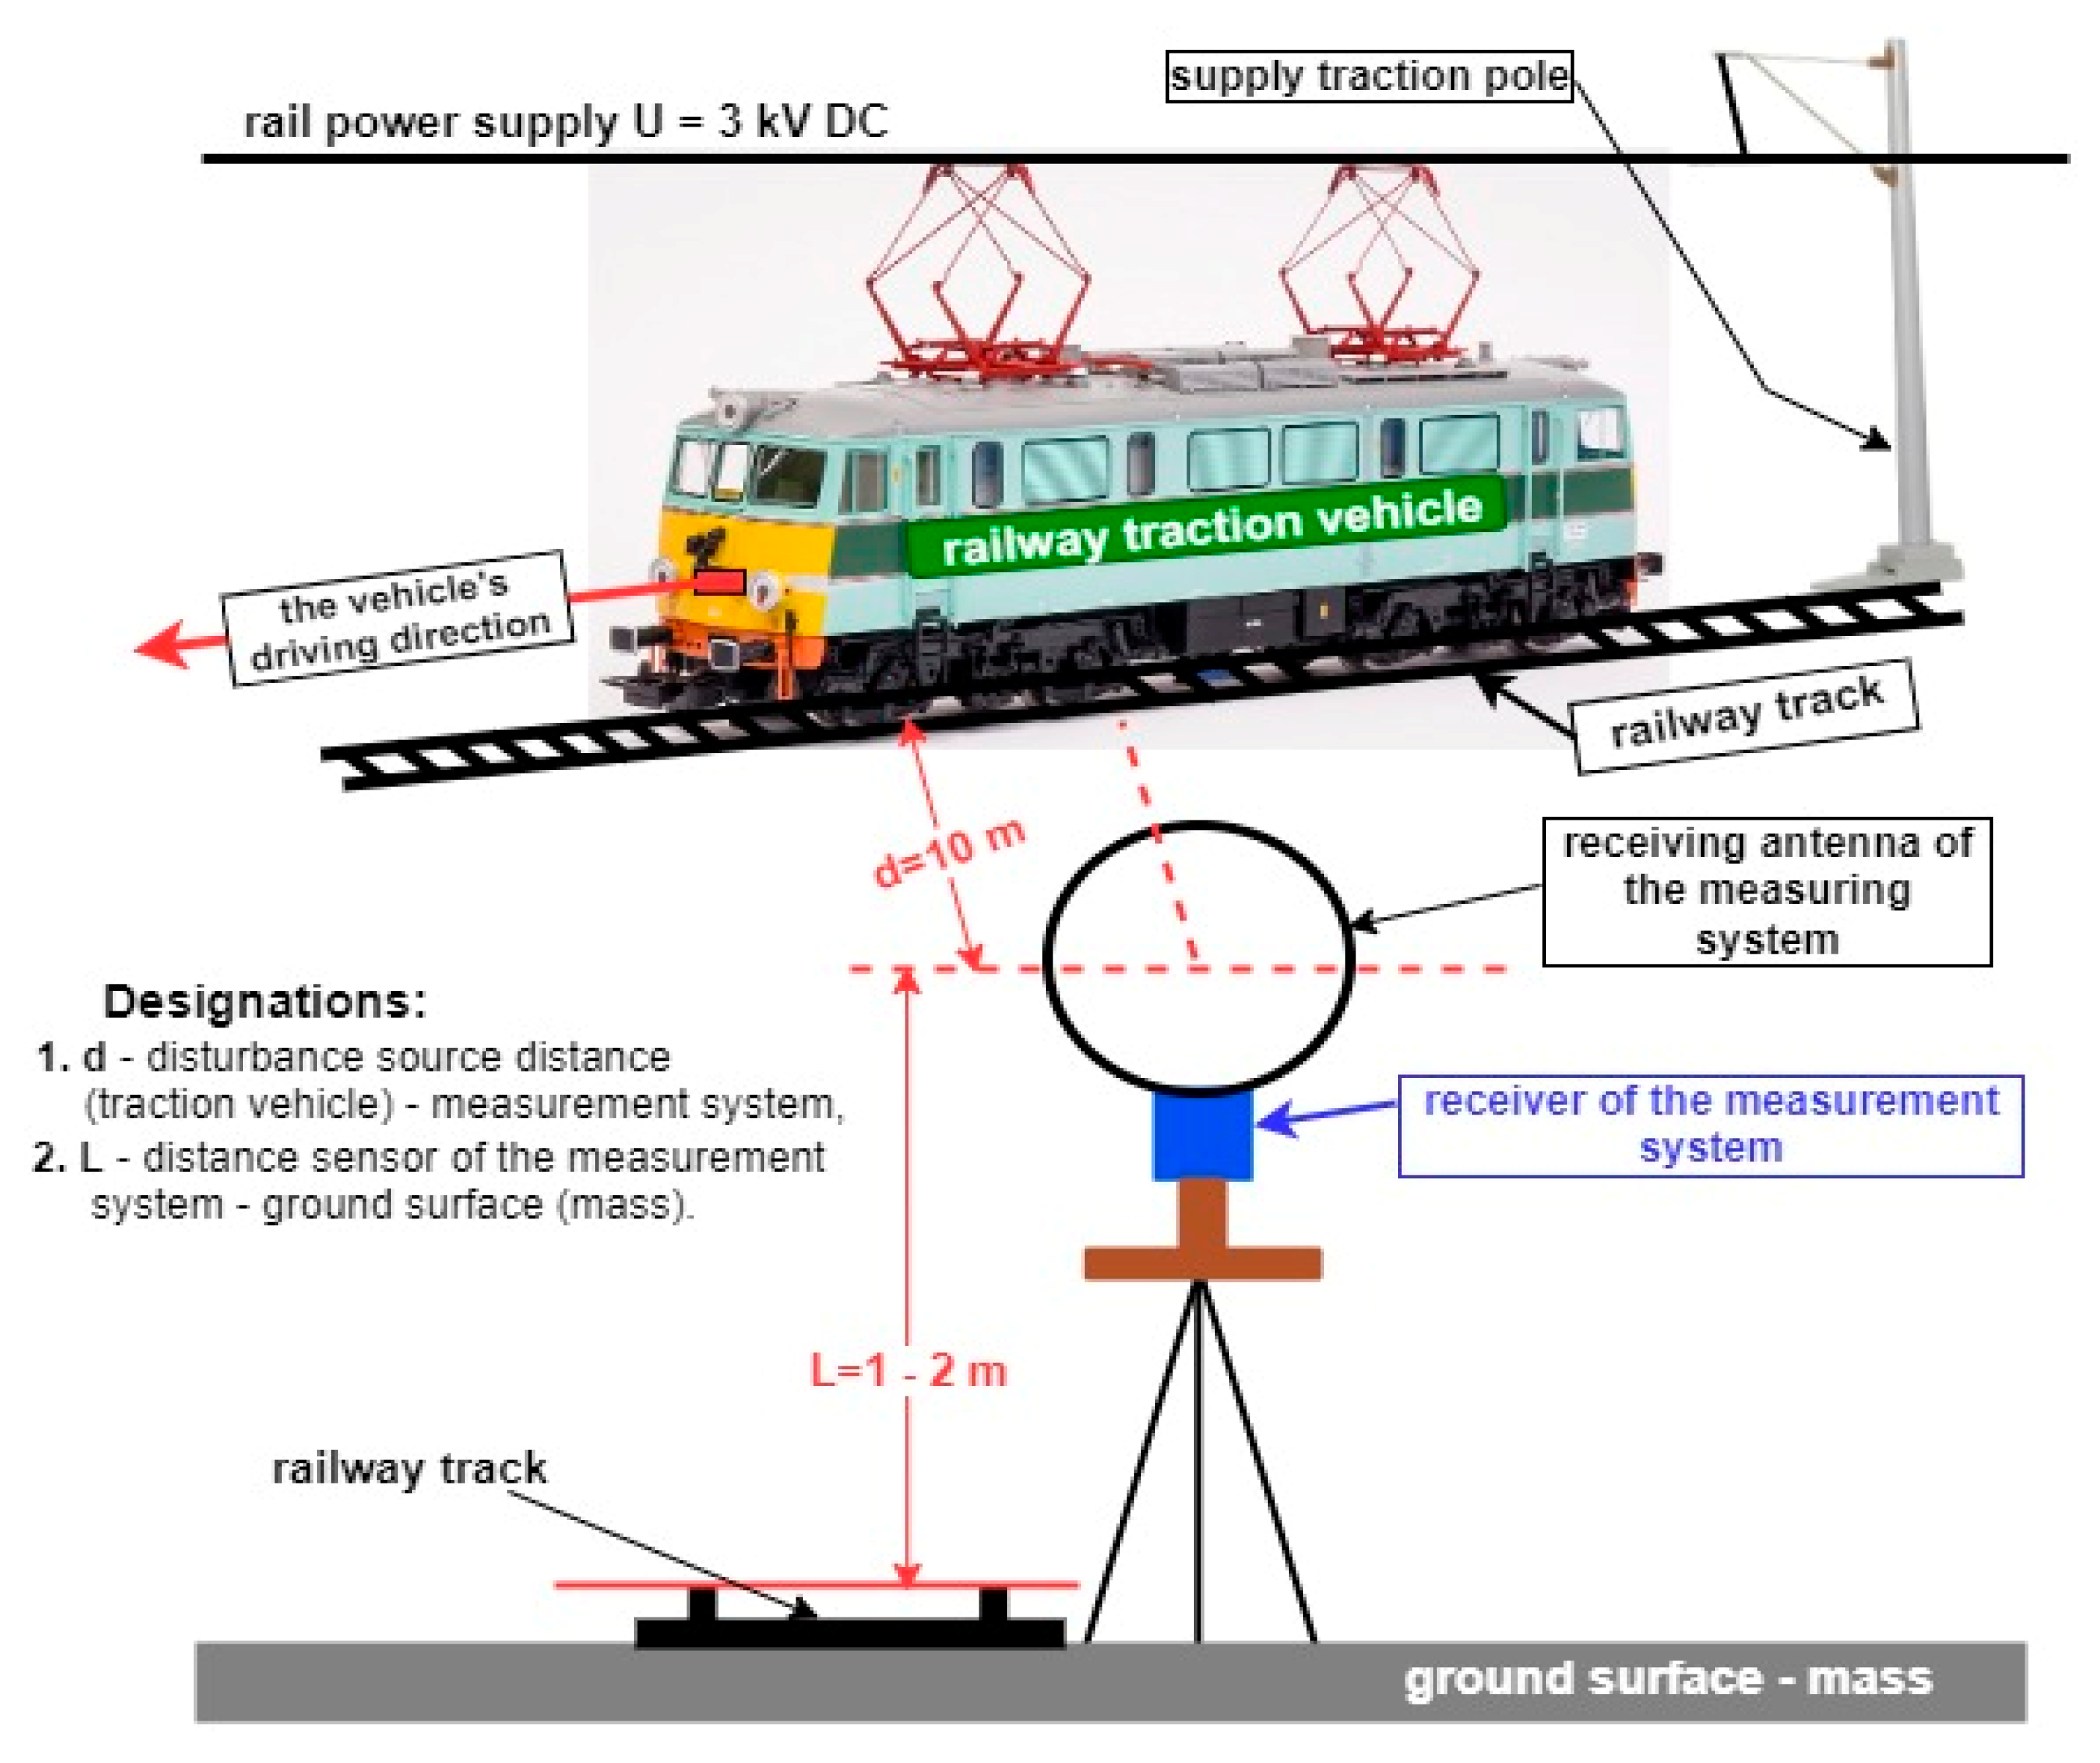
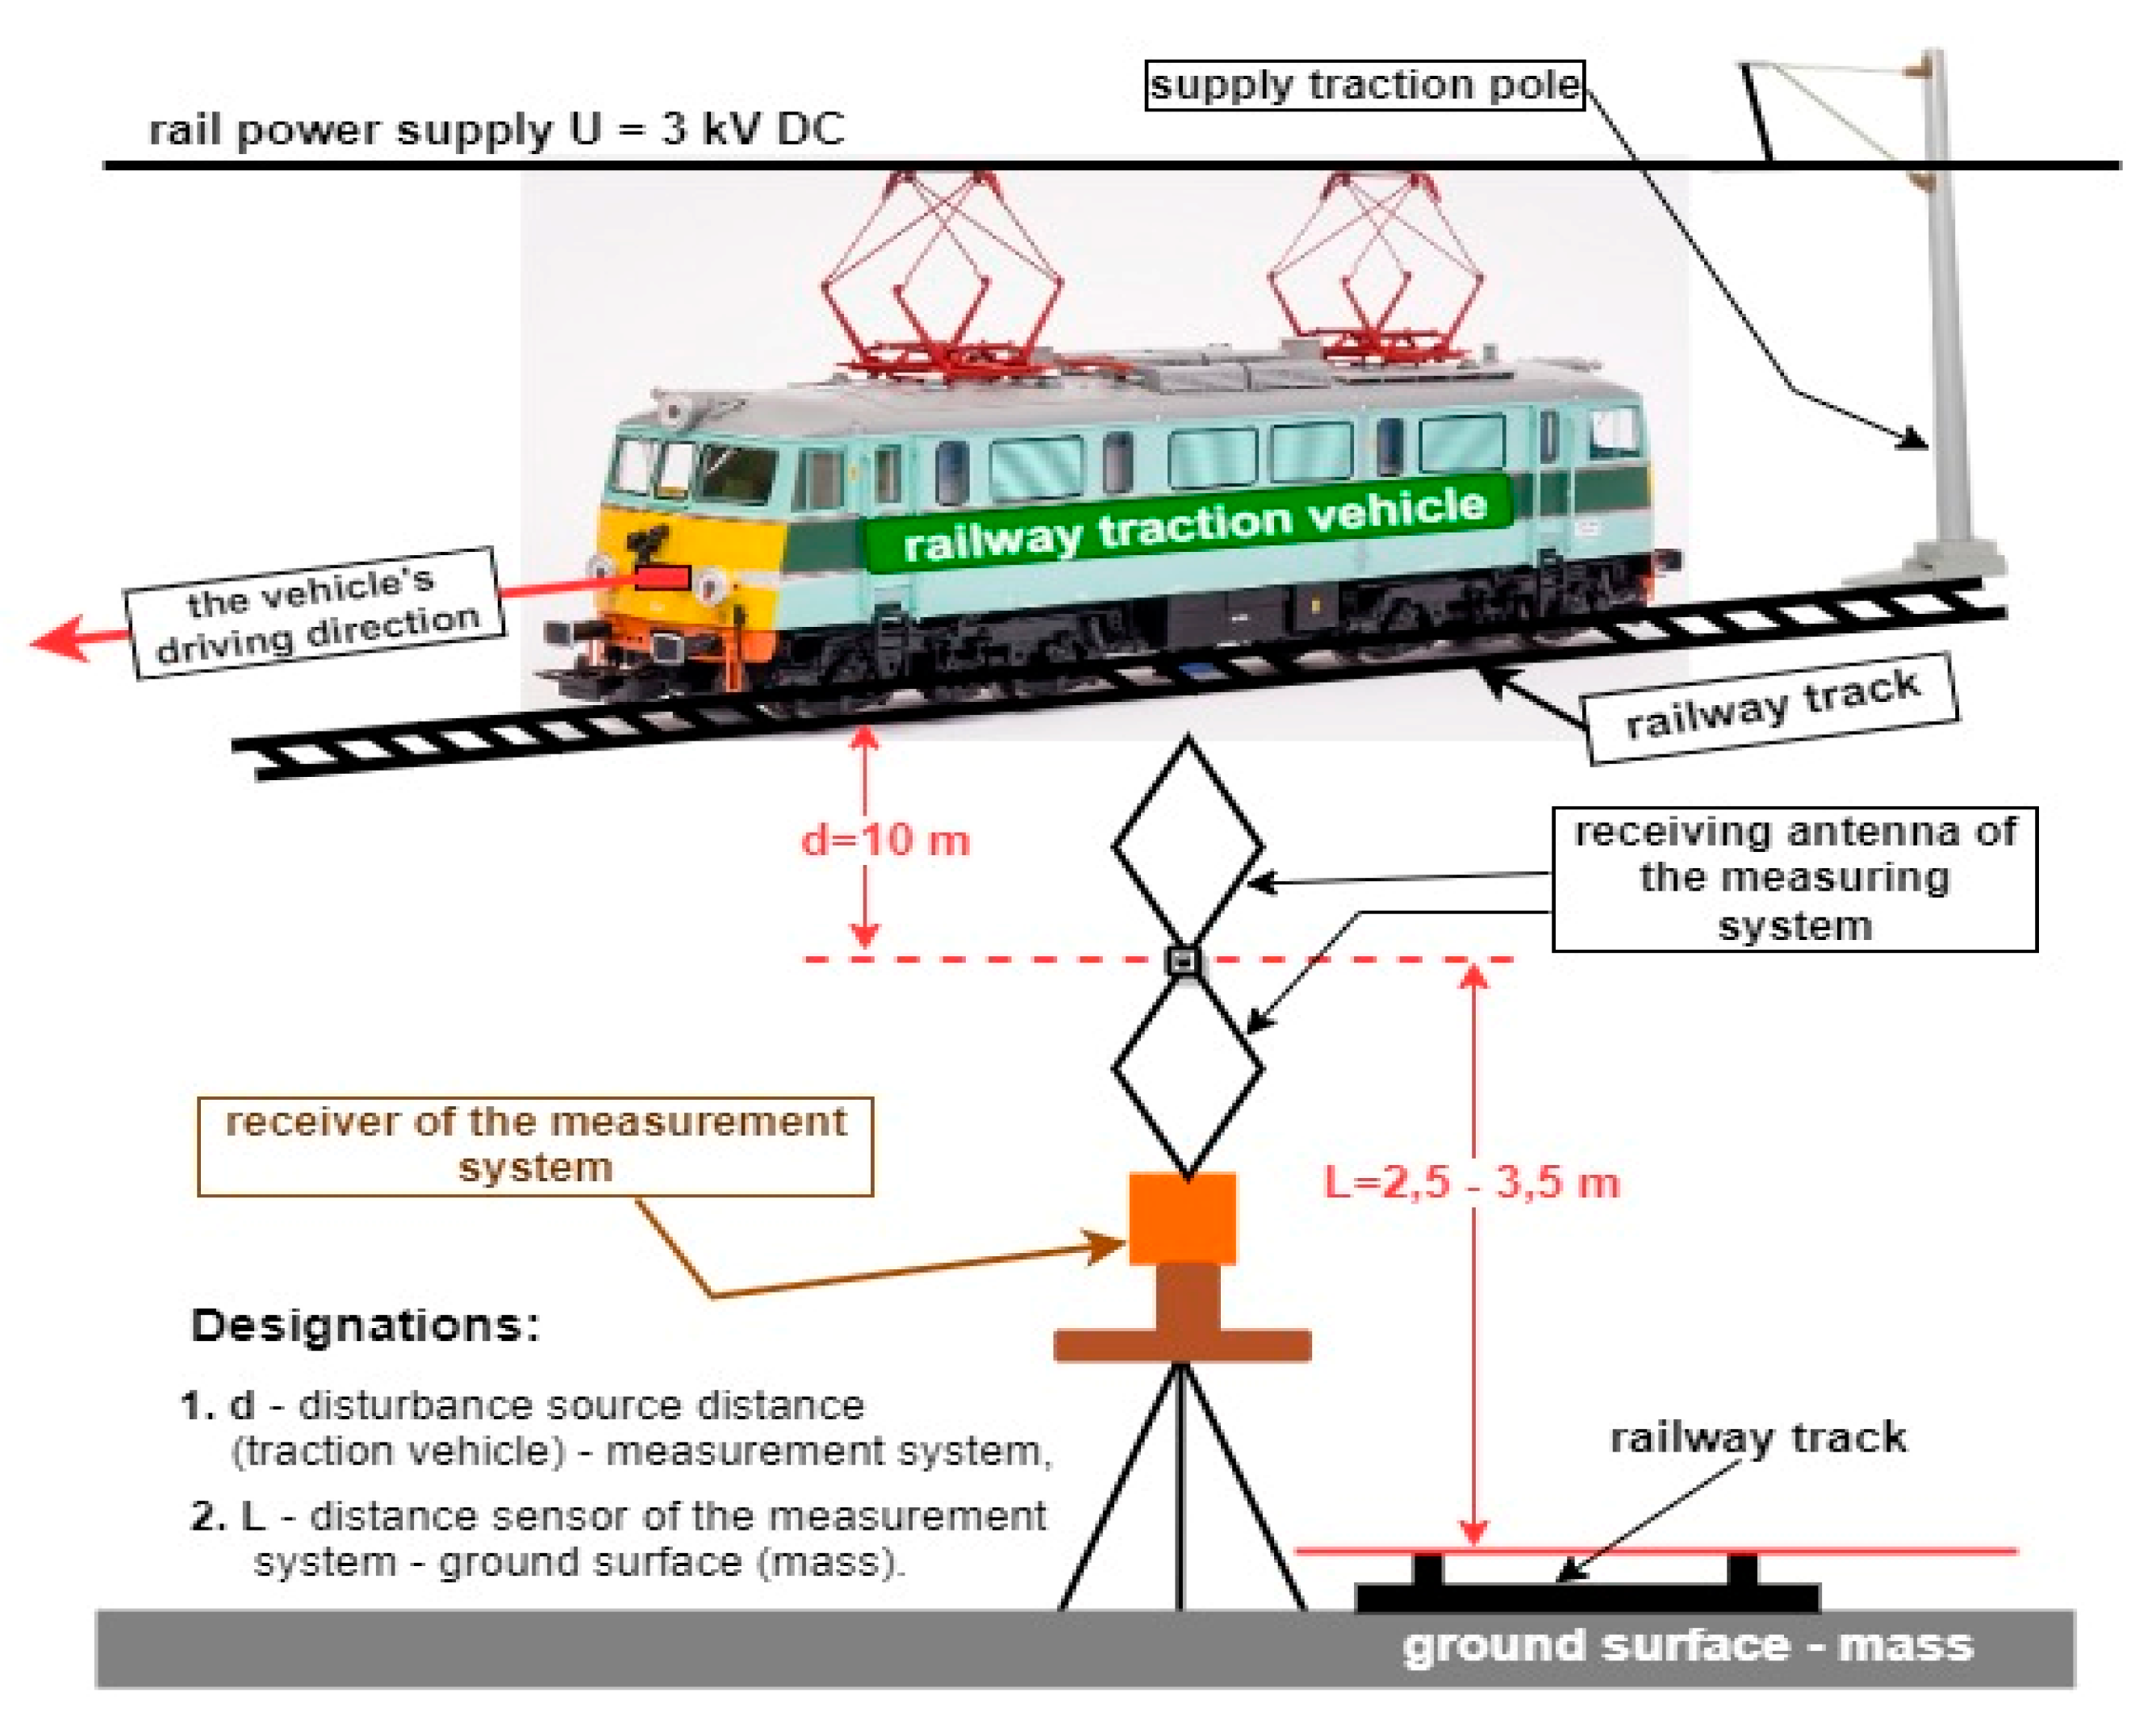
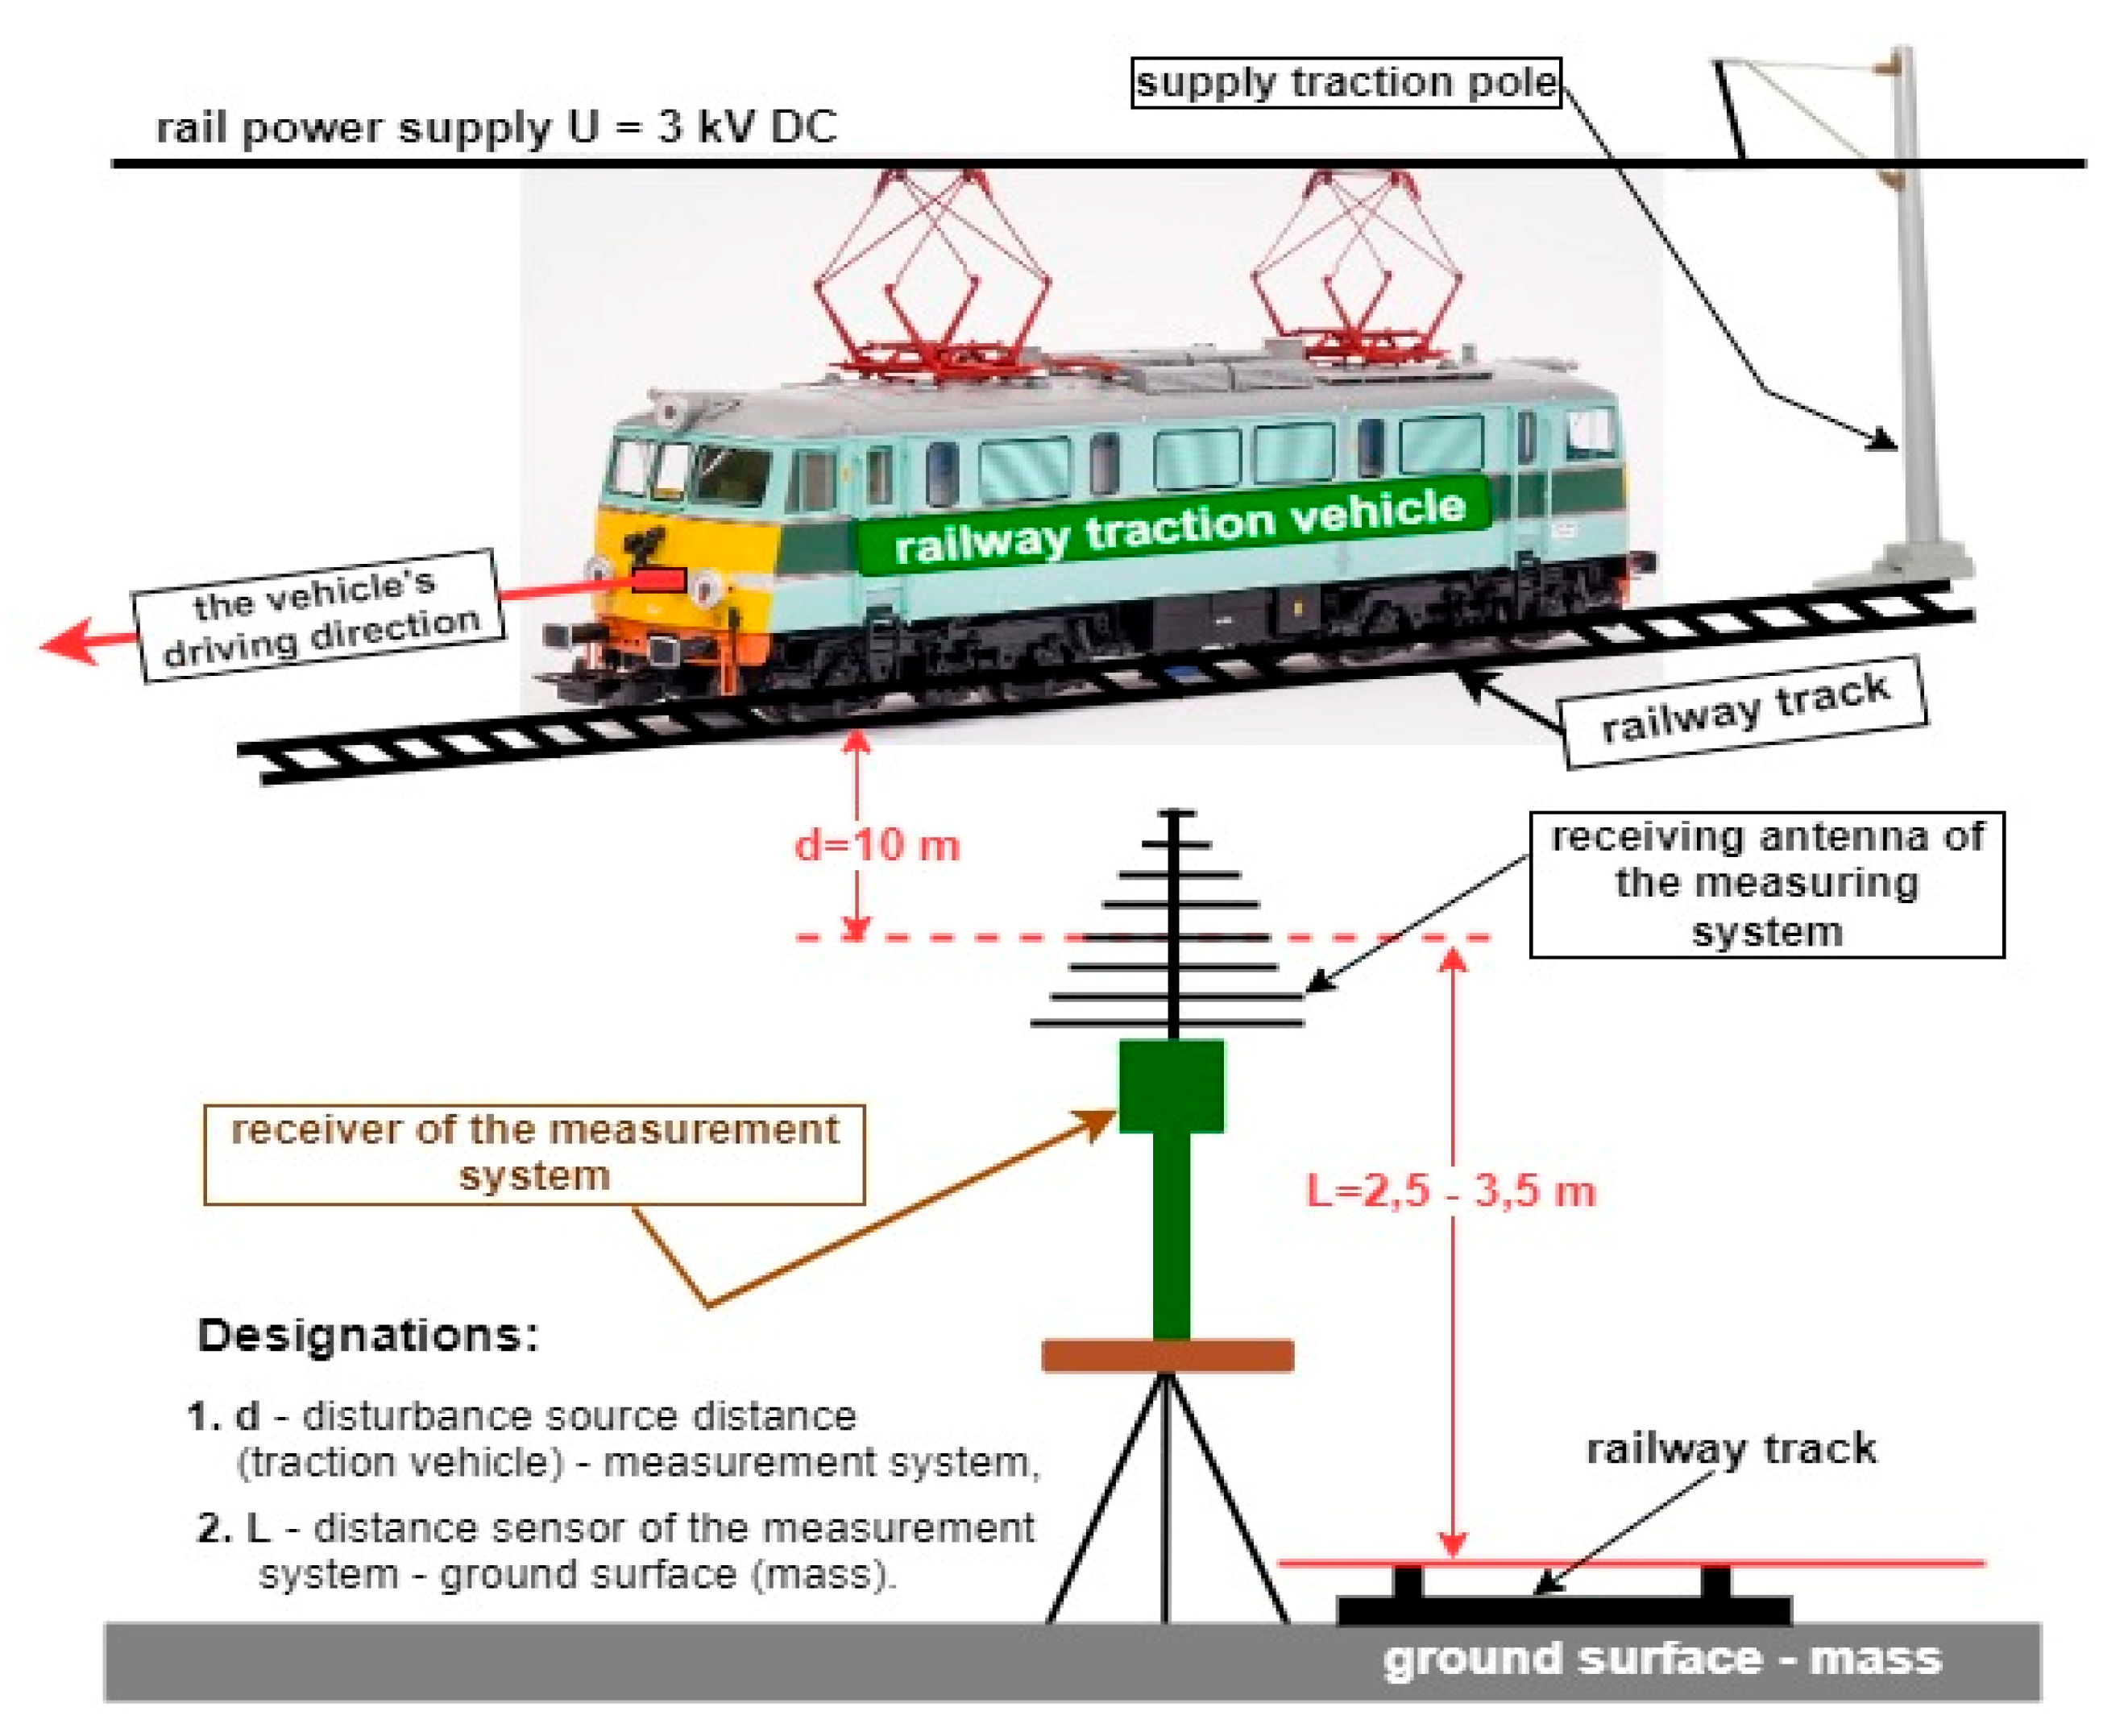
The basic and main device (measurement sensor) used when measuring electromagnetic compatibility are appropriate antennas, positioned at a specific distance (10 m) from the track axis, at different heights above the ground, depending on the type of the employed antenna:
Loop—1 m ÷ 2 m above the railway line rail head, as shown in
Figure 5;
Biconical and log-periodic—2.5 m ÷ 3.5 m above the railway track head, as shown in
Figure 6 and
Figure 7, respectively.
The antenna suspension height during the measurements is selected to ensure the readings of the maximum level of electromagnetic field interference, which are emitted by a rail vehicle. The measurement shall be conducted in accordance with the applicable PN-EN 50121-3-1 standard for two antenna polarizations (V—vertical and H—horizontal). The stands for measuring electromagnetic compatibility within this frequency range have been appropriately illustrated in
Figure 5,
Figure 6 and
Figure 7, using different types of measuring antennas. The figures also contain the permissible antenna heights above the ground, the measurement distance from the rail vehicle and the method of antenna distribution relative to the rail vehicle—moving or parking.
Electromagnetic compatibility was measured for radiated interference in the two distinguished rail vehicle operating modes using various antennas intended to measure over strictly defined frequency ranges. The antennas are also positioned at specific distances, defined in the standard covering the methodologies of testing a distorted electromagnetic environment around a rail vehicle. The list of employed antennas and their frequency subranges, as well as measurement distances, suspension heights and position, have been shown in
Table 1.
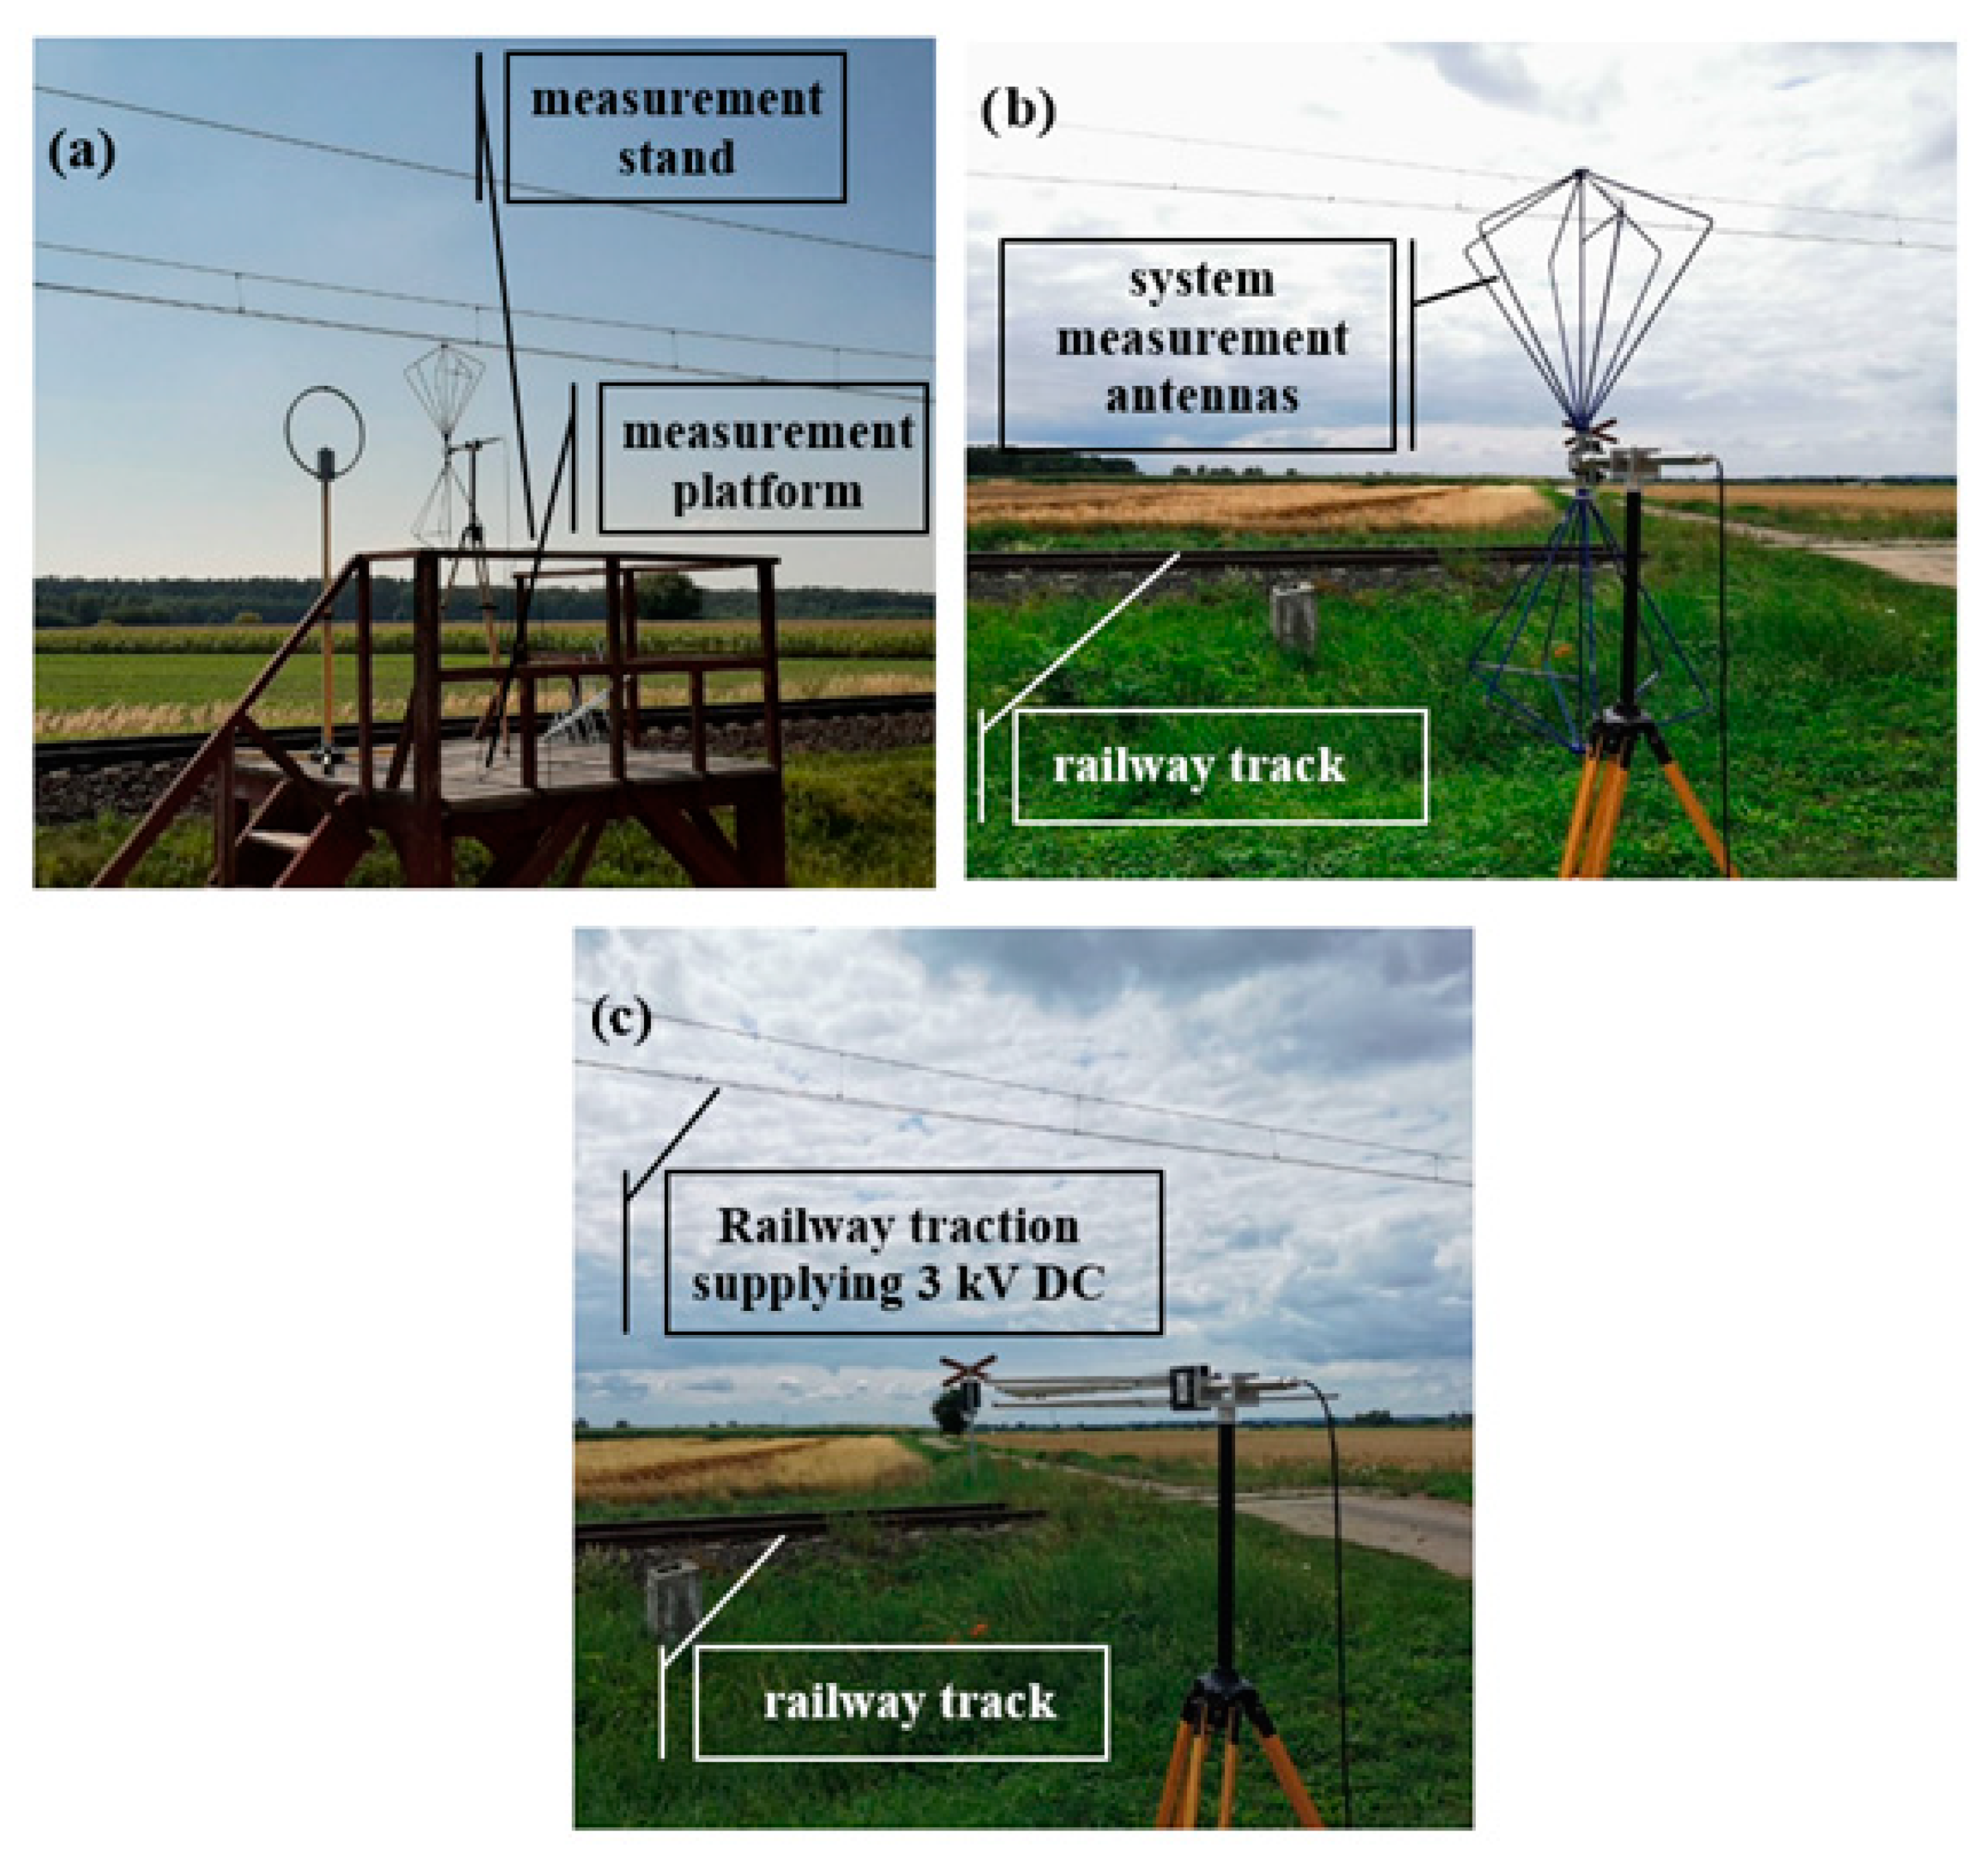
Figure 8 contains photographs—of the appearance of actual measurement stands located within the Railway Institute Test Track. On the other hand,
Figure 4 marks the location of electromagnetic compatibility tests within the range of radiated interfering signals. The measurement point satisfies the requirements set out in the standard covering the measurement methodology. Failure to meet this requirement means unintentional changes to the original electromagnetic field “signature”.
During the entire measuring process (2 working days), the measurements were conducted with a positive ambient temperature of +14 °C, with no precipitation and fog. Air relative humidity during the days of the measurements amounted to 59%. Environmental conditions greatly affect measurement credibility, which is why the measurements are taken under specific conditions, e.g., ambient temperature of at least +5 °C. Such measurements are conducted primarily in the spring-autumn period, where the temperature and humidity values fall within the standard range.
A modern rail vehicle, which is currently being introduced to the Polish transport market, was chosen for measuring electromagnetic field emissions. The rail vehicle is fitted with state-of-the-art technical solutions in onboard electronic systems and the drive itself (traction motors, converters, data transmission network, passenger information system, onboard railway traffic control systems, ETCS, etc.). Obsolete traction units with electromechanical controls are currently being withdrawn and replaced with electronically controlled locomotives with power-electronic systems and in hybrid technology.
3.1. Results of Electromagnetic Compatibility Tests within the Frequency Range of Radiated Interfering Signals
The radiated emission measurements within the frequency range of 150 kHz to 1 GHz involved 10 electromagnetic field measurements. The authors of this article provided a mean electromagnetic field value for n = 10 for this frequency range. Individual spectral line amplitudes of unintentional electromagnetic field signals measured for this frequency range indicate a maximum deviation from the mean values in the graphs of ± 10%. Electromagnetic field emissions were repeatable since the research paper’s authors conducted them on a straight-line test track section (rail vehicle did neither accelerate nor decelerate). The rail vehicle was constantly moving and had all electrical current consumers required for correct functioning pre-activated at the parking station.
Figure 9,
Figure 10,
Figure 11,
Figure 12,
Figure 13 and
Figure 14 show interfering signal spectra for different frequency ranges obtained during the measurements. These figures illustrate two different spectrum waveforms within the discussed frequency subranges and permissible values for a given frequency range, as set out in the PN-EN 50121-3-1 standard.
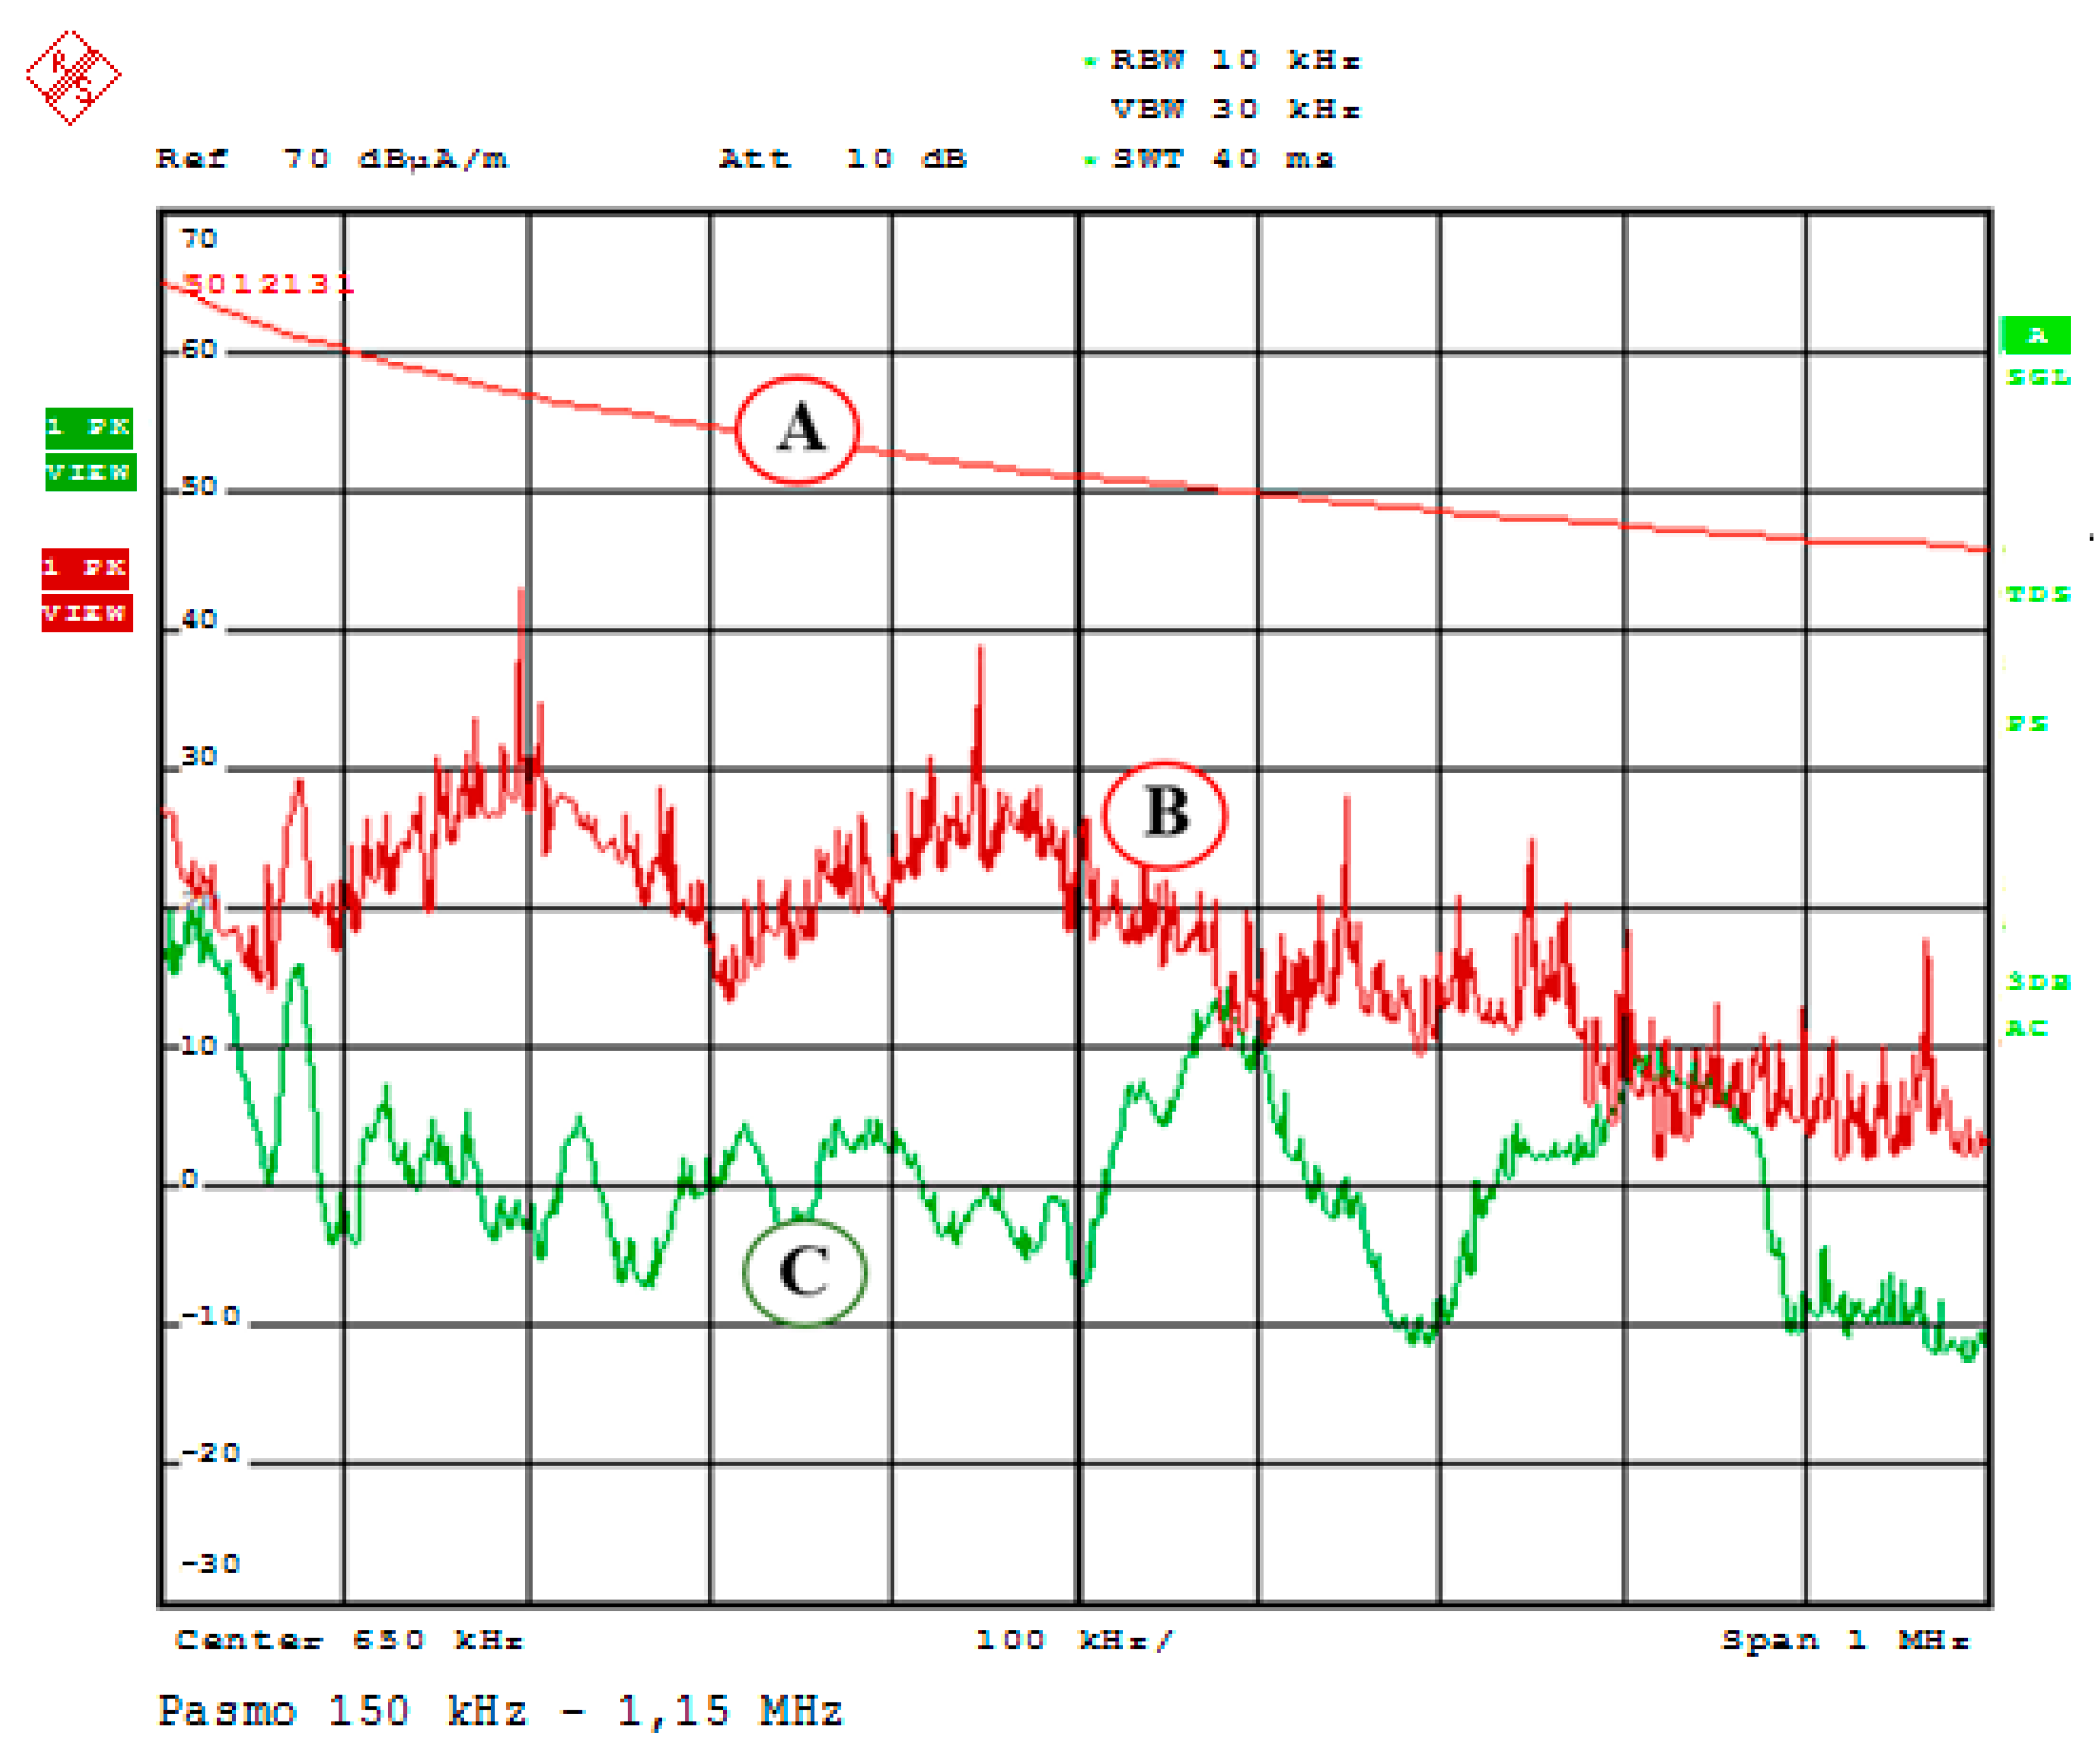
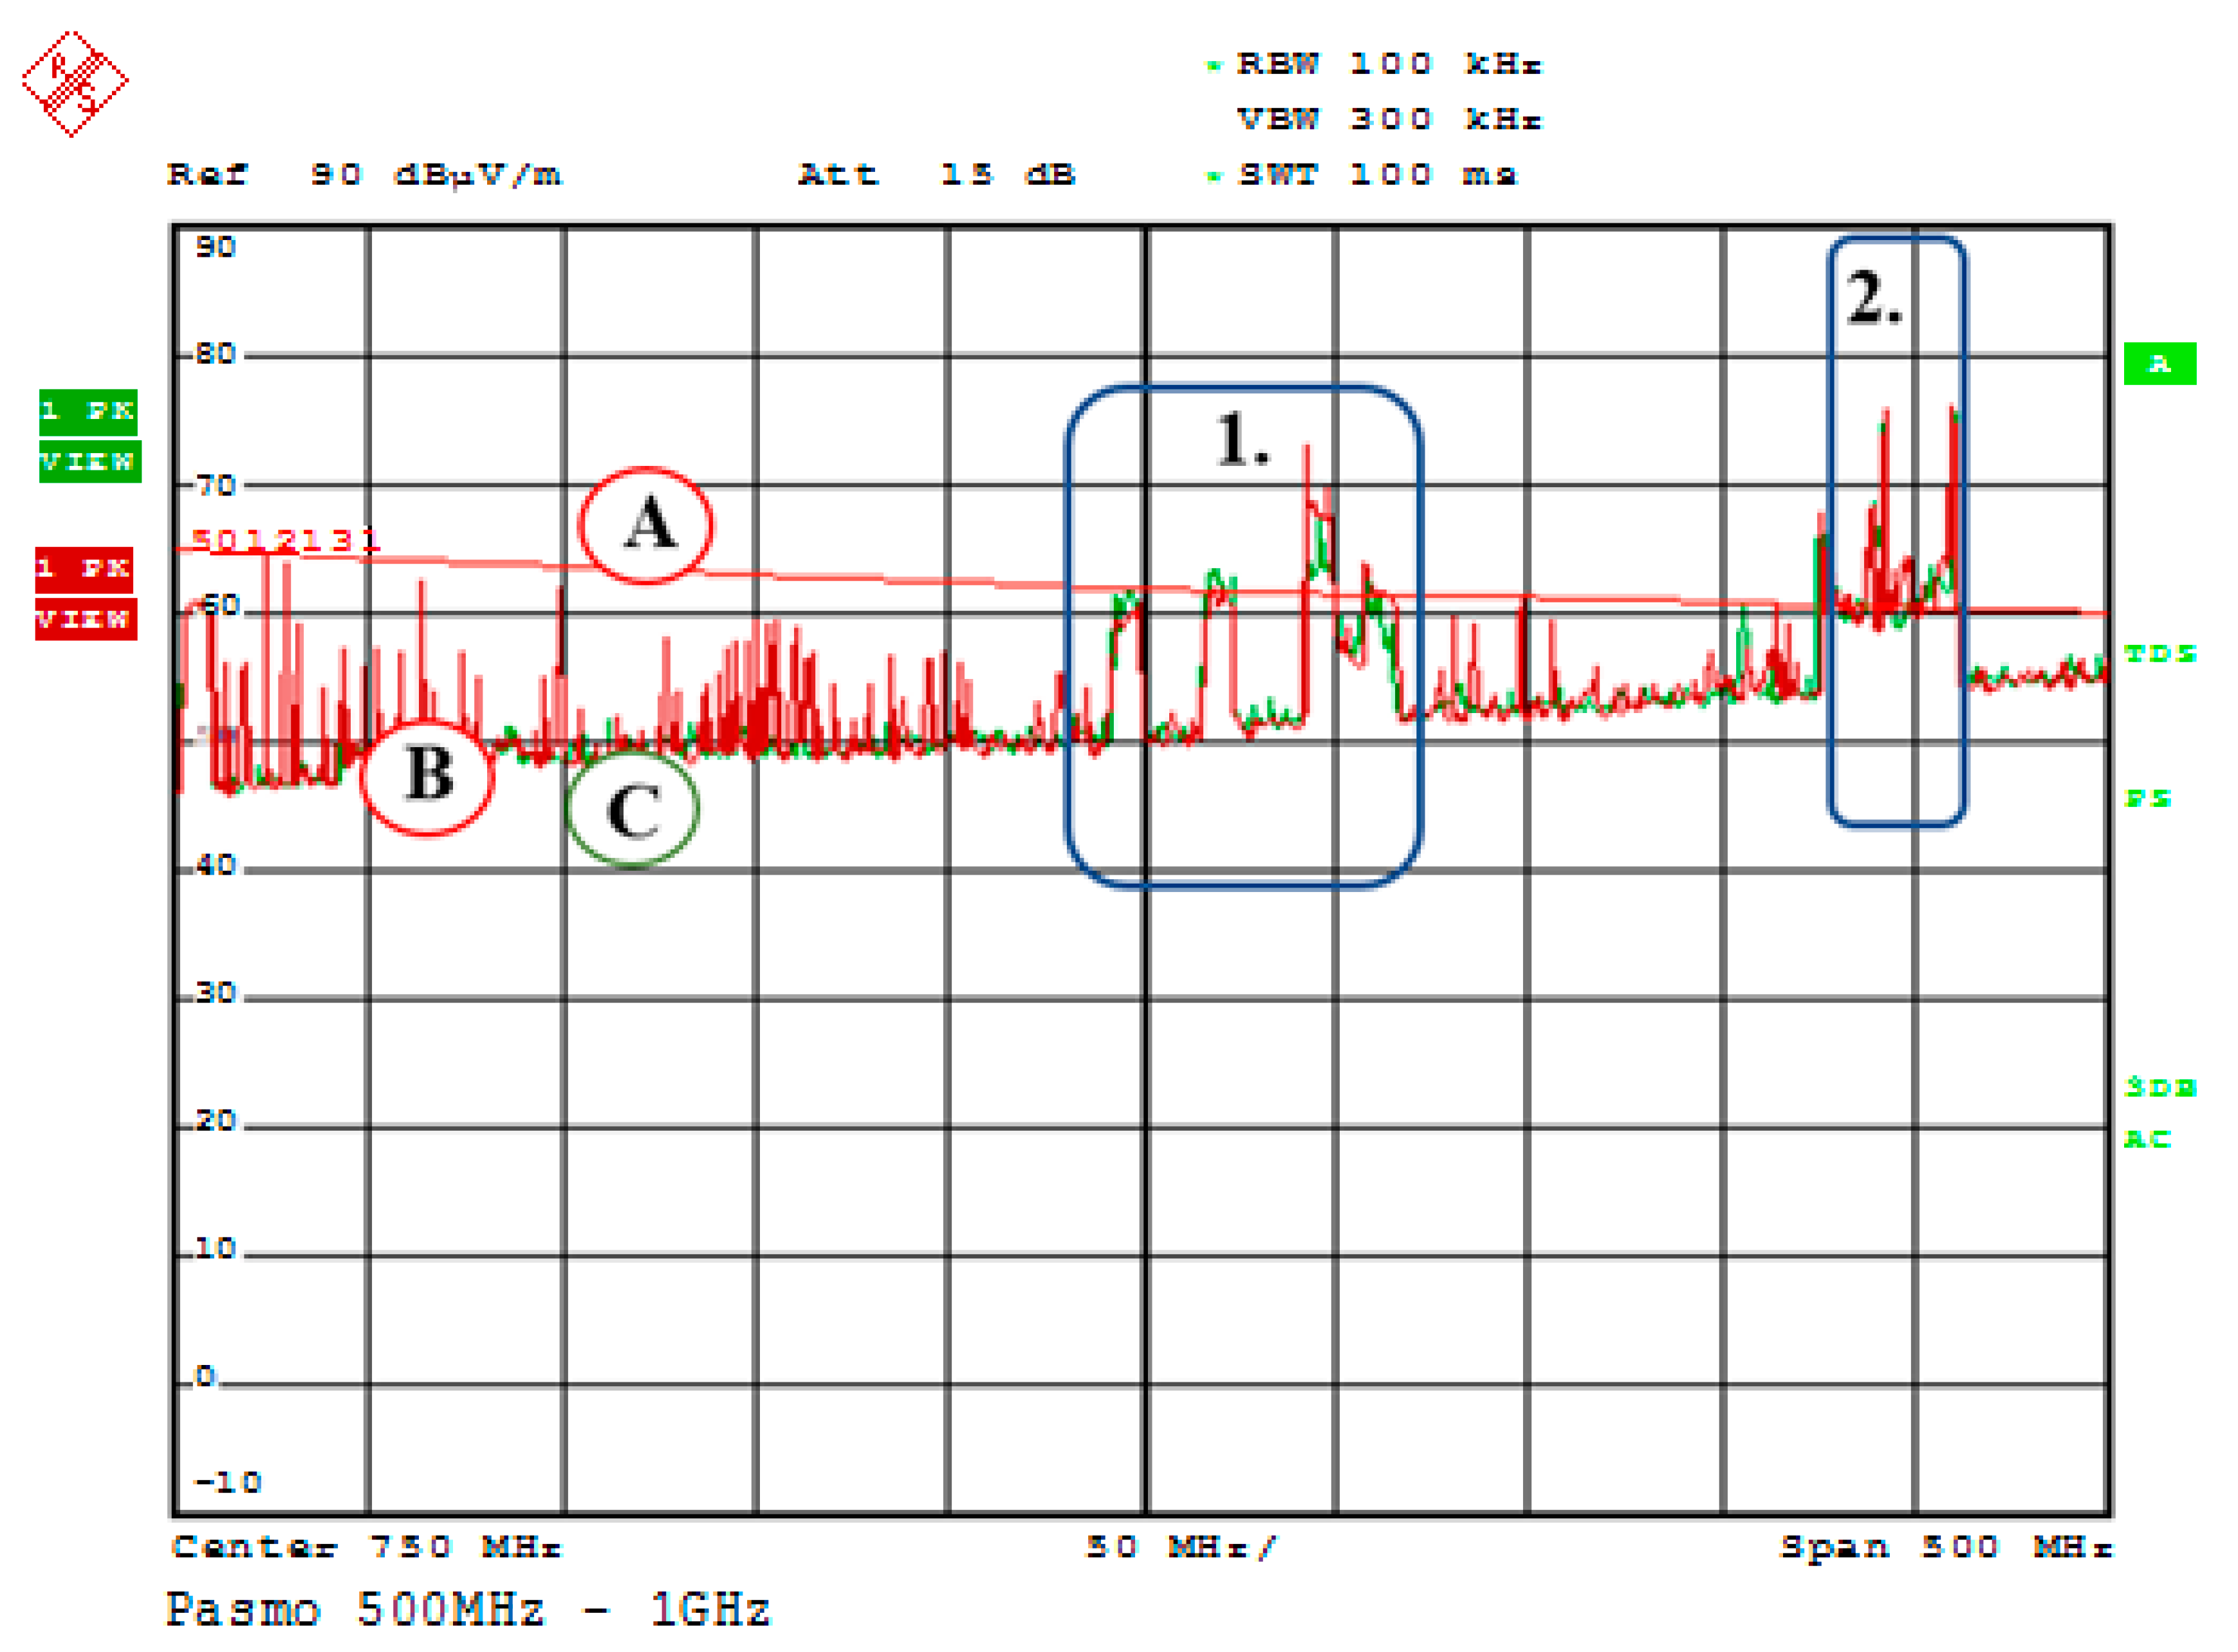
Figure 9 illustrates the spectrum of interfering signals radiated by a rail vehicle travelling at 50 km/h for a frequency range of 150 kHz–1.15 MHz. The waveform values obtained during the measurement are shown in all Figures using different waveform colours and appropriately marked using the letters A, B and C:
A—Permissible values for a given frequency range, set out in the PN-EN 50121-3-1 standard;
B—Electromagnetic field values obtained during the measurements for a rail vehicle travelling along the OETD at a speed of 50 km/h;
C—Electromagnetic field values were obtained during the measurements of the electromagnetic background at the OETD.
In the case of the signal spectra for a frequency range of 150 kHz–1.15 MHz, shown in
Figure 9, both the interfering signals radiated by a traction vehicle travelling at a speed of 50 km/h and the electromagnetic background level do not exceed the permissible values set out in PN-EN 50121-3-1. However, please note that the level of interfering signals radiated by a travelling rail vehicle increased significantly, which is also shown in
Table 2. For example, an interfering signal level change by as much as 44.6 dBµA/m has been observed for the frequency of 0.34 MHz, which is a very high value for this measurement subrange (frequency band).
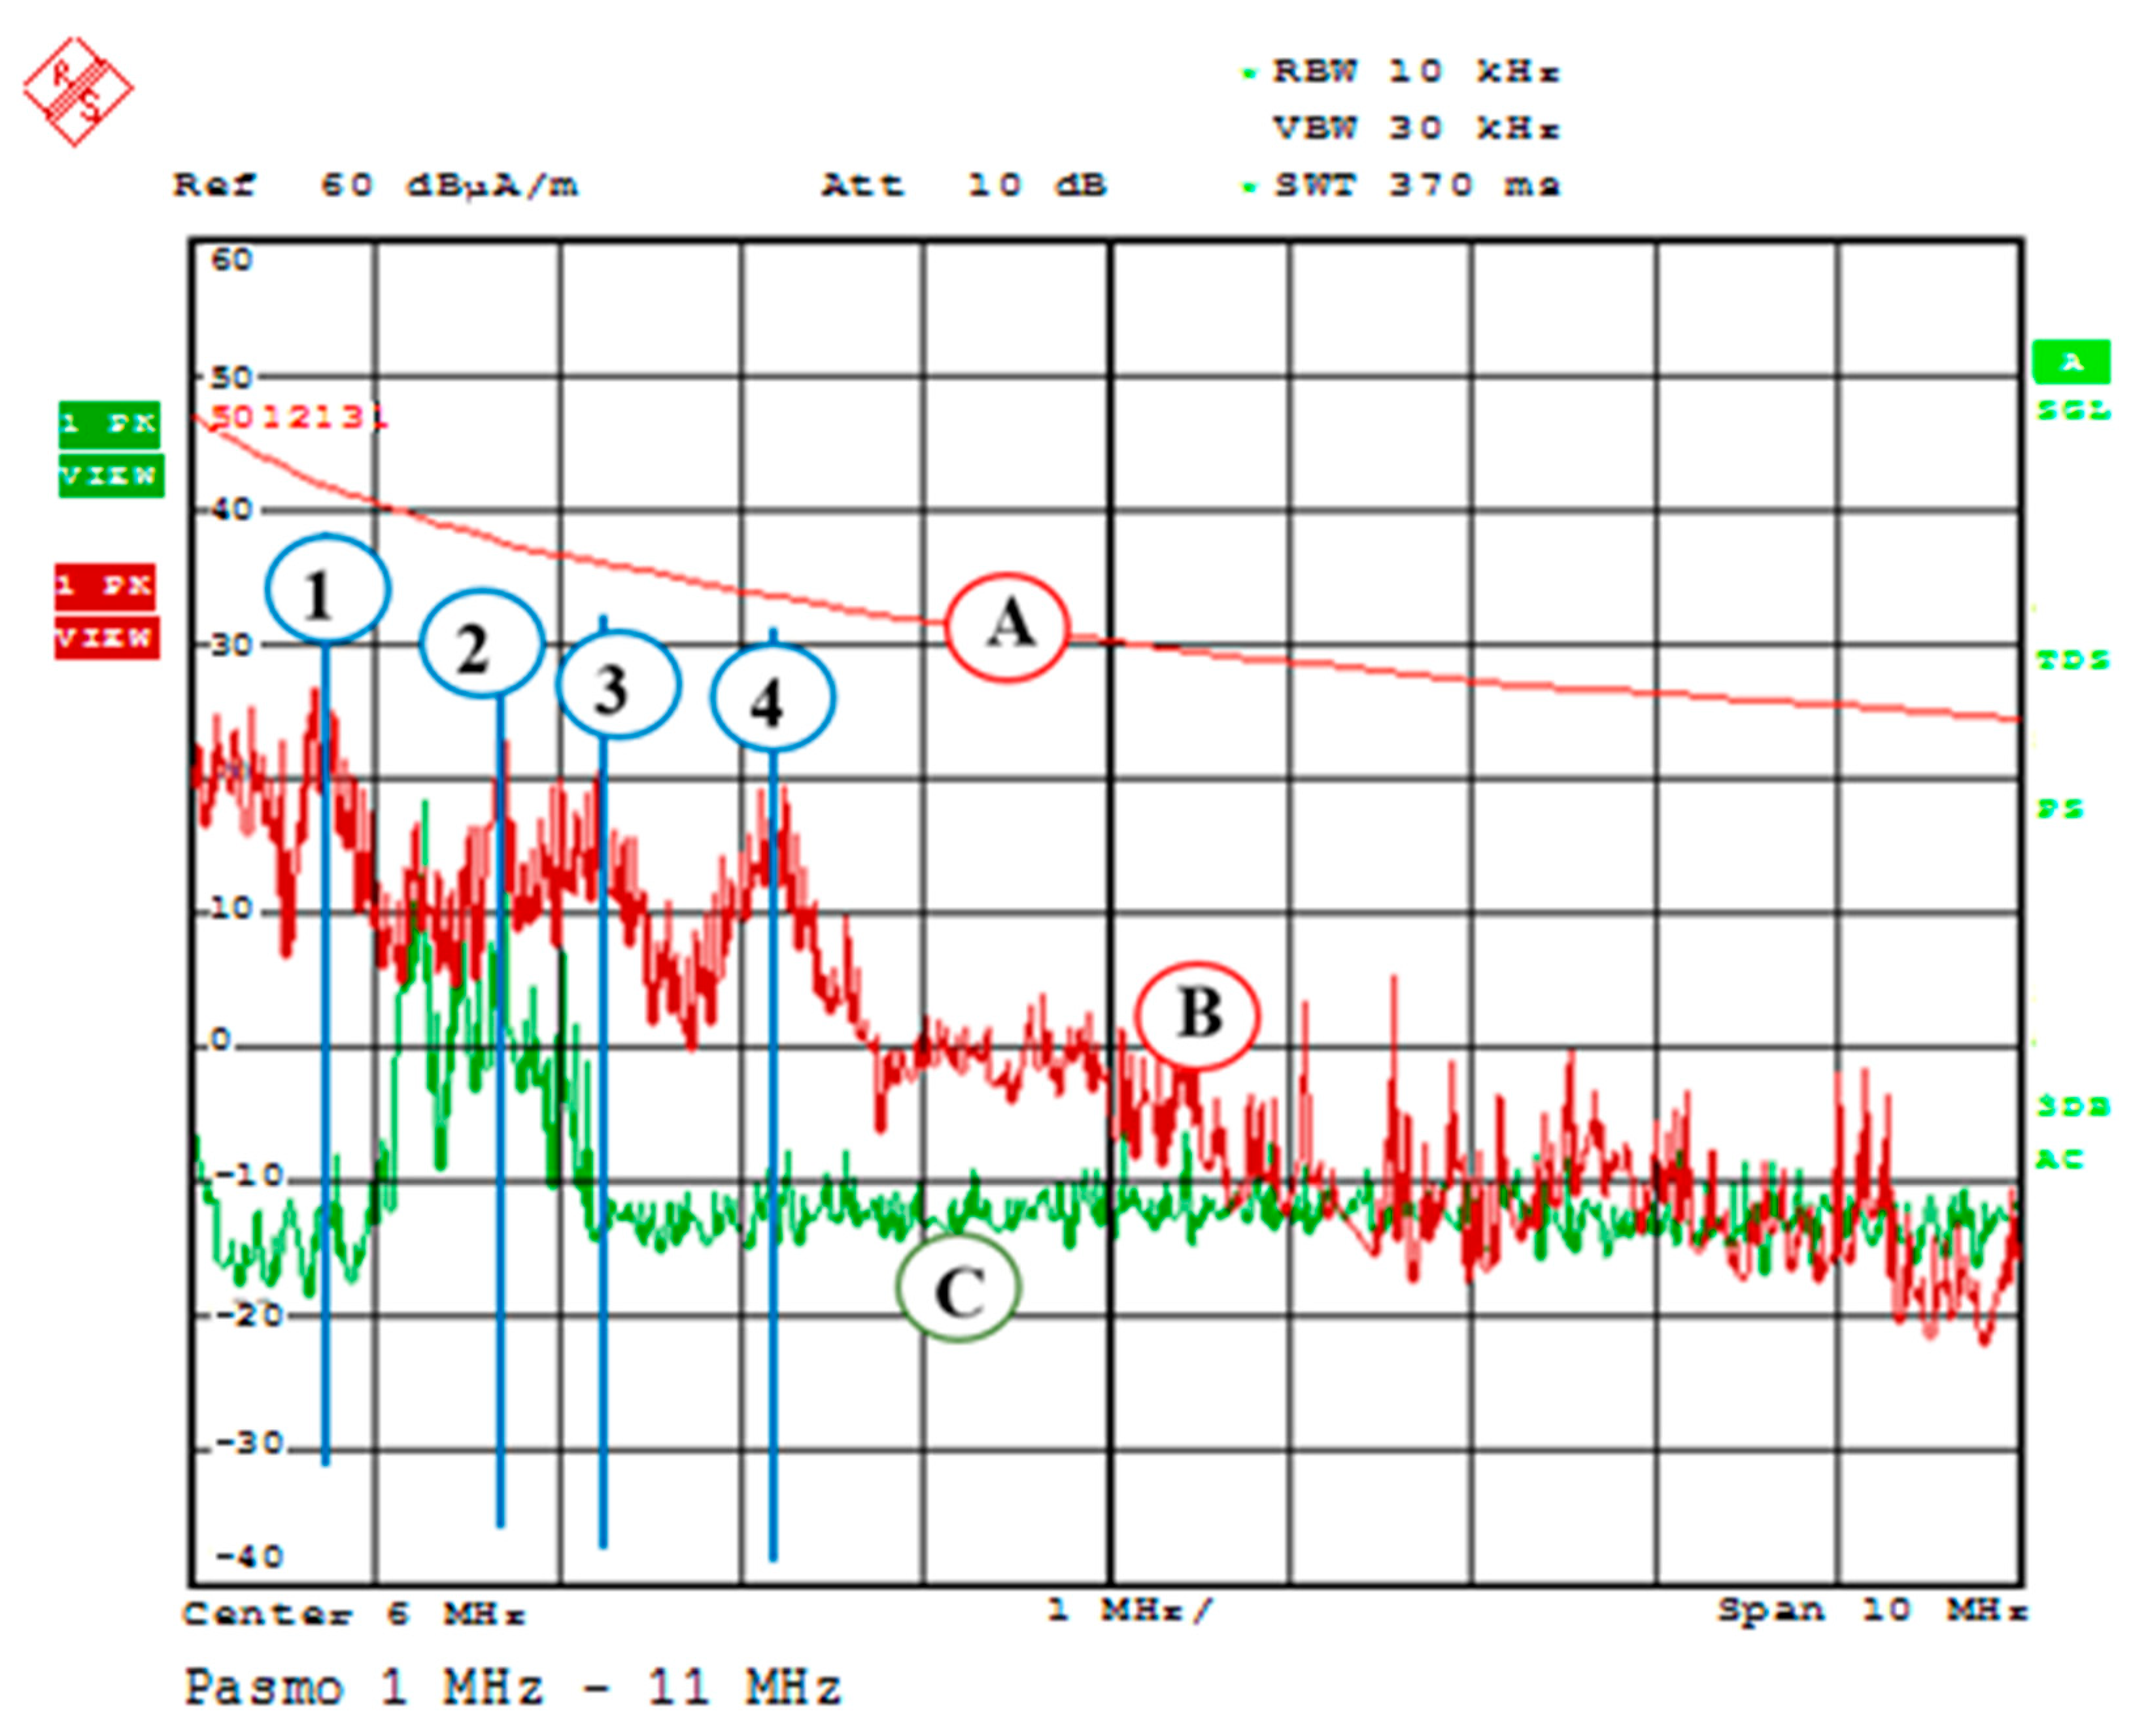
In the case of the signal spectra for a frequency range of 1 MHz–11 MHz, shown in
Figure 10, the radiated interfering signals of both the electromagnetic background (marked as C) and a rail vehicle travelling at a speed of 50 km/h (marked as B) do not exceed the permissible values set out in PN-EN 50121-3-1. However, please note the clustering of individual spectral lines around selected frequencies marked in
Figure 10 as 1, 2, 3, and 4. These frequencies are characteristic of a rail vehicle onboard equipment and result from these signals processed within a locomotive. However, please note that the level of interfering signals radiated by a travelling rail vehicle increased significantly, as shown in
Table 3. The interfering signal level change to as much as 41.3 dBµA/m has been observed for the frequency of 1.76 MHz. This is a very high value for this measurement subrange, resulting from operating a rail vehicle on a track.
Table 3 shows measurement results for a travelling vehicle and the electromagnetic background level for a signal spectrum, where the electromagnetic field strength increase is the highest.
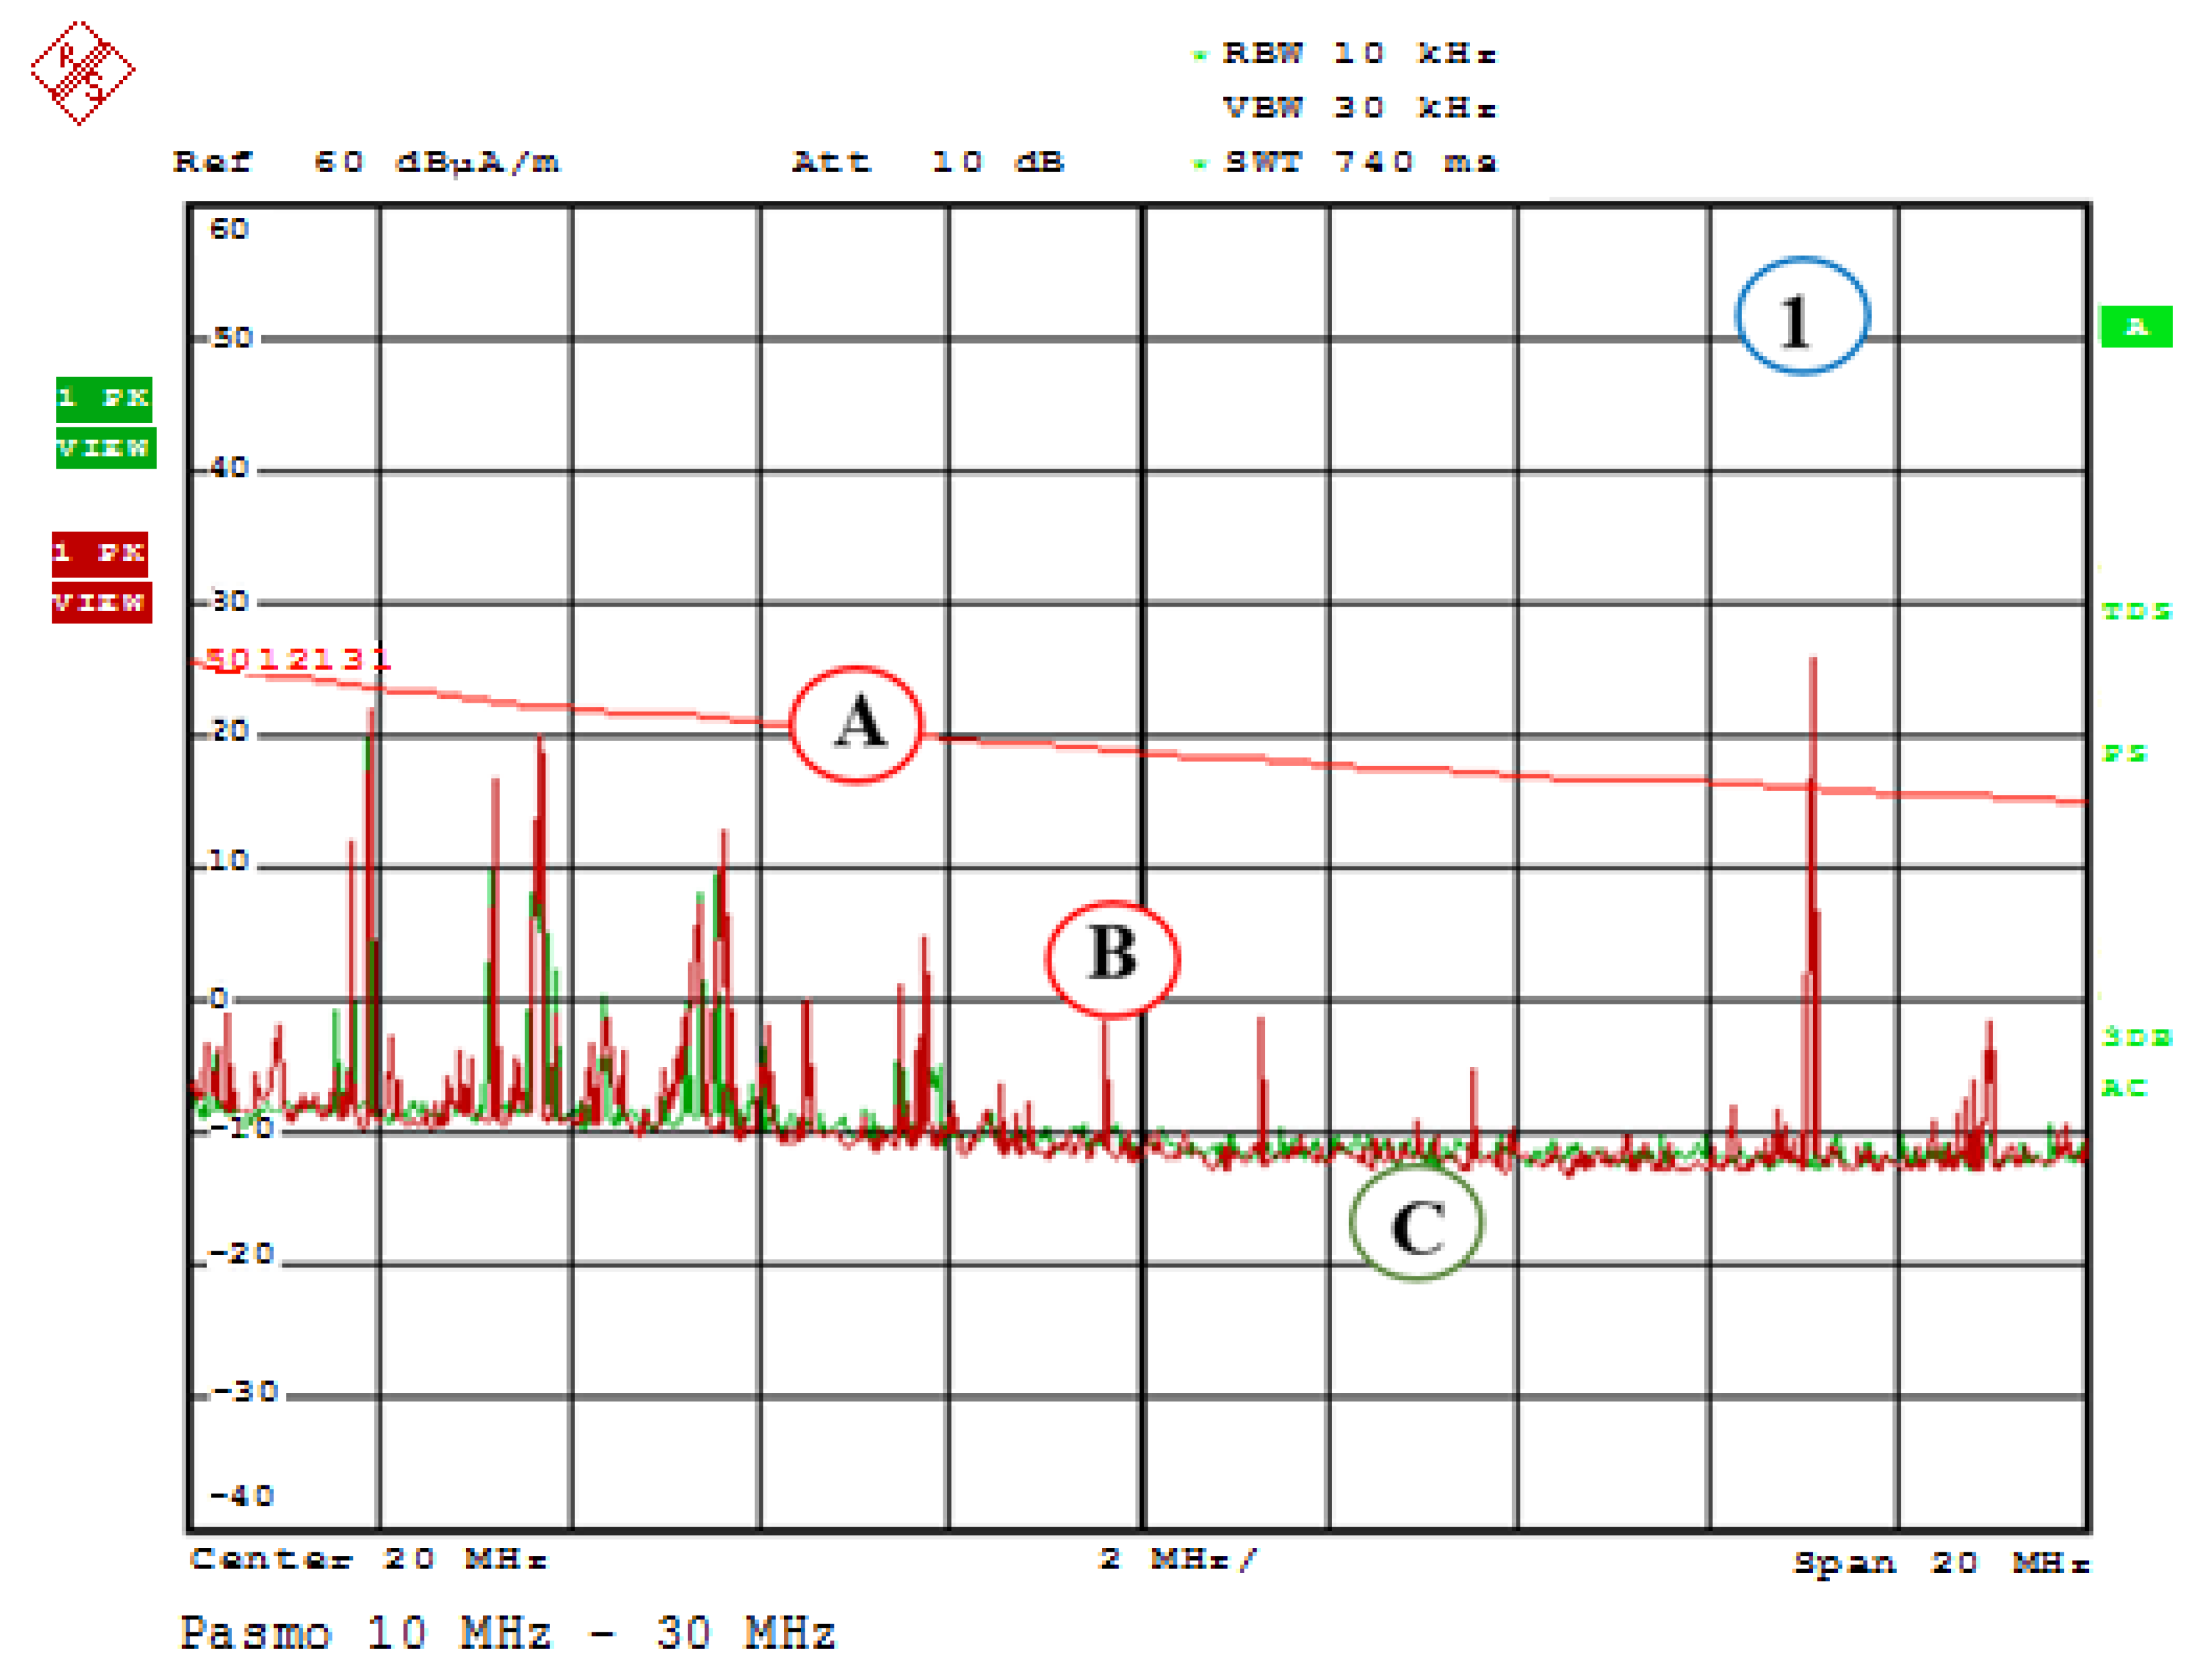
The signal spectra for a frequency range of 10 MHz–30 MHz shown in
Figure 9 indicate that the interfering signals radiated by a traction vehicle travelling at a speed of 50 km/h (marked as B) exceed the permissible values set out in PN-EN 50121-3-1. This exceedance is evident for a frequency range of 27.09 MHz and results from the operation of an ETCS transmitter (vehicle antenna, European Train Control System track)—marked in
Figure 11 as 1. Please note the clustering of individual spectral lines around the frequencies that are characteristic of a travelling vehicle. It can be observed that the interfering signal level of a travelling rail vehicle increased only slightly (relative to background measurement), e.g., an interfering signal change to 38.4 dBµA/m was observed for a frequency of 27.09 MHz.
Table 4 shows the background and travelling vehicle measurements for a signal spectrum, where the electromagnetic field strength increase is the highest.
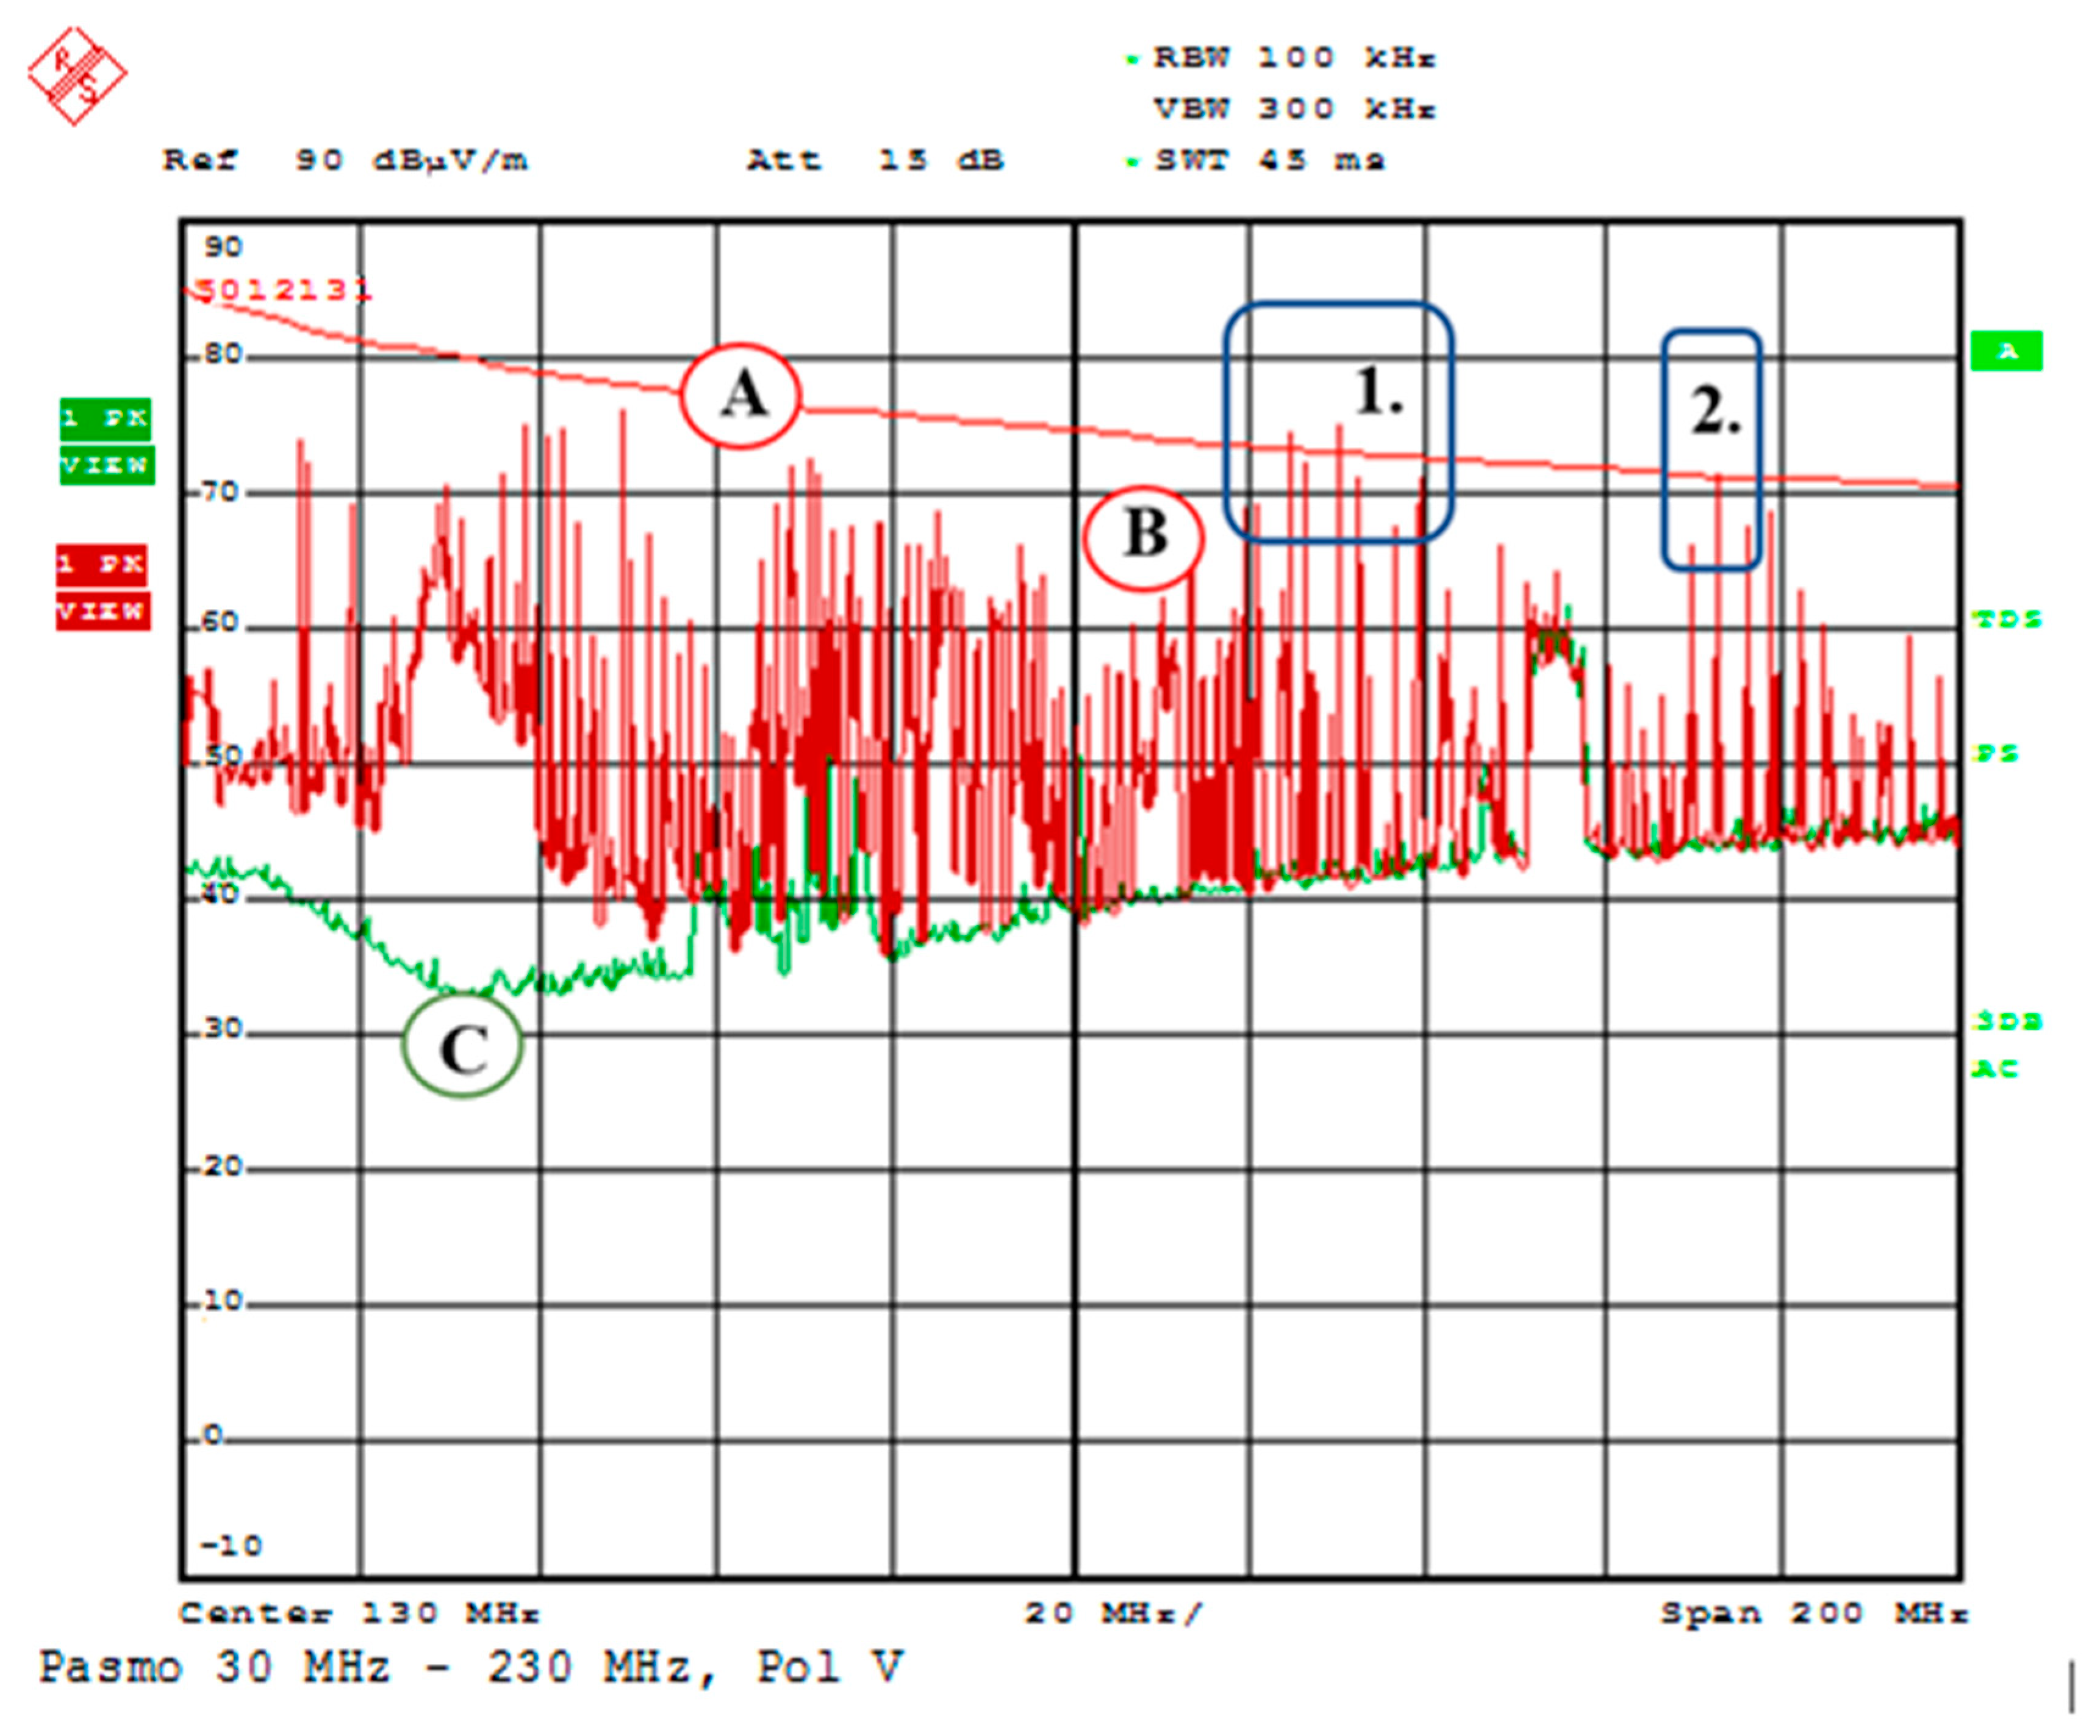
The spectra for a frequency range of 30 MHz–230 MHz shown in
Figure 12 clearly indicate that the interfering signals radiated by a traction vehicle travelling at a speed of 50 km/h (marked as B) exceed the permissible values set out for various subranges in PN-EN 50121-3-1, which is marked in the Figure as 1 and 4. This exceedance is particularly evident for the frequencies of 161.4 and 204.3 MHz. Please note the appearance of spectral lines (parasitic signals) at other frequencies. Their values are significant for a travelling vehicle. The interfering signal level during the travel of a rail vehicle increased considerably, which can be observed in
Figure 12 and is additionally shown in
Table 5. The graph illustrating the signal spectrum electromagnetic background measurement does not contain specific interfering signals. However, they appear during movement, which can be interpreted as the appearance of harmonic signals in the power supply and processing lines of the onboard locomotive equipment (installed), e.g., traction converters, inverters, and switches, when increasing the grid power demand.
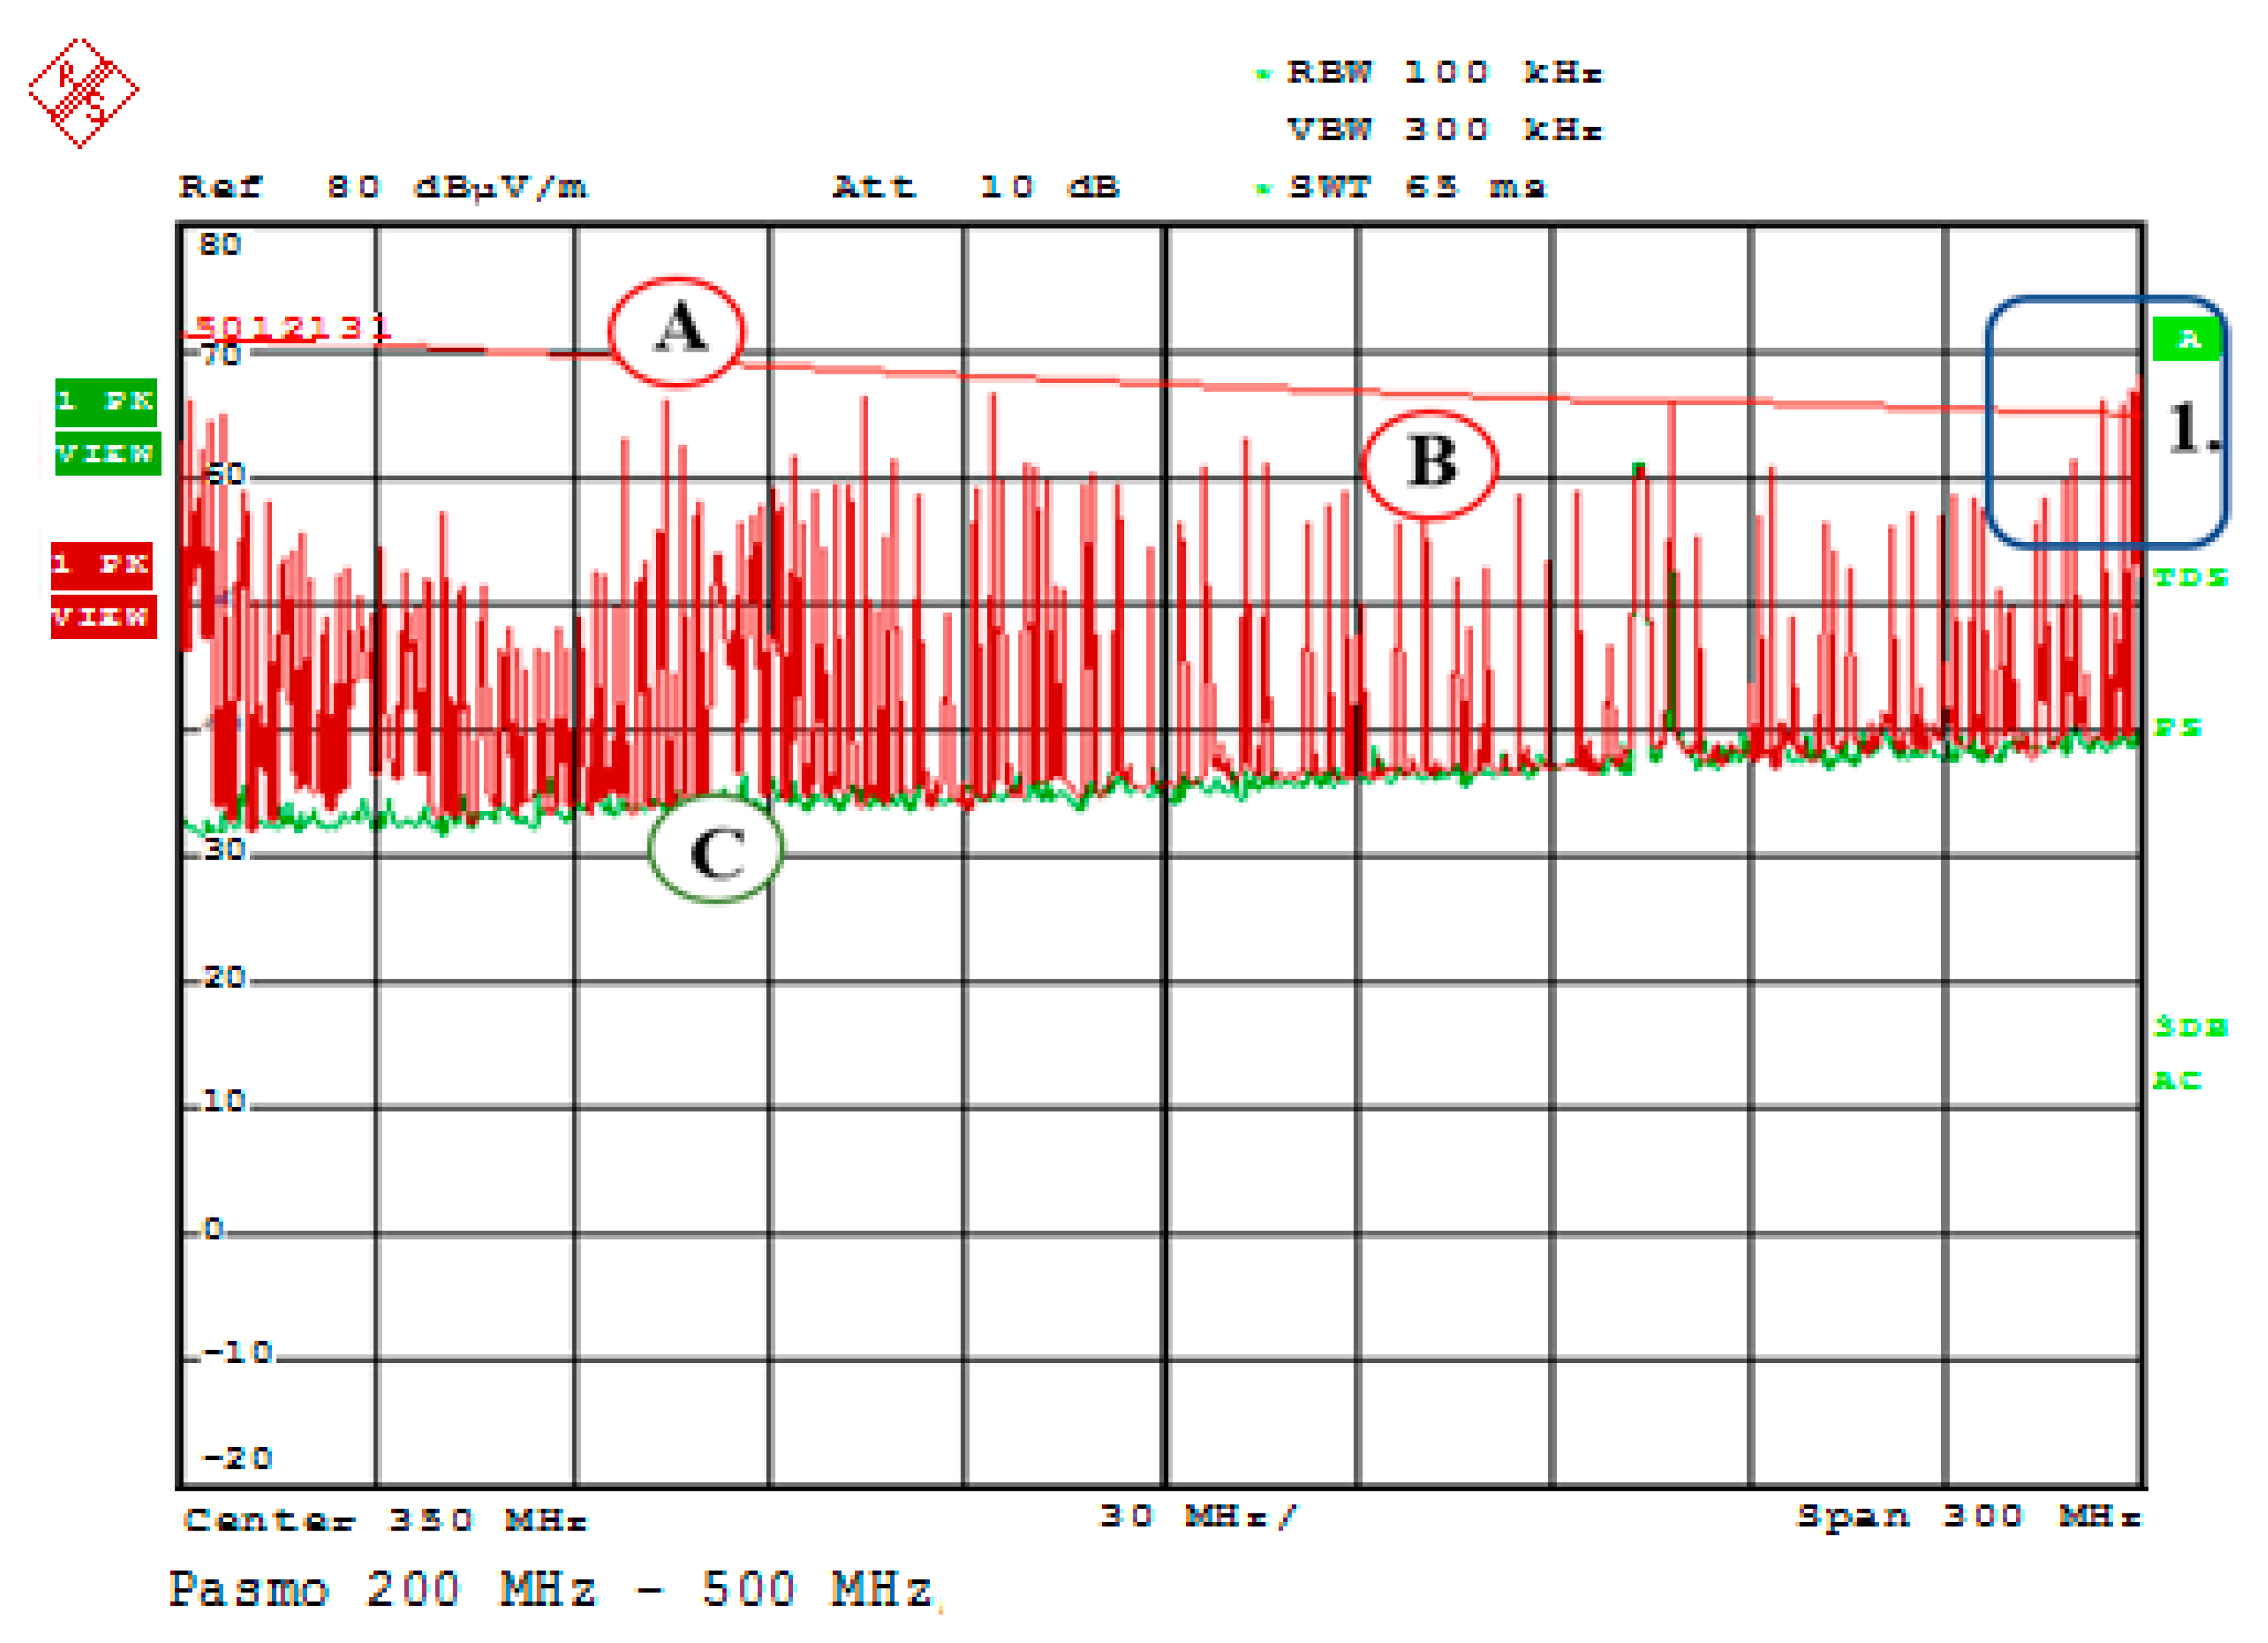
The spectra for the frequency range of 200 MHz–500 MHz in
Figure 13 clearly show changes in the values of radiated interfering signals for a traction unit moving at a speed of 50 km/h (marked as B). However, the permissible value specified in the standard is shown to be exceeded only at the end of the analysed spectrum analyser band, which is marked in
Figure 1 as 1. Exceeding this value is particularly evident at a frequency of 495.88 MHz (
Table 6).
The interfering signal spectrum also contains other parasitic signal lines of values significant to a moving vehicle (not present when measuring the electromagnetic background). The levels of interfering signals with such amplitudes and simultaneously within the high-frequency range may adversely impact the operation of, e.g., VMS cameras, where the video, control and power signals are routed through power cables over very long distances or transmitted as wireless. For this frequency range, the radiated interfering signal may induce undesired voltage or distort the video signal inside such a device, in the case of incorrect connection, discontinuity in ensuring screening, and also through the process openings of the camera (e.g., introduced elements for image adjustment at the camera installation location).
Figure 14 shows the spectra for a frequency range of 500 MHz–1 GHz. The presented waveforms clearly show they exceeded permissible interfering signal values for two rail vehicle test modes—background and movement. This exceedance is evident, particularly for two frequency subranges, marked in
Figure 14 as 1 and 2. At the same time, the interfering signal band is much wider for signals clustered around frequencies above 500 MHz (
Table 7). The levels of interfering signals with such amplitudes and very high frequencies may distort the correct operation of a VMS. For this frequency range, an incorrect connection, no screening or a video, control or power cable improperly terminated and connected with the ground may constitute an interfering signal receiving antenna.
In addition, production (process) openings located on metal housings of VMS devices constitute slot antennas that enable undesirable interfering signals to penetrate inside the housing. This leads to the possible induction of voltages from these frequency ranges on the outside of these devices, which has an adverse effect on the functioning of all security systems operated within an extensive railway area, the tested VMS in this case.
Rail vehicles moving with a speed greater than 50 km/h will generate higher interference spectrum signal amplitudes within this frequency range. This is related to the higher consumption of the current from the railway overhead contact line. The power of the consumers installed onboard a rail vehicle will be burdened with the higher currents associated with increased speed, particularly in the case of power and electronic devices such as voltage transformers in a locomotive or traction motors. The authors intend to implement such research in the future to be able to demonstrate the impact of vehicles moving during such tests at speeds different than 50 km/h. This will be a study of an experimental nature, deviating from the requirements of the standard.
3.2. The Impact of Radiated Interference Generated by a Rail Vehicle on the Operation of Selected VMS Elements
An external electromagnetic field radiated by a rail vehicle in the high-frequency range penetrates inside security system VMS camera circuits through the mechanisms of direct electromagnetic field coupling, inducing fault current I
i in the power, signal, video and control cables. Due to the impedance Z
k of the aforementioned cables, the flowing fault current induces voltage U
i, which may impact the camera’s electronic output elements, e.g., the output amplifier operating point, as shown in
Figure 15. Through these cables, the video signal transmission bus and the power and control cables for a VMS device, e.g., a camera, “collect” the high-frequency fault current generated unintentionally by a rail vehicle travelling at a speed of 50 km/h. In particular, this effect occurs for a frequency range above 200 MHz, which is also evident in
Figure 14, showing the interfering signal spectrum for a frequency band of 500 MHz–1 GHz. Incorrect cables routed to the cameras can constitute receiving antennas in the case of these interfering signal frequencies. Particularly in the event of unprofessional termination—connection of the screen to the ground (camera metal housing). In addition, the process of “openings and slots” of a camera employed to introduce/route out cables and local camera technical parameter adjustment may become slot antennas that receive interference signals from a rail vehicle, as shown in
Figure 1. Impacted by an undesirable electromagnetic field, the fault current induced in the a/m cables and electronic output elements of a camera may, e.g., change the operating point of active output amplifier elements, leading to signal distortions. The useful signal, together with the fault current, also leads to a change in the reference potential of the camera as a result of coupling through mutual impedance Z
k.
A camera placed in a tamper-proof metal housing executes two coupling types—direct serial coupling by the radiated interfering electromagnetic field originating from the rail vehicle and parallel coupling by passive elements, Zk and Cp1, Cp1 (cable—metal housing parasitic capacitances) in this case. The coupling is also implemented by parasitic capacitance Cpp of the camera electronic output board—PCB, relative to the VMS camera metal housing. Parasitic coupling between the PCB and the VMS camera metal housing can be minimized by reducing the parasitic capacitance Cpp between a circuit particularly sensitive to camera distortions and the ground or by reducing rapid voltage changes (dUi/dt), which occur within a passive element and are beyond our control since they are generated by a rail vehicle.
In addition, the occurrence of Ui interference on the Zk impedance creates a possibility of an additional coupling through the so-called crosstalk of inductive or capacitive nature. It occurs within long cables between the VMS camera and the alarm receiving centre. In such a case, the difference in the potential (interference voltage Ui) between the cable (signal, control or power) and the metal camera housing always generates an alternating electric field around this conductor.
The electromagnetic field change generates current as it occurs, which is induced in the aforementioned cables in the case of no screening, damage or discontinuity. These cables are always near a bus for transmitting a video signal from a railway area. In such a case, we are dealing with the so-called capacitive crosstalk (cameras are also powered through signal cables or POE). Capacitive crosstalk coupling is always implemented by interfering signals. The crosstalk occurring within a camera output circuit (r) is always proportional to the rate of changes in this interfering voltage over time, as shown in
Figure 15. In the event of inductive crosstalk for previously discussed cases, particularly important is the rate of current changes over time (dI
i/dt), which may be generated within cables due to inductance or demand changes, e.g., in the overhead contact line or power line supplying an entire extensive railway area.
4. Assessment of the Impact of Emitted Radiated Interference Generated by a Rail Traction Vehicle on Trackside Video Monitoring Systems
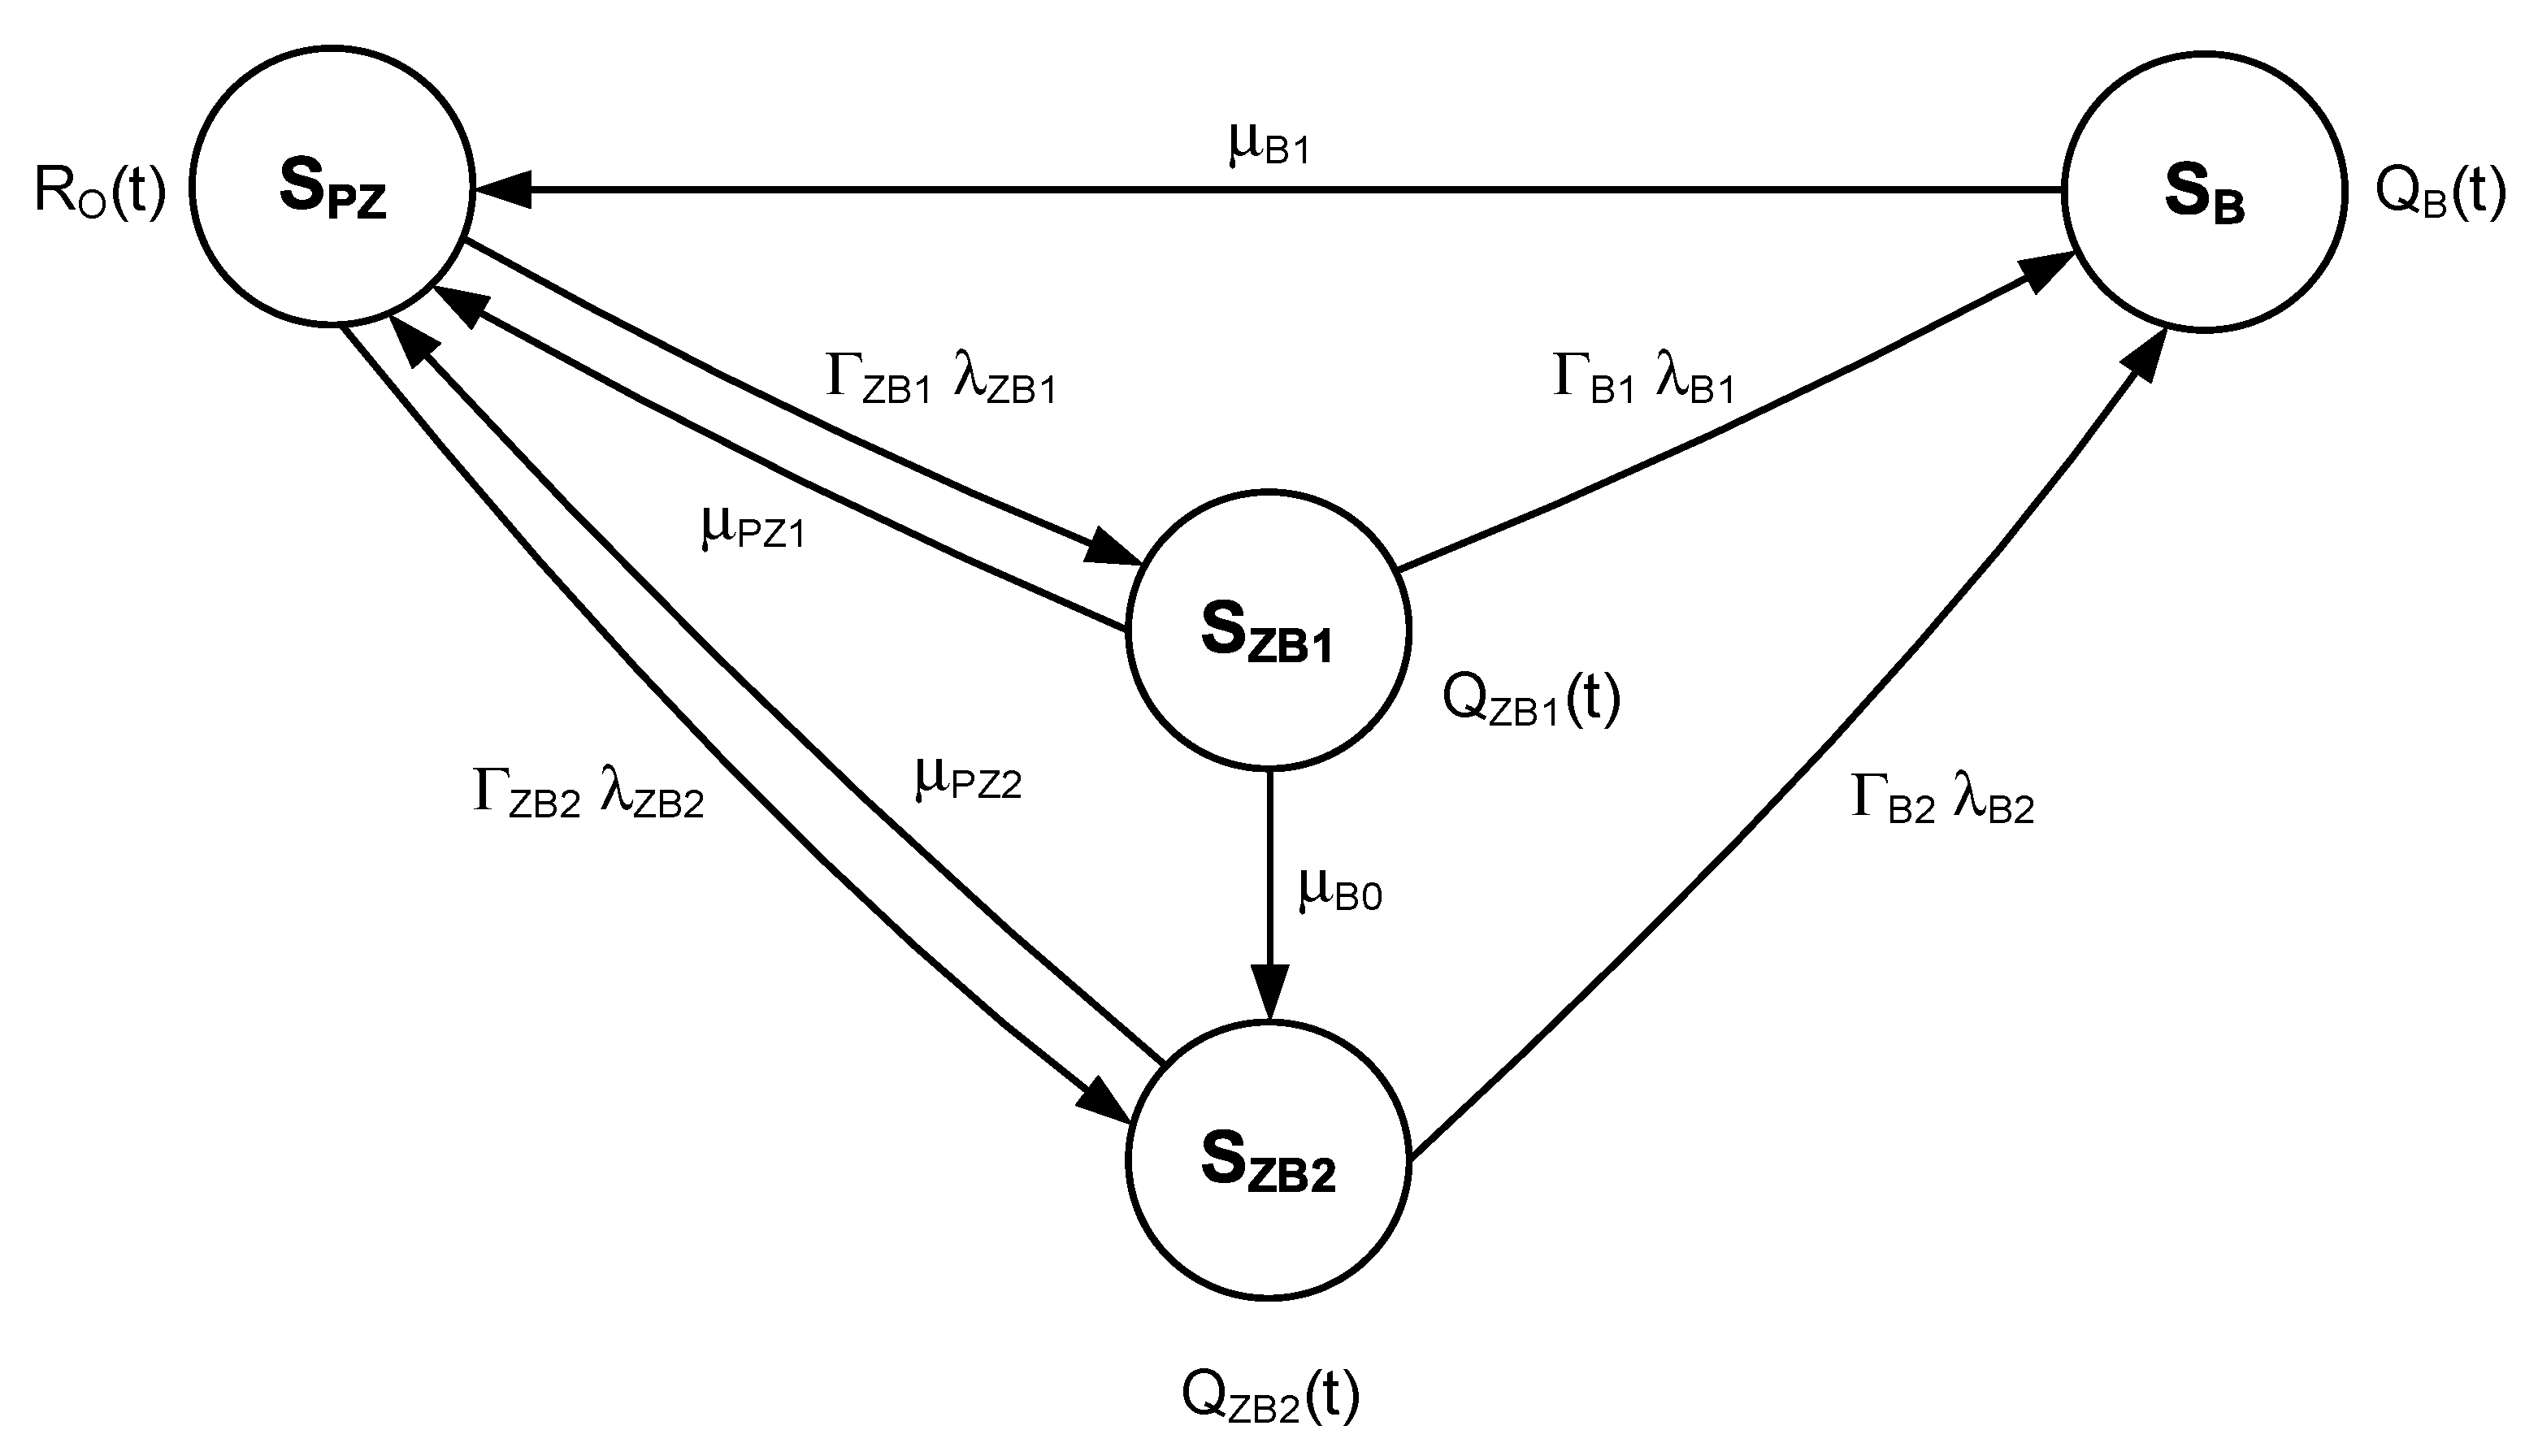
Analysing the impact of emitted radiated interference generated by a rail traction vehicle on a trackside video monitoring system makes it possible to illustrate the reliability and operational relationships, such as the example shown in
Figure 15.
RO(t)—probability function of a trackside video monitoring system staying in a state of full fitness SPZ,
QZB1(t)—probability function of a trackside video monitoring system staying in a state of partial fitness I SZB1,
QZB2(t)—probability function of a trackside video monitoring system staying in a state of partial fitness II SZB2,
QB(t)—probability function of a trackside video monitoring system staying in a state of unfitness SB,
λZB1—intensities of transition from a state of full fitness SPZ to a state of partial fitness I SZB1,
λZB2—intensities of transition from a state of full fitness SPZ to a state of partial fitness II SZB2,
μPZ1—intensities of transition from a state of partial fitness I SZB1 to a state of full fitness SPZ,
μPZ2—intensities of transition from a state of partial fitness II SZB2 to a state of full fitness SPZ,
μB0—intensities of transition from a state of partial fitness I SZB1 to a state of full fitness II SPZ,
μB1—intensities of transition from a state of unfitness SB to a state of full fitness SPZ,
λB1—intensities of transition from a state of partial fitness I SZB1 to a state of unfitness SB,
λB2—intensities of transition from a state of partial fitness II SZB2 to a state of unfitness SB,
ΓZB1, ΓZB2, ΓB1, ΓB2—impact coefficients of radiated interference.
Full fitness SPZ is a state in which a trackside video monitoring system functions correctly. Partial fitness SZB1 is a state in which a trackside video monitoring system is partially fit (parallel coupling occurs). Partial fitness SZB2 is a state in which a trackside video monitoring system is partially fit (serial coupling occurs). Unfitness SB is a state in which a trackside video monitoring system is unfit (radiated interference exceeds permissible values).
Suppose a trackside video monitoring system is in a state of full fitness SPZ and the interference occurs in the form of parallel coupling. In that case, the system switches to a state of partial fitness I SZB1 with the intensity of λZB1. If a trackside video monitoring system is in a state of partial fitness I SZB1, then it is possible to switch to a state of full fitness SPZ, provided that actions are taken to restore the state of fitness.
In the event of a state of partial fitness I SZB1 and the interference exceeding permissible values, the system switches to a state of unfitness SB with the intensity of λB1.
If a trackside video monitoring system is in a state of full fitness SPZ and interference occurs in the form of parallel coupling, then the system switches to a state of partial fitness II SZB2 with the intensity of λZB2. Suppose a trackside video monitoring system is in a state of partial fitness II SZB2. In that case, it is possible to switch to the state of full fitness SPZ, provided that actions aimed at restoring the state of fitness are taken.
In the event of a state of partial fitness II SZB2 and the radiated interference exceeding permissible values, the system moves to a state of unfitness SB with an intensity of λB2.
If a trackside video monitoring system is in a state of partial fitness I SZB1 and radiated interference changes from parallel to serial coupling, then the system switches to a state of partial fitness II SZB2 with the intensity of µB0.
Suppose a trackside video monitoring system is in a state of unfitness SB and remedial actions are taken to restore a state of fitness. In that case, it switches to a state of full fitness SPZ with the intensity of µB1.
The system shown in
Figure 15 has been characterized by the following Chapman–Kolmogorov equations:
By adopting the following initial conditions:
and using mathematical transformations (including the Laplace transform), the sought-after probability of a trackside video monitoring system staying in a state of full fitness was calculated for the following input data:
As a result of the adopted input data, using the system of Equations (1), we get:
Ultimately, we get the relationship:
and the final result:
The impact of EMI on VMS depends on applied solutions (structural, organizational) aimed at minimizing the effect EMI has on the system’s operation. The graph presented in the article, which depicts the impact of emitting radiated interference generated by a rail traction unit on a trackside visual monitoring system and the obtained mathematical relationships, enables a numerical assessment of the applied solutions aimed at mitigating the impact of EMI on VMS. In practice, this allows for the rational selection of solutions that will be effective and economically justified [
91,
92].


 ,
, 


