Article

A Monitoring System Based on NB-IoT and BDS/GPS Dual-Mode Positioning

Department of College of Information and Intelligence Engineering, Zhejiang Wanli University, Ningbo 315104, China
*
Author to whom correspondence should be addressed.
Electronics 2022, 11(16), 2493; https://doi.org/10.3390/electronics11162493
Submission received: 7 July 2022 / Revised: 6 August 2022 / Accepted: 7 August 2022 / Published: 10 August 2022
(This article belongs to the Topic IoT for Energy Management Systems and Smart Cities)

Abstract

:
Monitoring system is widely used to detect the environment parameters such as temperature, humidity and position information in cold chain logistic, modern agriculture, hospital and so on. Poor position precision, high communication cost, high packet loss rate are the main problems in current monitoring system. To solve these problems, the paper presents a new monitoring system based on Narrow Band Internet of Things (NB-IoT) and BeiDou system/Global System Position (BDS/GPS) dual-mode positioning. Considering the position precision, a dual-mode positioning circuit based on at6558 is designed, and the calculation formula of the positioning information of the monitored target has been derived. Subsequently, a communication network based on wh-nb75-ba NB-IoT module is designed after compared with the LoRa technology. According to the characteristics of high time correlation of sensor data, an adaptive optimal zero suppression (AOZS) compression algorithm is proposed to improve the efficiency of data transmission. Experiments prove the feasibility and effectiveness of the system from the aspects of measurement accuracy, positioning accuracy and communication performance. The temperature and humidity error are less than 1 °C and 5% RH respectively with the selected sensor chips. The position error is decided by several factors, including the number of satellites used for positioning, the monitored target moving speed and NB-IoT module lifetime period. When the monitored target is stationary, the positioning error is about 2 m, which is less than that of the single GPS or BDS mode. When the monitored target moves, the position error will increase. But the error is still less than that of the single GPS or BDS mode. Then the AOZS compression algorithm is used in actually experiment. The compression ratio (CR) of it is about 10% when the data amount increasing. In addition, the packet loss rate test experiment proves the high reliability of the proposed system.

1. Introduction

Monitoring system can detect environmental parameters such as temperature, humidity and location information, and send these information to the monitoring center, which greatly reduce the workload of staff and enhanced management efficiency. Hence, it has gotten more and more recognition and application in cold chain logistic monitoring, modern agriculture arrangement, hospital monitoring and so on. Due to hardware technology, communication network and other reasons, the system still has the following deficiencies:
(i) Poor positioning precision, especially for the moving object. Currently, the positioning error is about 50 m for the stationary object, while that is more than 100 m for moving object. (ii) High cost, especially for the communication cost. The hardware cost is a one-time investment, but the communication cost needs to be paid for every day. Actually, the transmission data amount of a monitoring system is small, but it needs to communicate with the monitoring center through 3 g/4 g network, so it has to pay for the expensive network resources, and the cost of communication is very high. (iii) Unreliable network performance, poor stability and high packet loss rate. The packet loss rate of existing monitoring systems is about 10% when the distance is about 1 km. When the communication network becomes worse, the packet loss rate will be higher. Therefore, it is essential to develop a monitoring system with high reliability and low cost.
Generally, the monitoring system mainly includes the three parts: communication network design, position function design and realization, and data transmission. The data transmission network of the monitoring system belongs to long-distance network. 4 g and low-power wide area network (LPWAN) are main long-distance communication. 4 g has high power consumption and high traffic cost, which is not suitable for non-real time communication. LoRa and NB-IoT are representative technologies of LPWAN [1]. LoRa is a physical layer technology which uses a proprietary spread spectrum technique to modulate signals in sub-GHz ISM bands. The bidirectional communication of LoRa is provided by the chirp spread spectrum (CSS) modulation that spreads a narrow-band signal over a wider channel bandwidth. The resulting signal has low noise levels, enabling high interference resilience and is difficult to detect or jam [1]. It provides long-range communication up to 10–40 km in rural areas and 1–5 km in urban areas and has very high energy efficiency [2,3,4]. Compared to LoRa, NB-IoT can use the current 3 g/4 g network to save the network cost and shortens the developing period with the license frequency band [5,6,7]. It uses a minimum system bandwidth of 180 kHz for downlink and uplink communication and can be deployed in three operating modes: (a) Stand-alone, (b) Guard band, and (c) In-band [8,9,10]. The physical channels and signals of NB-IoT are time-division multiplexed. The data rate for uplink is about 160 to 200 kHz and 160 to 250 kHz for downlink. The coverage is 18 km in cities and 25 km in suburbs. Because of the above advantages, NB-IoT has been widely used in many fields [11,12,13]. It is regarded to be a very important technology and a large step for 5 g IoT evolution [14,15]. Many famous companies have shown great interest in NB-IoT as part of 5 g systems, and spent lots of effort in the standardization of NB-IoT [16,17]. Shi proposed a smart parking system using NB-IoT communication technology, which can effectively improve the utilization rate of the existing parking facilities [18]. Anand presented a remote monitoring mechanism for the water level in a storage tank using NB-IoT [19]. Haibin studied NB-IoT in smart hospitals [20]. An infusion monitoring system was developed to monitor the real-time drop rate and the volume of remaining drug during the intravenous infusion. Srikanth put forward the utilization of onshore narrowband IoT infrastructure for tracking of containers transported by marine cargo vessels while operating near the coastline [21]. Xihai applied NB-IoT in an Information monitoring system to reduce the power consumption [22]. Cao applied the NB-IoT in intelligent traffic lights system for urban areas in Vietnan to reduce traffic congestion [23]. The above studies show that NB-IoT is oriented to applications that require high QoS and low latency and has strong links, high coverage, low power, and low cost [24]. Because of these, the paper proposed the monitoring system scheme based on NB-IoT.
BeiDou satellite System (BDS) is a global positioning system independently developed by China. Its space station consists of 5 geostationary orbit satellites and 30 non-geostationary orbit satellites, while the space station of Global Position System (GPS) consists of 24 satellites (21 working satellites and 3 standby satellites). The user terminal of BDS has double-direction message communication, and the user can transmit short-message information of 40–60 Chinese characters per time [25]. GPS does not have the function of short-message communication. Unlike GPS which uses dual-frequency signals, BeiDou-3 uses triple-frequency signals, which can better eliminate the effect of the ionosphere and improve the positioning reliability and accuracy [26,27,28]. With the initial service provided by the BDS foundation strengthening system, it can provide meter-level, sub-meter-level, decimeter-level and even centimeter -level service. In addition, BeiDou-3 satellite network has laid an “inter satellite link” in space. Thus, all satellites in the constellation can be connected without global stations, and the satellites can continue to provide services even if they are disconnected from the ground. Because of these advantages, BDS begins to be widely used to measure height [29], vehicle position [30], anomaly detection [31], and train position [32], etc. Some scholars propose to combine BDS with other positioning technologies to produce higher cost performance [33,34,35]. However, for both BDS or GPS, the number of observation satellites in a single satellite navigation system is limited, they will become extremely vulnerable in the case of severe environmental interference, and they cannot guarantee the positioning accuracy and availability of the receiver. Since GPS and BDS have common features in system design and positioning principle, the receiver can simultaneously receive the satellite signals of the two satellite navigation systems for dual-system integrated positioning to avoid the situation that a single satellite system cannot locate due to the lack of satellites. Therefore, in theory, BDS/GPS dual mode positioning can optimize the satellite position and improve the accuracy and availability of positioning results. This paper will use the BDS/GPS dual mode positioning system to improve the positioning accuracy.
In wireless sensor networks, there is a large amount of redundant information in the original data collected by sensor nodes, including the temporal redundancy collected by the same node at adjacent times and the spatial redundancy collected by adjacent nodes in geographical areas [36]. If the data carrying a large amount of redundant information is transmitted, the communication bandwidth will be wasted and increased network delay and node energy consumption, which will affect the stability and life of the whole sensor network system. Compressing redundant information before transmitting original data is a mechanism that can effectively reduce node energy consumption. In recent years, researchers have proposed many data compression algorithms for wireless sensor networks. The main algorithms for wireless sensor data are divided into compression based on time correlation and compression based on space correlation. Data compression algorithm based on time correlation is a kind of typical compression algorithm. It often focuses on mining data time correlation and removing data time redundancy with the help of some classical coding technologies, such as Huffman [37], LZW [38], S-LZW [39], LEC [40], RLE [41]. The data compression algorithm based on spatial correlation is also a typical compression algorithm, which is often combined with clustering mechanism [42,43,44], and strives to fully mine the spatial correlation of data and reduce and balance the energy consumption of each node of the network. Data compression algorithms based on temporal and spatial correlation have attracted more and more attention. For example, the algorithm proposed by Ciancio and Donoho [45,46] not only involves removing the temporal redundancy of data, but also discusses how to establish an optimal path, so that the spatial redundancy can be removed to the greatest extent when the data is transmitted along this path. Difference mechanism is often used in data compression [47,48,49]. The common point of the data compression algorithm based on the difference mechanism is that by selecting a reference data, a single sensor node only needs to transmit the difference between the original sensing data and the reference data, so as to remove the temporal redundancy, or the adjacent sensor nodes in the geographical region only need to transmit the difference between their original sensing data and the reference data, so as to remove the spatial redundancy. The difference between these algorithms is the choice of difference coding. Differential Code Compression Method (DCCM) is the typical algorithm. The disadvantages of DCCM algorithm are: (i) simply taking the average value of data as the reference value, which is lack of rationality; (ii) The correlation between data is not mined. So the paper will propose a new algorithm to compress the sensor data.
In view of the problems in the above literature, the paper proposes a monitoring system scheme with high positioning accuracy, low cost and high network reliability. Three main contributions of this paper can be summarized as follows:
(i)
A new positioning system based on BeiDou System/Global Position System is proposed to improve the position accuracy. The hardware and software are introduced in detail in the paper. In the dual positioning system, more satellites can be obtained to calculate position information. The calculation formulas have also been derived.
(ii)
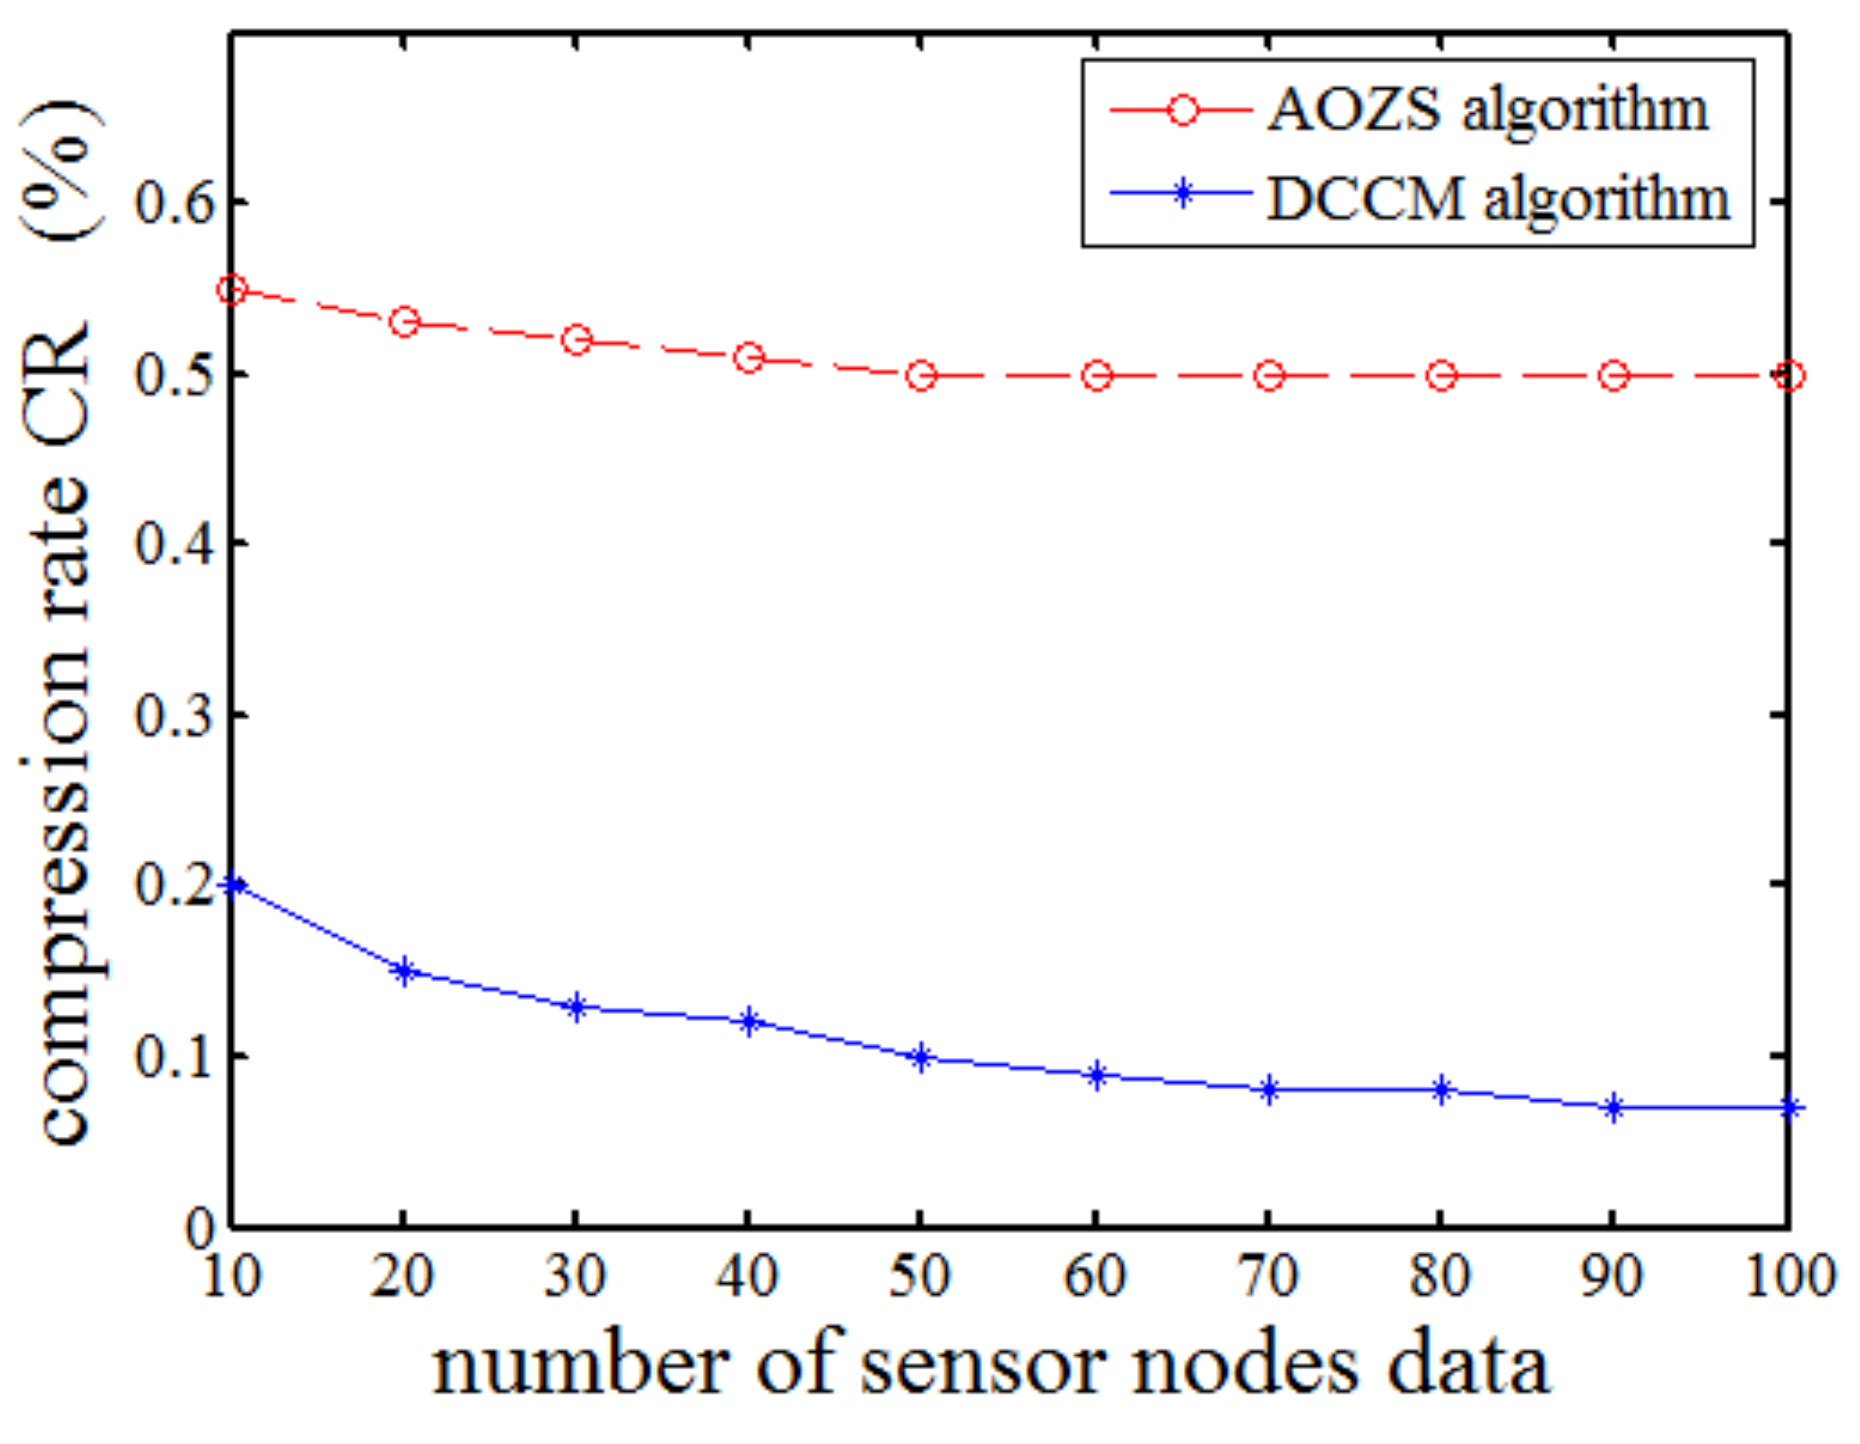
A new data compression algorithm is proposed. The new algorithm removes data redundancy according to the time correlation between data, and the compression rate is about 90%, while the complexity of it is similar to that of the commonly used algorithms.
(iii)
A transmission network system based on NB-IoT for the compressed data is proposed. Compared with LoRa technology, the system is more stable, more reliable and lower packet loss rate through the experiment. The development period of the system is shorter and the cost is lower.
The remaining paper is organized as follows. Section 2 describes the monitoring system in detail, including hardware design and software design. Section 3 gives the results and test data. Section 4 presents the discussion and analysis. Finally, Section 5 presents conclusions.

2. Materials and Methods

According to the framework of IoT, the network frame of the proposed scheme is divided into four parts: data acquisition layer which includes sensor nodes and sink nodes, communication layer which is NB-IoT station, application layer which is IoT cloud platform and user layer which is the monitoring center. The sensor node is the detection terminal which is used to detect the information around the sensor and send these information to the sink node. The sink node is used to receive the information from the sensor nodes and compress the information and send it to the IoT cloud platform. The whole hardware frame of the monitoring system is shown in Figure 1. The monitoring system includes one monitoring center which is in PC, and two mobile carriages. Each carriage includes one sink node and three sensor nodes. The sensor node is mainly composed of a stm8 MCU, a temperature and humidity sensor, a RFID module and lithium battery. Stm8 controls the temperature and humidity sensor to collect the temperature and humidity information nearby, and then send the information to the sink node through the RFID. The sink node is mainly composed of a stm32 MCU, a TFT display panel, a RFID module, a BDS/GPS module, a NB-IoT module and battery. Stm32 receives the temperature and humidity information from the sensor node through RFID and gets the position information from BDS/GPS module, then compresses and sends these data to the OneNET cloud platform through the NB-IoT module. The monitoring center is in PC. The temperature and humidity of each sensor node, the sink node position can be acquired in monitoring center by accessing the cloud platform. My SQL database is used to manage current and historical data. Real time map of each mobile carriage can also be displayed.

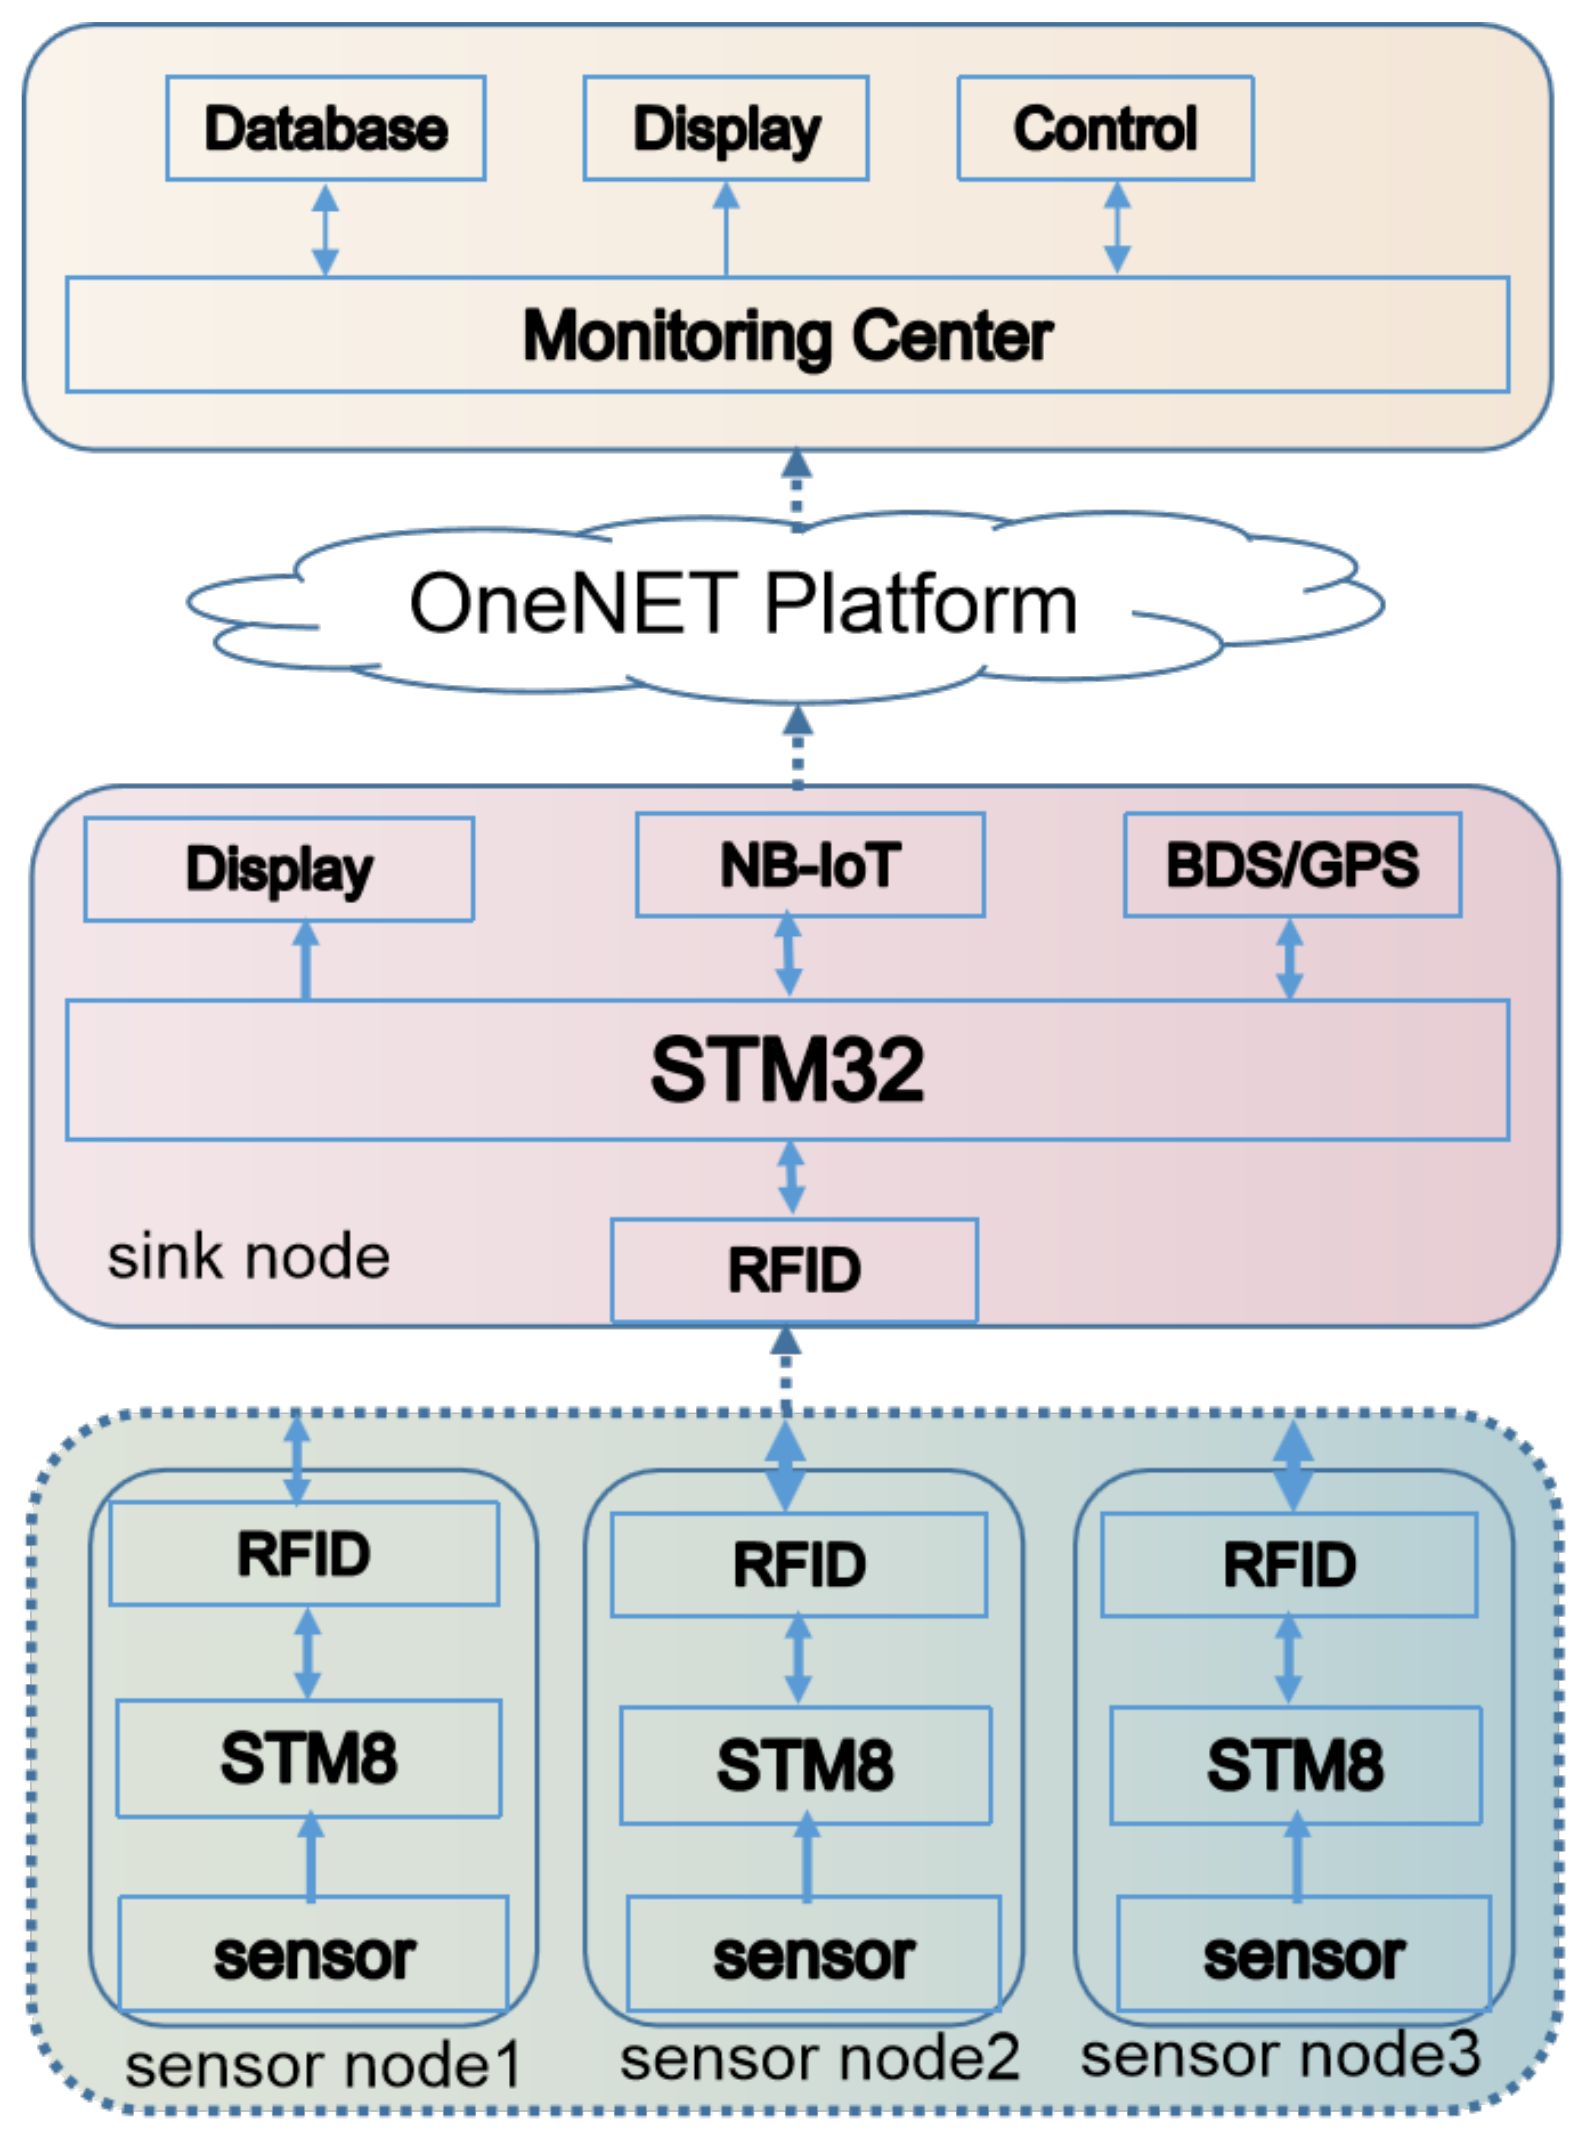
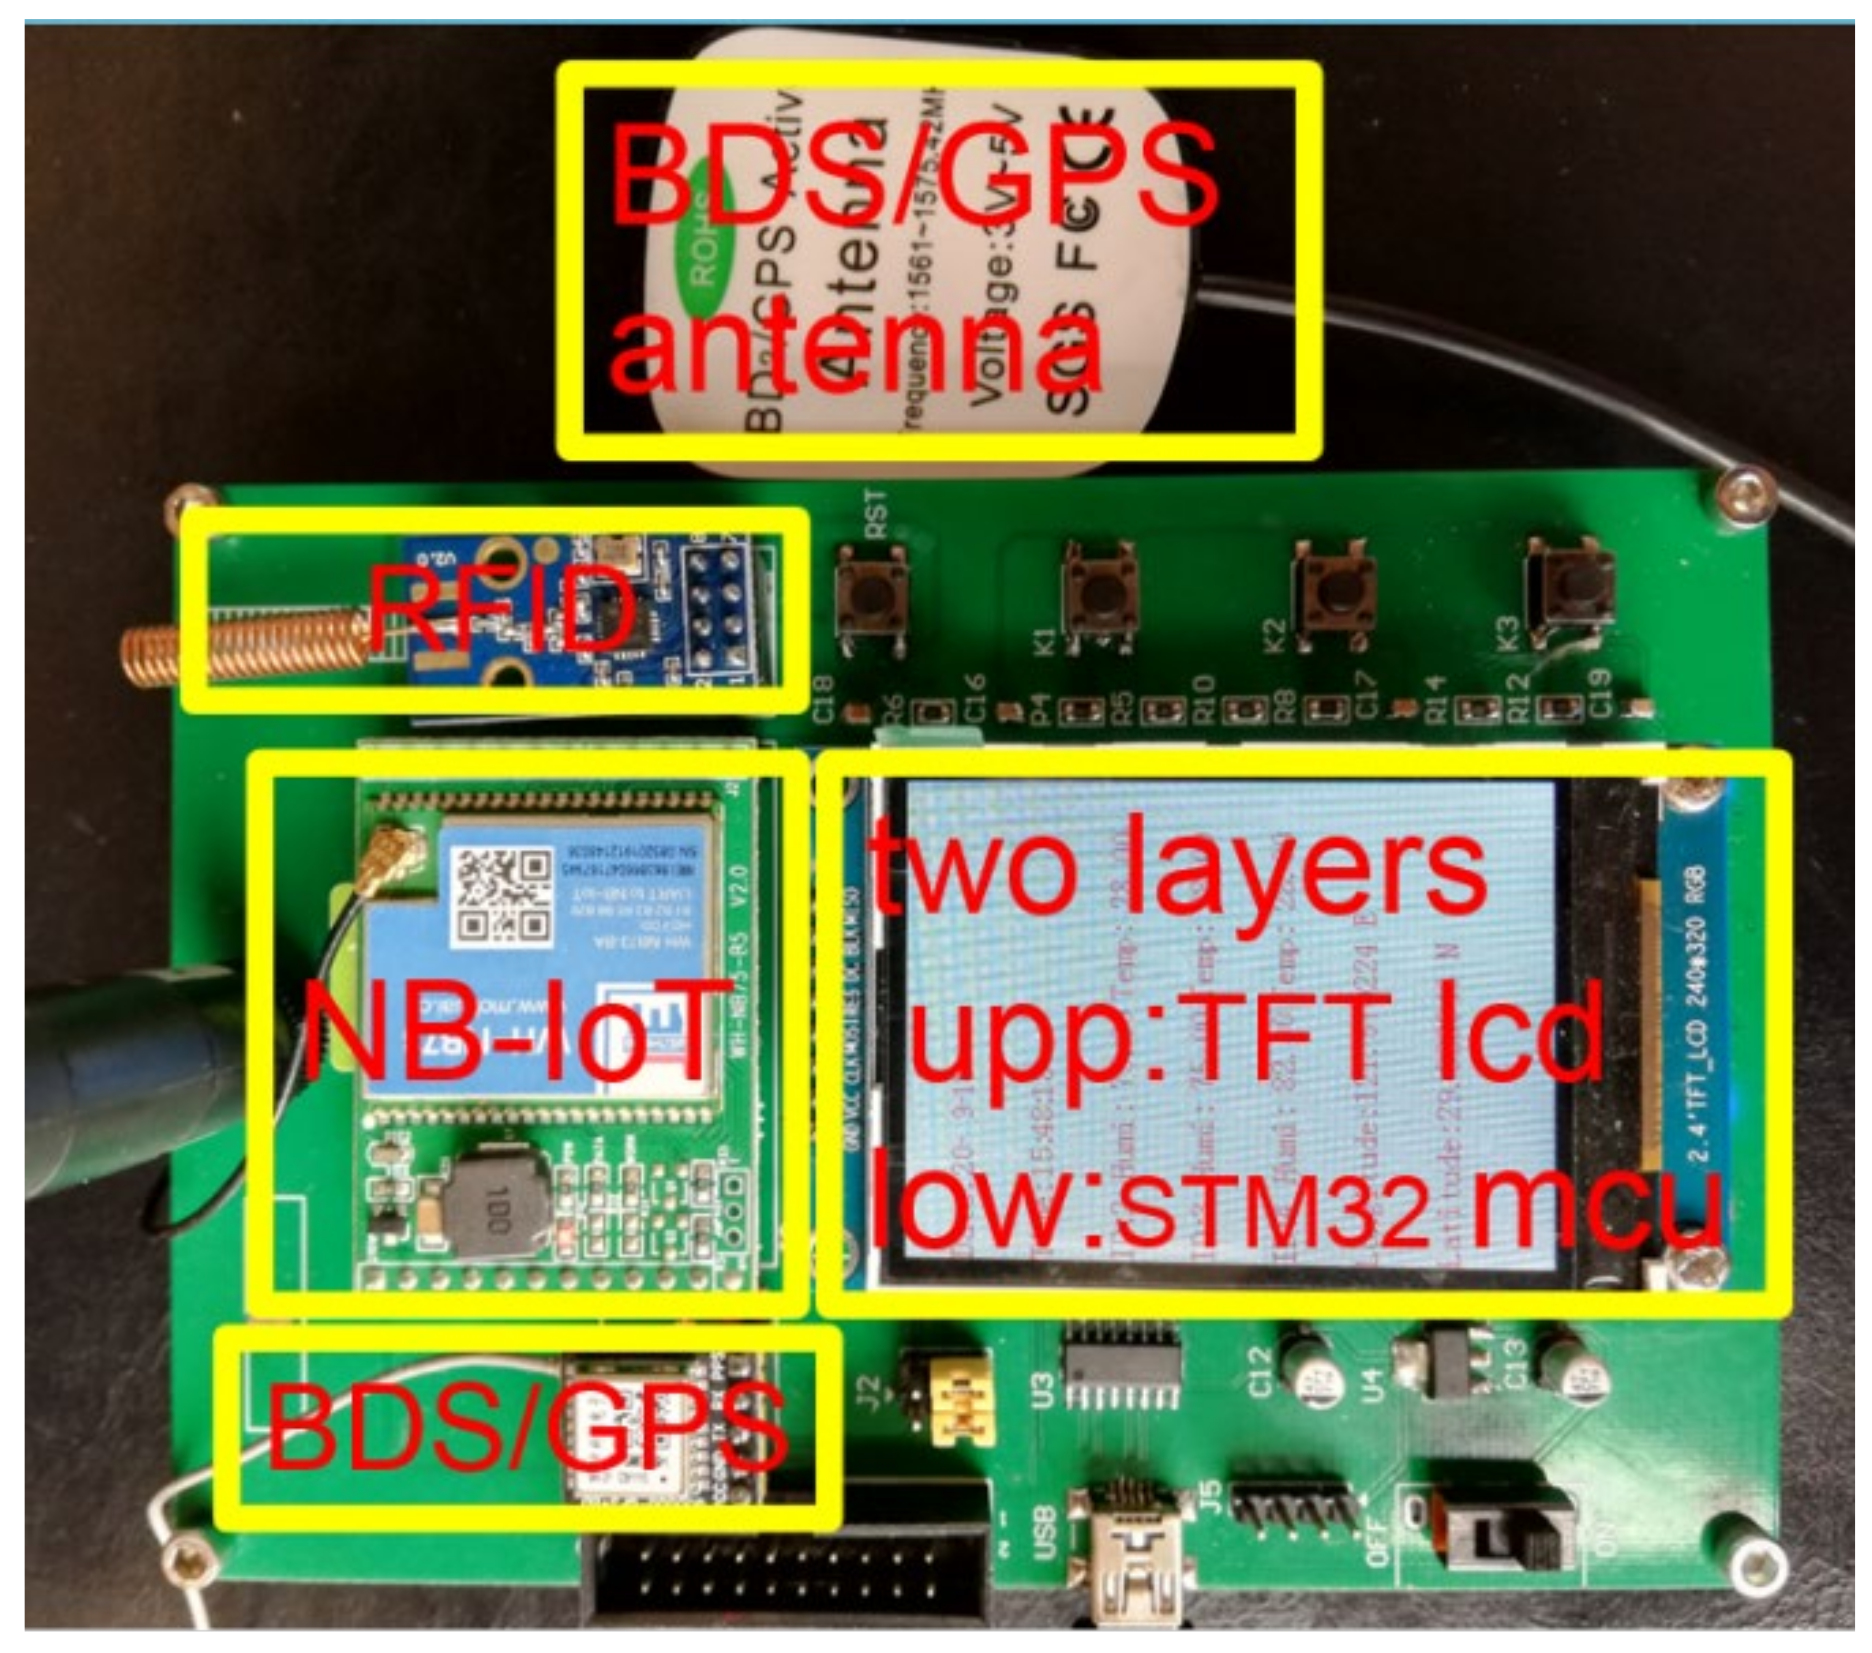
2.1. Hardware Design

The hardware of monitoring system includes two parts, one is the sink node hardware, the other is the sensor node hardware. The hardware of sink node includes stm32f103c8t6, cc1101 RFID module, wh-nb75-ba NB-IoT module, at6558 BDS/GPS positioning module, TFTLCD display screen, key module, 3.3 V voltage regulator module and several LED lights. The system is powered by 5 V battery. The physical hardware is shown in Figure 2. The wh-nb75-ba can access mobile developer platform OneNET for free, communicate with MCU by UART and configure with AT instruction set [50]. The positioning data collected by BDS/GPS module and temperature and humidity data sent by sensor nodes are sent to NB-IoT module through UART port during UART interrupt, and finally uploaded to cloud platform. At6558 chip is used in the positioning module with BDS/GPS dual positioning mode to obtain higher positioning accuracy. It is a real six in one multi-mode satellite navigation and positioning chip, which contains 32 tracking channels and can receive global navigation satellite system (GNSS) signals of six satellite navigation systems at the same time, and realize joint positioning, navigation and timing. This chip has high sensitivity, low power consumption and low cost, which is suitable for vehicle navigation, hand-held positioning and wearable devices [51]. The chip communicates with MCU through UART serial port. The baud rate of UART serial port is set to 9600, and the data format is strictly in accordance with international NMEA0183 standard. It is a low power chip. The working current is less than 23 mA, the sleep current is less than 10uA. RFID module cc1101 is a kind of RF application which is lower than 1 GHz for ultra-low power consumption. It has high data transmission speed and long transmission distance. It is connected with MCU through 4-wire SPI interface and provides two universal digital output pins with configurable functions [52]. The 2.3-inch TFTLCD is a color LCD, which can exchange data with MCU through SPI interface. CH340 is used to down load the program in the PC to the stm32. In addition, some LED lights are used to indicate whether modules are connected successfully or not. Some keys are used to reset system or initialize modules.
The hardware of each sensor node includes stm8s103f3p MCU, cc1101 module, dht11 temperature and humidity sensor chip, using dry battery for power supply. The hardware block diagram of sensor node is shown in Figure 3. The stm8s103f3p MCU of the sensor node which has various communication protocols such as I2C, SPI and UART are designed in the 20 pins. It has 8 KB flash program memory and 1 KB RAM space that is fully competent for the current temperature and humidity acquisition and subsequent data acquisition. There are 46 working state configuration registers and 32 command registers. The temperature and humidity sensor DHT11 has a single bus bidirectional serial communication interface, which can be directly connected with the serial port of MCU. It can measure temperature and humidity at the same time. The measurement accuracy of humidity is ±5% RH, that of temperature is ±1 °C. In view of the low precision requirement, and the focus of our research is low power consumption, so we use this chip. It should be emphasized that in order to reduce the power consumption, the MCU does not read the temperature and humidity value of DHT11 all the time, but only reads when receiving the reading request from the sink node. SWD is used to load down the program from the PC to stm8s103f3p.

2.2. Software Design

According to the hardware frame in Figure 1, the software of monitoring system includes three parts: (i) the sink node software. Receiving the data sent by each sensor node, starting the positioning module to obtain the positioning information, configuring the cloud platform, and compressing and sending the received data and so on must be completed by the software of the sink node. Before the sink node sends data, the cloud platform must be configured according to the actual situation. Then the data sent by the sink node can be stored in the cloud platform. The cloud platforms of different NB-IoT companies are different. People need to refer to the user manual for configuration. (ii) the sensor node software. The main task of sensor node software is to start each sensor on the node to make them work normally, then collect their data and send them to the sink node. (iii) the monitoring center software. The software of the monitoring center needs to download temperature, humidity and positioning information from the cloud platform and store them in the database. In addition, it also needs to display the location information on the map and draw the temperature and humidity curve.

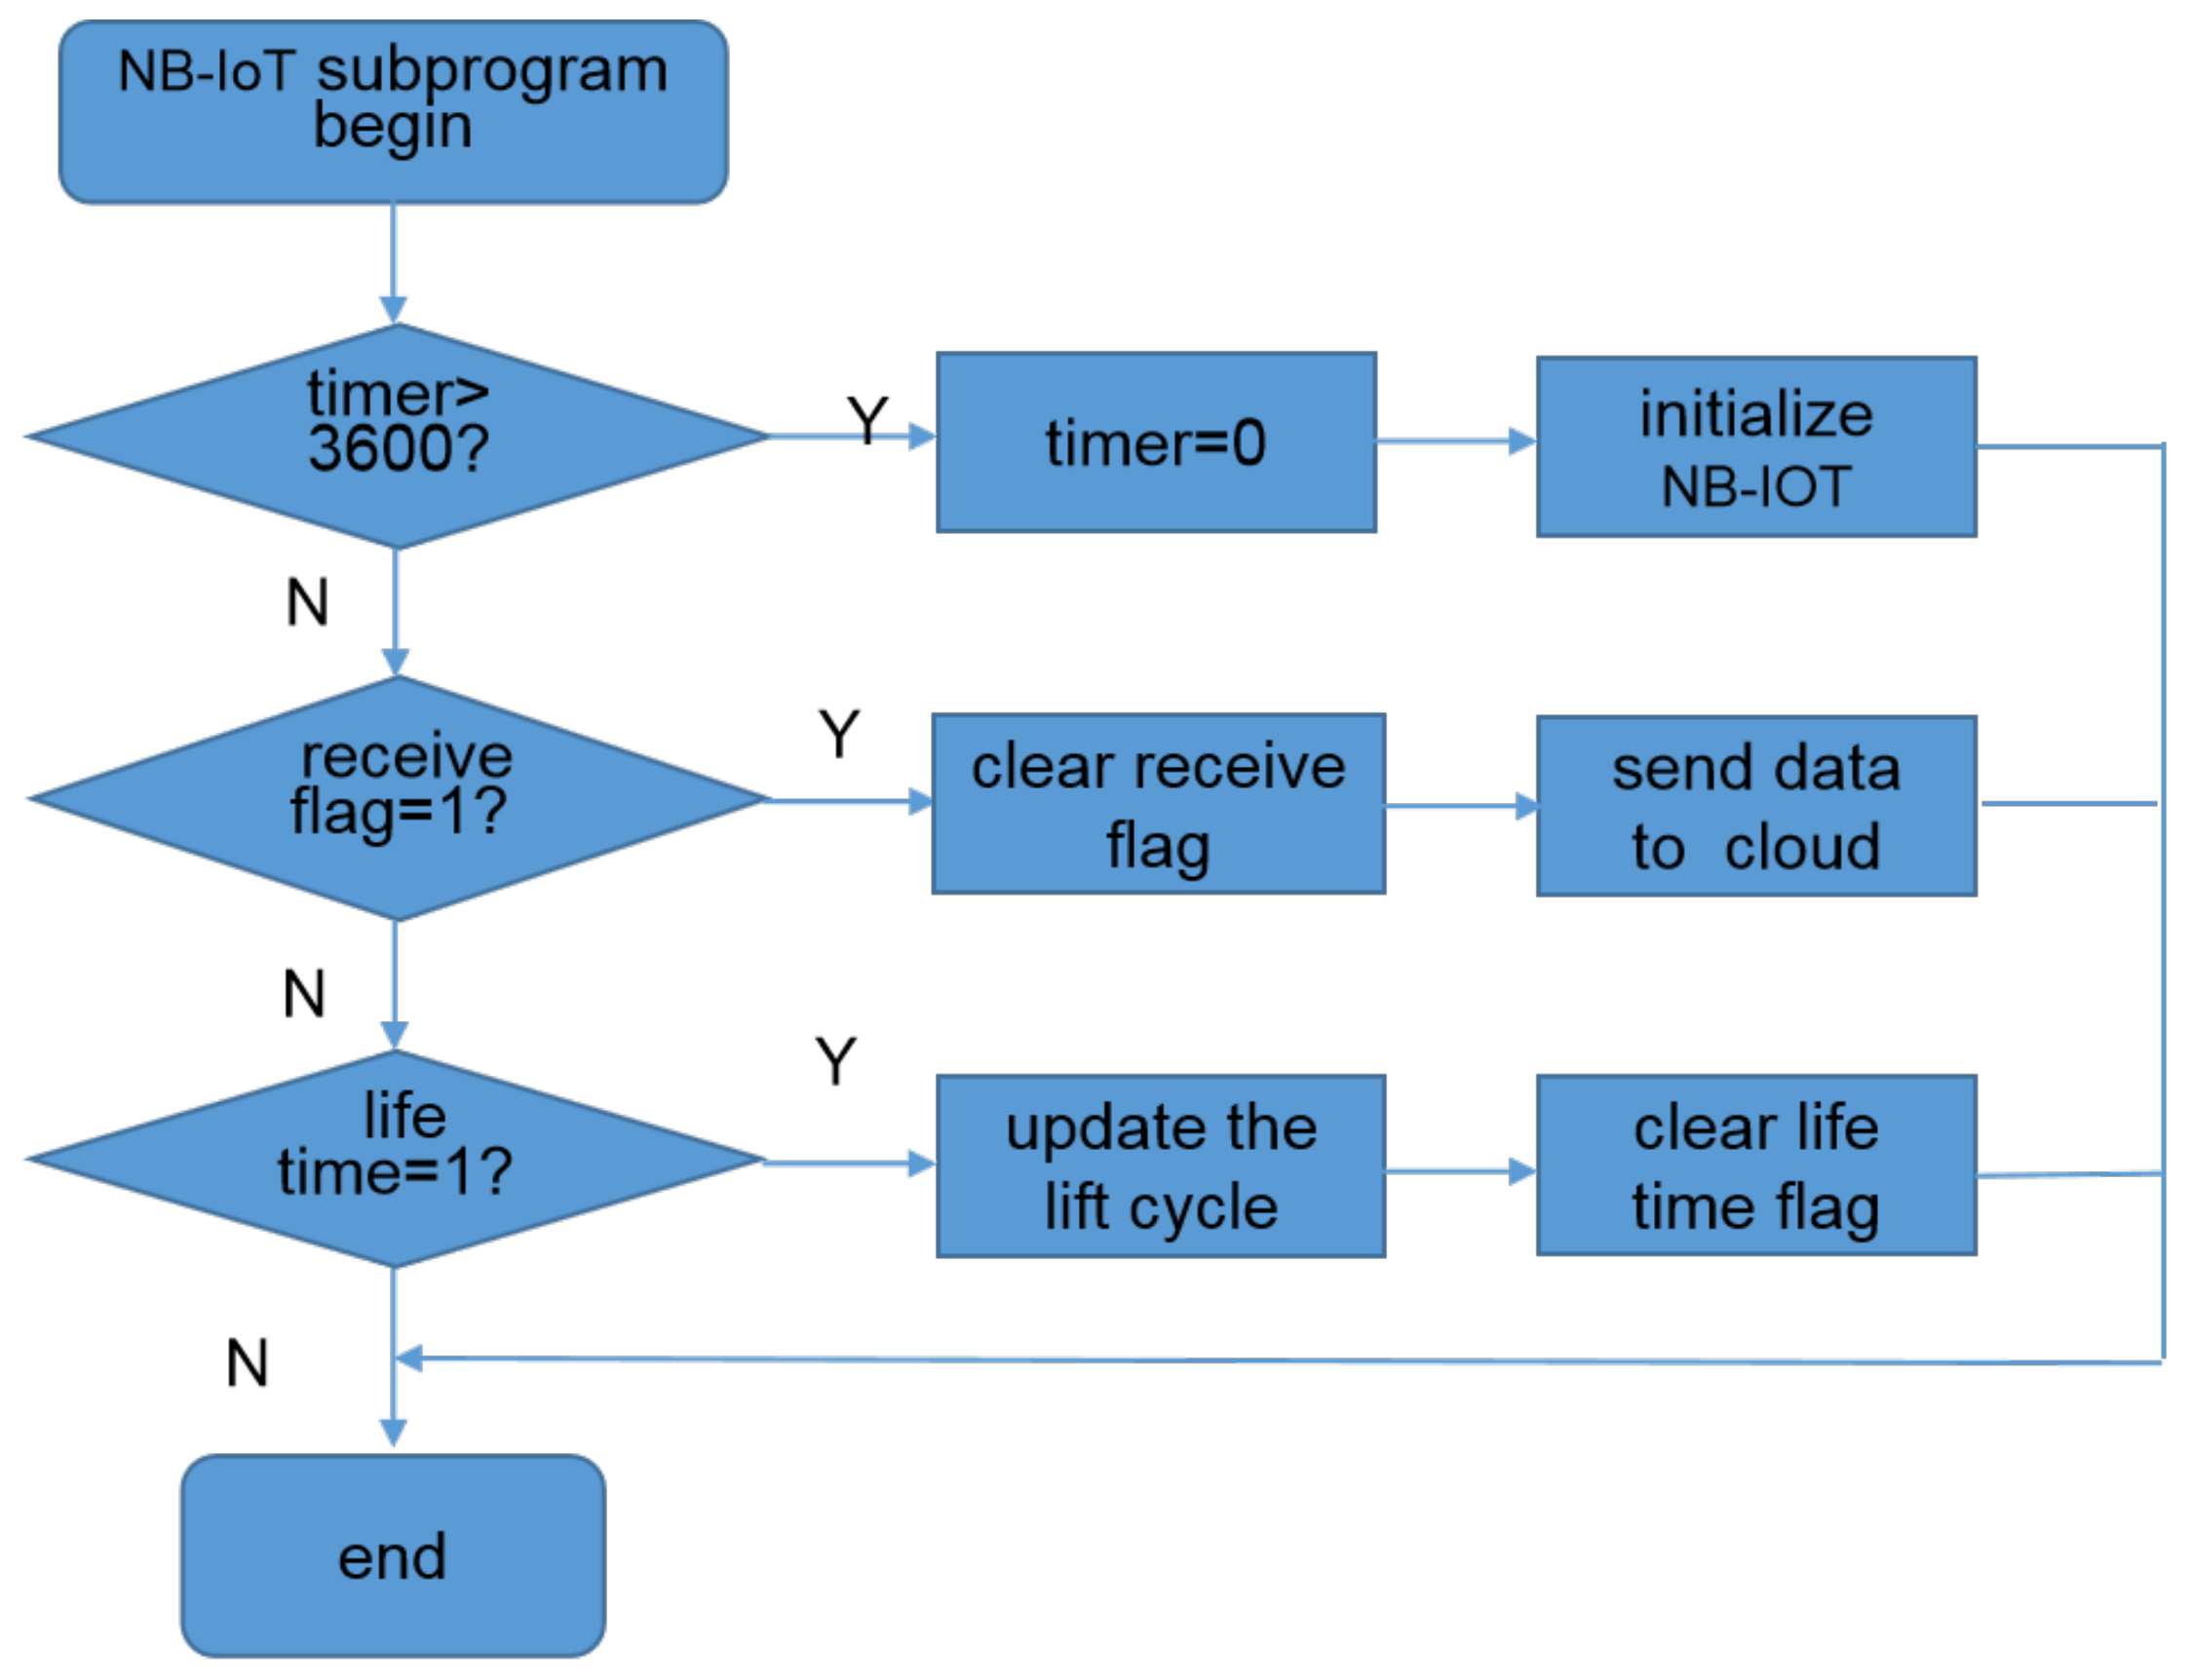
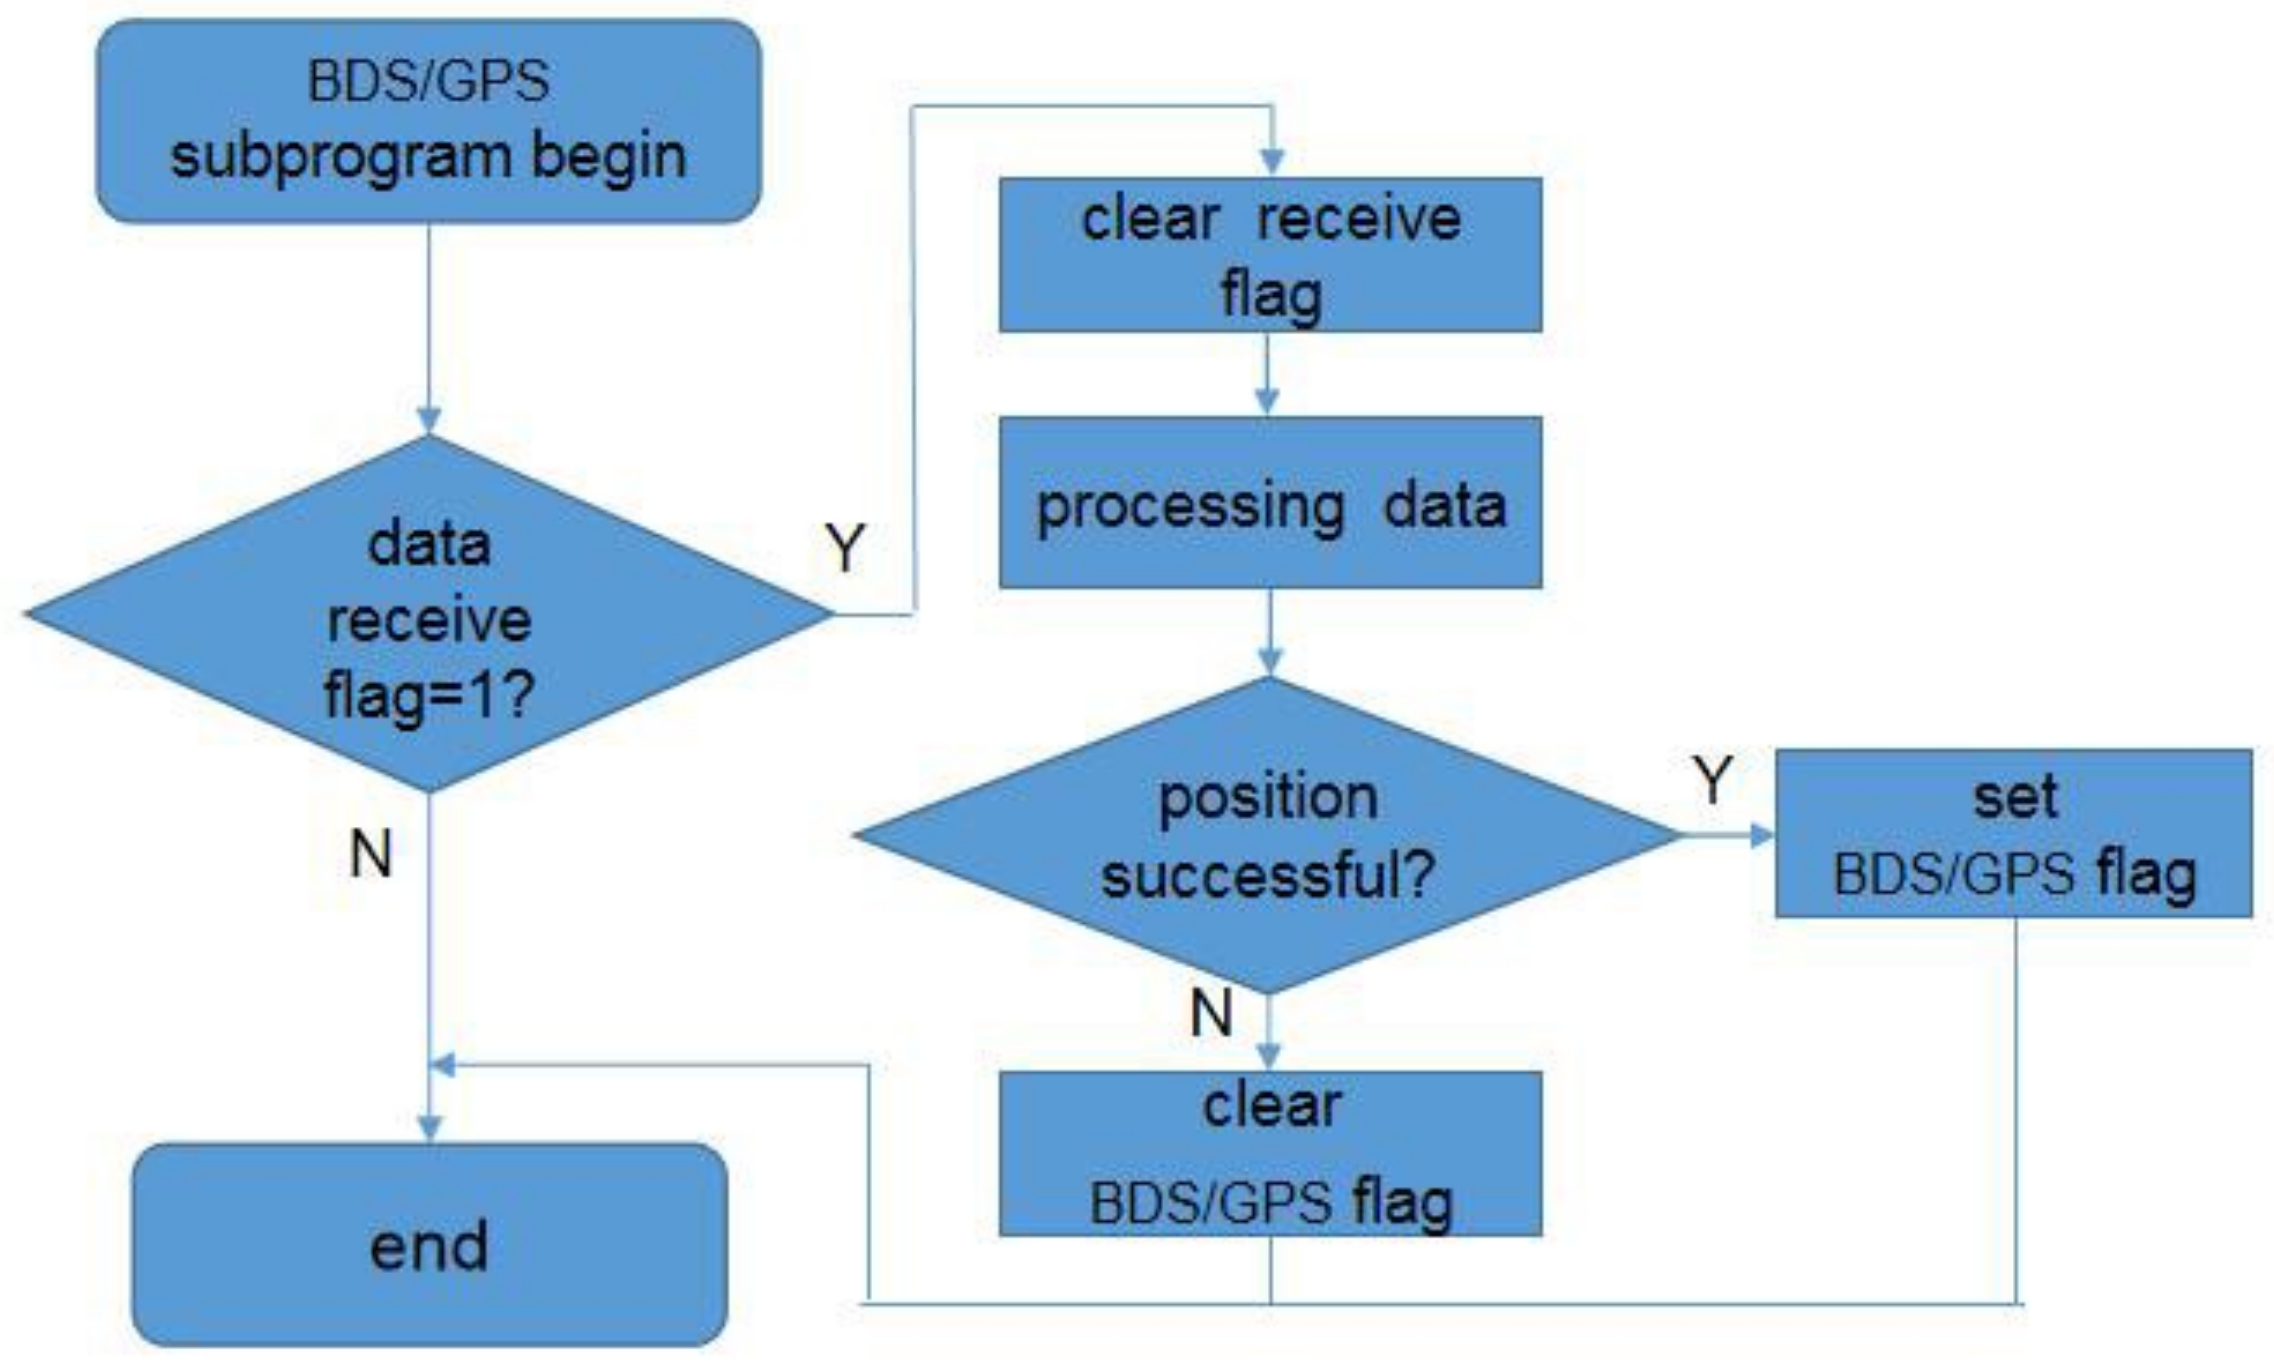
2.2.1. Software Design of Sink Nodes

The software design of sink node mainly focuses on four subprograms: NB-IoT subprogram, RFID subprogram, BDS/GPS subprogram and data compression subprogram. The main program flow chart of sink node is shown in Figure 4. After the initialization of each module, the main program will be looped in each module subprogram to deal with each module in real time. The watchdog is added to the main program to reset the program to prevent the program from getting stuck or running away.
OneNET platform is a NB-IoT cloud platform developed by China Mobile Communication Company. It can communicate with multiple sink nodes and can read data from multiple sink nodes at the same time by multithreading. We should login in the platform “https://open.iot.10086.cn (accessed on 20 January 2022)” to register the device name. Then add the objects for each device, as well as the number of points and properties of each object. In our experiment, there are three objects in each device, namely temperature, humidity and position information. Finally, the data type of each object should be described. For example, the data type of temperature is 31 bits floating point. According to the Internet Protocol for Smart Objects (IPSO) Alliance Technical Guideline, the longitude, the object ID of latitude, humidity and temperature is 3300, 3303 and 3304 separately. The instruction format is described detailly in the manual [53]. After the NB-IoT module is connected to the OneNET platform, the platform will record the life cycle of the sink device (the life cycle is configured 3600 s in the initialization). When the life cycle expires, the OneNET platform will issue a life cycle update request, and the sink node can update the life cycle. Or the sink node can actively update the life cycle before the life cycle expires. In this paper, the life cycle is automatically updated, and the life cycle update flag is activated by setting a certain time through the timer. During the life time, the NB-IoT and cloud platform can communicate. The NB-IoT subprogram is shown in Figure 5. At first, the timer will judge whether it exceeds 3600. If yes, the NB-IoT module will be initialized. If no, it continues to judge whether the receive flag bit is 1. If it is 1, it means that the reception is completed, and the data needs to be sent and the receive flag should be cleared and over. Otherwise, the life cycle flag will be judged, if it is 1, it means the time is over and the new request of update the life cycle should be sent. The two flags are active in timer interrupt and UART interrupt respectively.
One sink node should receive data from several sensor nodes. How to receive data from multiple sensor nodes efficiently and successfully? Here, a polling mechanism is proposed. As Figure 6 shown, the sink node sends ‘read request’ to sensor node1, sensor node2, and sensor node3 in turn. If sensor node1 send ‘answer request’ in time, then the data of sensor node1 will be allowed to send, the sink node will receive the data from sensor node1. Then next sensor node. The RFID module cc1101 in sink node accesses a sensor node every second in turn. The response timeout mechanism of the sub node is set up to avoid the data transmission errors due to the fact that the sub node is not in the transmission range and does not respond when the sink node sends a request.
RFID initialization mainly refers to the function configuration of cc1101 chip in RFID module. Specifically, through SPI communication mode, we can read and write the internal register of cc1101, so as to complete the setting of fundamental frequency, modulation and demodulation mode, baud rate, packet length and other related parameters. For one of the two general digital output pins with settable functions contained in cc1101, the level jump from low to high occurs when receiving data. The data can be received and read by configuring the rising edge of the I/O port of MCU to trigger interrupt. The flowchart of RFID subprogram is shown Figure 6.
BeiDou System is a positioning and navigation system independently developed by China. The positioning accuracy of BDS can reach 2.5 m in the Asia Pacific region and 10 m in the world. The test accuracy is 0.2 m/s; Timing accuracy is 10 ns. It also has its unique short message communication function. GPS is Global Positioning System. It is well known in the world and developed by the United States. We use BDS/GPS dual system for positioning to obtain higher positioning accuracy. The positioning principle is as follows:
      ρ B m = r B m + E B m + i δ t B + j δ t G τ B m + I B m + T B m + ε B m ρ G n = r G n + E G n + j δ t G + i δ t B τ G n + I G n + T G n + ε G n
where, ρ ,   r ,   E ,   δ t , τ ,   I ,   T respectively represent the pseudo range measurement value of the receiver to a star, the real distance, ephemeris error, receiver clock error, satellite clock error, ionospheric delay, tropospheric delay and pseudo range measurement noise. Superscript m, n denotes different satellites. Subscripts B and G indicate different satellite systems. B represents Beidou and G represents GPS. i = 1, j = 0. If (x, y, z) is used to represent the position coordinates of the unknown receiver, and (x(n), y(n), z(n)) is used to represent the position of satellite n, then r n is equal to the following expression.
r n = x x n 2 + y y n 2 + z z n 2
In Expressions (1) and (2), ρ ,   τ ,   I ,   T and the position of satellite can be calculated by original observation, navigation message and corresponding model. If the pseudo range measurement noise is ignored, five unknown parameters need to be solved, namely, the position of the receiver, the BDS clock difference of the receiver and the GPS clock difference ((x, y, z)> δ t B , δ t G ). Define error correction pseudo range measurements ρ c n is as Expression (3) shown.
ρ c m = ρ n + τ n I n T n
Then, the pseudo range observation equation of BDS/GPS dual system can be expressed as Expression (4):
      ρ c , B m = x x B m 2 + y y B m 2 + z z B m 2 + i δ t B + j δ t G       ρ c , G n = x x G n 2 + y y G n 2 + z z G n 2 + j δ t B + i δ t G
Linearize Expression (4) through the first-order Taylor expansion to obtain the linearized matrix equation as Expression (5) shown.
G Δ x Δ y Δ z Δ δ t B Δ δ t G
where,
Electronics 11 02493 i001
b = ρ C , B ( 1 ) r B , k 1 ( 1 ) i δ t B , k 1 j δ t G , k 1 ρ c , B ( 2 ) r B , k 1 ( 2 ) i δ t B , k 1 j δ t G , k 1 ρ c , B ( m ) r B , k 1 ( m ) i δ t B , k 1 j δ t G , k 1 ρ c , G ( m + 1 ) r G , k 1 ( m + 1 ) j δ t B , k 1 i δ t G , k 1 ρ c , G ( m + n ) r G , k 1 ( m + n ) j δ t B , k 1 i δ t G , k 1 0
I B , k 1 m , p B , k 1 m , q B , k 1 m is the directional cosine of the observation vector from the receiver to satellite m. Using the principle of weighted least squares to solve Expression (5), continue to use Newton iterative algorithm to solve the location result.
In order to reduce the utilization rate of CPU, the positioning data of BDS/GPS is transmitted to memory of MCU by UART port through DMA mode every second. The UART idle interrupt is triggered after all the positioning data are sent successfully, and the MCU responds to the interrupt to read the data in DMA for subsequent processing. The process of interrupt response program is similar to NB-IoT. It is not described in detail. The subprogram flowchart of BDS/GPS is given in Figure 7. After the BDS/GPS module parameters are set successfully, we can use the serial port assistant to read the module positioning information.
Data compression subprogram is used to compress data redundancy, reduce power consumption of sink node and improve data transmission efficiency. According to the characteristics of small amount of data transmission and good local time correlation of the system studied in this paper, the wireless remote data compression system designed includes sequence correlation packet processing and Adaptive Optimal Zero Suppression (AOZS) compression. Correlation grouping processing refers to the grouping rearrangement of the original sequence according to the transmission data format to obtain n groups of incremental subsequences with good time correlation. Then AOZS compression is performed on each subsequence to eliminate the time redundancy in the sequence.
Adaptive optimal zero suppression (AOZS) compression algorithm is improved from differential code compression algorithm, which is suitable for the compression of incrementally sorted data sequences. AOZS algorithm reduces the number of coded data and removes the time redundancy in the original sequence by eliminating zeros and encoding the zero eliminational factor, and selects the best coding bits by calculating the compressed data length to shorten the length of the final coding. Assume that the data sequence collected by the sink node in an upload cycle can be expressed as D.
D = d 1 d 2 d m = v 11 v 1 n v m 1 v m n
where, m is the acquisition times of sensor terminal in an upload cycle; di is the data sequence value collected for the i-th time; n is the number of measurement parameters; vjk is the value of the k-th measurement parameter in the j-th data acquisition. There are N data that appear only once, and the minimum data is recorded as α , the maximum difference between adjacent data is recorded as β . When in data compression, the relevant bit factor r 1 , r 2 , , r m of the original data sequence should be recorded at first:
r = 1 , d i = d i 1 , i = 2 , 3 , , m     0 , d i > d i 1 , i = 2 , 3 , , m
The relevant bit factor records the repetition of sequence adjacent data. By default, the relevant bit factor r 1 of d 1 = 0. The coding bit factor Cx is determined by the minimum binary coding bit factor C α and the maximum difference binary coding bit factor C β of the sequence as Expression (10).
C x = C β , C α C β C γ , C α > C β
Here, C γ C β , C α . Then, the maximum value that can be represented by a set of Cx bit codes d x = 2 C x 1 . 3-bit binary is used to record the encoded bit information in AOZS algorithm. 000, 001,…, 111 means using 2, 3,…, 9 bits binary to coding di respectively. The relationship of Cx and di is shown in Table 1. The relationship of coding length L x and coding bit factor Cx is shown as Expression (11).
L x = [ α d x ] + N 1 C x + M + 3
where, [ ] means to take up as an integer. M is the numbers of d 1 , d 2 , , d m , notes the minimum of L x as L m i n , and its corresponding code bit factor Cx is the best code numbers, noted as Coptimal. Zero elimination operation refers to subtracting an integer value (recorded as zero elimination factor) from all data of the sequence, and finally making all data of the original sequence become 0. The zeroing factor s i of the i-th order is recorded as Expression (12).
s i = m i n d m i n , d o p t i m a l
where, d m i n is the minimum value of sequence.
After the above parameters are determined, the algorithm records the sequence coding information and related information, and uses Coptimal bit number binary to encode the all zero elimination factors. The flow chart is shown in Figure 8. Table 2 shows the implementation process of the AOZS algorithm.
So, the compression code is 100,001001,1111,0100,0110,0010.
Compression Ratio (CR) is used to describe the efficiency of compression.
C R = S C P S O R
Here, S C P is the amount of compressed data, S O R is the amount of original data. Obviously, the smaller the CR, the smaller the proportion of the compressed data to the original data, and the better the compression performance.

2.2.2. Software Design of Sensor Nodes and Monitoring Center

Software of each sensor node is simpler than that of sink node. It includes two parts. One is to read the humidity data and temperature data of the DHT11. The other is to drive the Bluetooth module to send these data to the sink node. The flowchart is given in Figure 9. It needs to complete the initialization of MCU peripherals and related modules. Clock initialization is used to set the working frequency of the system. Timer initialization is used to read temperature and humidity sensor data. Because the single line communication mode of DHT11 does not have a standard communication format, it is necessary to use a timer to simulate the communication sequence to realize the reception and transmission of data. Finally, the cc1101 module should be initialized.
The monitoring center is developed with C++ language, which mainly realizes the following functions: (i) according to the longitude and latitude coordinates obtained from the cloud platform, it can display the location of the mobile carriage (sink node) in real time; (ii) it can display the real-time temperature and humidity in the carriage; (iii) it can dynamically draw the temperature and humidity change line chart; (iv) Using database to manage the collected data, it can save the historical data for data analysis. Figure 10 is the operation flowchart of monitoring center.

3. Results

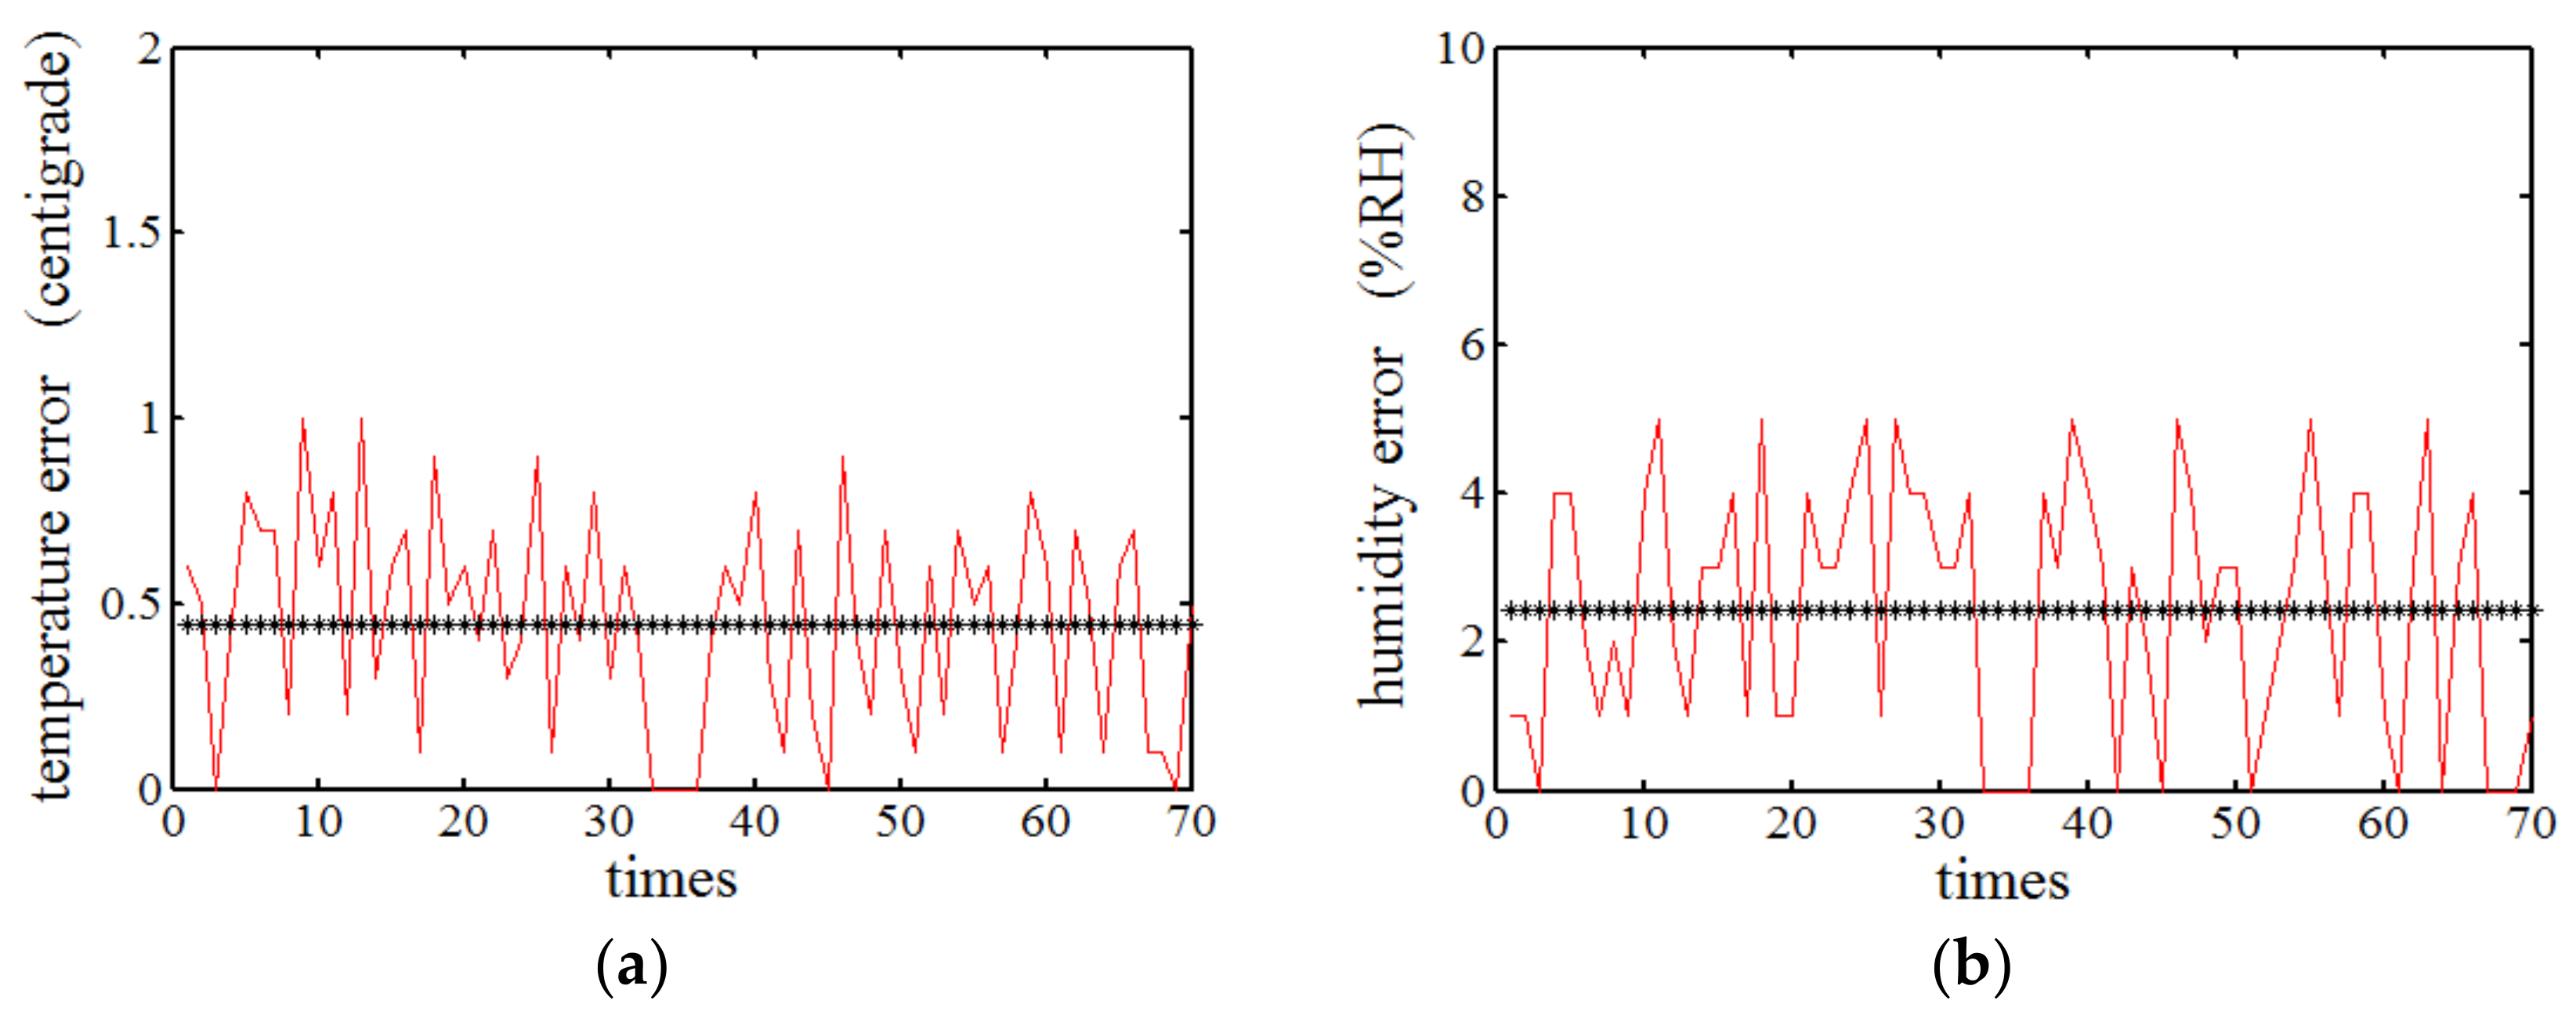
3.1. Measurement Accuracy

First, we do the measurement accuracy experiment. The experience was carried on the author’s campus from 22 September to 21 October 2021. The campus is located at 120°55′ E and 28°51′ N. The weather was sunny during the test. The campus is spacious. The parameters of cc1101 are a carrier frequency of 433 MHz, a baud rate of 100 kbps, and a modulation mode of 2 FSK. The transmission power of the NB-IoT circuit is 13 dBm, the antenna gain is 3 dB, and the transmission rate is 3.9 Kbps. Each test point continuously sends and receives 1000 data packets. The packet loss rate of the whole network is less than 1% within 8 km, and the packet loss rate is 0% within 400 m. We read the humidity data and temperature data 10 times of 6 sensor nodes every day for a week and compare the data of thermometers and hygrometers which are put near the sensor node simultaneously. Then, the error was calculated and drawn in Figure 11a,b. The temperature error is less than 1 °C, as shown by the red line on Figure 11a. The average of temperature error is about 0.5 °C, as shown by the black line on the Figure 11a. The humidity error is less than 5% RH, as shown by the red line on Figure 11b. The average of humidity error is about 2% RH, as shown by the black line on the Figure 11b. The error of temperature and humidity are mainly decided by the DHT11 chip precision.
Then, one sink node and its three sensor nodes were placed in a mobile car. We put a Leica GNSS (teaching edition) in the car, which is a professional position for the measuring instrument. The car was moved in different speed, and we read the latitude and longitude information of the monitoring center and Leica Receiver simultaneously. Let the longitude and latitude test by Leica GNSS are LonA, LatA. Let the longitude and latitude test by our system are LonB, LatB. Then the position error can be calculated by the Expression (14).
Δ L o n = L o n A L o n B × 1000 × 111.413 × c o s L a t B × π 180 0.094 × c o s 3 × L a t B × π 180 Δ L a t = L a t A L a t B × 1000 × 111.133 0.59 × c o s 2 × L a t B × π 180 D i s t a n c e = Δ L o n 2 + Δ L a t 2
The relationship between positioning error and vehicle speed is shown in Figure 12.
The positioning error is decided by several factors, such as the number of satellites used for positioning, vehicle speed, NB-IoT life cycle, etc. The average number of observable satellites under the GPS/BDS dual mode is 9, and the positioning performance is better than that of GPS single system and BDS single system. The main reason is that the number of available satellites increases, and the geometry configuration is enhanced. Under BDS/GPS dual positioning system, more positioning satellites can be obtained, so the accuracy is higher than that of GPS or BeiDou single positioning system. When the vehicle is static, the positioning error is about 2 m. When the car moves, the positioning error increases. The faster the car speed, the greater the positioning error. When the life period of NB-IoT is set as 3600 s, and the speed is less than 40 km/h, the positioning error is less than 10 m. When the speed is about 60 km/h, the positioning error is about 20 m. The larger the life cycle of NB-IoT, the greater the positioning error, because the larger the life cycle of NB-IoT, the greater the transmission latency.

3.2. Network Performance Test

Network performance test includes data compression rate and transmission packet loss rate. Limited by the experimental conditions, it is impossible to obtain a large number of test data of sensor nodes. Therefore, the experimental data on data compression rate is taken from the temperature data of Intel-Berkeley University Joint Research Laboratory in reference [40]. Compare the compression ratio between the AOZS algorithm proposed in this paper and the commonly used DCCM (Differential Code Compression Method) algorithm, as shown in Figure 13. Under the condition of the same amount of node data collection, the compression ratio of AOZS algorithm is lower than DCCM algorithm, and the compression performance is better, because AOZS algorithm makes full use of the correlation between data, and the coding based on the optimal bit factor removes the redundant information to the greatest extent. The more data the node collects, the higher the time correlation of the data. The coding factor of AOZS algorithm can describe more original data and fully mine the time correlation of data. Therefore, the compression ratio becomes smaller and smaller and tends to be stable gradually. With the increase of the number of sensor data, the compression rate of DCCM algorithm is maintained at about 50%, and that of AOZS algorithm is maintained at about 10%.
Another indicator of network communication reliability is packet loss rate. Sx1268 is a new generation 433 MHz LoRa half duplex transceiver chip produced by Semtech in 2018. It is also one of the commonly used Lora chips at present. So we compare the communication reliability between Sx1268 LoRa module and our wh-nb75-ba NB-IoT module. Figure 14 is the comparison of packet loss rate of our NB-IoT module and LoRa Sx1268 module under the same transmitting and receiving condition. When the distance is less than 250 m, the packet loss rate of both circuits is nearly 0. With the increase of distance, the packet loss rate of LoRa module increases significantly, while that of NB-IoT module increases little. When the distance is 400 m, the packet loss rate of LoRa module is about 1.5%, that of NB-IoT module is still nearly 0. when the distance is 600 m, the packet loss rate of LoRa module is about 2%, that of NB-IoT module is about 0.5%. when the distance is 800 m, the packet loss rate of LoRa module is about 5%, that of NB-IoT module is about 0.7%. when the distance is 800 m, the packet loss rate of LoRa module is about 5%, that of NB-IoT module is about 0.7%. When the distance is 1000 m, the packet loss rate of LoRa module is about 10%, that of NB-IoT module is about 1%. When the distance is 1200 m, the packet loss rate of LoRa module is about 15%, that of NB-IoT module is about 1.2%.

4. Discussion

Through these tests aboved, the monitoring system realizes the higher position precision. It is shown that the BDS/GPS dual mode position have higher position precision than that of single BDS or GPS. When the monitored target is stationary, the positioning accuracy is only determined by the positioning module. The position calculation formula under the dual-mode positioning module is deduced as above. When the monitored target moves, the positioning accuracy is jointly determined by the positioning module, vehicle speed and life cycle. However, under the same vehicle speed and the same life cycle of NB-IoT, the monitoring system accuracy of dual-mode positioning is still higher than that of single BDS or GPS positioning mode. Considering the characteristics of sensor data in monitoring system, an adaptive optimal zero suppression (AOZS) algorithm based on time correlation is proposed in this paper. After testing and comparing with the commonly used differential code compression method (DCCM) algorithm, the data compression rate of the new algorithm can be as high as 90%, which greatly reduces the amount of data transmission in the communication network and improves the network performance and transmission efficiency. With the increase of the number of sensor data, the compression rate of DCCM algorithm is maintained at about 50%, and that of AOZS algorithm is maintained at about 10%. Packet loss rate is the main indicator of communication network performance. We tested and compared the packet loss rate of the monitoring system based on wh-nb75-ba NB-IoT module and the monitoring system based on sx1268 LoRa module which is mainly used. When the distance is less than 250 m, the packet loss rate of both circuits is nearly 0. With the increase of distance, the packet loss rate of LoRa module increases significantly, while that of NB-IoT module increases little. The greater the distance, the greater the difference between the packet loss rate data of the two circuits.

5. Conclusions

A new monitoring system is proposed in the paper, based on NB-IoT and BDS/GPS dual-mode positioning. The whole monitoring system includes three parts: sensor node, sink node and monitoring center. The sensor node which is based on cc1101 RFID circuit realizes the detection of surrounding temperature and humidity and data transmission. The sink node receives and compresses the temperature and humidity data from the sensor node, obtains the positioning information through at6558 BDS/GPS positioning module, and uploads these data to the cloud through wh-nb75-ba NB-IoT module. The monitoring center can download data from the cloud and save it to the local machine, and can analyze the historical data through an operation interface.
Experiments and analysis show that the proposed scheme has better positioning accuracy, better data compression ratio and transmission performance. The temperature and humidity error are less than 1 °C and 5% RH especially with the selected chip. The position error is decided by several factors, including the number of satellites used for positioning, the monitored target moving speed and NB-IoT module lifetime period. When the monitored target is stationary, the positioning error is about 2 m, which is less than that of the single GPS or BDS mode. The AOZS compression algorithm is used to improve compression ratio (CR). The CR is about 10% when the data amount increasing.
The scheme of this paper had encouraged experiments and was efficient and practicable in monitoring system. However, many aspects, still need to be further studied, such as transmission delay, multi-sensor nodes and low-power circuits. Furthermore, optimizing the network structure to reduce its consumption and accomplishing end-to-end network will be the main direction of our work.

Author Contributions

Conceptualization, Z.X. and R.Z.; methodology, Z.X.; software, Z.X. and R.Z.; validation, J.F. and L.Z.; formal analysis, J.F.; investigation, L.Z.; writing—original draft preparation, Z.X.; writing—review and editing, R.Z.; visualization, J.F.; funding acquisition, Z.X. All authors have read and agreed to the published version of the manuscript.

Funding

This research was supported by the Commonweal Projects of Zhejiang Province (Grant No. LGN20F010001) and General Project of Zhejiang Education Department (Grant No. Y201940951).

Conflicts of Interest

The authors declare no conflict of interest.

References

  1. Reynders, B.; Meert, W.; Pollin, S. Range and coexistence analysis of long range unlicensed communication. In Proceedings of the 2016 23rd International conference on Telecommunications, Thessaloniki, Greece, 16–18 May 2016. [Google Scholar]
  2. Centenaro, M.; Vangelista, L.; Zanella, A.; Zorzi, M. Long-range communications in unlicensed bands: The rising stars in the IoT and smart city scenarios. IEEE Wirel. Commun. 2016, 23, 60–67. [Google Scholar] [CrossRef] [Green Version]
  3. Patel, D.; Won, M. Experimemtnal study on low power wide area networks(LPWAN) for mobile Internet of Things. In Proceedings of the 2017 IEEE 86th Vehicular Technology Conference, Toronto, ON, Canada, 24–27 September 2017. [Google Scholar]
  4. Raza, U.; Kulkarni, P.; Sooriyabandara, M. Low power wide area networks: An overview. IEEE Commun. Surv. Tutor. 2017, 19, 855–873. [Google Scholar] [CrossRef] [Green Version]
  5. Li, Y.; Cheng, X.; Xao, Y. Smart choice for the smart grid: Narrowband Internet of Things (NB-IoT). IEEE Internet Things J. 2018, 5, 1505–1515. [Google Scholar] [CrossRef]
  6. Duangsuwan, S.; Takarn, A.; Nujankaew, R. A study of air pollution smart sensors LPWAN via NB-IoT for Thailand smart cities 4.2. In Proceedings of the 10th International Conference on Knowledge and Smart Technology, Chiang Mai, Thailand, 31 January–3 February 2018. [Google Scholar]
  7. Lauridsen, M.; Krigslund, R.; Rohr, M. An empirical NB-IoT power consumption model for battery lifetime estimation. In Proceedings of the 2017 IEEE 86th Vehicular Technology Conference, Toronto, ON, Canada, 24–27 September 2017. [Google Scholar]
  8. Sotirios, K.G.; Margot, D.; David, P.; Luc, M.; Kostas, E.P. A Novel Design Approach for 5G Massive MIMO and NB-IoT Green Networks Using a Hybrid Jaya-Differential Evolution Algorithm. IEEE Access 2019, 7, 105687–105700. [Google Scholar]
  9. Li, H.; Dong, W.; Wang, Y.; Gao, Y.; Chen, C. Enhancing the Performance of 802.15.4-Based Wireless Sensor Networks with NB-IoT. IEEE Internet Things J. 2020, 7, 3523–3534. [Google Scholar] [CrossRef]
  10. Pilar, A.M.; Pablo, A.; Jonathan, P.G. An Analytical Performance Evaluation Framework for NB-IoT. IEEE Internet Things J. 2019, 6, 7232–7240. [Google Scholar]
  11. Ahmad, A. Toward Achieving a Balance between the User Satisfaction and the Power Conservation in the Internet of Things. IEEE Internet J. 2022, 8, 10998–11015. [Google Scholar]
  12. Gayathri, N.; Rakesh, K.S.; Rizwan, P. Ensemble Classification and IoT-Based Pattern Recognition for Crop Disease Monitoring System. IEEE Internet J. 2021, 8, 12847–12854. [Google Scholar]
  13. Joseph, H.A.; Tang, Y.; Celestine, I.; Desire, N. A Secure Multiuser Privacy Technique for Wireless IoT Networks Using Stochastic Privacy Optimization. IEEE Internet J. 2022, 9, 2566–2577. [Google Scholar]
  14. Ayoub, W.; Samhat, A.E.; Nouvel, F.; Mroue, M.; Prévotet, J.C. Internet of Mobile Things: Overview of LoRaWAN, DASH7, and NB-IoT in LPWANs standards and Supported Mobility. IEEE Commun. Surv. Tutor. 2019, 21, 1561–1581. [Google Scholar] [CrossRef] [Green Version]
  15. Chakrapani, A. NB-IoT Uplink Receiver Design and Performance Study. IEEE Internet Things J. 2020, 7, 2469–2482. [Google Scholar] [CrossRef] [Green Version]
  16. Nancy, A.A.; Ravindran, D.; Raj Vincent, P.D.; Srinivasan, K.; Gutierrez Reina, D. IoT-Cloud-Based Smart Healthcare Monitoring System for Heart Disease Prediction via Deep Learning. Electronics 2022, 11, 2292. [Google Scholar] [CrossRef]
  17. Bencak, P.; Hercog, D.; Lerher, T. Indoor Positioning System Based on Bluetooth Low Energy Technology and a Nature-Inspired Optimization Algorithm. Electronics 2022, 11, 308. [Google Scholar] [CrossRef]
  18. Shi, J.; Jin, L.P.; Li, J.; Fang, Z.X. A smart parking system based on NB-IoT and third-party payment platform. In Proceedings of the International Symposium on Communications and Information Technologies, Cairns, Australia, 25–27 September 2017. [Google Scholar]
  19. Mandza, Y.S.; Raji, A. IoTivity Cloud-Enabled Platform for Energy Management Applications. IoT 2022, 3, 73–90. [Google Scholar] [CrossRef]
  20. Zhang, H.; Li, J.; Wen, B.; Xun, Y.; Liu, J. Connecting Intelligent Things in Smart Hospitals Using NB-IoT. IEEE Internet Things J. 2018, 5, 1550–1560. [Google Scholar] [CrossRef]
  21. Srikanth, K.; Dmitri, M.; Aleksandr, O.; Sergey, A. Performance Analysis of Onshore NB-IoT for Container Tracking during Near-the-Shore Vessel Navigation. IEEE Internet Things J. 2020, 7, 2928–2943. [Google Scholar]
  22. Zhang, X.; Zhang, M.; Meng, F.; Qiao, Y.; Xu, S.; Hour, S. A Low-Power Wide-Area Network Information Monitoring System by Combining NB-IoT and LoRa. IEEE Internet Things J. 2019, 6, 590–598. [Google Scholar] [CrossRef]
  23. Cao, T.P.; Duy, D.P.; Hoang, V.T.; Trung, V.T.; Phat, N.H. Applying the IoT platform and green wave theory to control intelligent traffic lights system for urban areas in Vietnam. KSII Trans. Internet Inf. Syst. 2019, 13, 34–51. [Google Scholar]
  24. Sinha, R.S.; Wei, Y.; Hwang, S.H. A survey on LPWAN technology: LoRa and NB-IoT. ICT Express 2017, 3, 14–21. [Google Scholar] [CrossRef]
  25. Wu, Z.; Liu, R.; Cao, H. ECDSA-Based Message Authentication Scheme for BeiDou-II Navigation Satellite System. IEEE Trans. Aerosp. Electron. Syst. 2019, 55, 1666–1682. [Google Scholar] [CrossRef]
  26. Wei, H.; Pascale, D. BeiDou Time Transfer with the Standard CGGTTS. IEEE Trans. Ultrason. Ferroelectr. Freq. Control 2016, 63, 1005–1012. [Google Scholar]
  27. Su, M.; Yang, Y.; Jiang, J. BeiDou system satellite-induced pseudorange multipath bias mitigation based on different orbital characteristic for static applications. IET Radar Sonar Navig. 2020, 14, 242–251. [Google Scholar] [CrossRef]
  28. Qin, H.; Liu, P.; Cong, L.; Ji, W. Triple-Frequency Combining Observation Models and Performance in Precise Point Positioning Using Real BDS Data. IEEE Access 2019, 7, 69826–69836. [Google Scholar] [CrossRef]
  29. Zhang, Y.; Tian, L.; Meng, W.; Gu, Q.; Han, Y.; Hong, Z. Feasibility of Code-Level Altimetry Using Coastal BeiDou Reflection (BeiDou-R) Setups. IEEE J. Sel. Top. Appl. Earth Obs. Remote Sens. 2015, 8, 4130–4140. [Google Scholar] [CrossRef]
  30. Wu, Y.H.; Zheng, M.H.; He, W.; Chen, Z.M.; Hua, B. Intelligent vehicle safety system based on BeiDou satellite navigation system. IET Intell. Transp. Syst. 2019, 13, 967–974. [Google Scholar] [CrossRef]
  31. Fan, L.; Tu, R.; Zhang, R.; Zheng, Z.; Liu, J.; Hong, J.; Lu, X. Real-time BDS signal-in-space anomaly detection method considering receiver anomalies. IET Radar Sonar Navig. 2019, 13, 2220–2229. [Google Scholar] [CrossRef]
  32. Wang, E.; Yang, D.; Wang, C.; Huang, Y.; Qu, P.; Pang, T. Optimized Fault Detection Algorithm Aided by BDS Baseband Signal for Train Positioning. Chin. J. Electron. 2020, 29, 34–40. [Google Scholar] [CrossRef]
  33. Wang, L.; Li, Z.; Yuan, H.; Zhao, J.; Zhou, K.; Yuan, C. Influence of the time-delay of correction for BDS and GPS combined real-time differential positioning. Electron. Lett. 2016, 52, 1063–1065. [Google Scholar] [CrossRef]
  34. Jiang, W.; Chen, S.; Cai, B.; Wang, J.; ShangGuan, W.; Rizos, C. A Multi-Sensor Positioning Method-Based Train Localization System for Low Density Line. IEEE Trans. Veh. Technol. 2018, 67, 10425–10437. [Google Scholar] [CrossRef]
  35. Zhu, Y.; Liu, Y.; Wang, Z.; Li, Q. Evaluation of GBAS flight trials based on BDS and GPS. IET Radar Sonar Navig. 2020, 14, 233–241. [Google Scholar] [CrossRef]
  36. Ketshabetswe, L.K.; Zungeru, A.M.; Mangwala, M.; Chuma, J.M.; Sigweni, B. Communication protocols for wireless sensor networks: A survey and comparison. Heliyon 2019, 5, e01591. [Google Scholar] [CrossRef] [Green Version]
  37. Capo-Chichi, E.P.; Guyennet, H.; Friedt, J.M. K-RLE: A new data compression algorithm for wireless sensor network. In Proceedings of the IEEE 2009 Third International Conference on Sensor Technologies and Applications (SENSORCOMM), Athens, Glyfada, 18–23 July 2009. [Google Scholar]
  38. Zhang, H.; Fan, X.P.; Liu, S.Q. Design and realization of improved LZW algorithm for wireless sensor networks. In Proceedings of the International Conference on Information Science and Technology(ICIST), Changsha, China, 26–28 May 2011. [Google Scholar]
  39. Das, P. Implementing Dial-On-Demand Technique for Inter and Intra Cluster Communication in Energy Conserving Postbox Delay Tolerant Networks. In Proceedings of the International Conference on Computational Intelligence, Communications, and Business Analytics, Kalyani, India, 27–28 July 2018. [Google Scholar]
  40. Ahmad, M.S.; Lata, S.; Mehfuz, S.; Ahmad, A. Lossless Compression Algorithm for Energy Efficient Wireless Sensor Network. In Proceedings of the 2019 International Conference on Power Electronics, Control and Automation (ICPECA), New Delhi, India, 16–17 November 2019. [Google Scholar]
  41. Mo, Y.B.; Qiu, Y.B.; Liu, J.Z. A data compression algorithm based on adaptive huffman code for wireless sensor networks. In Proceedings of the 2011 International Conference on Intelligent Computation Technology and Automation (ICICTA), Nanjing, China, 3–6 September 2011. [Google Scholar]
  42. Xie, L.; Chen, L.J.; Chen, D.X. Clustering-based approximate scheme for data aggregation over sensor networks. J. Softw. 2009, 20, 1023–1037. [Google Scholar]
  43. Hu, J.; Shen, L.F. Novel clustering algorithm for wireless sensor networks. J. Commun. 2008, 29, 20–29. [Google Scholar]
  44. Zhu, X.R.; Shen, L.F.; Tak-Shing, P.Y. Hausdorff clustering and minimum energy routing for wireless sensor networks. IEEE Trans. Veh. Technol. 2009, 58, 990–997. [Google Scholar] [CrossRef] [Green Version]
  45. Ciancio, A.; Pattem, S.; Ortega, A. Energy-efficient data representation and routing for wireless sensor networks based on a distributed wavelet compression algorithm. In Proceedings of the Fifth International Conference on Information Processing in Sensor Networks, Palo Alto, CA, USA, 7–10 July 2006. [Google Scholar]
  46. Donoho, D.L. Message passing algorithms for compressed sensing: I. motivation and construction. In Proceedings of the IEEE Information Theory Workshop 2010, Cairo, Egypt, 2–6 January 2010. [Google Scholar]
  47. Marcelloni, F.; Vecchio, M. A simple algorithm for data compression in wireless sensor networks. IEEE Commun. Lett. 2008, 12, 411–413. [Google Scholar] [CrossRef]
  48. Fan, X.H.; Li, S.N.; Du, P.L. Simple algorithm for self-adapting lossless data compression in WSN. Comput. Meas. Control 2010, 18, 463–465. [Google Scholar]
  49. Xia, Y.C.; Chen, L.L.; Chen, X. Research on data compression in wireless sensor networks-with wavelet lifting algorithm and difference mechanism. Comput. Eng. Appl. 2010, 46, 109–112. [Google Scholar]
  50. WH-NB75-BA Datasheet. Available online: http://www.mokuai.cn/products/67.html (accessed on 4 June 2022).
  51. AT6558 Manual. Available online: http://www.icofchina.com/pro/dingwei/2016-07-29/5.html (accessed on 4 June 2022).
  52. CC1101 Data Sheet. Available online: https://wenku.baidu.com/view/c2b0081b227916888486d769.html (accessed on 4 June 2022).
  53. NMEA0183 Protocol. Available online: https://blog.csdn.net/st526403649/article/details/54946529 (accessed on 4 June 2022).
Figure 1. Hardware frame of the monitoring system.
Electronics 11 02493 g001
Figure 2. The Sink node physical diagram.
Electronics 11 02493 g002
Figure 3. Sensor node physical diagram.
Electronics 11 02493 g003
Figure 4. Main program flow chart of sink node.
Electronics 11 02493 g004
Figure 5. The Flowchart of NB-IoT subprogram.
Electronics 11 02493 g005
Figure 6. The flowchart of RFID subprogram of sink node.
Electronics 11 02493 g006
Figure 7. The flowchart of BDS/GPS subprogram.
Electronics 11 02493 g007
Figure 8. The flowchart of data compress algorithm.
Electronics 11 02493 g008
Figure 9. The flowchart of sensor nodes.
Electronics 11 02493 g009
Figure 10. The operation flowchart of monitoring center.
Electronics 11 02493 g010
Figure 11. The measurement error. (a) temperature error (b) humidity error.
Electronics 11 02493 g011
Figure 12. The relationship between positioning error and vehicle speed.
Electronics 11 02493 g012
Figure 13. The Comparison of data compression ratio.
Electronics 11 02493 g013
Figure 14. The packet loss rate of our NB-IoT module and LoRa sx1268.
Electronics 11 02493 g014
Table 1. The relationship of bit numbers, code, Cx and di.
Bit NumbersCodeCx (x = 2, 3,…, 9) d x (i = 2, 3,…, 9)
2000C2 = 2 d 2 = 3
3001C3 = 3 d 3 = 7
4010C4 = 4 d 4 = 15
5011C5 = 5 d 5 = 31
6100C6 = 6 d 6 = 63
7101C7 = 7 d 7 = 127
8110C8 = 8 d 8 = 255
9111C9 = 9 d 9 = 511
Table 2. An example of AOZS algorithm.
Orignal Datad = 15d = 4d = 6d = 2r
1500000
1940000
1940001
2386000
25108200
25108201
Publisher’s Note: MDPI stays neutral with regard to jurisdictional claims in published maps and institutional affiliations.

