
Luminescent Downshifting Silicon Quantum Dots for Performance Enhancement of Polycrystalline Silicon Solar Cells


Abstract
:1. Introduction
2. Experimental Procedure
2.1. Preparation of PA Si-QDs
2.2. Sample Preparation
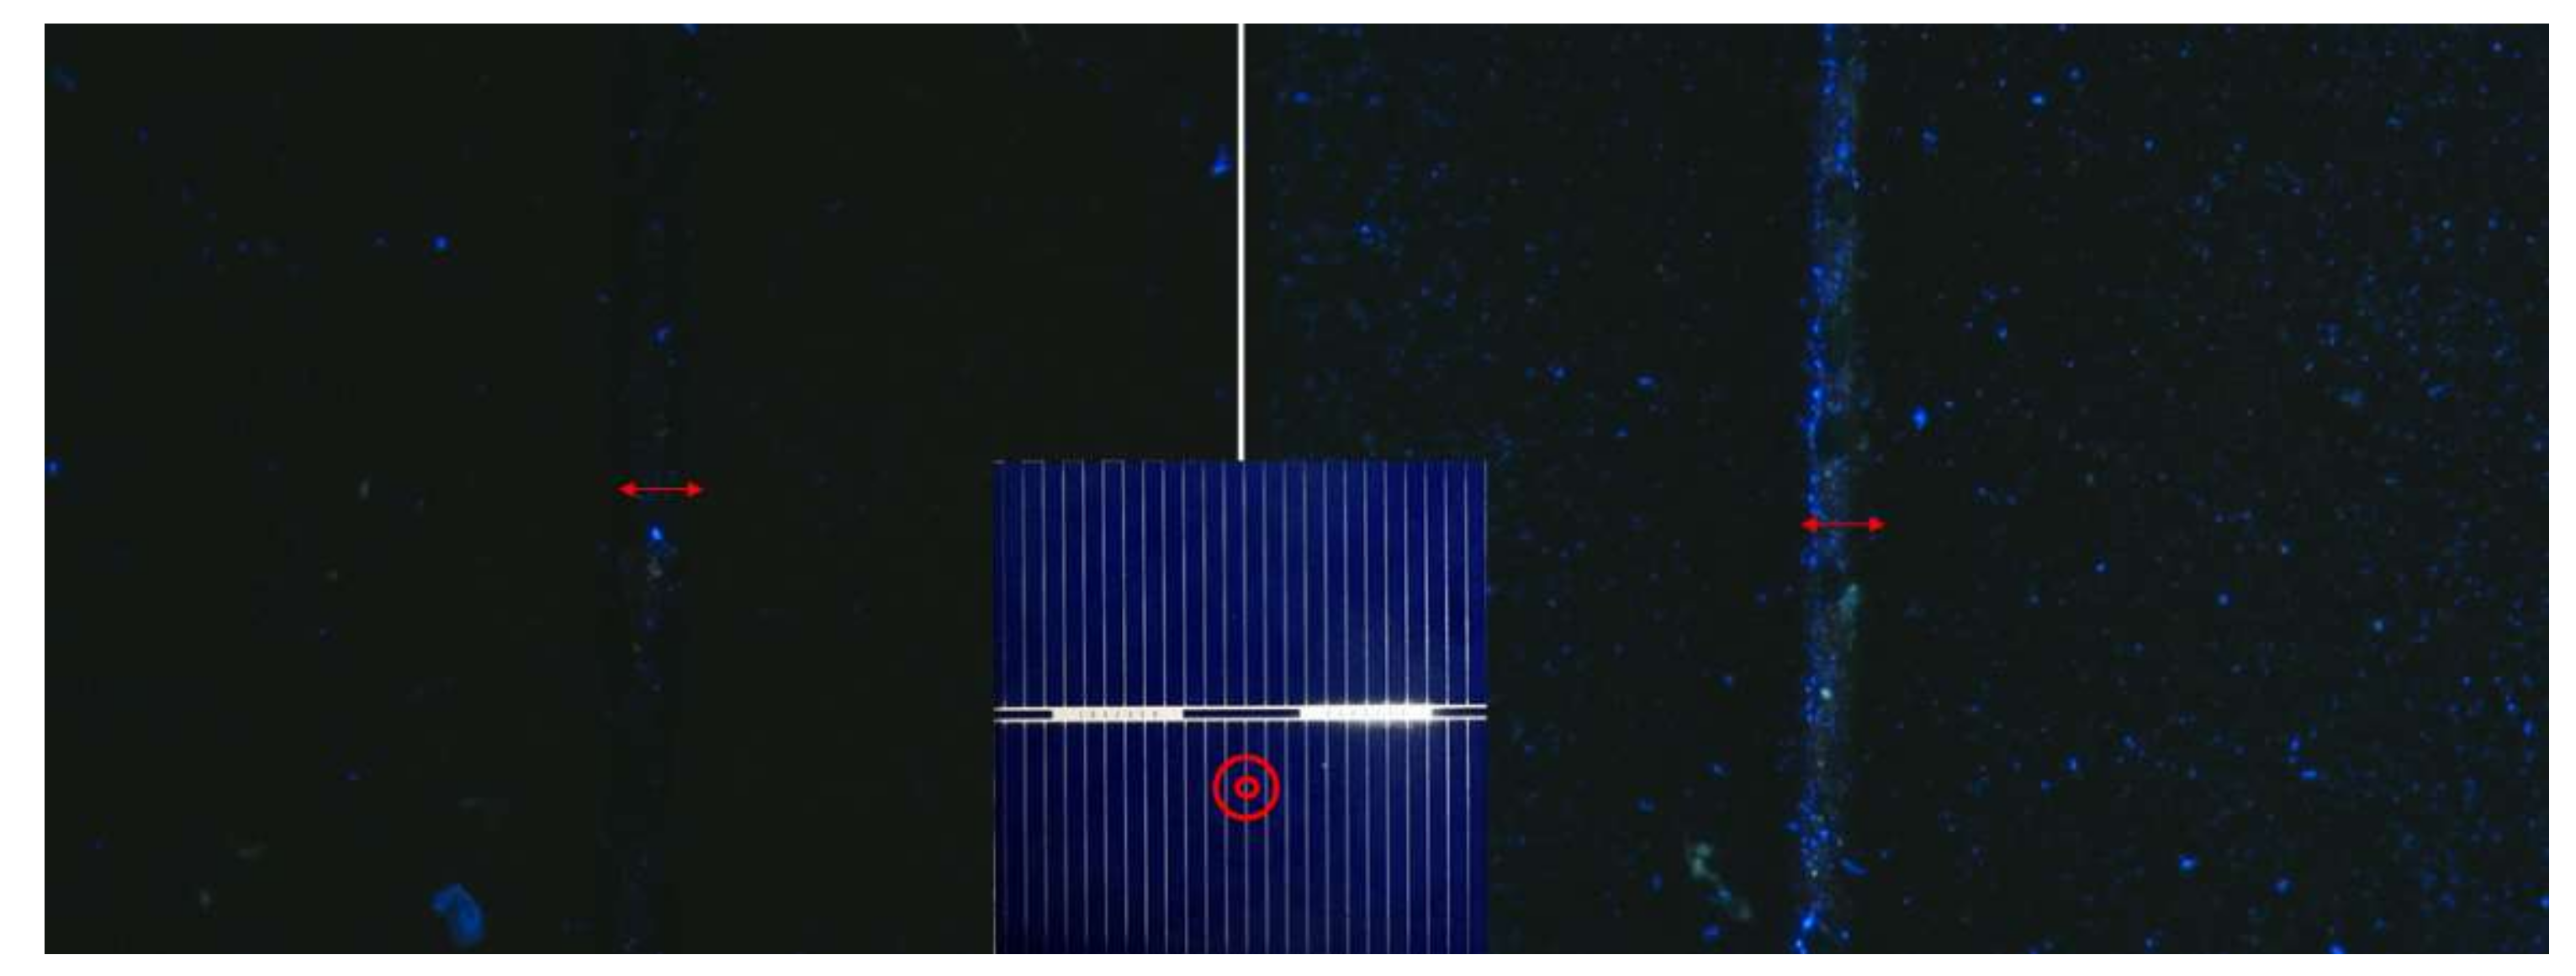
2.3. Electrical and Optical Characterisation
3. Results and Analysis
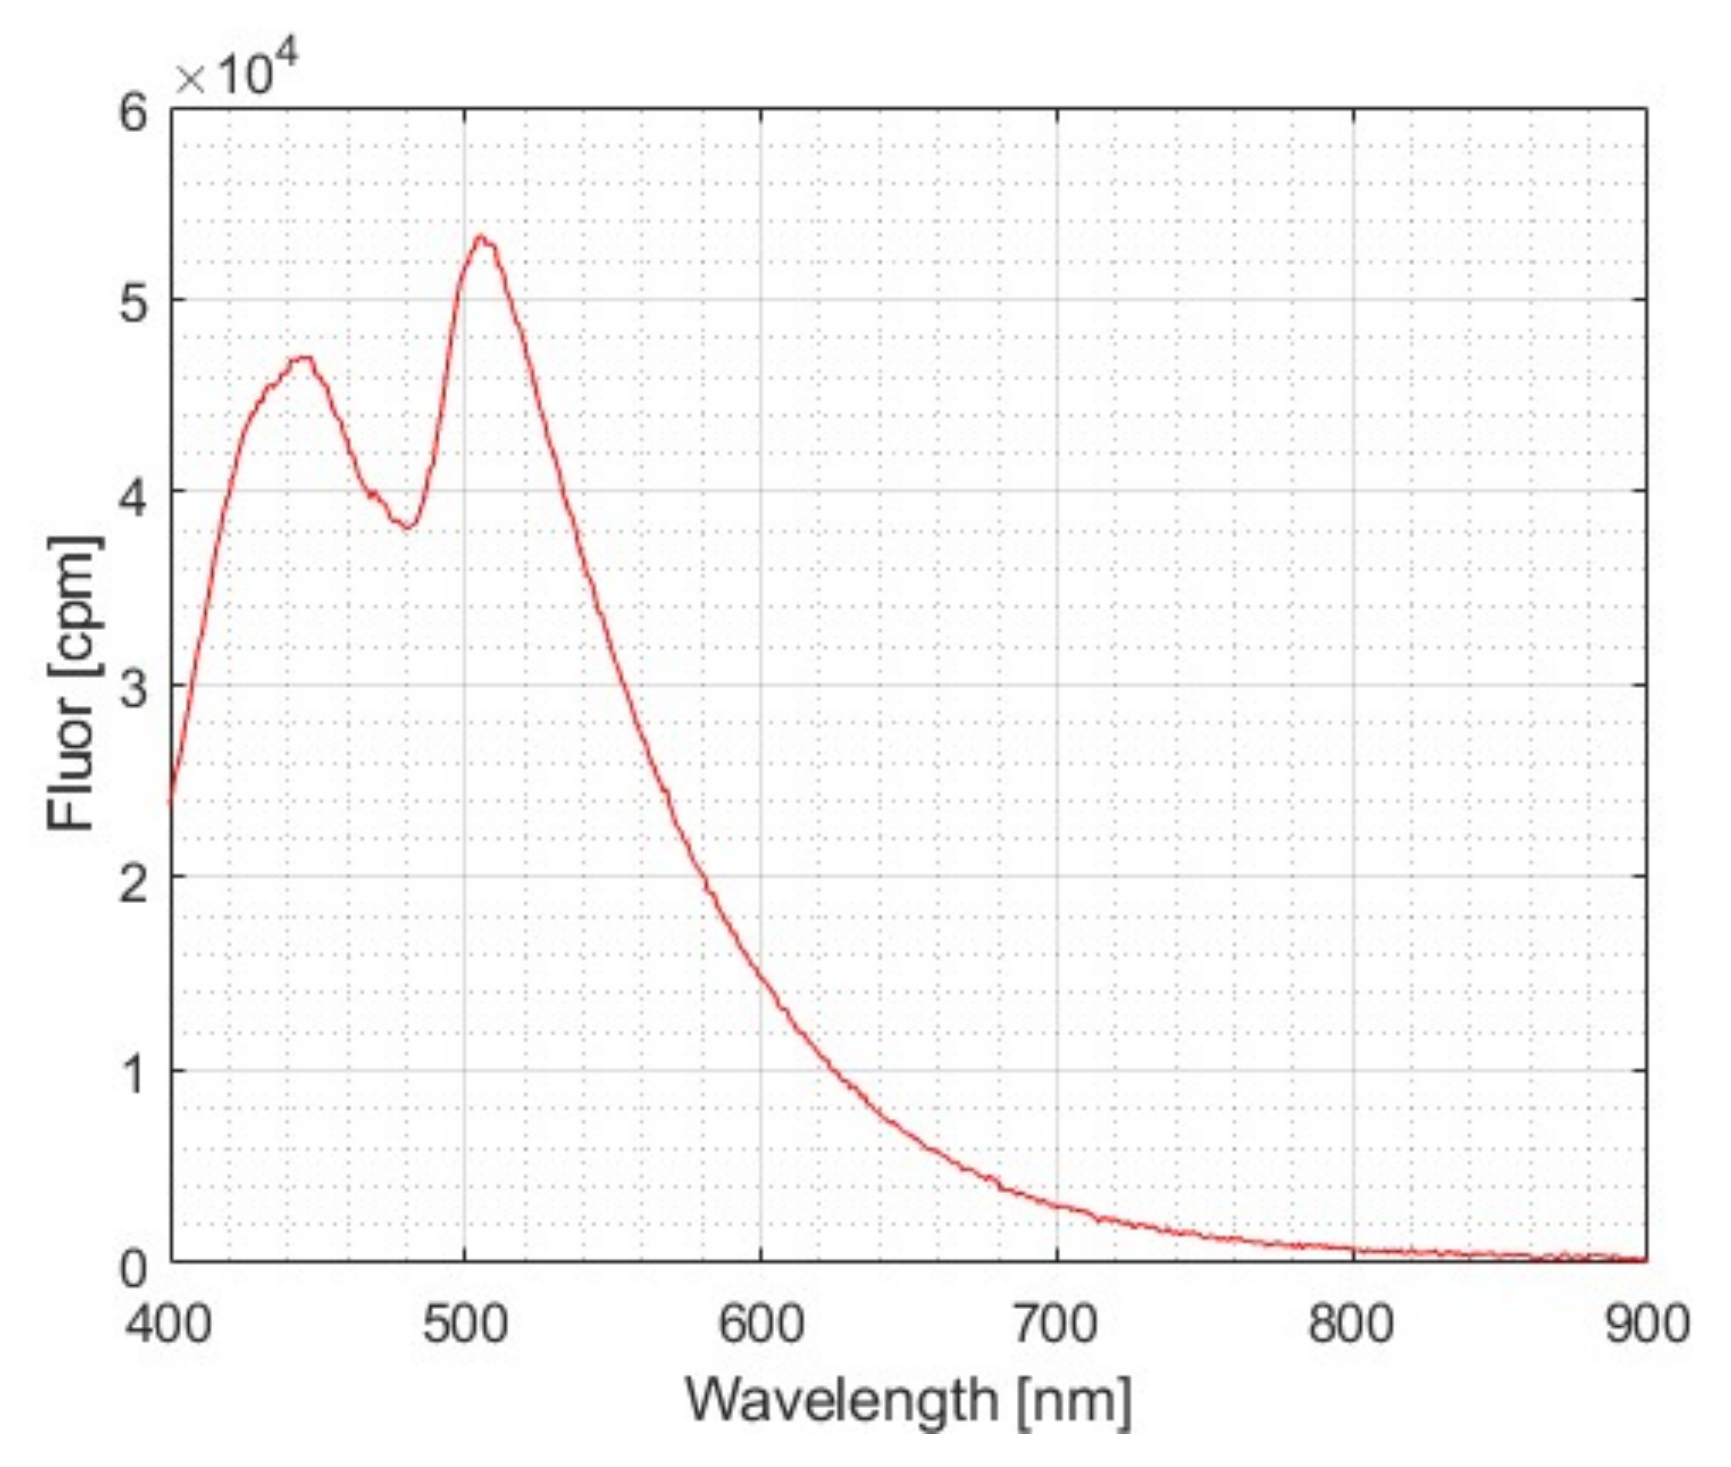
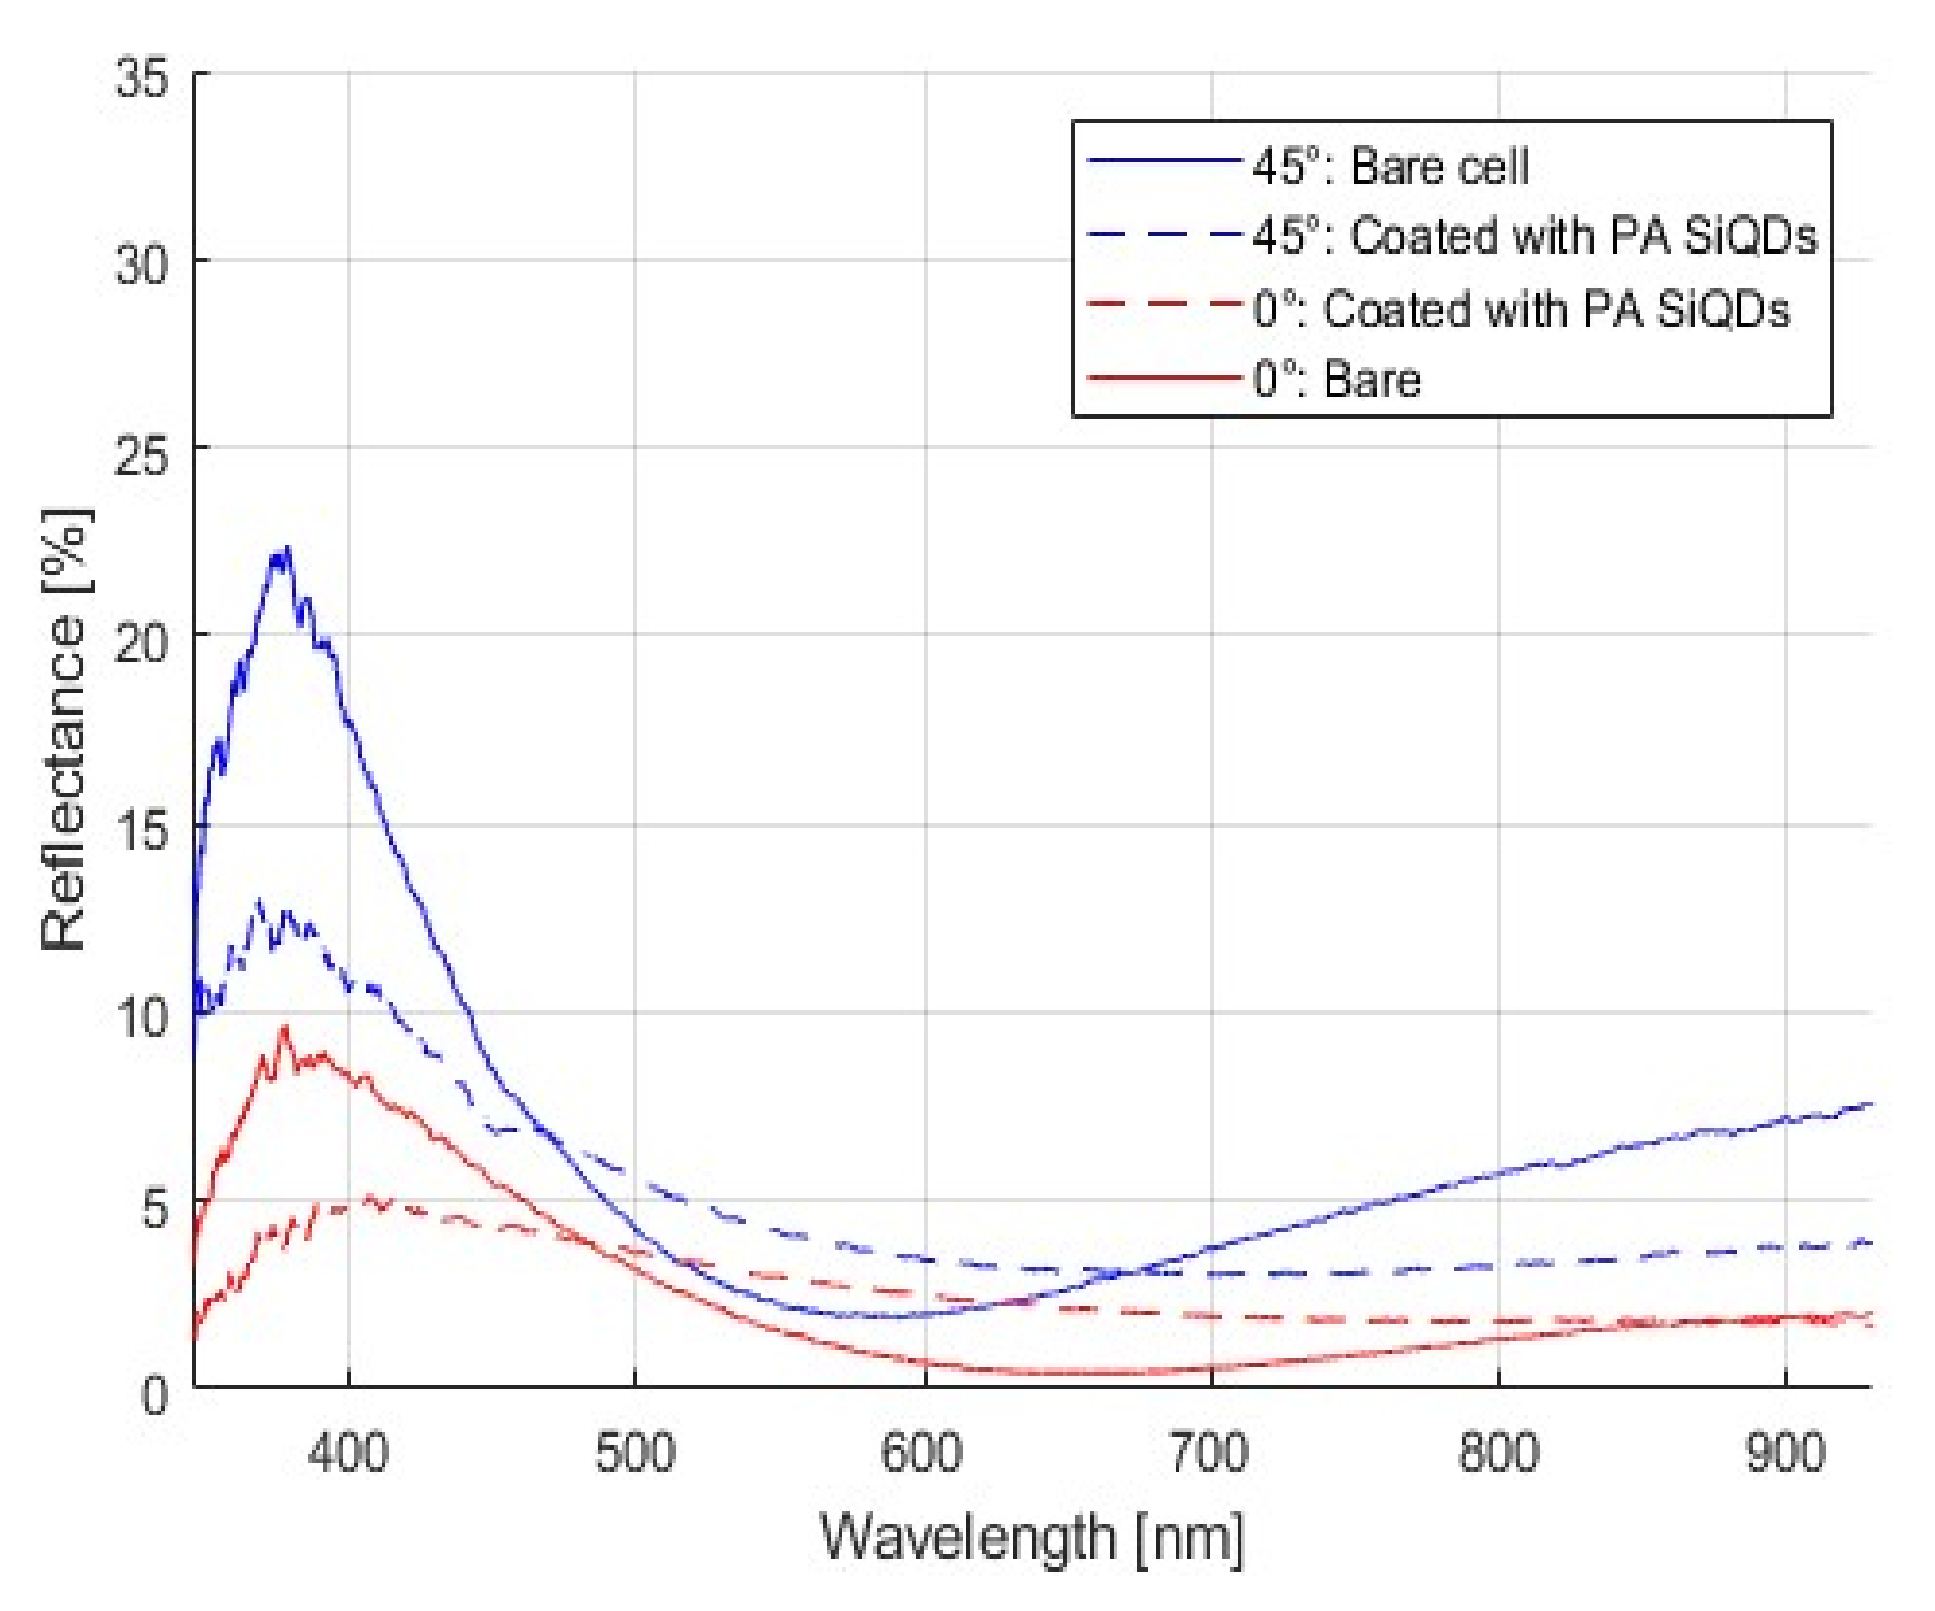
3.1. Optical Measurements
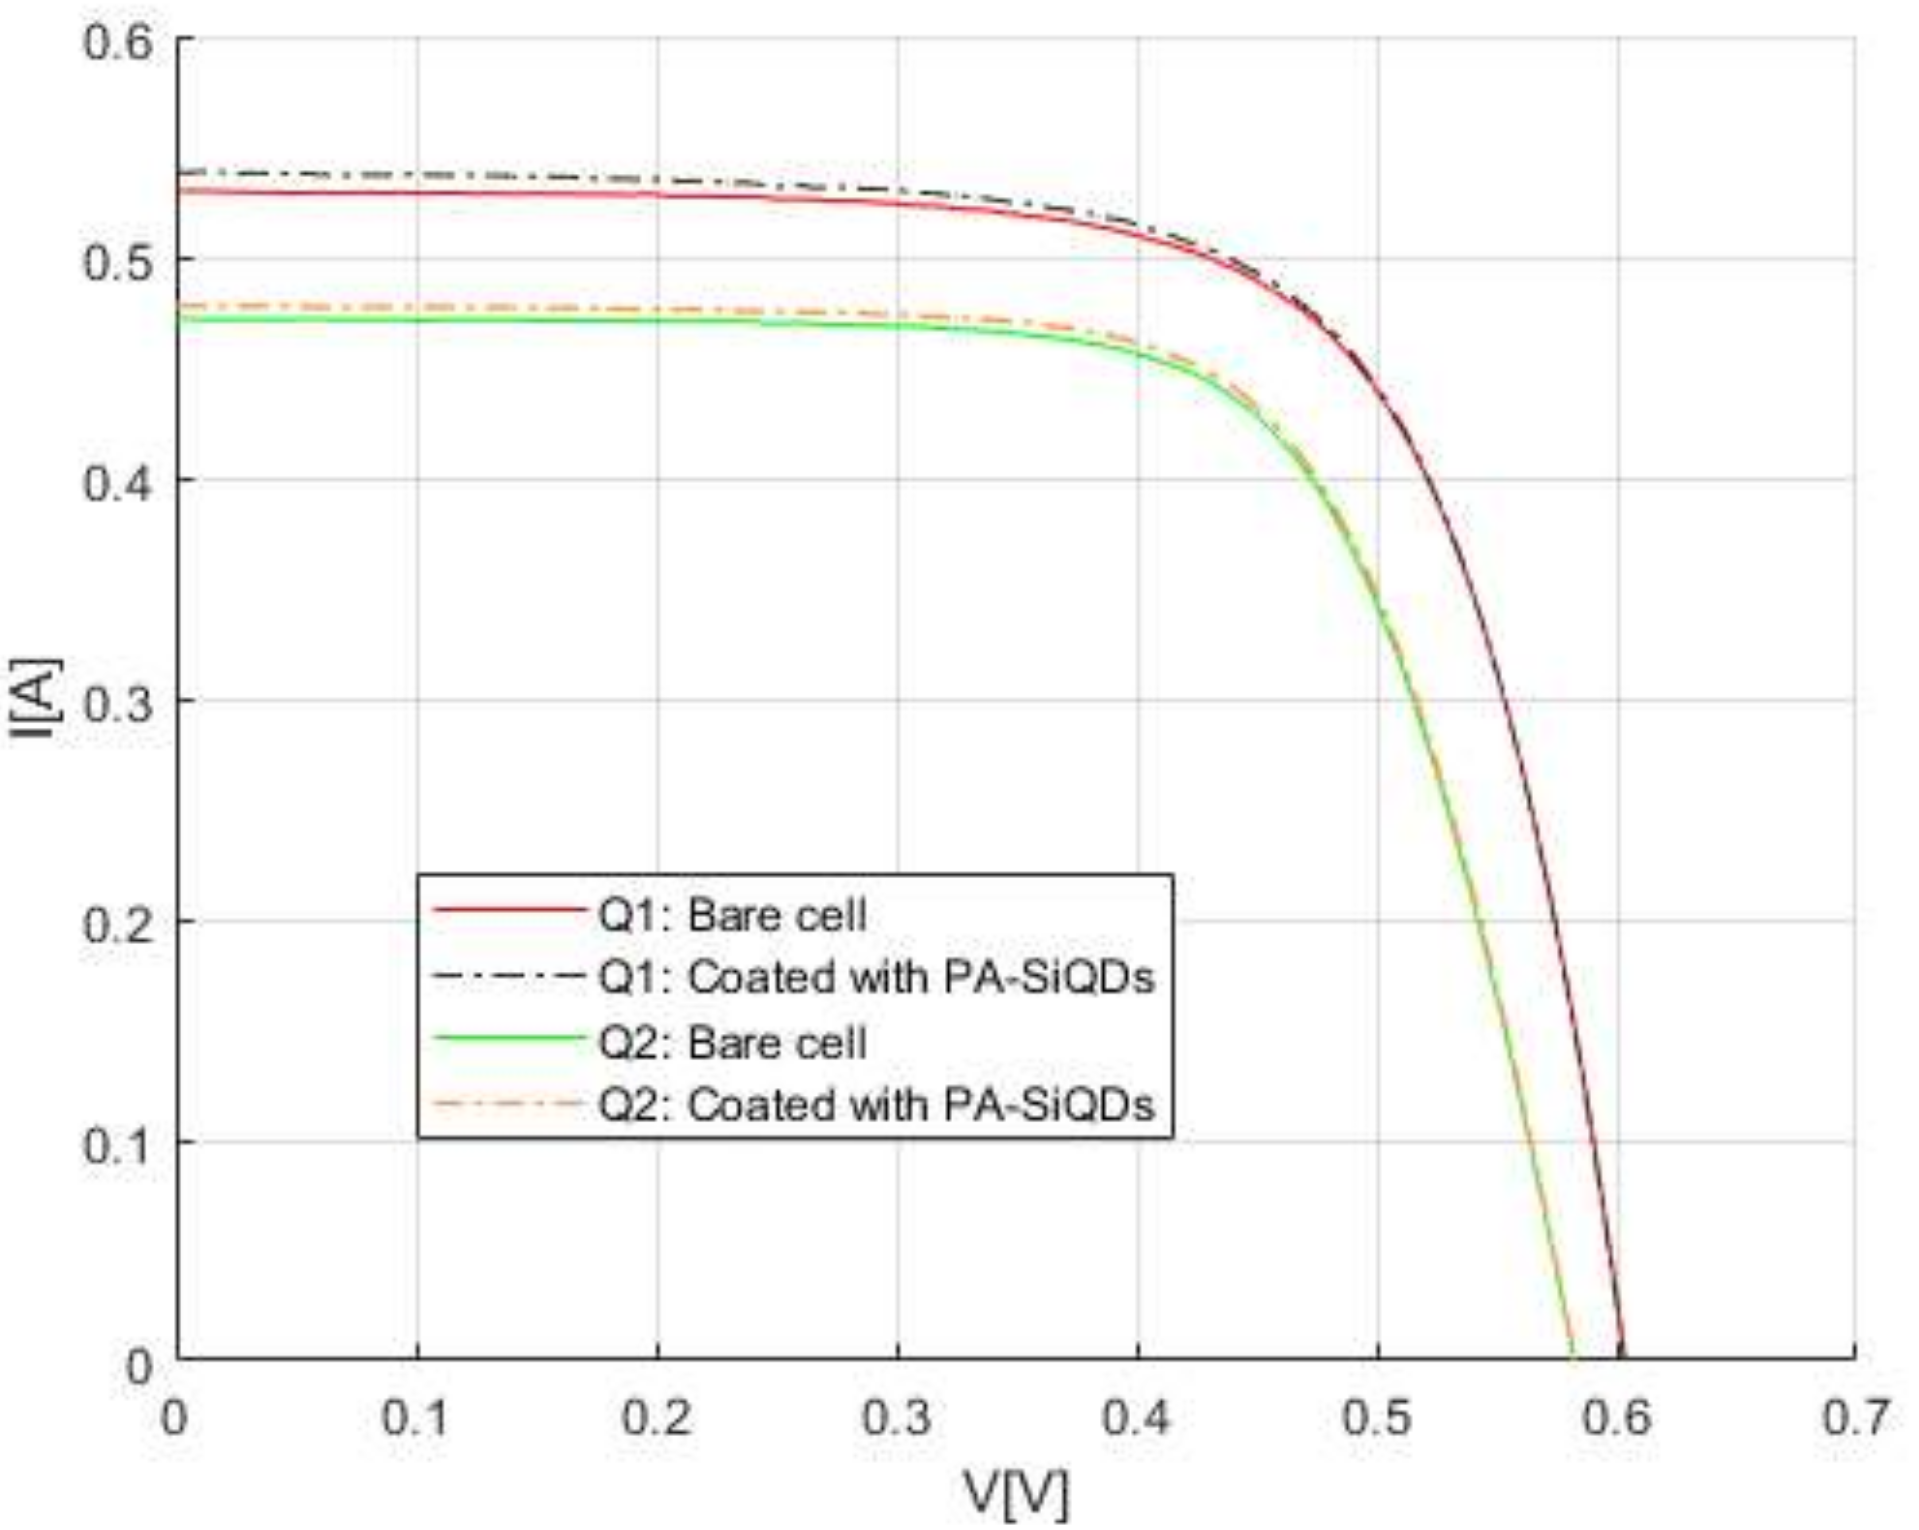
3.2. Electrical Characterisation
4. Degradation and Reproducibility
5. Discussion
6. Conclusions
Author Contributions
Funding
Data Availability Statement
Acknowledgments
Conflicts of Interest
References
- NREL. Best Research-Cell Efficiency Chart. Photovoltaic Research. 2021. Available online: https://www.nrel.gov/pv/cell-efficiency.html (accessed on 10 September 2021).
- Green, M.A.; Emery, K.; Hishikawa, Y.; Warta, W.; Dunlop, E.D. Solar cell efficiency tables (version 48). Prog. Photovolt. Res. Appl. 2016, 24, 905–913. [Google Scholar] [CrossRef] [Green Version]
- Green, M.; Dunlop, E.; Hohl-Ebinger, J.; Yoshita, M.; Kopidakis, N.; Hao, X. Solar cell efficiency tables (version 57). Prog. Photovolt. Res. Appl. 2021, 29, 3–15. [Google Scholar] [CrossRef]
- Wirth, H. Crystalline Silicon PV Module Technology. In Semiconductors and Semimetals; Elsevier: Amsterdam, The Netherlands, 2013; Volume 89, pp. 135–197. [Google Scholar]
- Nunzi, J.M. Requirements for a rectifying antenna solar cell technology. Nanophotonics III 2010, 7712, 771204. [Google Scholar]
- McKenna, B.; Evans, R.C. Towards Efficient Spectral Converters through Materials Design for Luminescent Solar Devices. Adv. Mater. 2017, 29, 1–23. [Google Scholar] [CrossRef] [PubMed]
- Dexter, D.L. Possibility of luminescent quantum yields greater than unity. Phys. Rev. 1957, 108, 630–633. [Google Scholar] [CrossRef]
- De la Mora, M.B.; Amelines-Sarria, O.; Monroy, B.M.; Hernández-Pérez, C.D.; Lugo, J.E. Materials for downconversion in solar cells: Perspectives and challenges. Sol. Energy Mater. Sol. Cells 2017, 165, 59–71. [Google Scholar] [CrossRef]
- Bünzli, J.C.G.; Chauvin, A.S. Lanthanides in Solar Energy Conversion. Handb. Phys. Chem. Rare Earths 2014, 44, 169–281. [Google Scholar]
- Bartram, R.H.; Lempicki, A. Electron multiplication in scintillators and phosphors. J. Lumin. 1997, 72–74, 734–736. [Google Scholar] [CrossRef]
- Ronda, C. Luminescent materials with quantum efficiency larger than 1, status and prospects. J. Lumin. 2002, 100, 301–305. [Google Scholar] [CrossRef]
- Richards, B.S. Luminescent layers for enhanced silicon solar cell performance: Down-conversion. Sol. Energy Mater. Sol. Cells 2006, 90, 1189–1207. [Google Scholar] [CrossRef]
- Shalav, A.; Richards, B.S.; Green, M.A. Luminescent layers for enhanced silicon solar cell performance: Up-conversion. Sol. Energy Mater. Sol. Cells 2007, 91, 829–842. [Google Scholar] [CrossRef]
- Ahmed, H.; McCormack, S.J.; Doran, J. External Quantum Efficiency Improvement with Luminescent Downshifting Layers: Experimental and Modelling. 2016. Available online: https://downloads.hindawi.com/archive/2016/8543475.pdf (accessed on 22 April 2022).
- Hovel, H.J.; Hodgson, R.T.; Woodall, J.M. The effect of fluorescent wavelength shifting on solar cell spectral response. Sol. Energy Mater. 1979, 2, 19–29. [Google Scholar] [CrossRef]
- Klampaftis, E.; Ross, D.; McIntosh, K.R.; Richards, B.S. Enhancing the performance of solar cells via luminescent down-shifting of the incident spectrum: A review. Sol. Energy Mater. Sol. Cells 2009, 93, 1182–1194. [Google Scholar] [CrossRef]
- Alonso-Álvarez, D.; Ross, D.; Klampaftis, E.; McIntosh, K.R.; Jia, S.; Storiz, P.; Stolz, T.; Richards, B.S. Luminescent down-shifting experiment and modelling with multiple photovoltaic technologies. Prog. Photovolt. Res. Appl. 2015, 23, 479–497. [Google Scholar] [CrossRef]
- Van Der Ende, B.M.; Aarts, L.; Meijerink, A. Lanthanide ions as spectral converters for solar cells. Phys. Chem. Chem. Phys. 2009, 11, 11081–11095. [Google Scholar] [CrossRef] [PubMed]
- Han, H.V.; Lin, C.C.; Tsai, Y.L.; Chen, H.C.; Chen, K.J.; Yeh, Y.L.; Lin, W.Y.; Kuo, H.C.; Yu, P. A Highly Efficient Hybrid GaAs Solar Cell Based on Colloidal-Quantum-Dot-Sensitization. Sci. Rep. 2014, 4, 5734. [Google Scholar] [CrossRef] [Green Version]
- Krishnan, C.; Mercier, T.; Rahman, T.; Piana, G.; Brossard, M.; Yagafarov, T.; To, A.; Pollard, M.E.; Shaw, P.; Bagnall, D.M.; et al. Efficient light harvesting in hybrid quantum dot-interdigitated back contact solar cells: Via resonant energy transfer and luminescent downshifting. Nanoscale 2019, 11, 18837–18844. [Google Scholar] [CrossRef] [Green Version]
- Solodovnyk, A.; Kick, C.; Osvet, A.; Egelhaaf, H.J.; Stern, E.; Batentschuk, M.; Forberich, K.; Brabec, C.J. Optimization of Solution-Processed Luminescent Down-Shifting Layers for Photovoltaics by Customizing Organic Dye Based Thick Films. Energy Technol. 2016, 4, 385–392. [Google Scholar] [CrossRef]
- Gardelis, S.; Nassiopoulou, A.G. Evidence of significant down-conversion in a Si-based solar cell using CuInS2/ZnS core shell quantum dots. Appl. Phys. Lett. 2014, 104, 183902. [Google Scholar] [CrossRef]
- Nakamura, Y.; Iso, Y.; Isobe, T. Bandgap-Tuned CuInS2/ZnS Core/Shell Quantum Dots for a Luminescent Downshifting Layer in a Crystalline Silicon Solar Module. ACS Appl. Nano Mater. 2020, 3, 3417–3426. [Google Scholar] [CrossRef]
- Etgar, L. Semiconductor Nanocrystals as Light Harvesters in Solar Cells. Materials 2013, 6, 445–459. [Google Scholar] [CrossRef] [PubMed] [Green Version]
- Liu, X.; Shan, D.; Ji, Y.; Li, D.; Li, W.; Xua, J.; Chen, K. Improved device performance of Si-based heterojunction solar cells by using phosphorus doped Si nanocrystals embedded in SiC host matrix. AIP Adv. 2019, 9, 025213. [Google Scholar] [CrossRef]
- Kumar, K.; Subramanian, H. Spin coating of Silver Nanoparticles and Silicon Quantum Dots for Enhanced Down Conversion Efficiency. Master’s Thesis, Delft University of Technology, Delft, The Netherlands, December 2013. [Google Scholar]
- Pi, X.; Li, Q.; Li, D.; Yang, D. Spin-coating silicon-quantum-dot ink to improve solar cell efficiency. Sol. Energy Mater. Sol. Cells 2011, 95, 2941–2945. [Google Scholar] [CrossRef]
- Stupca, M.; Alsalhi, M.; Al Saud, T.; Almuhanna, A.; Nayfeh, M.H. Enhancement of polycrystalline silicon solar cells using ultrathin films of silicon nanoparticle. Appl. Phys. Lett. 2007, 91, 063107. [Google Scholar] [CrossRef]
- Pi, X.; Zhang, L.; Yang, D. Enhancing the Efficiency of Multicrystalline Silicon Solar Cells by the Inkjet Printing of Silicon-Quantum-Dot Ink. 2012. Available online: https://pubs.acs.org/doi/10.1021/jp307078g (accessed on 1 July 2020).
- Sacks, J.; Savidge, R.M.; Gabr, A.; Walker, A.; Beal, R.; Wheeldon, J.; Knights, A.P.; Mascher, P.; Hinzer, K.; Kleiman, R.N. Quantum efficiency measurements of down-shifting using silicon nanocrystals for photovoltaic applications. In Proceedings of the Conference Record of the IEEE Photovoltaic Specialists Conference, Austin, TX, USA, 3–8 June 2012; pp. 92–96. [Google Scholar]
- Remolina, A.; Monroy, B.M.; Garcia-Sanchez, M.F.; Ponce, A. Polymorphous silicon thin films obtained by plasma-enhanced chemical vapor depositionusing dichlorosilane as silicon precursor. Nanotechnology 2009, 20, 245604. [Google Scholar] [CrossRef]
- Švrček, V.; Slaoui, A.; Muller, J.C. Silicon nanocrystals as light converter for solar cells. Thin Solid Film. 2004, 451–452, 384–388. [Google Scholar] [CrossRef]
- Gribov, B.G.; Zinov’ev, K.V.; Kalashnik, O.N.; Gerasimenko, N.N.; Smirnov, D.I.; Sukhanov, V.N.; Kononov, N.N.; Dorofeev, S.G. Production of Silicon Nanoparticles for Use in Solar Cells. Semiconductors 2018, 51, 1675–1680. [Google Scholar] [CrossRef]
- Chowdhury, F.I.; Alnuaimi, A.; El-Atab, N.; Nayfeh, M.; Nayfeh, A. Enhanced performance of thin-film amorphous silicon solar cells with a top film of 2.85 nm silicon nanoparticles. Sol. Energy 2016, 125, 332–338. [Google Scholar] [CrossRef]
- Ashby, S.P.; Bian, T.; Ning, H.; Reece, M.J.; Chao, Y. Thermal Diffusivity of SPS Pressed Silicon Powders and the Potential for Using Bottom-Up Silicon Quantum Dots as a Starting Material. 2014. Available online: https://link.springer.com/article/10.1007/s11664-014-3599-y (accessed on 30 January 2020).
- Ashby, S.P.; García-Cañadas, J.; Min, G.; Chao, Y. Measurement of thermoelectric properties of phenylacetylene-capped silicon nanoparticles and their potential in fabrication of thermoelectric materials. J. Electron. Mater. 2013, 42, 1495–1498. [Google Scholar] [CrossRef]
- Ashby, S.P. Thomas, J.A.; García-Cañadas, J.; Min, G.; Corps, J.; Powell, A.V.; Xu, H.; Shend, W.; Chao, Y. Bridging Silicon Nanoparticles and Thermoelectrics: Phenylacetylene Functionalization. Faraday Discuss. 2014, 176, 349–361. [Google Scholar] [CrossRef]
- Pilkington. Pilkington OptiwhiteTM for Solar Applications. 2022. Available online: https://www.pilkington.com/en/global/products/product-categories/solar-energy/pilkington-optiwhite-for-solar-applications#productrange (accessed on 29 October 2021).
- Krishnamurthy Grandhi, G.; Arunkumar, M.; Viswanatha, R. Understanding the Role of Surface Capping Ligands in Passivating the Quantum Dots Using Copper Dopants as Internal Sensor. J. Phys. Chem. 2016, 120, 19785–19795. [Google Scholar]
- Nakaya, H.; Nishida, M.; Takeda, Y.; Moriuchi, S.; Tonegawa, T.; Machida, T.; Nunoi, T. Polycrystalline silicon solar cells with V-grooved surface. Sol. Energy Mater. Sol. Cells 1994, 34, 219–225. [Google Scholar] [CrossRef]
- Mirin, R.P.; Gossard, A.C.; Bowers, J.E. Characterization of InGaAs quantum dot lasers with a single quantum dot layer as an active region. Phys. E Low-Dimens. Syst. Nanostruct. 1998, 2, 738–742. [Google Scholar] [CrossRef]
- SCHOTT. Advanced Optics, “BG42”. 2022. Available online: https://www.schott.com/shop/advanced-optics/en/Matt-Filter-Plates/BG42/c/glass-BG42 (accessed on 8 March 2022).
- Khaleda, M.Z.F.; Vengadaesvaran, B.; Rahim, N.A. Spectral response and quantum efficiency evaluation of solar cells: A review. In Energy Materials: Fundamentals to Applications; Elsevier: Amsterdam, The Netherlands, 2021; pp. 525–566. [Google Scholar]
- Van Sark, W.G.J.H.M.; Meijerink, A.; Schropp, R.E.I. Solar Spectrum Conversion for Photovoltaics Using Nanoparticles; IntechOpen: Rijeka, Croatia, 2012. [Google Scholar]


| Cell Type | Average Size of Si-QDs (nm) | λexc (nm) | λem (nm) | Surface Coating Method | ΔIsc (%) Increase | ΔPCE (%) Increase | LDS Layer Thickness (nm) | Ref. |
|---|---|---|---|---|---|---|---|---|
| pc-Si (commercial) | ~3 | 325 | 660 | Spin-coating in IPA | ~2.3% | 3.7% (fresh coat) 1.3% (after 11 days) 1.5% (after 41 days) | ~120 | [27] |
| sc-Si (commercial) | 6.4 | 300 400 500 | 680 | Spin-coating, SOG (spin-on-glass) | ~1.3% | 0.4% (actual) 1.2% (modelled at 100% DSE) | 130 | [32] |
| pc-Si (commercial) | ~3 [27] | 370 | 773 | Inkjet in mesitylene | N/A | 2% | 74 | [29] |
| c-Si solar cell | 2–10 | N/A | 3–4 nm: 795 6–8 nm: 865 9–10 nm: 905 | Spin-coating | N/A | 12% | 50–300 | [33] |
| a-Si | 2.85 | 365 | 628 | Spin-coating | 11.42% | N/A | 2–7 | [34] |
| pc-Si (BP Solarex Si) | 1 | 254 365 | 328 (at λexc = 254 nm) 410 (at λexc = 365 nm) | Dropcast in IPA | 17% (at 254, 365 nm) | ~62% (at 254, 365 nm) | 1–3 | [28] |
| 4% (at 550–650 nm) | <3% (at 550–650 nm) | |||||||
| 2.85 | 630 (at λexc = 254, 365 nm) | 5% (at 254, 365 nm) | ~67% (at 254 nm) | |||||
| <5% (at 550–650 nm) | 7.5–13.5% (at 550–650 nm) |
| Samples | Electrical Parameters | Bare Solar Cell | Coated with PA Si-QDs | % Increase |
|---|---|---|---|---|
| Q1 | Isc (A) | 0.531 | 0.535 | 0.75 |
| Pm (W) | 0.224 | 0.224 | 0.00 | |
| Voc (V) | 0.603 | 0.603 | 0.00 | |
| Q2 | Isc (A) | 0.472 | 0.477 | 1.06 |
| Pm (W) | 0.193 | 0.194 | 0.51 | |
| Voc (V) | 0.582 | 0.583 | 0.17 |
| Electrical Parameters | Q2 Bare Sample | Q2 Coated and Encapsulated | % Increase |
|---|---|---|---|
| Isc (A) | 0.472 | 0.528 | 11.86 |
| Pm (W) | 0.193 | 0.215 | 11.39 |
| Voc (V) | 0.582 | 0.586 | 0.69 |
| Reference Cell Sample | Electrical Parameters | Average Values | % Increase | |
|---|---|---|---|---|
| Bare cell | Encapsulated | |||
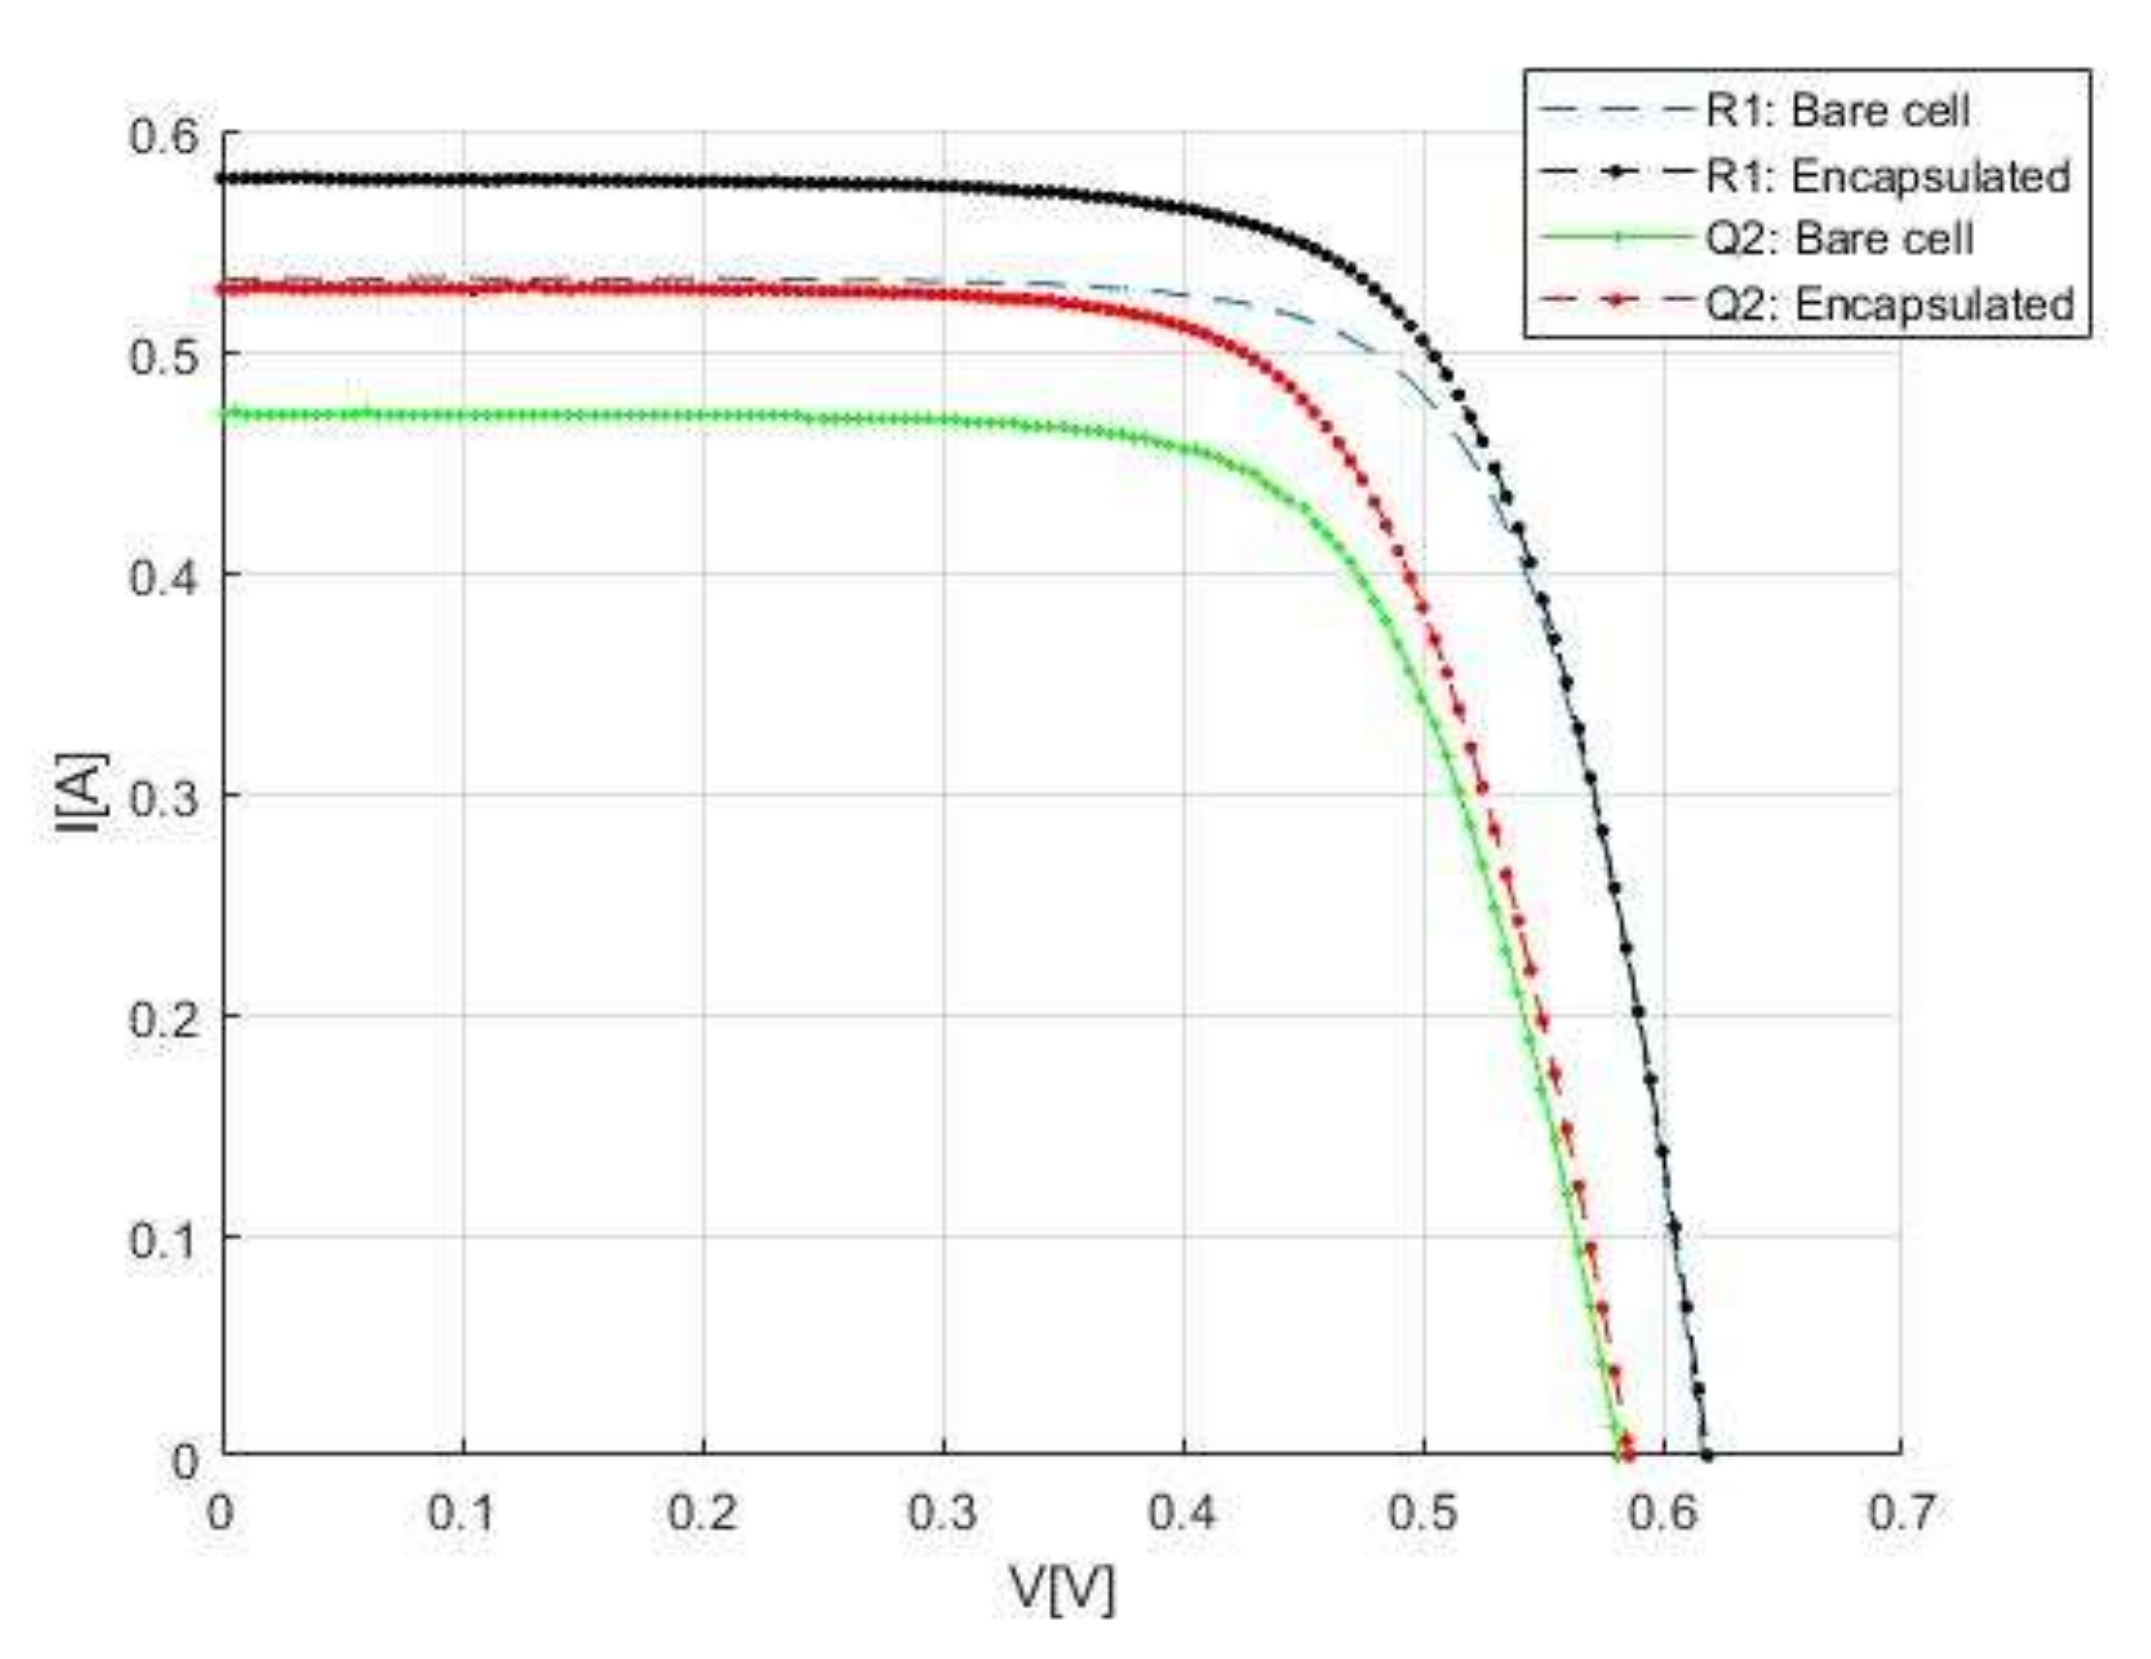
| R1 | Isc (A) | 0.533 | 0.577 | 8.26 |
| Pm (W) | 0.240 | 0.253 | 5.42 | |
| Voc (V) | 0.616 | 0.619 | 0.49 | |
| R2 | Isc (A) | 0.548 | 0.595 | 8.58 |
| Pm (W) | 0.229 | 0.249 | 8.73 | |
| Voc (V) | 0.612 | 0.614 | 0.33 | |
| R3 | Isc (A) | 0.543 | 0.589 | 8.47 |
| Pm (W) | 0.243 | 0.262 | 7.81 | |
| Voc (V) | 0.620 | 0.622 | 0.32 | |
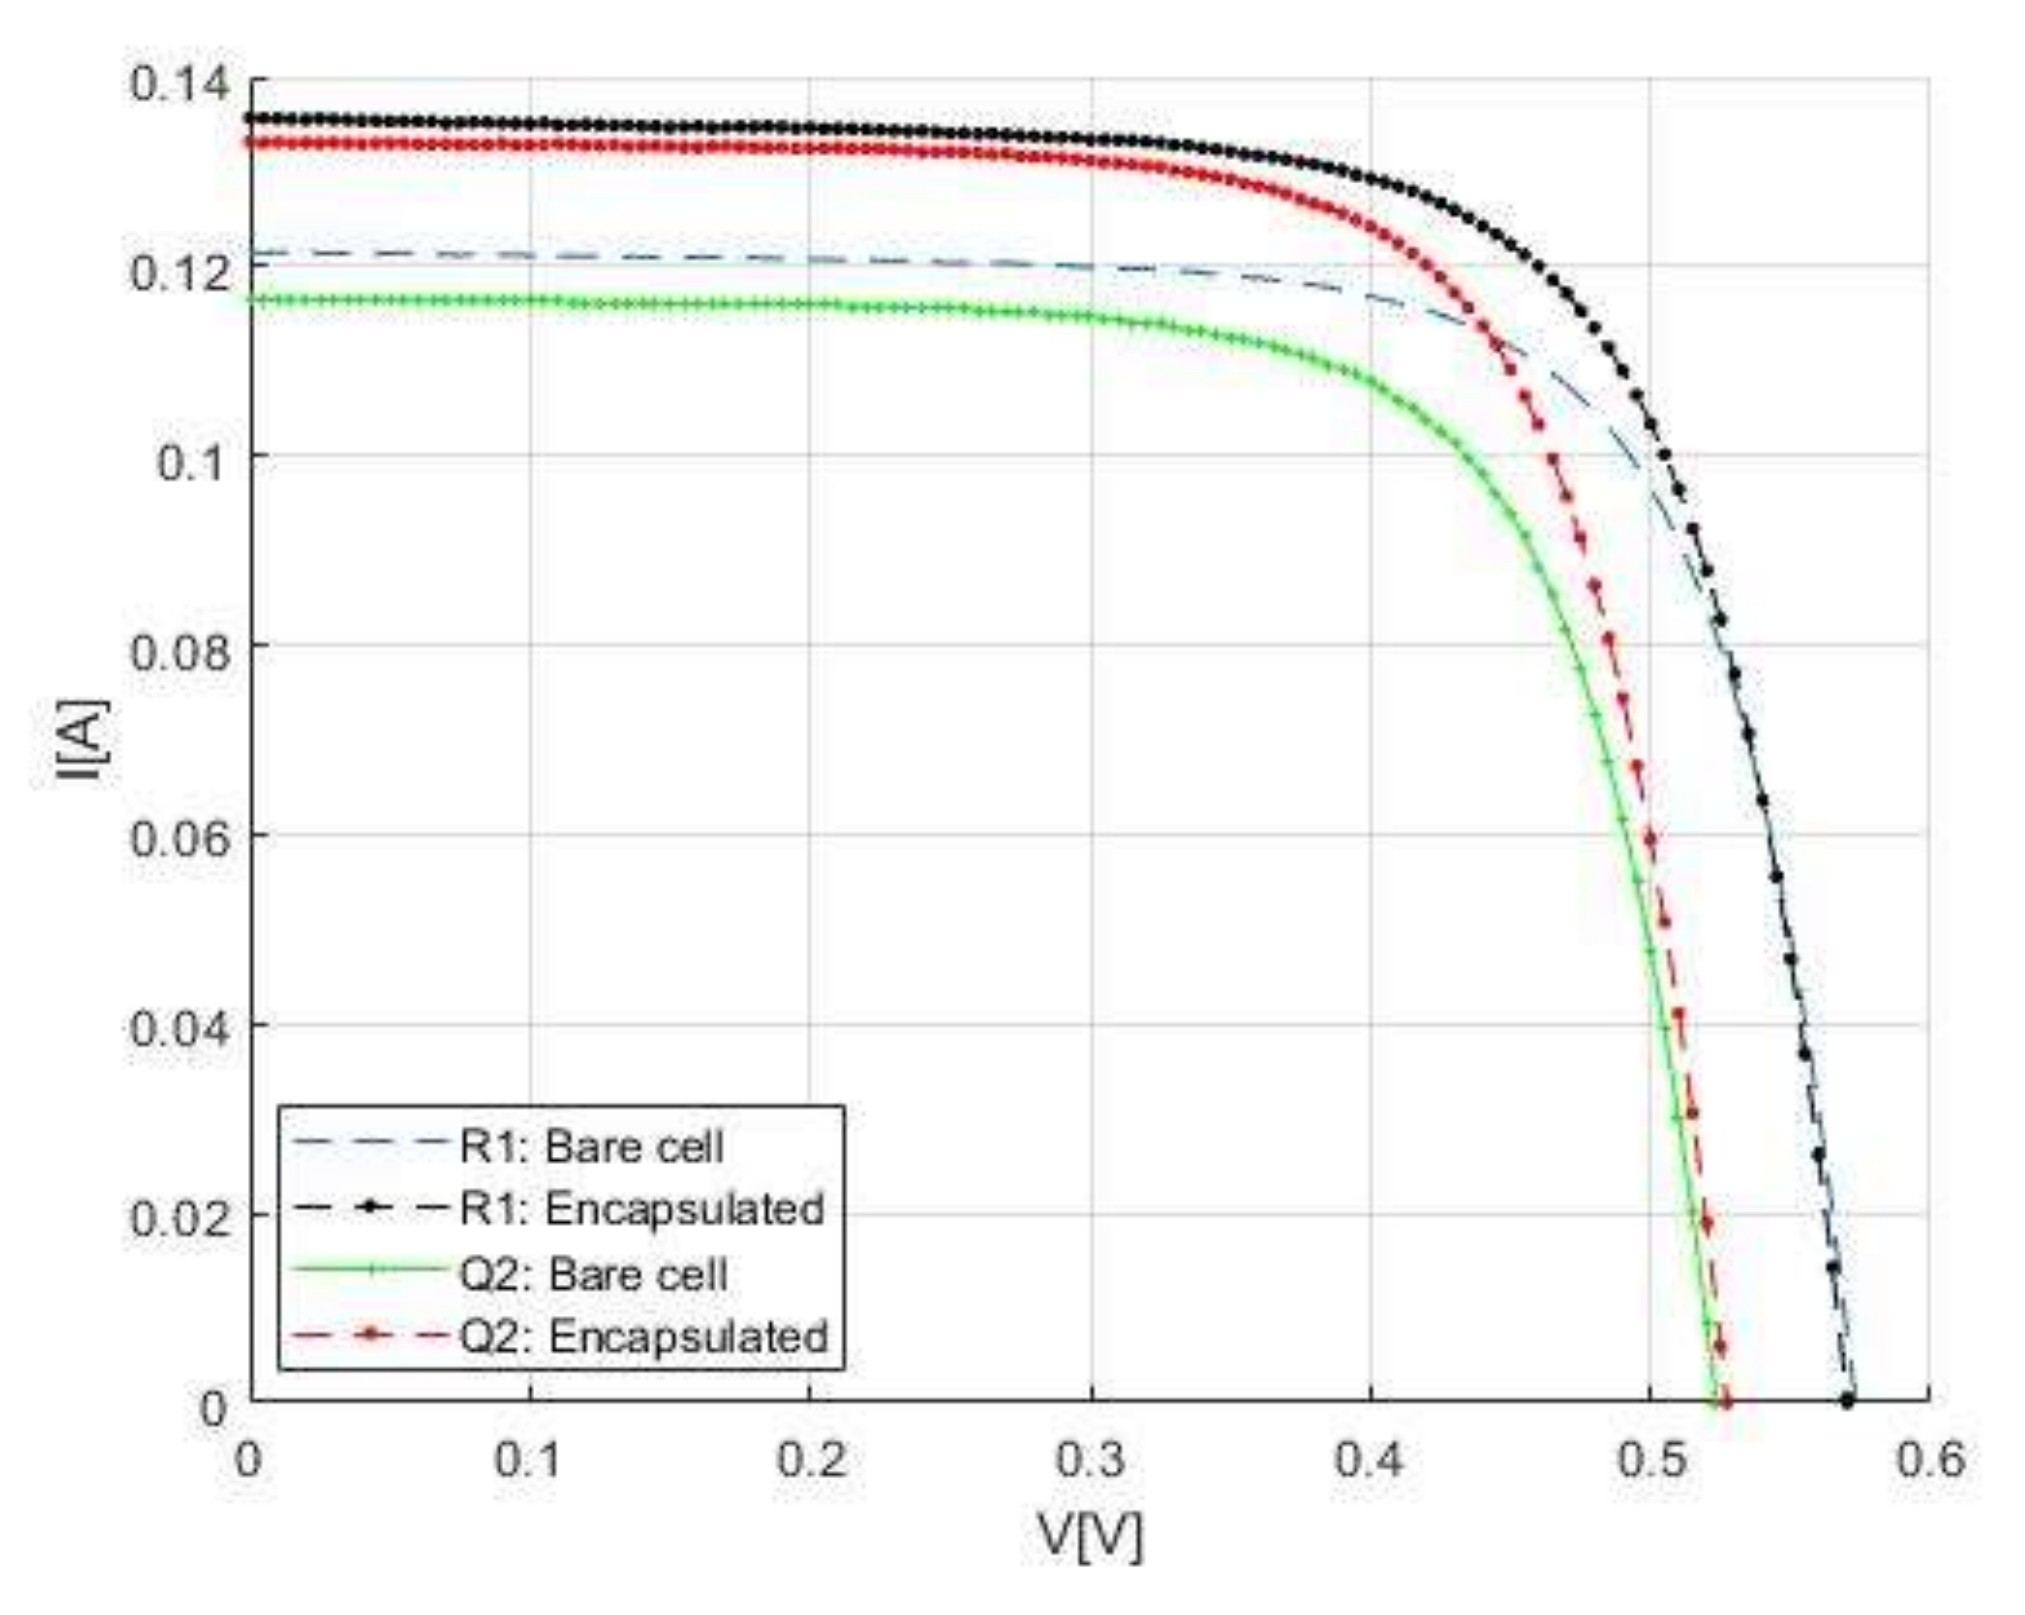
| Sample | Electrical Parameters | Bare Cell | Encapsulated Cell | % Increase |
|---|---|---|---|---|
| Q2 | Isc (A) | 0.117 | 0.133 | 13.68 |
| Pm (W) | 0.044 | 0.051 | 15.91 | |
| Voc (V) | 0.524 | 0.527 | 0.57 | |
| R1 | Isc (A) | 0.121 | 0.135 | 11.57 |
| Pm (W) | 0.051 | 0.055 | 7.84 | |
| Voc (V) | 0.574 | 0.570 | −0.70 |
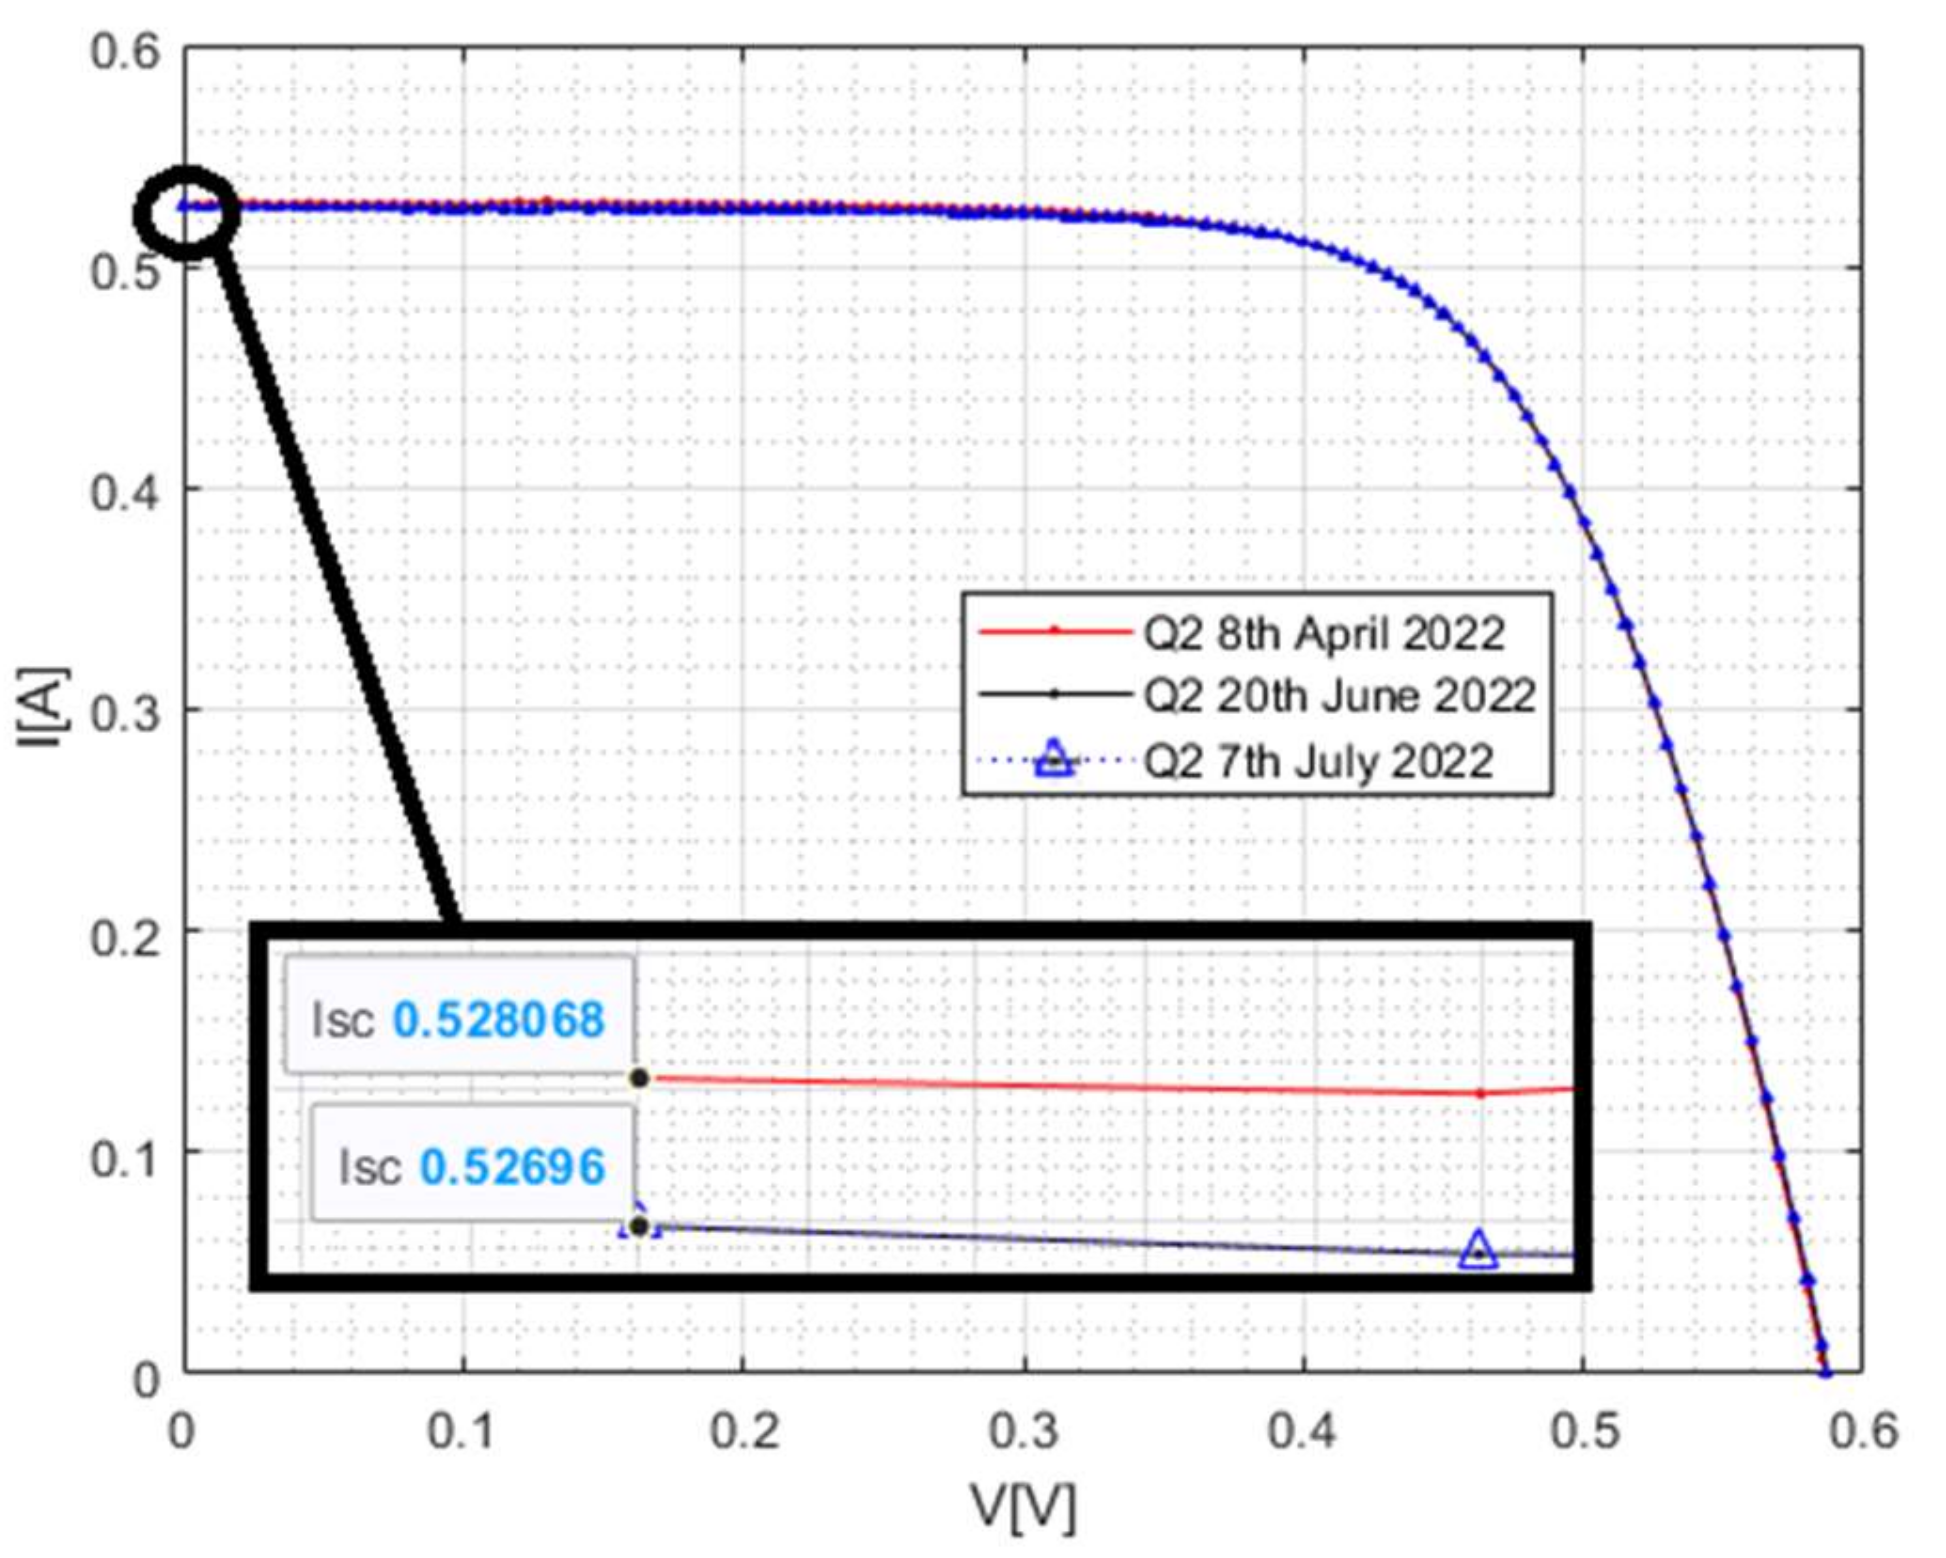
| Electrical Parameters | 8 April 2022 | 74 Days: 20 June 2022 | % Increase | 91 Days: 7 July 2022 | % Increase |
|---|---|---|---|---|---|
| Isc (A) | 0.528 | 0.527 | −0.19 | 0.527 | −0.19 |
| Pm (W) | 0.215 | 0.215 | 0.00 | 0.214 | −0.47 |
| Voc (V) | 0.586 | 0.587 | 0.17 | 0.585 | −0.17 |
| Date | 8 April 2022 | 74 Days: 20 June 2022 | 91 Days: 7 July 2022 |
|---|---|---|---|
| STD of Isc (A) | 0.002 | 0.003 | 0.002 |
| STD of Pm (W) | 0.002 | 0.003 | 0.002 |
| STD of Voc (V) | 0.002 | 0.002 | 0.002 |
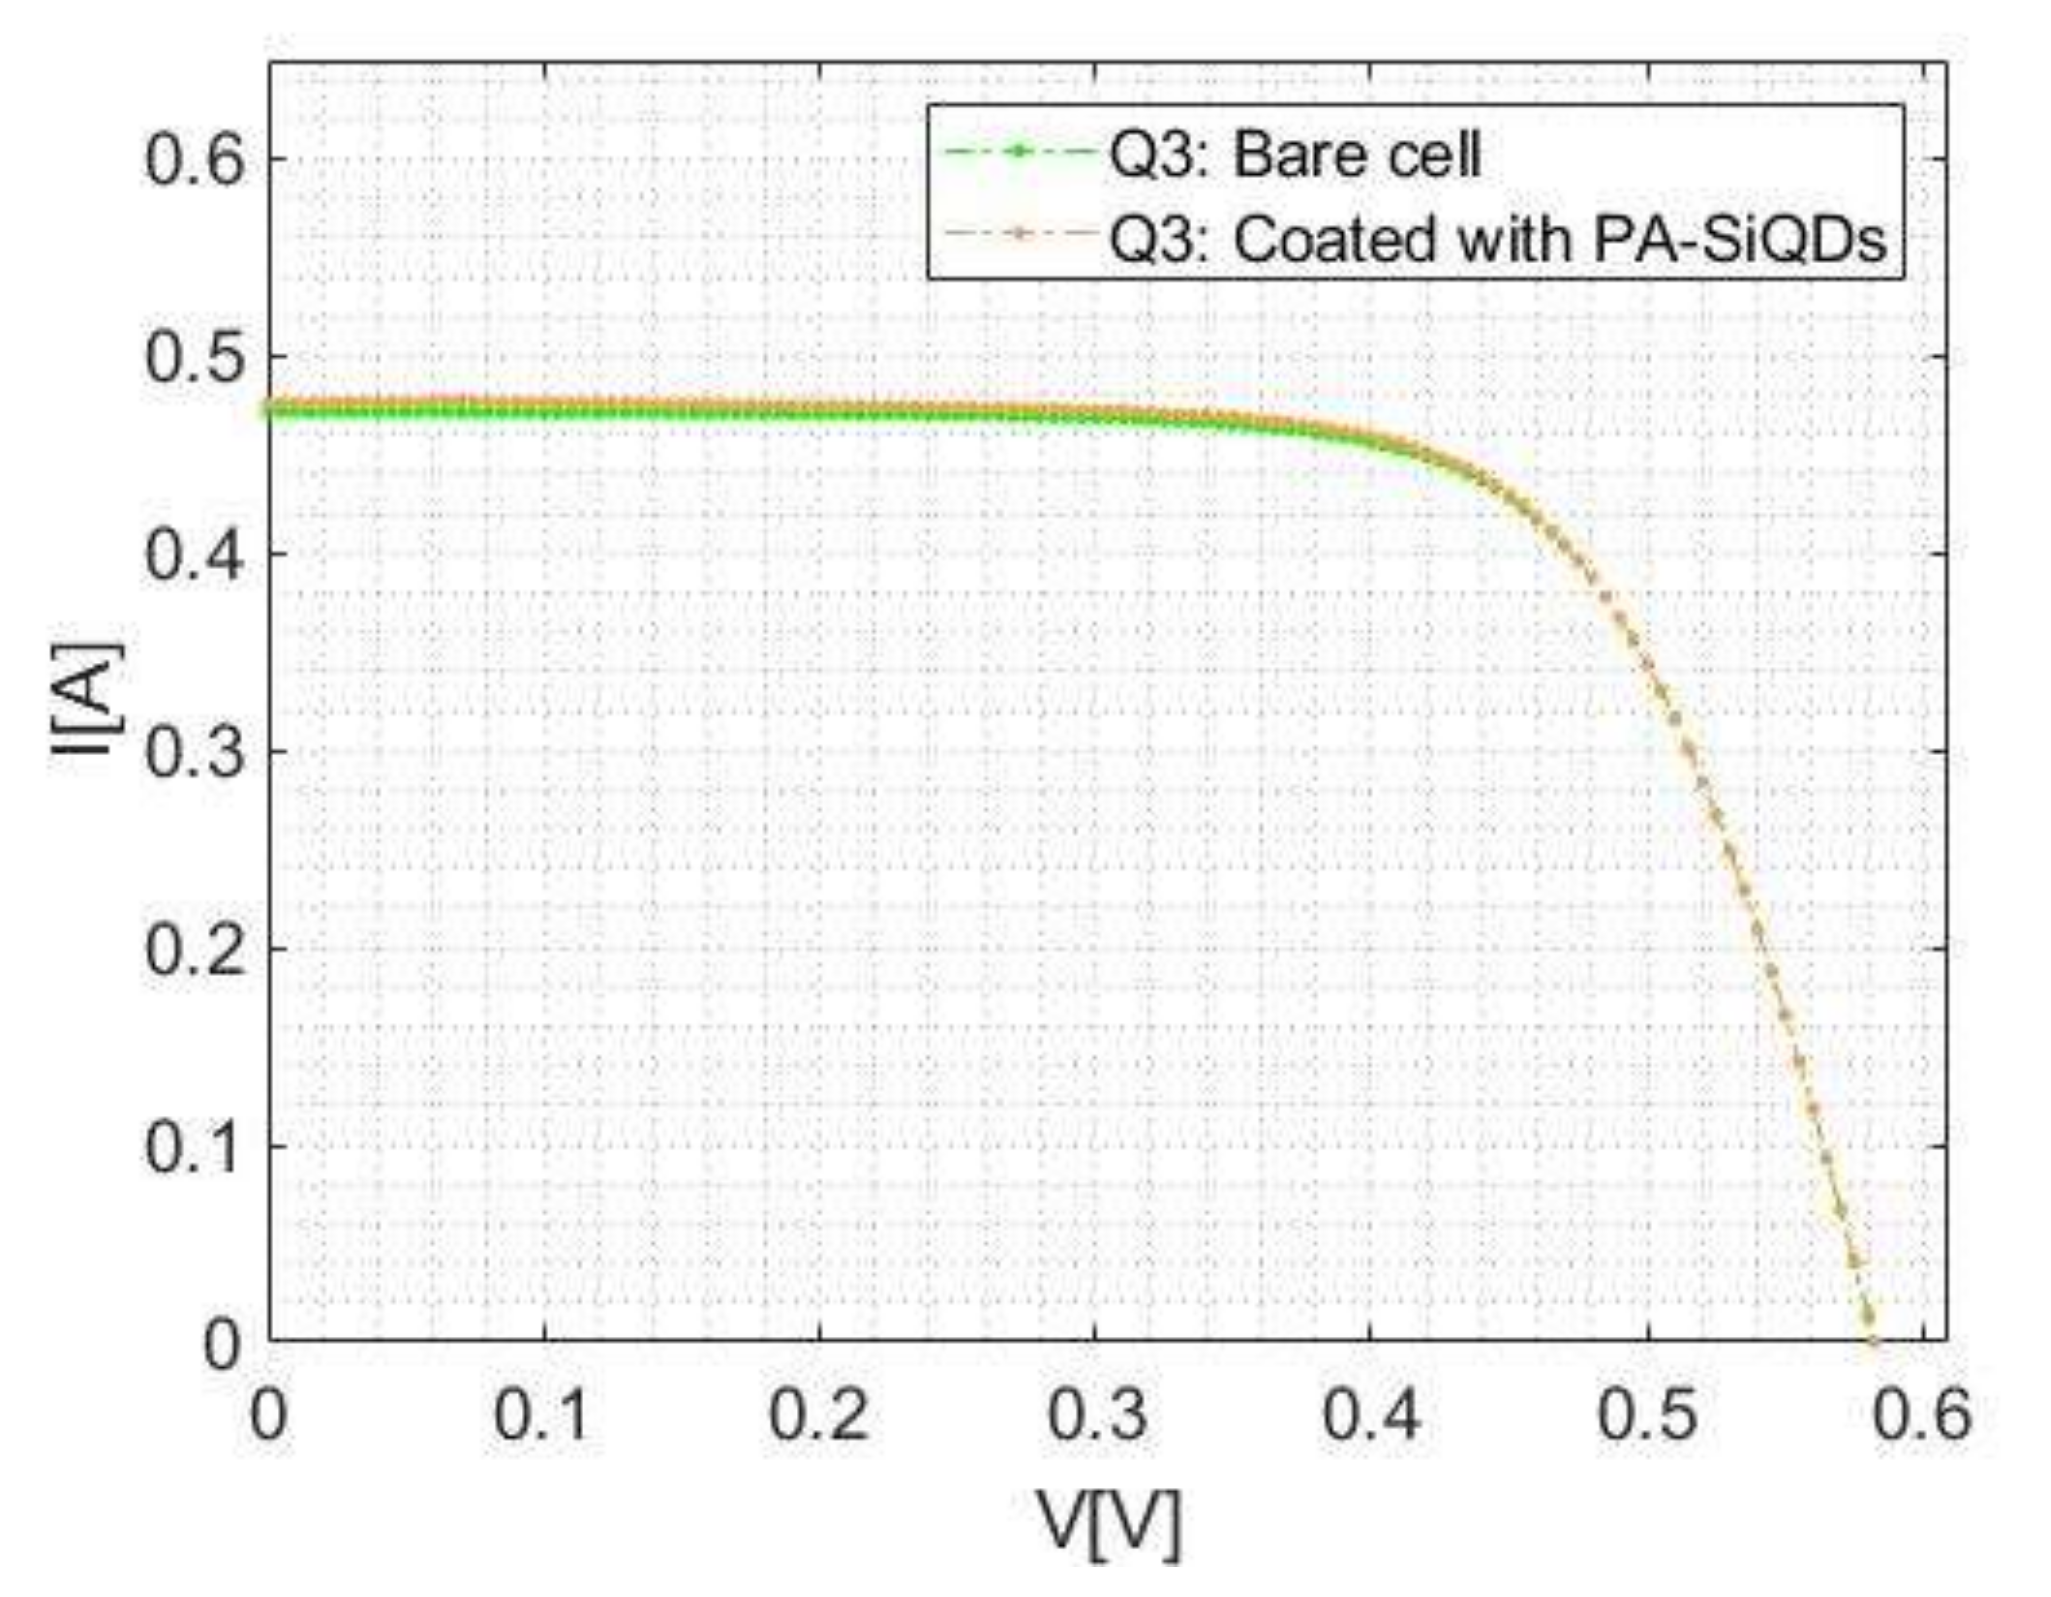
| Electrical Parameters | Q3 Bare Sample | Q3 Coated with PA Si-QDs 85 Days Later | % Increase |
|---|---|---|---|
| Isc (A) | 0.509 | 0.512 | 0.59 |
| Pm (W) | 0.212 | 0.211 | −0.47 |
| Voc (V) | 0.602 | 0.600 | −0.33 |
| Sample | Electrical Parameters | Bare Cell | Coated with PA Si-QDs | % Increase |
|---|---|---|---|---|
| Q2 | Isc (A) | 0.1168 | 0.1182 | 1.2 |
| STD of Isc (A) | 0.0001 | 0.0005 |
Publisher’s Note: MDPI stays neutral with regard to jurisdictional claims in published maps and institutional affiliations. |
© 2022 by the authors. Licensee MDPI, Basel, Switzerland. This article is an open access article distributed under the terms and conditions of the Creative Commons Attribution (CC BY) license (https://creativecommons.org/licenses/by/4.0/).
Share and Cite
Masaadeh, Q.; Kaplani, E.; Chao, Y. Luminescent Downshifting Silicon Quantum Dots for Performance Enhancement of Polycrystalline Silicon Solar Cells. Electronics 2022, 11, 2433. https://doi.org/10.3390/electronics11152433
Masaadeh Q, Kaplani E, Chao Y. Luminescent Downshifting Silicon Quantum Dots for Performance Enhancement of Polycrystalline Silicon Solar Cells. Electronics. 2022; 11(15):2433. https://doi.org/10.3390/electronics11152433
Chicago/Turabian StyleMasaadeh, Qais, Eleni Kaplani, and Yimin Chao. 2022. "Luminescent Downshifting Silicon Quantum Dots for Performance Enhancement of Polycrystalline Silicon Solar Cells" Electronics 11, no. 15: 2433. https://doi.org/10.3390/electronics11152433
APA StyleMasaadeh, Q., Kaplani, E., & Chao, Y. (2022). Luminescent Downshifting Silicon Quantum Dots for Performance Enhancement of Polycrystalline Silicon Solar Cells. Electronics, 11(15), 2433. https://doi.org/10.3390/electronics11152433