Article

High-Performance Enhancement of SWIR Images

1
College of Automation Engineering, Nanjing University of Aeronautics and Astronautics, Nanjing 211106, China
2
Xi’an Institute of Optics and Precision Mechanics, Chinese Academy of Sciences, Xi’an 710119, China
*
Author to whom correspondence should be addressed.
Electronics 2022, 11(13), 2001; https://doi.org/10.3390/electronics11132001
Submission received: 10 May 2022 / Revised: 20 June 2022 / Accepted: 22 June 2022 / Published: 26 June 2022
(This article belongs to the Section Optoelectronics)

Abstract

:
Short-wave infrared imaging technology has rapidly developed over the past decade. However, image detail and contrast enhancement techniques, which are crucial for infrared imaging systems, are rarely dedicated to SWIR imaging systems. Moreover, the existing IR image enhancement methods generally have difficulty providing real-time performance, which plays a significant role in imaging systems with high data rates. In this paper, we propose a simple and real-time SWIR image enhancement approach based on the difference of Gaussian filter and histogram remapping, and illustrate the implementation of the proposed method on FPGA. The experimental results demonstrated that our method achieves promising detail and contrast enhancement performance with a frame rate of around 50 fps for high-definition images, and that extremely high frame rates can be achieved with pipelined architecture.

1. Introduction

Short-wave infrared (SWIR) cameras have increasingly become popular due to their long-acting distance, controllable cost, and better fog transmission. These advantages are important in optoelectronic pod [1] applications, which typically integrate imaging systems with a long focal length and large F-number. Infrared (IR) images are generally processed by nonuniformity correction (NUC), bad pixel correction (BPC), detail and contrast enhancement, and dynamic range compression before being displayed [2]; detail as well as contrast enhancement are crucial to improving image quality. It is well-established that detailed information is represented in the form of edges (dramatic intensity changes within a spatial neighborhood) [3], so detail improvement can be regarded as edge enhancement in IR image processing. The dominant IR image detail improvement methods can be divided into mapping-based approaches, gradient-domain algorithms, and decomposition-based methods [3]. The typical disadvantages of gradient-domain algorithms [4] typically include being computationally expensive and having poor stability, while the mapping-based approaches [5,6] provide relatively limited improvements in the details. Consequently, the existing high-performance detail enhancement methods for IR image processing are decomposition-based methods [7], which separate a detail layer from the input image and assign higher weight before merging, providing outstanding detail and contrast enhancement performance.
In 2009, Branchitta et al. [8] first applied the bilateral filter to the IR image processing and proposed decomposition-based dynamic range partitioning (BF&DRP), but a careful tuning of several parameters is required in different applications, and serious gradient reversal artifacts caused by the bilateral filter are inevitable in some scenarios. To optimize the work in [8], Zuo et al. [9] proposed introducing the bilateral filter [10,11] for display and detail enhancement (BF&DDE), and an adaptive Gaussian filter was applied following the bilateral filter to suppress noise and artifacts. The BF&DDE achieved impressive enhancement performance, but at a high computational cost. In 2014, Liu et al. [12] proposed a method known as GF&DDE, which has a similar framework, but with the bilateral filter replaced by the guided image filter [13]. In our previous work [7], we achieved a good balance between detail enhancement and blinking pixel suppression by combining the fast guided filter [14] and plateau equalization [6] (FGF&PE), with the running time being superior to those of the baseline methods, including the BF&DDE and the GF&DDE, by a large margin.
However, the characteristics of SWIR images are different from those of medium-wave infrared (MWIR) and long-wave infrared (LWIR) images, especially images based on indium gallium arsenide (InGaAs) detectors [15]. The MWIR and LWIR images in long- range imaging systems are typically acquired by mercury cadmium telluride (MCT) IR detectors, which are susceptible to flickering noise (blinking pixels) [16]. The flickering noise of the detector is a characteristic of random telegraphic signals (RTSs), caused by the presence of defects in semiconductor crystals. The resulting location of the blinking pixels changes with time, and the response state is unstable, meaning it cannot be detected and corrected as defective pixels. Consequently, the existing decomposition-based IR image enhancement approaches focus on the performance of blinking pixels suppression. SWIR images are typically acquired by InGaAs detectors, which have fewer blinking pixels than MCT detectors. Blinking pixels are generally suppressed at the cost of detail enhancement performance, meaning that the existing decomposition-based methods [7,8,9,12] used for MWIR and LWIR enhancement cannot yield suitable SWIR image processing results.
More importantly, SWIR images have more detail information than MWIR and LWIR images with the same pixel resolution and optical parameters due to the optical diffraction limit (radius of the Airy disk), which is strongly related to the wavelength; the requirement for SWIR detail enhancement is higher than for MWIR and LWIR images.
In addition, the full-scale frame rate of SWIR (InGaAs) detectors (up to around 300 fps) is much higher than that of MCT detectors (up to around 100 fps). The existing IR image enhancement methods [7,8,9,12] are typically based on edge-preserving filters, including the bilateral [10,11] and guided filters [13], which have difficulty meeting the requirements of applications with high data rates [17].
In this paper, we propose a simple and robust SWIR image-enhancement method based on the difference of Gaussian (DoG) filter [18] and plateau equalization. Compared with our previous work [19], this paper focuses on the description and analysis of strategies for FPGA porting, which is helpful for the application of imaging systems. The primary contributions are given as follows:
To the best of our knowledge, there has been no implementation of the DoG filter to IR image enhancement. We demonstrate that the DoG filter has many advantages and potential for edge and detail extraction in SWIR imaging systems.
The running speed of the proposed method is faster than those of the methods used for comparison by a large margin, with a frame rate of around 50 fps for high-definition (HD) SWIR images, and can be simply and significantly accelerated by pipeline architecture, which we describe in Section 3.3.
The results of FPGA implementation and laptop CPU processing demonstrate that our method has the potential for engineering applications.
This paper is organized as follows: Section 2 provides background information about the DoG filter and plateau equalization. Section 3 describes the details of the proposed method, and provides application guidance for FPGA-based system. Section 4 discusses the results with different parameters and running modes, and the proposed method is compared with other methods. Finally, we conclude with the merits and limitations of our study, and outline future directions in Section 5.

2. Related Work

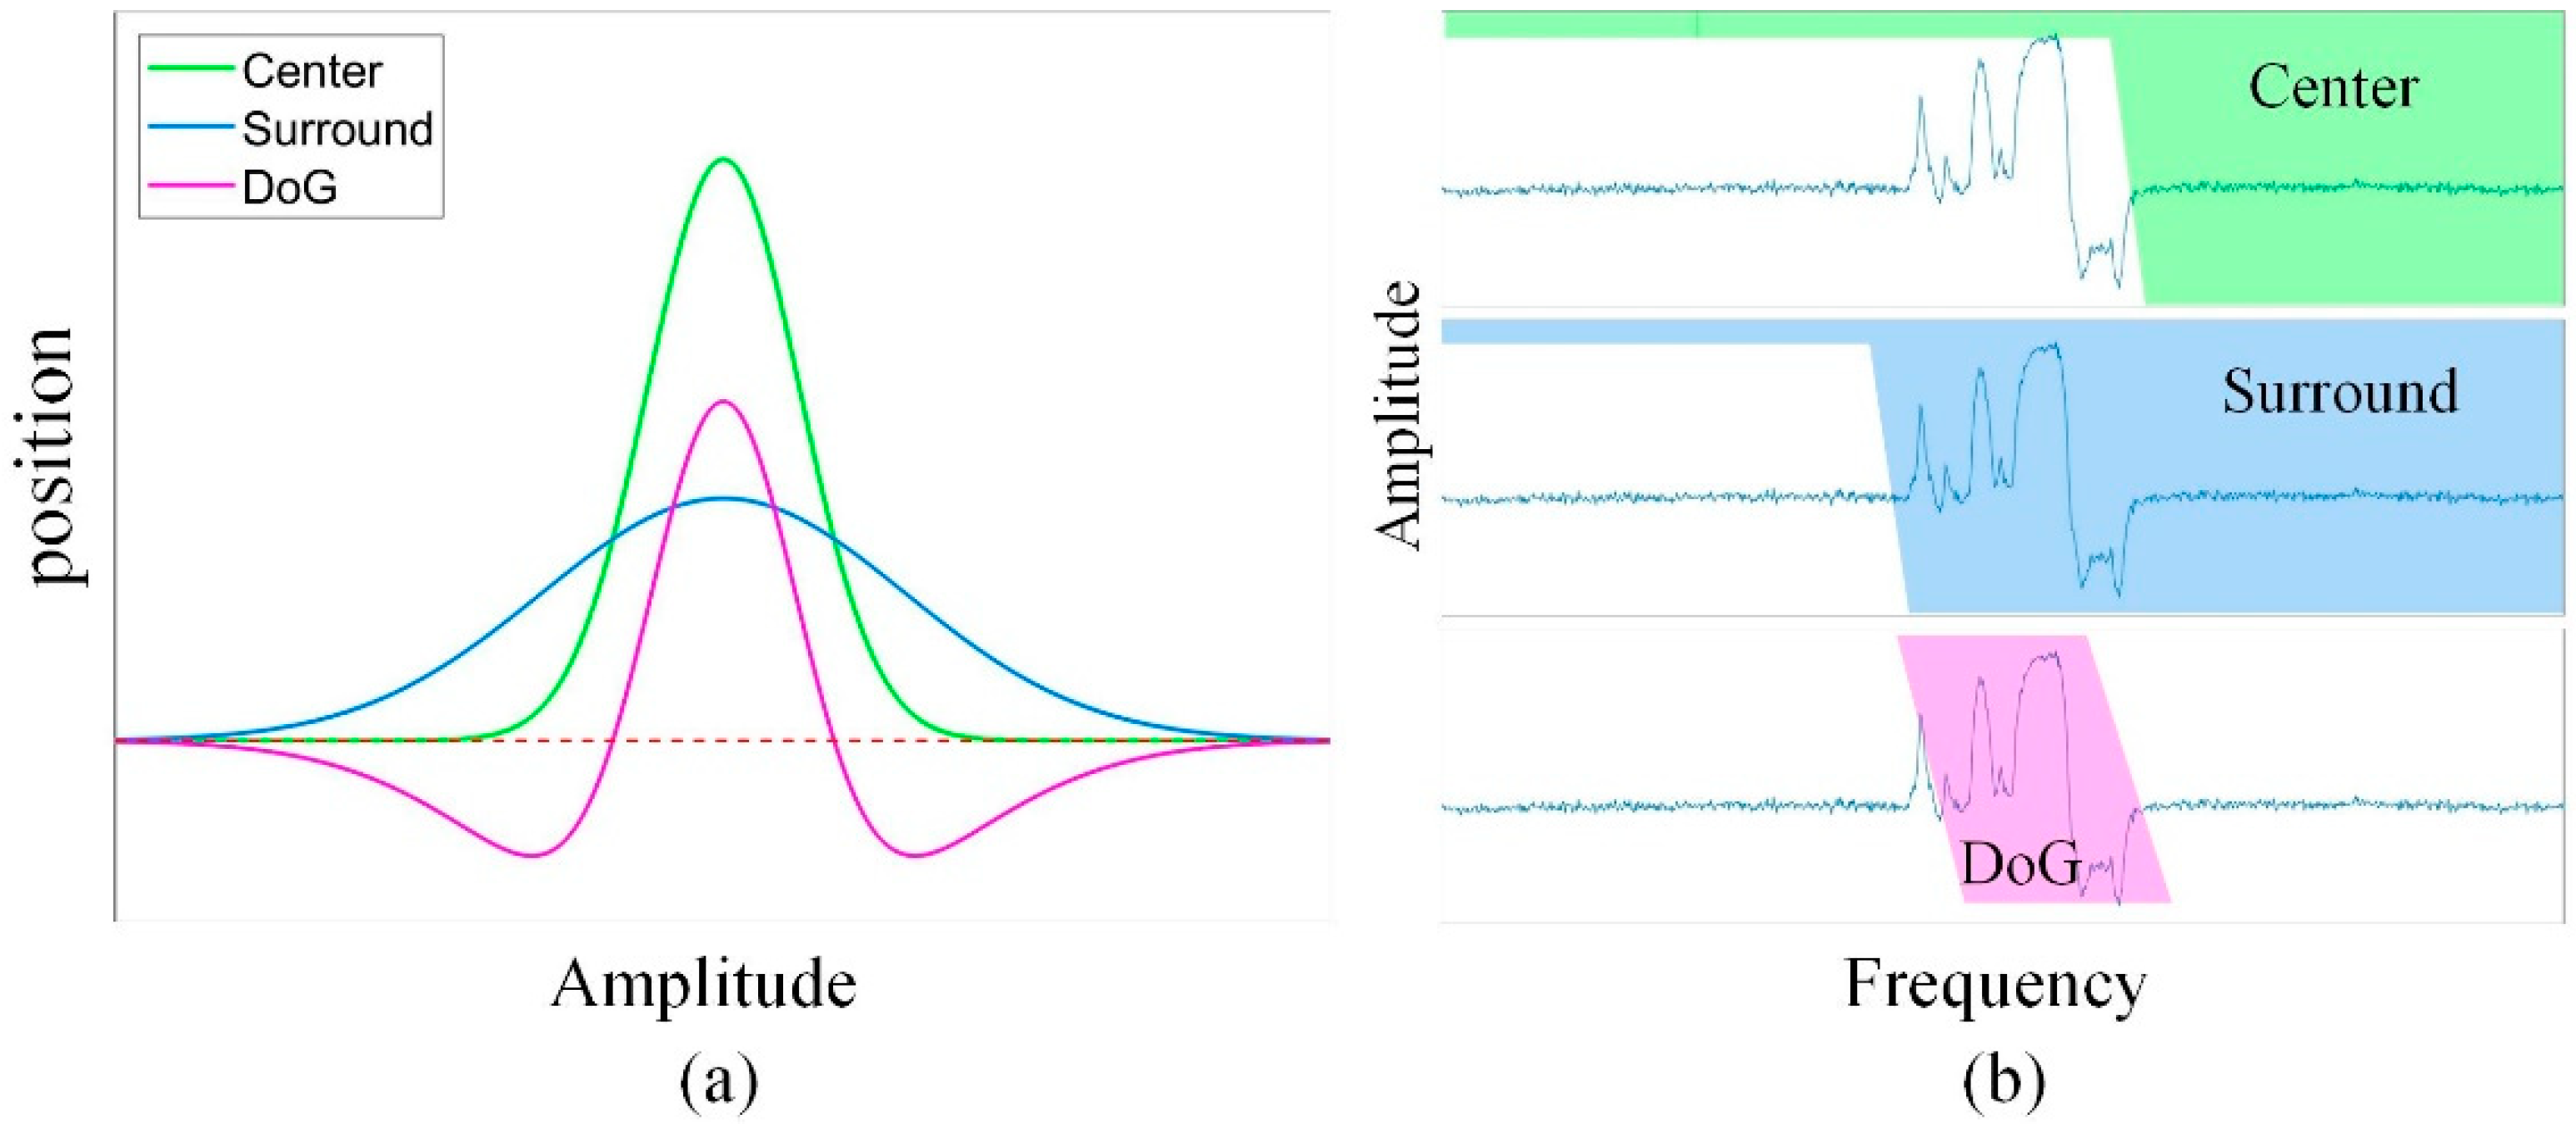
2.1. Difference of Gaussian Filter

The DoG filter has been widely used in computer vision tasks as an edge detector [20,21], and the DoG filter can be explicitly formulated by:
D o G ( i , j , σ 1 , σ 2 ) = 1 2 π σ 1 2 e ( i 2 + j 2 ) / 2 σ 1 2 1 2 π σ 2 2 e ( i 2 + j 2 ) / 2 σ 2 2 ,
where ( i , j ) denotes the pixel coordinates in the image; σ 1 and σ 2 represent the standard deviations of the Gaussian filter. In the case of σ 2 / σ 1 = 1.6 , the DoG filter can be seen as an ideal approximation of the Laplacian of Gaussian (LoG) filter [21], which is one of the most commonly used edge detectors. Ref. [21] demonstrated that the DoG filter can be regarded as a narrow-center Gaussian filter subtracted by a wider surround Gaussian filter, which is equivalent to a band-pass filter consisting of two low-pass filters with different cut-off frequencies, as illustrated in Figure 1.

2.2. Plateau Equalization

The PE [6] is a widely used histogram equalization method that remaps the original histogram by applying a clipping limit to the bins with large grayscale values, which are usually regarded as the background in the image. Previous work [7] demonstrated that the PE robustly performs in IR image histogram equalization and remapping. Let H and C T H represent the histogram of the input image and the clipping threshold, respectively, and let the variable m denote the grayscale distributed from 0 to ( L 1 ) ; then, the clipped histogram can be formulated by:
H c ( m ) = { C T H ,   H c ( m ) > C T H H ( m ) ,   others .
The cumulative distribution function (CDF) based on the clipped histogram can be expressed as follows:
C D F ( m ) = { H c ( 0 ) N , m = 0 n = 0 m H c ( n ) N , 0 < m L 1 ,
where N represents the total number of pixels. The CDF value ranges from 0 to 1, and the output grayscale after remapping can be calculated by the following formula:
I P E _ o u t ( i , j ) = C D F ( I P E _ i n ( i , j ) ) × ( L 1 ) ,
where ( i , j ) denotes the pixel coordinates; L denotes the grayscale range of the output image; and I P E _ i n and I P E _ o u t represent the input and output images of the PE processing, respectively. The proportion of grayscales dominated by detail information significantly increases due to the reshaped histogram, which means that the details account for a more dynamic range. Previous work [7] demonstrated that the PE works well in simultaneously enhancing the dynamic range and preserving the gradient distribution.

3. Principle of the Proposed Method

In general, edges in images are defined by significant intensity changes within a spatial neighborhood and high local contrast. Enhancement processing further increases the visual distinctiveness of these locations. The DoG filter was demonstrated to extract edge lines with high quality without post-processing, particularly when synthesizing line drawings and cartoons [21]. Given that the key principles of image detail enhancement are edge sharpness and dynamic range improvement, and being inspired by previous conclusions [7,21], we designed a fast and robust method for SWIR image detail enhancement. The framework of our proposed method is illustrated in Figure 2. We efficiently and accurately extracted the edge (detail layer) by using the DoG filter, and assigned a higher weight before fusion, before finally remapping the fused image by performing plateau equalization. It should be noted that our primary aim was to provide an FPGA implementation strategy; for the convenience of readers, we introduce the enhancement method in detail, which was the main content of our previous work [19].
Note that the input image at the enhancement stage was processed by nonuniformity correction and defective pixels correction. The image enhancement procedure is fairly simple, and we illustrate how to enhance image details by the DoG filter in the following sections.

3.1. Enhancement via Fast Edge Extraction

The key parameters of the DoG operator are the standard deviation of the two Gaussian functions and the window size, both of which significantly influence detail extraction performance. Because the DoG filter can be regarded as an approximation of the LoG filter in the case of σ 2 / σ 1 = 1.6 , the LoG filter has the highest response on a blob-like target with a size of 2 2 σ [22], which also works for edge extractions with that size. Given the aforementioned issues, the equations set for the definition of the two standard deviations are established as follows:
{ s = ( 2 2 σ 1 + 2 2 σ 2 ) / 2 σ 2 / σ 1 = 1.6 .
The size of the edge in SWIR images generally ranges from 3 to 6 pixels. We take the value of s = 4 for demonstration, and compare the performance of different edge and operator window sizes in the next section. The solution to Equation (5) is σ 1 = 1.088 and σ 2 = 1.741 when s = 4. Taking the window size of 7 as an example, it is easy to formulate two Gaussian filters with a window size of 7 and standard deviations with value of σ 1 and σ 2 . Consequently, the DoG operator can be simply formulated according to Equation (1). The explicit matrix of the DoG operator is given as follows:
F D o G = [ 0.0029 0.0061 0.0090 0.0099 0.0090 0.0061 0.0029 0.0061 0.0107 0.0088 0.0047 0.0088 0.0107 0.0061 0.0090 0.0088 0.0168 0.0398 0.0168 0.0088 0.0090 0.0099 0.0047 0.0398 0.0775 0.0398 0.0047 0.0099 0.0090 0.0088 0.0168 0.0398 0.0168 0.0088 0.0090 0.0061 0.0107 0.0088 0.0047 0.0088 0.0107 0.0061 0.0029 0.0061 0.0090 0.0099 0.0090 0.0061 0.0029 ] .

3.2. Equalization and Remapping

According to the framework illustrated in Figure 2, detail information can be obtained by applying the DoG operator to the input image, and sharpened by gain assignment and refusion with the input image. Give that IR image detail sharpening parameters in applications, including photoelectric pods, are generally divided into several different grades, we set the customer-selected gain coefficient to 6 grades in our applications, which starts at 4 and increases with a step size of 4. We also found that 16 robustly works as a default gain coefficient. Letting I i n and I d represent the input image and the DoG filtering result, the sharpened image is calculated by:
I s = I i n + k × I d .
where k is a gain coefficient. The difference between the sharpened image I s and the input image I i n is the edge information, and further histogram equalization and dynamic range compression are still required for improve the resulting visual effects. More importantly, the sharpened image may have pixels with negative grayscale due to the DoG filter processing. To facilitate equalization calculation, we propose processing the sharpened image as follows:
I s = R ( I s min ( I s ) ) .
where the operatorand min and R represent the minimum gray value calculation and rounding operation, respectively. We then perform plateau equalization, which was described in Equations (2) and (3), with a clipping threshold C T H of 0.01% of the total pixel number because it performs well in most experiments. The output grayscale L is typically set to 256, which is consistent with the grayscale range of most commonly used monitors.
A demonstration of the input image, detail image using DoG filtering, sharpened image, and the output image after equalization and reprojection are shown in Figure 3. The edge in the sharpened image is sharper than in the input image due to the DoG filter efficiently extracting edge information, and the dynamic range is substantially improved by PE processing.

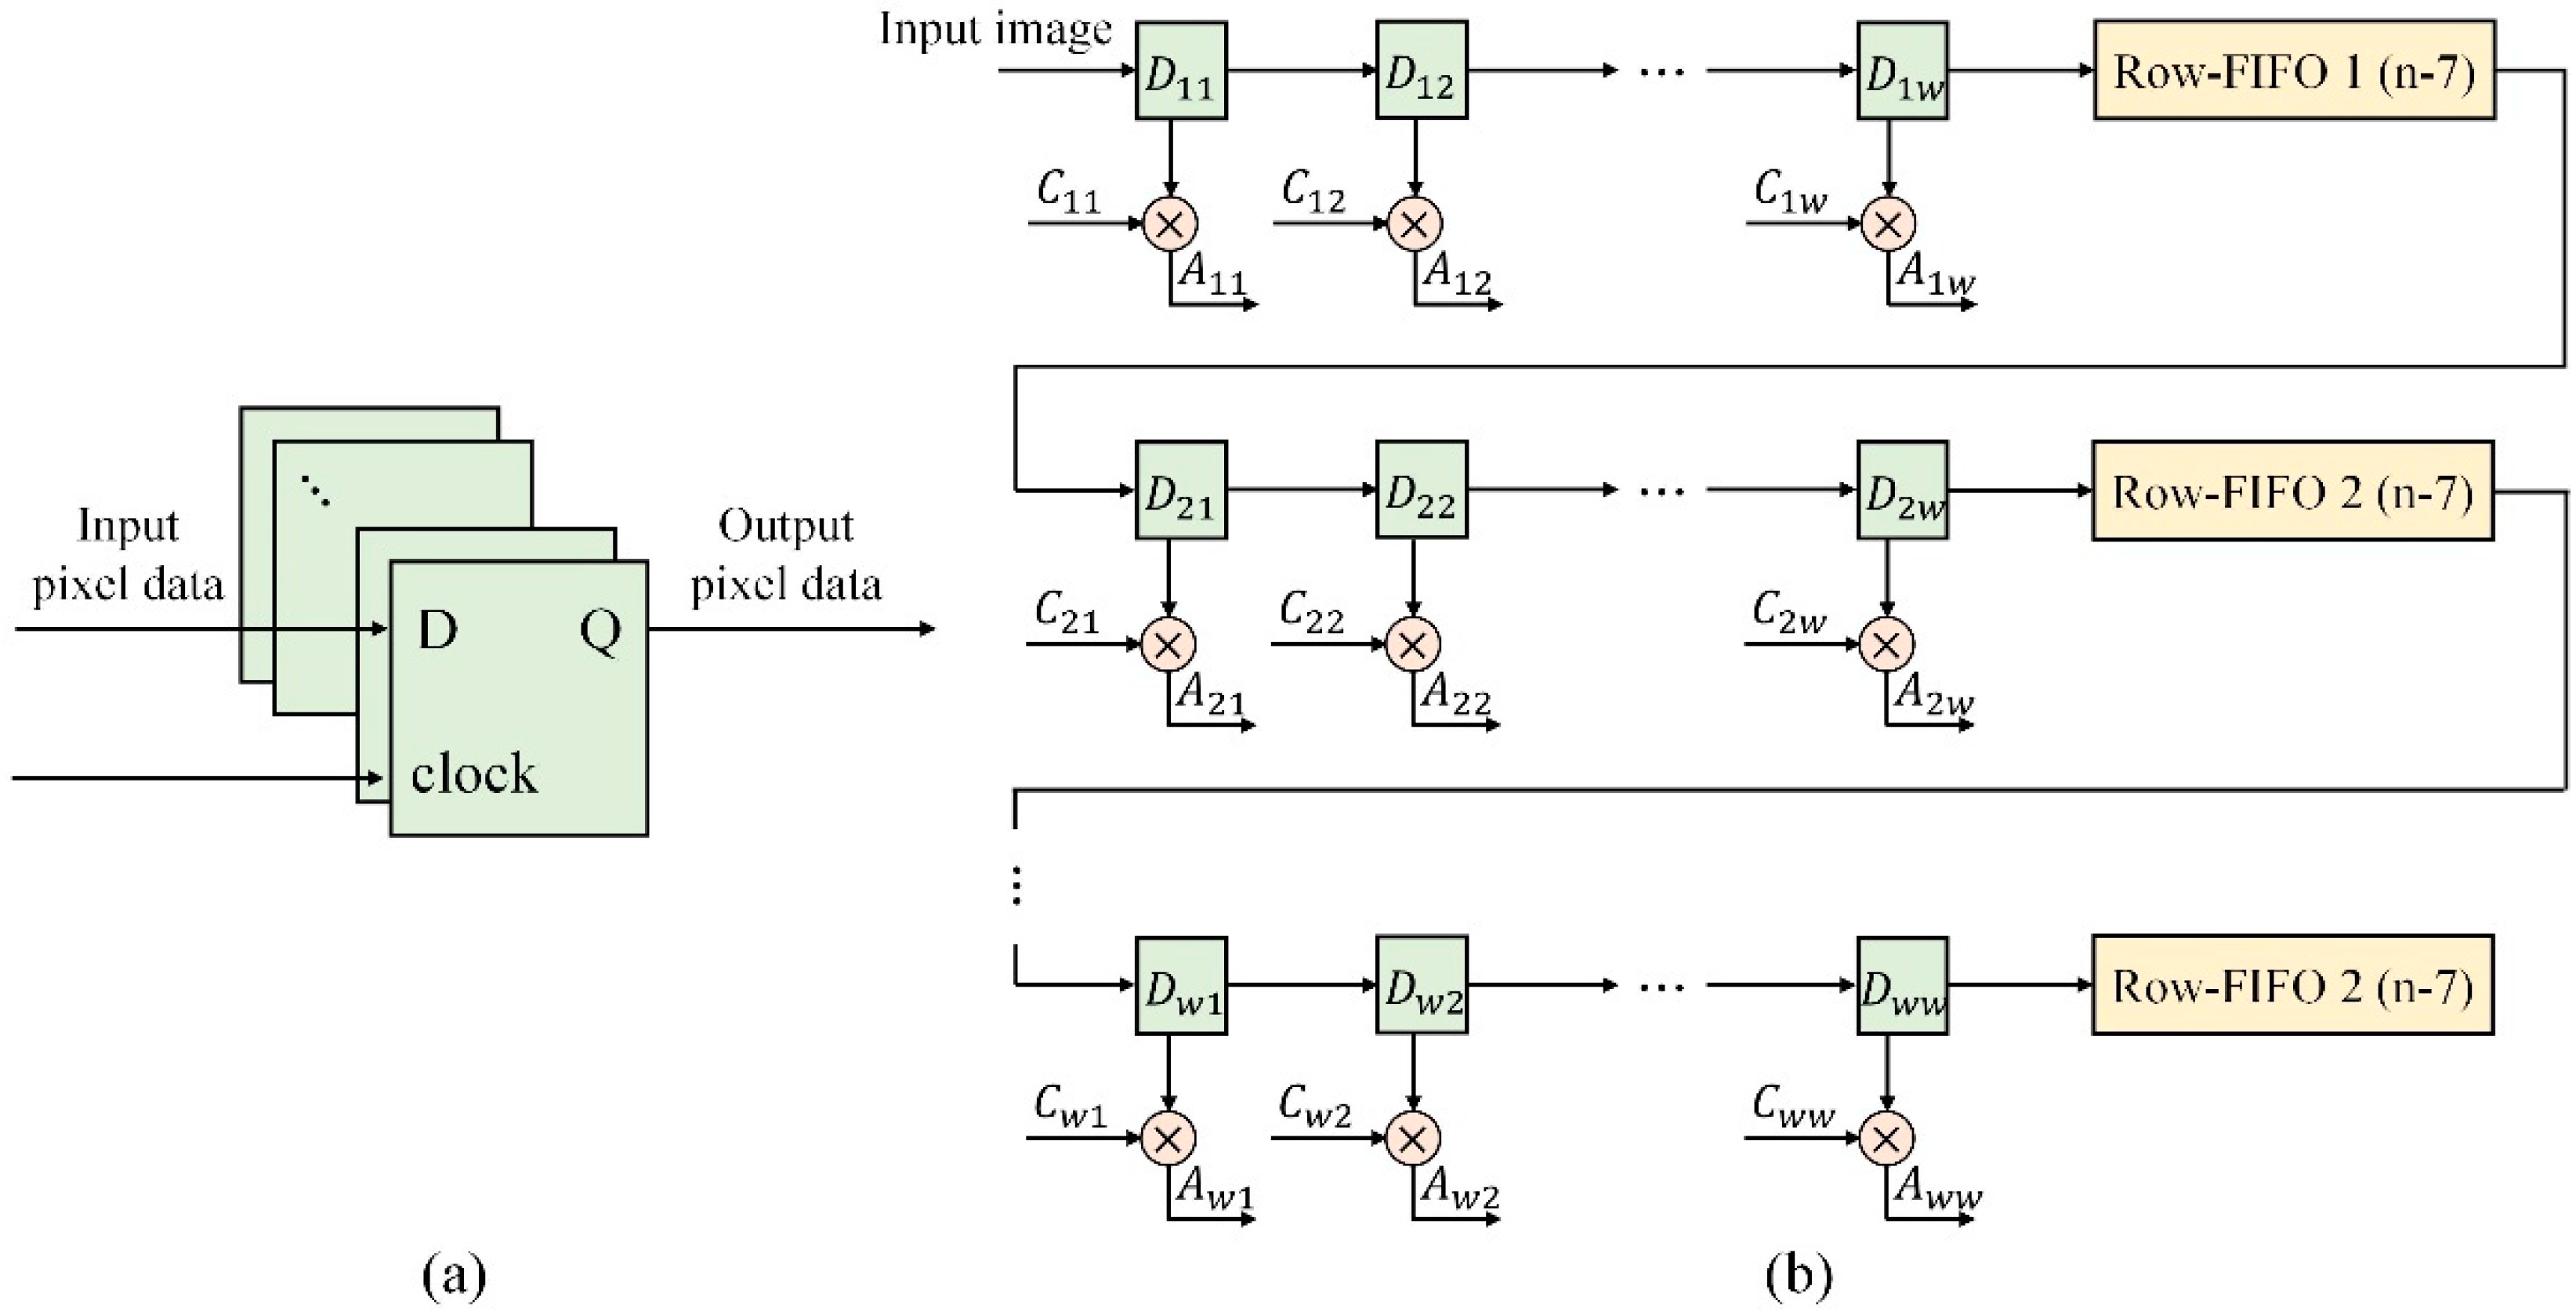
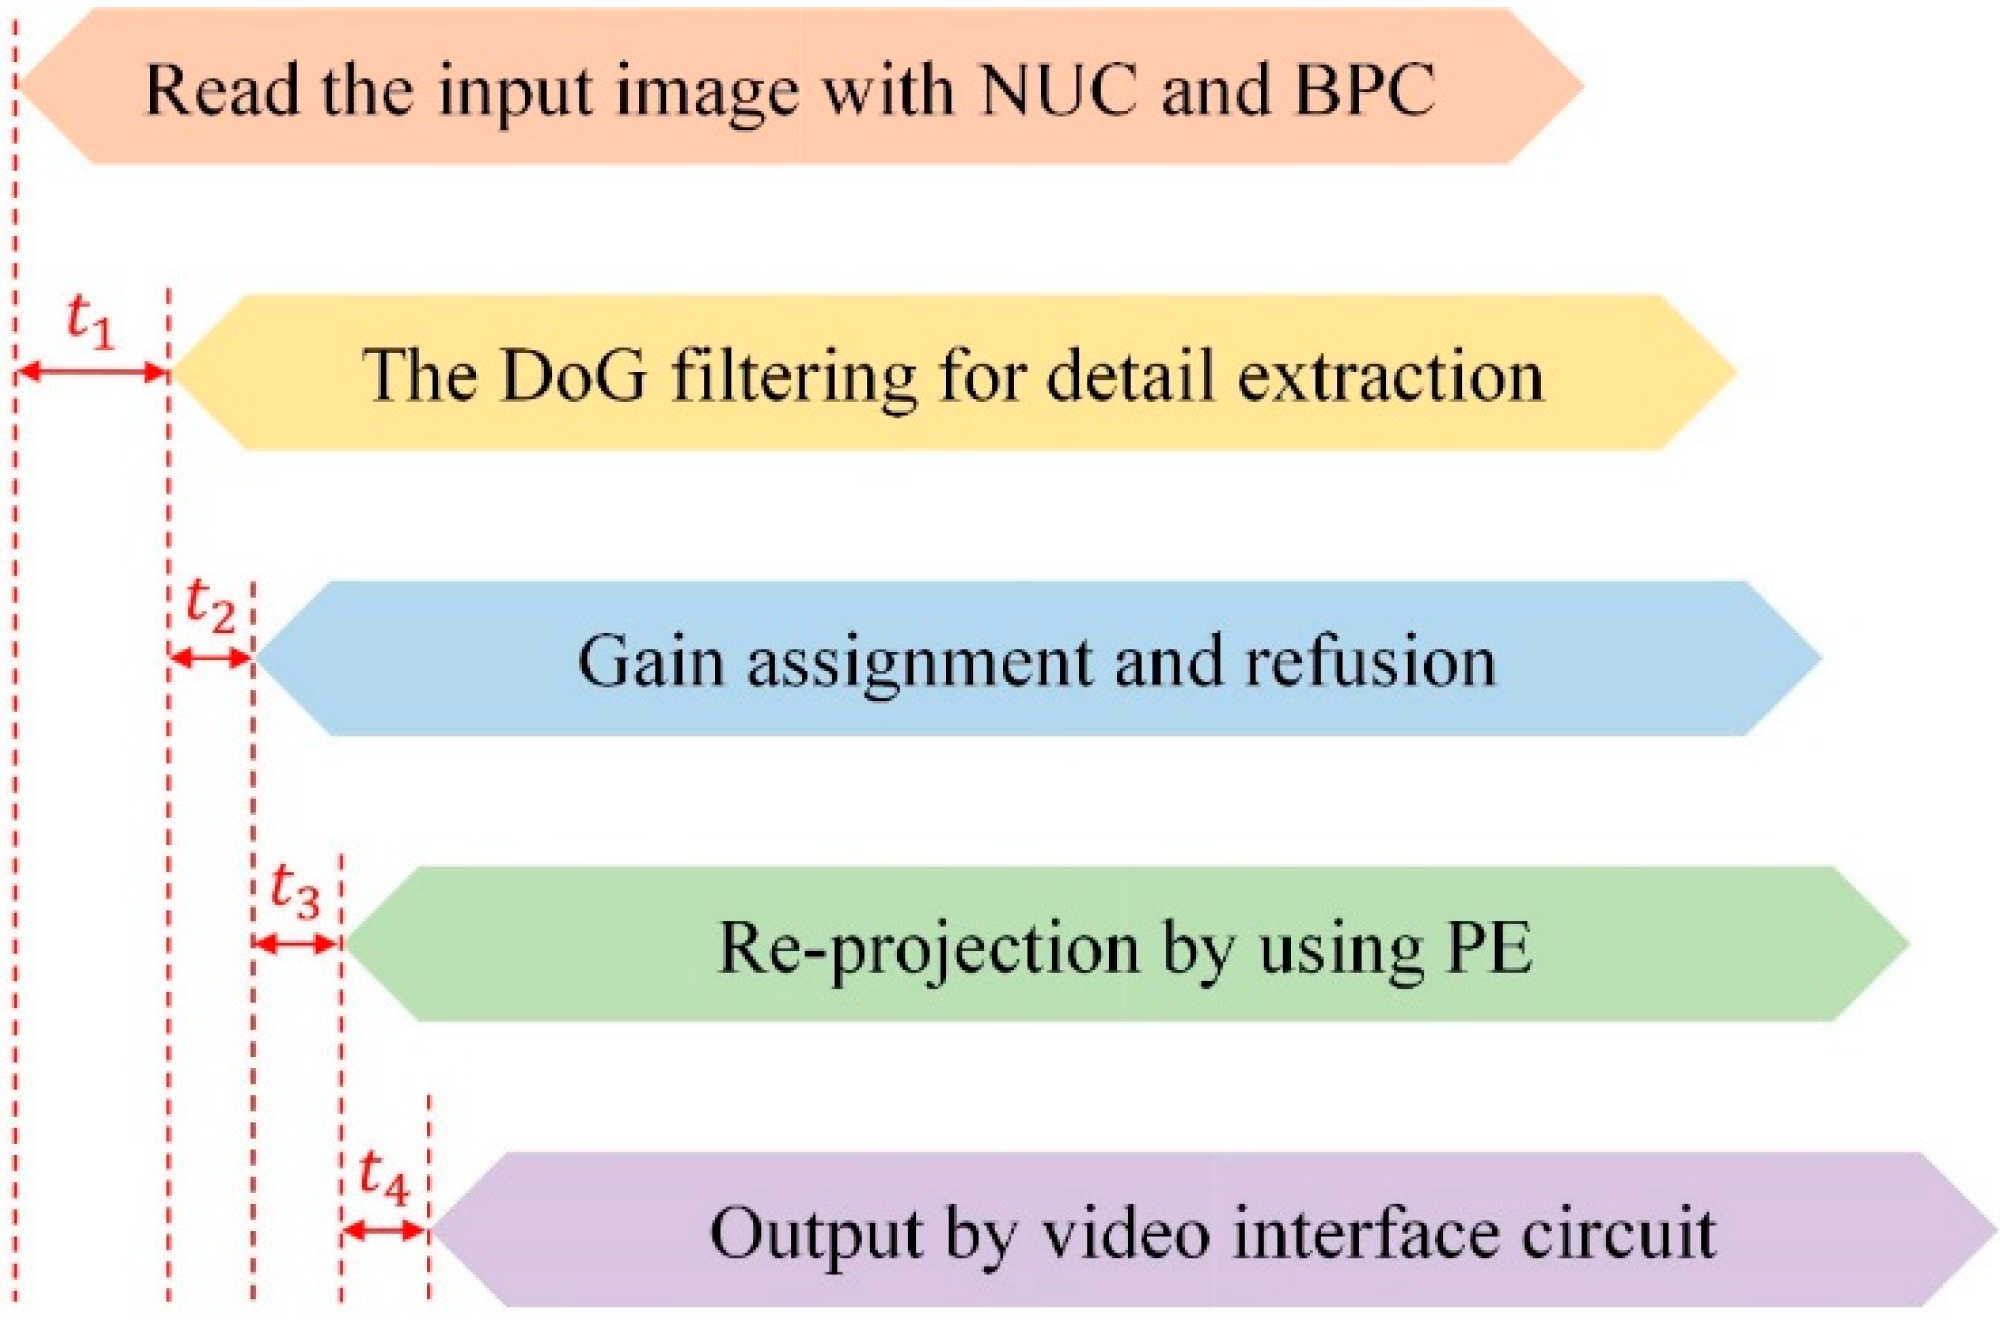
3.3. Guidance for Implementation on FPGA

The image processing in IR imaging systems is basically performed on field-programmable gate arrays (FPGAs), which have difficulty in processing floating-point numbers. To facilitate implementation on FPGAs, we multiply the parameters in Equation (6) by the integer 1024, and generate a new filter F D o G by performing the rounding operation:
F D o G = [ 3 6 9 10 9 6 3 6 11 9 5 9 11 6 9 9 17 41 17 9 9 10 5 41 79 41 5 10 9 9 17 41 17 9 9 6 11 9 5 9 11 6 3 6 9 10 9 6 3 ] .
We first perform the filter illustrated in Equation (9) to extract details, and then divide the result by 1024 (1024 times can be simply calculated by 10-bit shifting left on FPGAs) for subsequent refusion processing. Assume that the number of rows and columns of the input image are m and n, respectively, and let w represent the size of the filter. The architecture of the filter implemented on the FPGA is shown in Figure 4. The coefficient C i j is the element in the filter F D o G , and A i j represents the result obtained by traversing all of the flip-flops and multipliers for each pixel. The pixel DoG filtering result is calculated by Equation (10). The gray value of all pixels after filtering does not drastically change due to the processing architecture in Figure 4.
I d ( i , j ) = x = 1 w y = 1 w ( A x y ) s u m ( F D o G )
Notably, IR image processing generally requires synchronous dynamic random access memory (SDRAM) with a data width of 32 bits to facilitate multiplication calculations. For single-frame image processing, which is insensitive to running time, we sequentially perform NUC, BPC, detail extraction, refusion, and PE processing. For video processing, which requires high real-time performance, we apply pipeline architecture to achieve a high frame rate, as shown in Figure 5. Let w represent the window size of the DoG operator and t 1 denote the delay of the DoG filtering for detail extraction processing. t 1 equals ( w 1 ) / 2 due to the symmetric padding of the input image. because the default gain factor is set to 16, pixel-wise refusion can be simply calculated by applying 4-bit left shift to the detail layer and performing an addition operation. We adopt the CDF of the previous frame for PE processing because the difference between two consecutive frames in high-frame-rate videos is slight. Basing the CDF calculation on the current frame results in a delay of one frame, which is unacceptable for some high-performance systems used for tracking tasks.
Image enhancement using the architecture in Figure 5 can achieve extremely high frame rates at a low computational cost and without any limitation on frame rate (frame rate is not limited by the enhancement method), so is suitable for embedded systems. More importantly, the framework in Figure 5 can be further accelerated by parallel computation including dividing the image into several blocks.

4. Experimental Results Comparison and Discussions

To evaluate the enhancement performance of the proposed method, we applied it to HD SWIR images (including the image shown in Figure 3a) that were acquired by a self-developed SWIR camera with a resolution of 1280 × 1024 and a focal length of 600 mm, which is shown in Figure 6. The brief characteristics of the test images are described in Table 1; the original test images were blurry due to the atmospheric turbulence and point spread function (PSF) of the optical lens.
Because there is no universal objective criterion for IR image quality assessment, and several blind image quality assessment metrics perform inconsistently on IR images [3], we performed a comparison using the average gradient (AG), which is widely used as an indicator for the evaluation of the edge detail contrast and sharpness characteristics of an image [4]. The AG can be calculated as follows:
A G = 1 ( R 1 ) × ( C 1 ) × x = 1 R 1 y = 1 C 1 ( I ( x , y ) x ) 2 + ( I ( x , y ) y ) 2 2
where I ( x , y ) is the pixel value of the image; R and C denote the number of rows and columns of the image, respectively; and I ( x , y ) x and I ( x , y ) y represent the horizontal and vertical gradients, respectively.

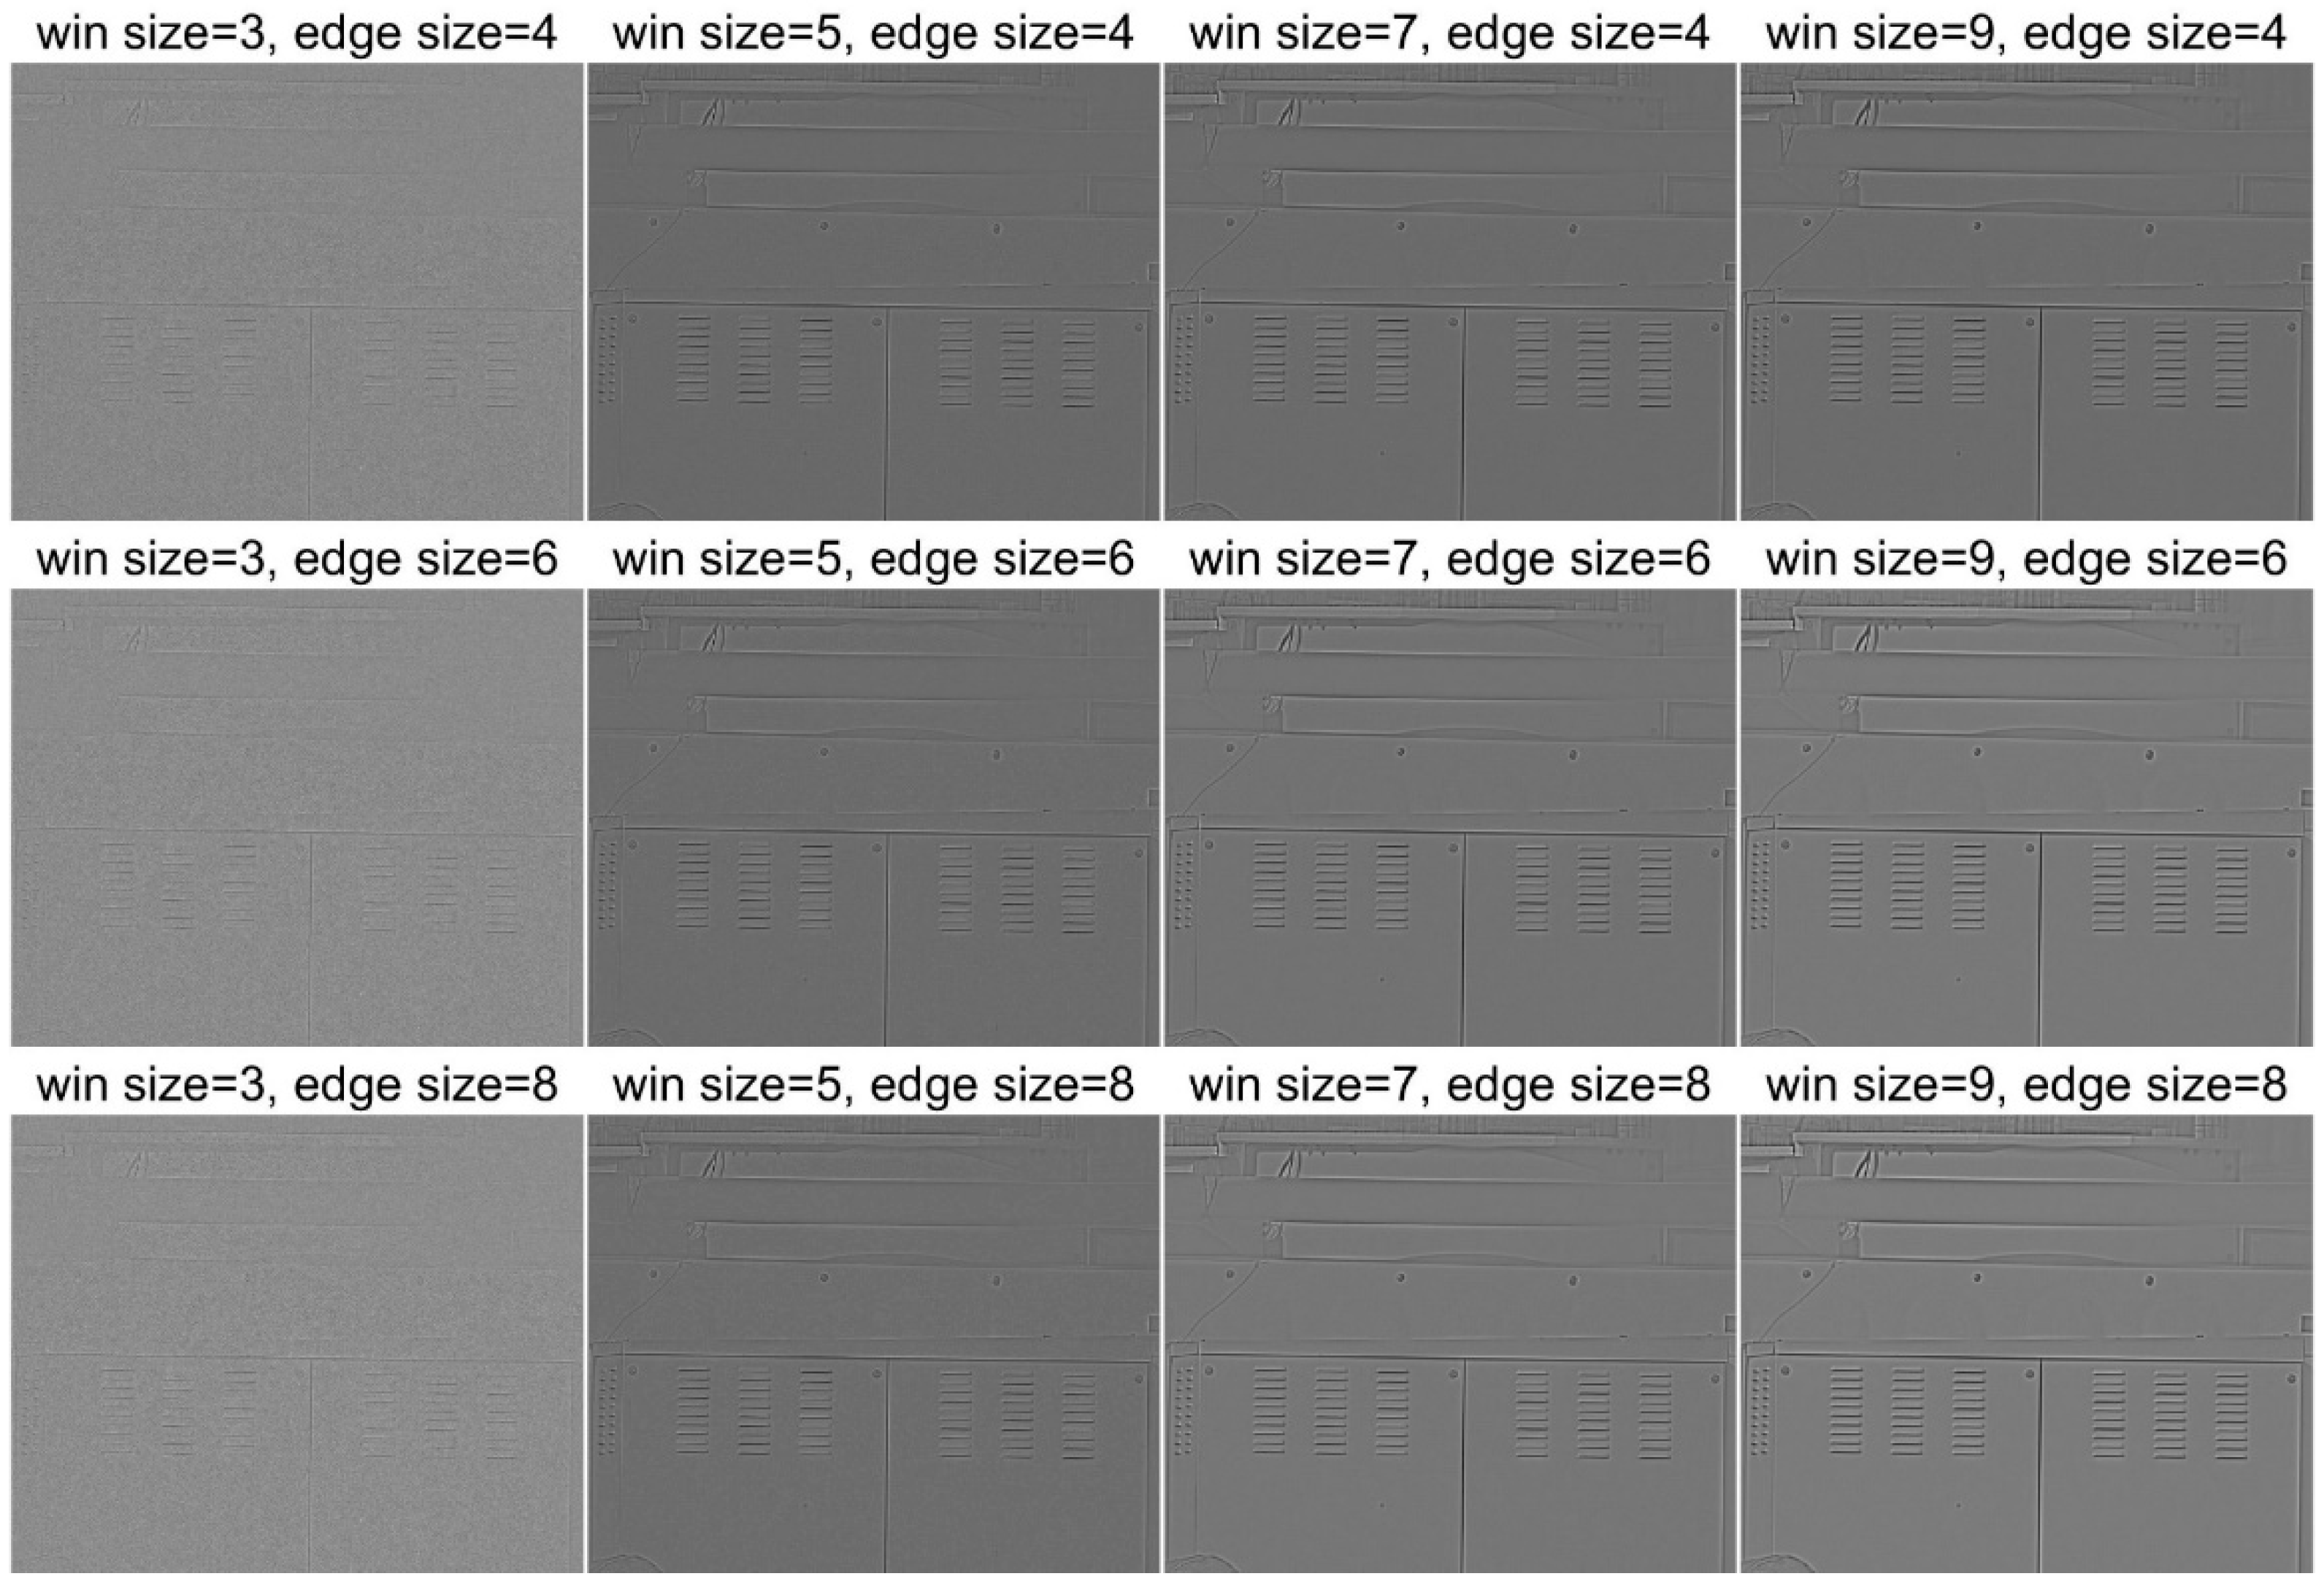
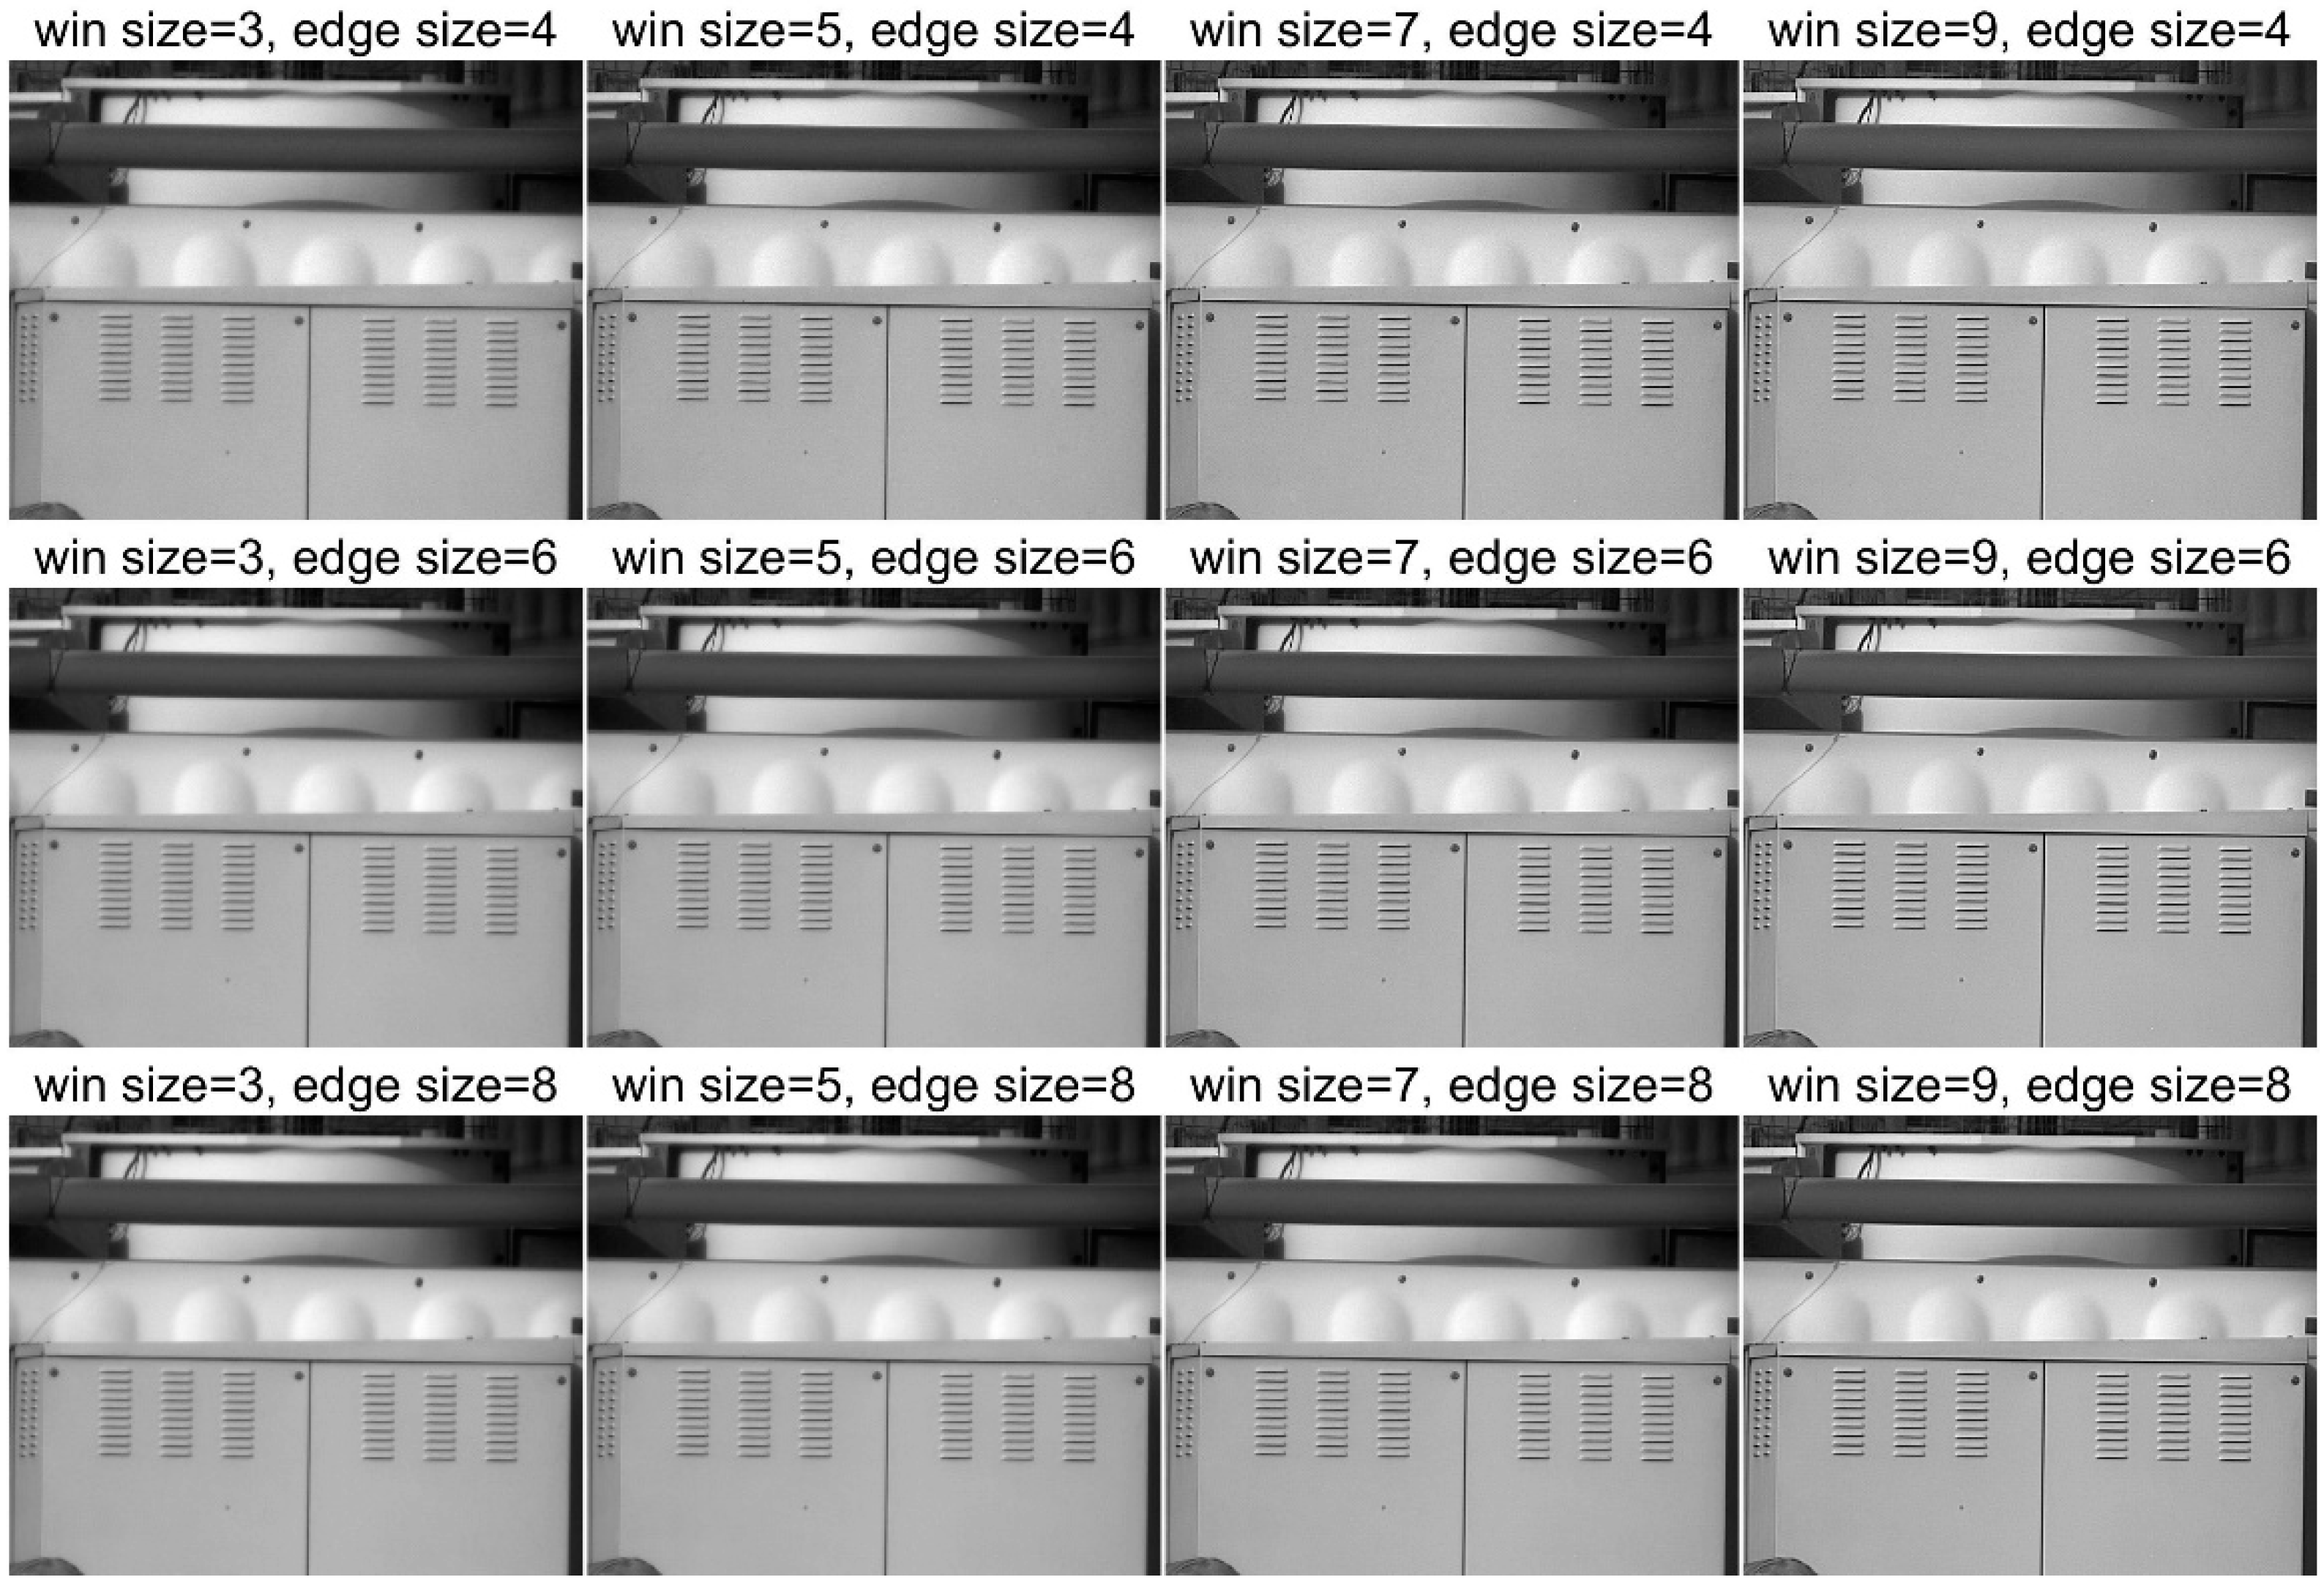
4.1. Performance Comparison of Different Parameters

To compare the edge extraction performance of different DoG filter parameters, we compared the filtering results obtained using different window and edge size (defined by the two standard deviations in Equation (5)), with the gain factor and PE clipping threshold fixed to 16 and 0.01%, respectively. The DoG filtering result and the final enhancement result produced by the proposed method on test image 1 are shown in Figure 7 and Figure 8, respectively.
Figure 7 and Figure 8 demonstrate that the window size of the DoG operator has a significantly stronger impact on image sharpness than the standard deviation values, while the extraction result did not show a notable difference among different preset edge sizes. As the operator with a small window size is sensitive to noise, as shown in Figure 7, and a large window size may cause a wider edge transition area and have negative impacts on image quality, we set the window size to seven in the subsequent experiments. The edge scale, which defines the standard deviation, was set to four because it robustly worked in most of our experiments.

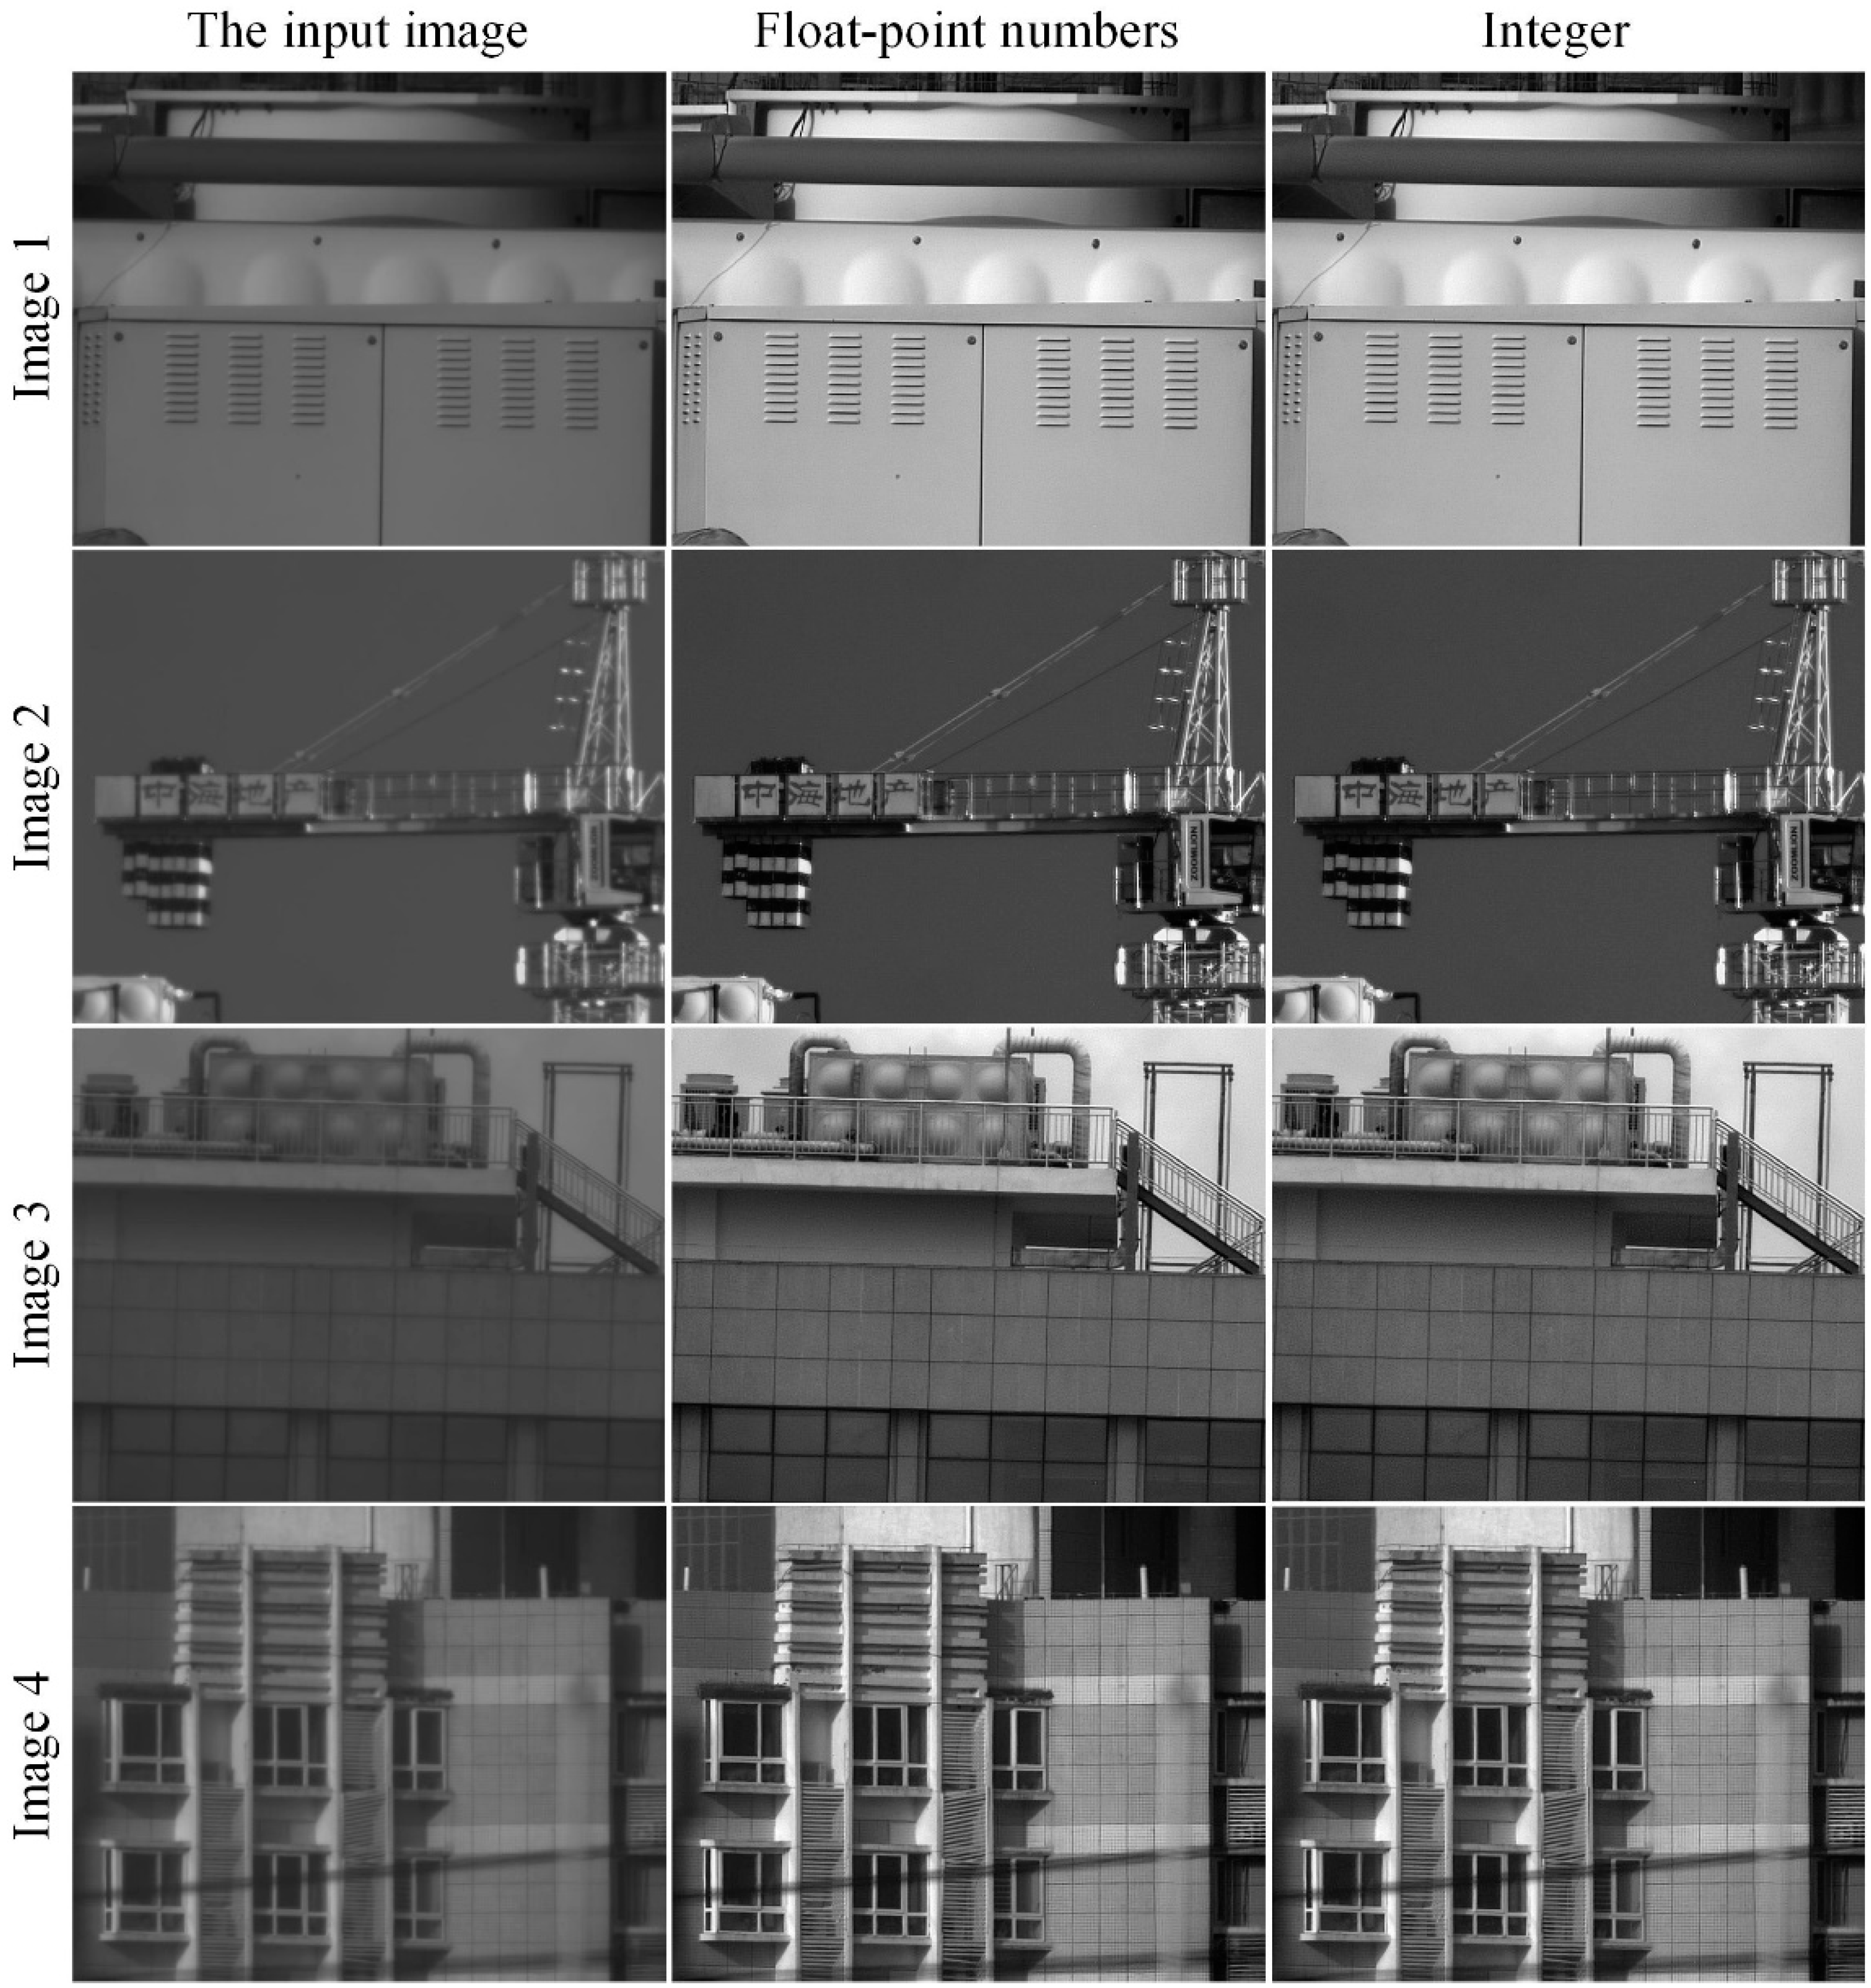
4.2. Performance between CPU and FPGA

To evaluate the implementation performance on an FPGA, we applied the DoG filter to the test images with floating-point numbers and integers, which are shown in Equations (6) and (7), respectively. A comparison between the enhanced results on the test images by using CPU (floating-point numbers) and FPGA (integers) is shown in Figure 9. It can be seen that the difference is slight, proving that the proposed method does not suffer from serious performance degradation during implementation on an embedded system such as an FPGA. The average gradient values of different filtering parameters are provided in Table 2, which further illustrates that the difference is slight, meaning the proposed method has application potential.
To further evaluate the resource requirement of the proposed method, we implemented our method on Xilinx Artix-7 FPGA (XC7A100T-2SBG484I); and the hardware use (with a clock frequency of 108 MHz), including the lookup table (LUT), slices, flip-flops (FFs), block random access memory (BRAM), and digital signal processing (DSP) slices, is shown in Table 3.

4.3. Performance among Different Methods

For the enhancement performance comparison among the proposed and other methods, we performed classic decomposition-based methods, including BF&DDE [9], GF&DDE [12], and FGF&PE [7], as well as PE [6] as comparison methods, to demonstrate the effect of detail extraction and fusion on image quality.
The enhancement results on Image 1 are shown in Figure 10. The input image was acquired in low-light conditions, and all of the comparison methods significantly improved the dynamic range. The proposed method better enhanced detail at the cost of slightly higher noise. The result processed by BF&DDE had obvious artifacts, and the PE, GF&DDE, and FGF&PE produced limited detail enhancement. The proposed method achieved a good balance between detail enhancement and noise, with a better visual effect.
Image 2 was captured under strong sunlight. The distance of the tower crane was around 4.5 km, and the original image was obviously blurry due to the point spread function of the optical lens and atmospheric turbulence. The results in Figure 11 demonstrate that the dynamic range improvement performance of the five methods were not significantly different, but our method produced a significant sharpening effect on edges, especially in areas with fonts (zoom in on Figure 11 for details), being superior to the methods used for comparison by a large margin.
Image 3 was acquired with a short integration time, and the signal-to-noise ratio (SNR) of the input image is relatively low. The proposed method yielded the best performance at an acceptable noise level, and its improvement in detail was significantly higher than that produced by all comparison methods, as shown in Figure 12.
Image 4 was captured under strong sunlight, and there were distinct bright and dark areas in the image. The results in Figure 13 demonstrate that our method had a promising enhancement performance on dense edges in both bright and dark areas.
The average gradient results of different methods are given in Table 4. The decomposition-based methods typically produced better enhancement performance than PE, while the proposed method yielded the best AG result, with a mean value much higher than that of the other methods. More importantly, the enhancement performance provided by using the DoG filter before PE (the proposed method) was significantly better than that achieved by using PE only, with clear improvements in both visual effect and average gradient.
We performed different methods by running them on a laptop with Apple M1 Pro and 16 GB RAM for a fair comparison, and the mean values of running time were obtained by running all the methods 10 times. The results shown in Table 5 demonstrate that the proposed method ran quickly, with the running time being slightly longer than that of PE, but significantly less than those of the other decomposition-based methods. Notably, we performed our method in serial mode, which takes much longer than pipelined architectures. Although the frame rate of the proposed method is around 50 fps, we could accelerate it according to the operational guidance of the pipelined architecture in Section 3.3, which can be simply applied in FPGA-based imaging systems. The frame rate is only limited by the output data rate of the IR detector and bandwidth of the imaging system.

4.4. Limitations

Although our method is simple, efficient, and practical, it has some drawbacks, which can be the focus of future research. First, DoG filters are susceptible to noise, especially flickering noise caused by blinking pixels. The current InGaAs SWIR detectors have fewer blinking pixels, but the proposed method cannot be directly performed for MWIR and LWIR image enhancement because he MCT-based detectors suffer from blinking pixels. Second, the dynamic range reprojection performance of PE can be further optimized and improved in the future.

5. Conclusions

In this paper, we proposed a fast and simple method to enhance SWIR images. The experimental results demonstrated that the proposed method yielded the best performance with a low computational cost, being superior to the methods used for comparison by a large margin. More importantly, we demonstrated that the proposed method can be simply accelerated by applying a pipeline architecture.
Although the proposed method works well in SWIR image processing, it has limitations in terms of the MWIR and LWIR image processing. In addition, the proposed method is sensitive to flickering noise and defective pixel clusters. Potential future directions include further improving the performance by accurately extracting detail information and suppressing the flickering noise simultaneously.

Author Contributions

Formal analysis, Z.X.; funding acquisition, H.W.; methodology, S.D.; project administration, H.W.; software, S.D.; validation, R.L.; writing—original draft, S.D.; writing—review and editing, Y.C. All authors have read and agreed to the published version of the manuscript.

Funding

This work was partially supported by the Aeronautic Science Foundation of China (Grant No. ASFC-2020Z071052001, Grant No. 202055052003).

Data Availability Statement

The data underlying the results presented in this paper are not publicly available at this time but may be obtained from the authors upon reasonable request.

Conflicts of Interest

The authors declare no conflict of interest.

References

  1. Park, S.; Choi, Y. Applications of unmanned aerial vehicles in mining from exploration to reclamation: A review. Minerals 2020, 10, 663. [Google Scholar] [CrossRef]
  2. Chen, Y.; Kang, J.U.; Zhang, G.; Cao, J.; Xie, Q.; Kwan, C. High-performance concealment of defective pixel clusters in infrared imagers. Appl. Opt. 2020, 59, 4081–4090. [Google Scholar] [CrossRef] [PubMed]
  3. Zhou, Y.; Zhu, Y.; Zeng, B.; Hu, J.; Ouyang, H.; Li, Z. Review of high dynamic range infrared image enhancement algorithms. Laser Technol. 2018, 42, 718–726. [Google Scholar]
  4. Zhang, F.; Xie, W.; Ma, G.; Qin, Q. High dynamic range compression and detail enhancement of infrared images in the gradient domain. Infrared Phys. Technol. 2014, 67, 441–454. [Google Scholar] [CrossRef]
  5. Zuiderveld, K. Contrast Limited Adaptive Histogram Equalization; Academic Press Inc.: Cambridge, MA, USA, 1994. [Google Scholar]
  6. Vickers, V.E. Plateau equalization algorithm for real-time display of high-quality infrared imagery. Opt. Eng. 1996, 35, 1921. [Google Scholar] [CrossRef]
  7. Chen, Y.; Kang, J.U.; Zhang, G.; Cao, J.; Xie, Q.; Kwan, C. Real-time infrared image detail enhancement based on fast guided image filter and plateau equalization. Appl. Opt. 2020, 59, 6407–6416. [Google Scholar] [CrossRef] [PubMed]
  8. Branchitta, F. New technique for the visualization of high dynamic range infrared images. Opt. Eng. 2009, 48, 096401. [Google Scholar] [CrossRef]
  9. Zuo, C.; Chen, Q.; Liu, N.; Ren, J.; Sui, X. Display and detail enhancement for high-dynamic-range infrared images. Opt. Eng. 2011, 50, 127401. [Google Scholar] [CrossRef]
  10. Tomasi, C.; Manduchi, R. Bilateral filtering for gray and color images. In Proceedings of the Sixth International Conference on Computer Vision (IEEE Cat. No.98CH36271), Bombay, India, 7 January 1998; pp. 839–846. [Google Scholar]
  11. Paris, S.; Durand, F. A fast approximation of the bilateral filter using a signal processing approach. Int. J. Comput. Vis. 2009, 81, 24–52. [Google Scholar] [CrossRef] [Green Version]
  12. Liu, N.; Zhao, D. Detail enhancement for high-dynamic-range infrared images based on guided image filter. Infrared Phys. Technol. 2014, 67, 138–147. [Google Scholar] [CrossRef]
  13. He, K.; Sun, J.; Tang, X. Guided image filtering. IEEE Trans. Pattern Anal. Mach. Intell. 2013, 35, 1397–1409. [Google Scholar] [CrossRef] [PubMed]
  14. He, K.; Sun, J. Fast Guided Filter. arXiv 2015, arXiv:1505.00996. [Google Scholar] [CrossRef]
  15. R.P. Ltd. High Performance SWIR Imaging Cameras; 2015; Available online: https://www.raptorphotonics.com/wp-content/uploads/2015/10/Ninox-White-Paper-Final.pdf (accessed on 9 May 2022).
  16. Harris, L.; Llewellyn, G.M.; Holma, H.; Warren, M.A.; Clewley, D. Characterization of Unstable Blinking Pixels in the AisaOWL Thermal Hyperspectral Imager. IEEE Trans. Geosci. Remote Sens. 2018, 56, 1695–1703. [Google Scholar] [CrossRef]
  17. Ouyang, H.; Li, Z.; Zhou, Y.; Wang, S.; Zhu, X.; Zeng, B.; Zhao, D.; Hu, J. Review of Dynamic Range Compression Algorithms for Infrared Images. Infrared Technol. 2021, 43, 208–217. [Google Scholar]
  18. Gooch, B.; Reinhard, E.; Gooch, A. Human facial illustrations: Creation and psychophysical evaluation. ACM Trans. Graph. 2004, 23, 27–44. [Google Scholar] [CrossRef]
  19. Chen, Y.; Zhang, H.; Zhao, Z.; Wang, Z.; Wang, H.; Kwan, C. Ultra-fast detail enhancement for a short-wave infrared image. Appl. Opt. 2022, 61, 5112. [Google Scholar] [CrossRef]
  20. Marr, D.; Hildreth, E. Theory of edge detection. Proc. R. Soc. Lond. Ser. B Biol. Sci. R. Soc. 1980, 207, 215–217. [Google Scholar]
  21. HWinnemöller, H.; Kyprianidis, J.E.; Olsen, S.C. XDoG: An eXtended difference-of-Gaussians compendium including advanced image stylization. Comput. Graph. 2012, 36, 740–753. [Google Scholar] [CrossRef] [Green Version]
  22. Kim, S.; Yang, Y.; Lee, J.; Park, Y. Small target detection utilizing robust methods of the human visual system for IRST. J. Infrared Millim. Terahertz Waves 2009, 30, 994–1011. [Google Scholar] [CrossRef]
Figure 1. The illustration of a DoG filter: (a) The operator can be regarded as a narrow-center Gaussian filter subtracted by a wider one; (b) the band-pass filter generated by two low-pass filters with different cut-off frequencies.
Electronics 11 02001 g001
Figure 2. Framework of proposed method.
Electronics 11 02001 g002
Figure 3. Images of different procedures: (a) input image, (b) detail image, (c) sharpened image with gain of 15, and (d) the output image with PE processing.
Electronics 11 02001 g003
Figure 4. Architecture of filter implemented on an FPGA: (a) illustration of the pixel data flip-flops, (b) architecture of filter implemented on an FPGA the green boxes represent the pixel data flip-flops.
Electronics 11 02001 g004
Figure 5. Framework of pipeline architecture on FPGA.
Electronics 11 02001 g005
Figure 6. The SWIR camera used for data acquisition. (a) the SWIR camera, (b) outdoor experiments.
Electronics 11 02001 g006
Figure 7. DoG filtering results with different parameters.
Electronics 11 02001 g007
Figure 8. Enhancement results with different parameters.
Electronics 11 02001 g008
Figure 9. Enhancement performance comparison between CPU and FPGA.
Electronics 11 02001 g009
Figure 10. Enhancement results of Image 1: (a) input image; (b) PE; (c) BF&DDE; (d) GF&DDE; (e) FGF&PE; (f) the proposed method.
Electronics 11 02001 g010
Figure 11. Enhancement results of Image 2: (a) input image; (b) PE; (c) BF&DDE; (d) GF&DDE; (e) FGF&PE; (f) proposed method.
Electronics 11 02001 g011
Figure 12. Enhancement results of Image 3: (a) input image; (b) PE; (c) BF&DDE; (d) GF&DDE; (e) FGF&PE; (f) proposed method.
Electronics 11 02001 g012
Figure 13. Enhancement results of Image 4: (a) input image; (b) PE; (c) BF&DDE; (d) GF&DDE; (e) FGF&PE; (f) proposed method.
Electronics 11 02001 g013
Table 1. Summary of test images.
SamplesResolutionCapture ConditionImage Characteristics
Image 11280 × 1024Outdoor/noon/low integration timeElectric box at a distance of 400 m
Image 21280 × 1024Outdoor/afternoon/long integration timeTower cranes around 4.5 km away
Image 31280 × 1024Outdoor/afternoon/medium integration timeBuilding with fence around 1 km away
Image 51280 × 1024Outdoor/noon/medium integration timeBuilding around 1 km away
Table 2. Average gradient results between enhancement by CPU and FPGA.
CPUFPGA
Image 125.459925.0362
Image 223.178523.9471
Image 331.714633.2149
Image 437.656537.5983
Mean value29.502429.9491
Table 3. Hardware used on FPGA.
LUTSlicesFFBRAMDSP Slices
Hardware use946311982631
Total resources of the FPGA101,44015,850126,800135420
Table 4. The average gradient results among different methods.
PEBF&DDEGF&DDEFGF&PEProposed
Image 113.501518.520711.464415.299925.0362
Image 213.131919.377511.649213.050723.9471
Image 315.723718.560710.961216.330132.2149
Image 418.332524.874115.377820.006237.5983
Mean value15.172420.333312.363216.171729.6991
Table 5. Running time comparison of different methods (ms).
PEBF&DDEGF&DDEFGF&PEProposed
Image 114.3207.6252.1106.318.9
Image 214.5202.3249.6104.120.0
Image 314.6201.4261.4101.219.7
Image 414.6196.4247.6102.520.6
Mean value14.5201.9252.7103.519.8
Publisher’s Note: MDPI stays neutral with regard to jurisdictional claims in published maps and institutional affiliations.

