Article

An Off-Axis Measuring Method of Structural Parameters for Lenslet Array

1
School of Mechanical and Power Engineering, Harbin University of Science and Technology, Harbin 150080, China
2
Key Laboratory of Advanced Manufacturing and Intelligent Technology, Ministry of Education, Harbin 150080, China
3
School of Astronautics, Harbin Institute of Technology, Harbin 150001, China
*
Author to whom correspondence should be addressed.
Electronics 2022, 11(11), 1716; https://doi.org/10.3390/electronics11111716
Submission received: 5 May 2022 / Revised: 20 May 2022 / Accepted: 25 May 2022 / Published: 27 May 2022
(This article belongs to the Section Systems & Control Engineering)

Abstract

:
Aiming at the problem that the vertex detection method is difficult to deal with the high-efficiency detection of the large-scale spherical lenslet array, a contact off-axis measuring method is proposed and the measurement accuracy and detection efficiency are verified by experiments. Firstly, by analyzing the 3D model of the relationship between a spherical lens and probe of profilometer, the mathematical model of probe trajectory arc is established based on the off-axis trajectory characteristics of the spherical lenslet array. Then, the error mechanism under the off-axis condition is analyzed, and a mathematical algorithm is proposed to restore the structural parameters at the main optical axis of the lens by using the process design value of the unit lens aperture. Finally, a comparative experiment is carried out between the off-axis detection method and vertex detection method. The experimental results demonstrate that: Compared with the coaxial detection method, the relative errors of the measured lens curvature radius R0 and the lens vector height f0 under the off-axis detection method are 1.71% and 1.95%, respectively. Under the sampling measurement scale, the detection efficiency of the off-axis detection method is 41 times higher than that of vertex detection method.

1. Introduction

The lenslet array is an important precision optical device that is widely used in high precision fields of civil and defense such as projection display, uniform illumination, detection, and guidance [1,2,3,4,5]. With the development of advanced processing technology and the continuous widening and deepening of the application field of the lenslet array, new requirements have been put forward for the inspection technology and methods of high precision lenslet array devices. Currently, the mainstream methods for detecting the structural parameters of lenslet arrays are the scanning interference microscopy detection [6,7,8] and optical imaging detection method [9].
Scanning interference microscopy is suitable for microdimensional inspection, where the radius of curvature of the microlens is calculated mainly by measuring the sagittal height and aperture values [10]. For the detection of large array scale lenslet arrays with millimeter scale compound eye subaperture, scanning interference microscopy has the application limitation of a small objective field of view [11,12], and this method cannot detect the lens vector height for the large aperture, and the frequent splicing is inefficient [13]. The Shack–Hartmann wavefront imaging method has the advantage of being intuitive; the measurement results of this method are sensitive to the light source, are strongly influenced by the deformation of the base surface of the lens under the test, and are not suitable for high-precision measurements of the structure parameters [14,15].
Compared to non-contact measurement, contact profilometer has the advantage of a large measuring range and fast measurement speed [16]. Due to the large array size and small aperture of the lenslet array, the traditional contact measurement method (vertex inspection method) requires the base surface of the lens to be perpendicular to the stylus and the profilometer stylus to pass through the vertex of the lens. Prior to the present detection method, contact measurements were not applicable to detect lenslet arrays with small aperture values and large array scale numbers [17]. There are three main measurement limitations of the vertex detection method for lenslet arrays: 1. The single-lens surface type is small and the aperture is generally within 5 mm, so it is difficult to grasp the position of the stylus track, resulting in poor measurement repeatability; 2. The frequent sampling and testing is inefficient and requires a high degree of professionalism for the inspectors; 3. The stylus detection path is single and the measurement results are poorly indicative of lens out-of-round distortion.
To address the above problem, an off-axis trajectory feature model of a circular aperture spherical lenslet array is developed based on the contact measurement principle. By analyzing the error mechanism under the off-axis condition of stylus, the corresponding error mathematical model is established, and the contact off-axis detection method is proposed, which solves the problem of the high-precision and high-efficiency detection of the lenslet array under the off-axis condition of the stylus. Since the stylus trajectory of this method is diversified with respect to the position of the main optical axis of the unit lens, the test results not only reflect the condition of the main structural parameters of the lens, but also indicate the out-of-roundness of the lens under the test. By comparing the experimental results with the vertex detection method, the technical feasibility of this method is verified. This method brings a new technical solution for detecting lenslet arrays with subapertures of small and medium apertures and above small and medium apertures.

2. Methodology

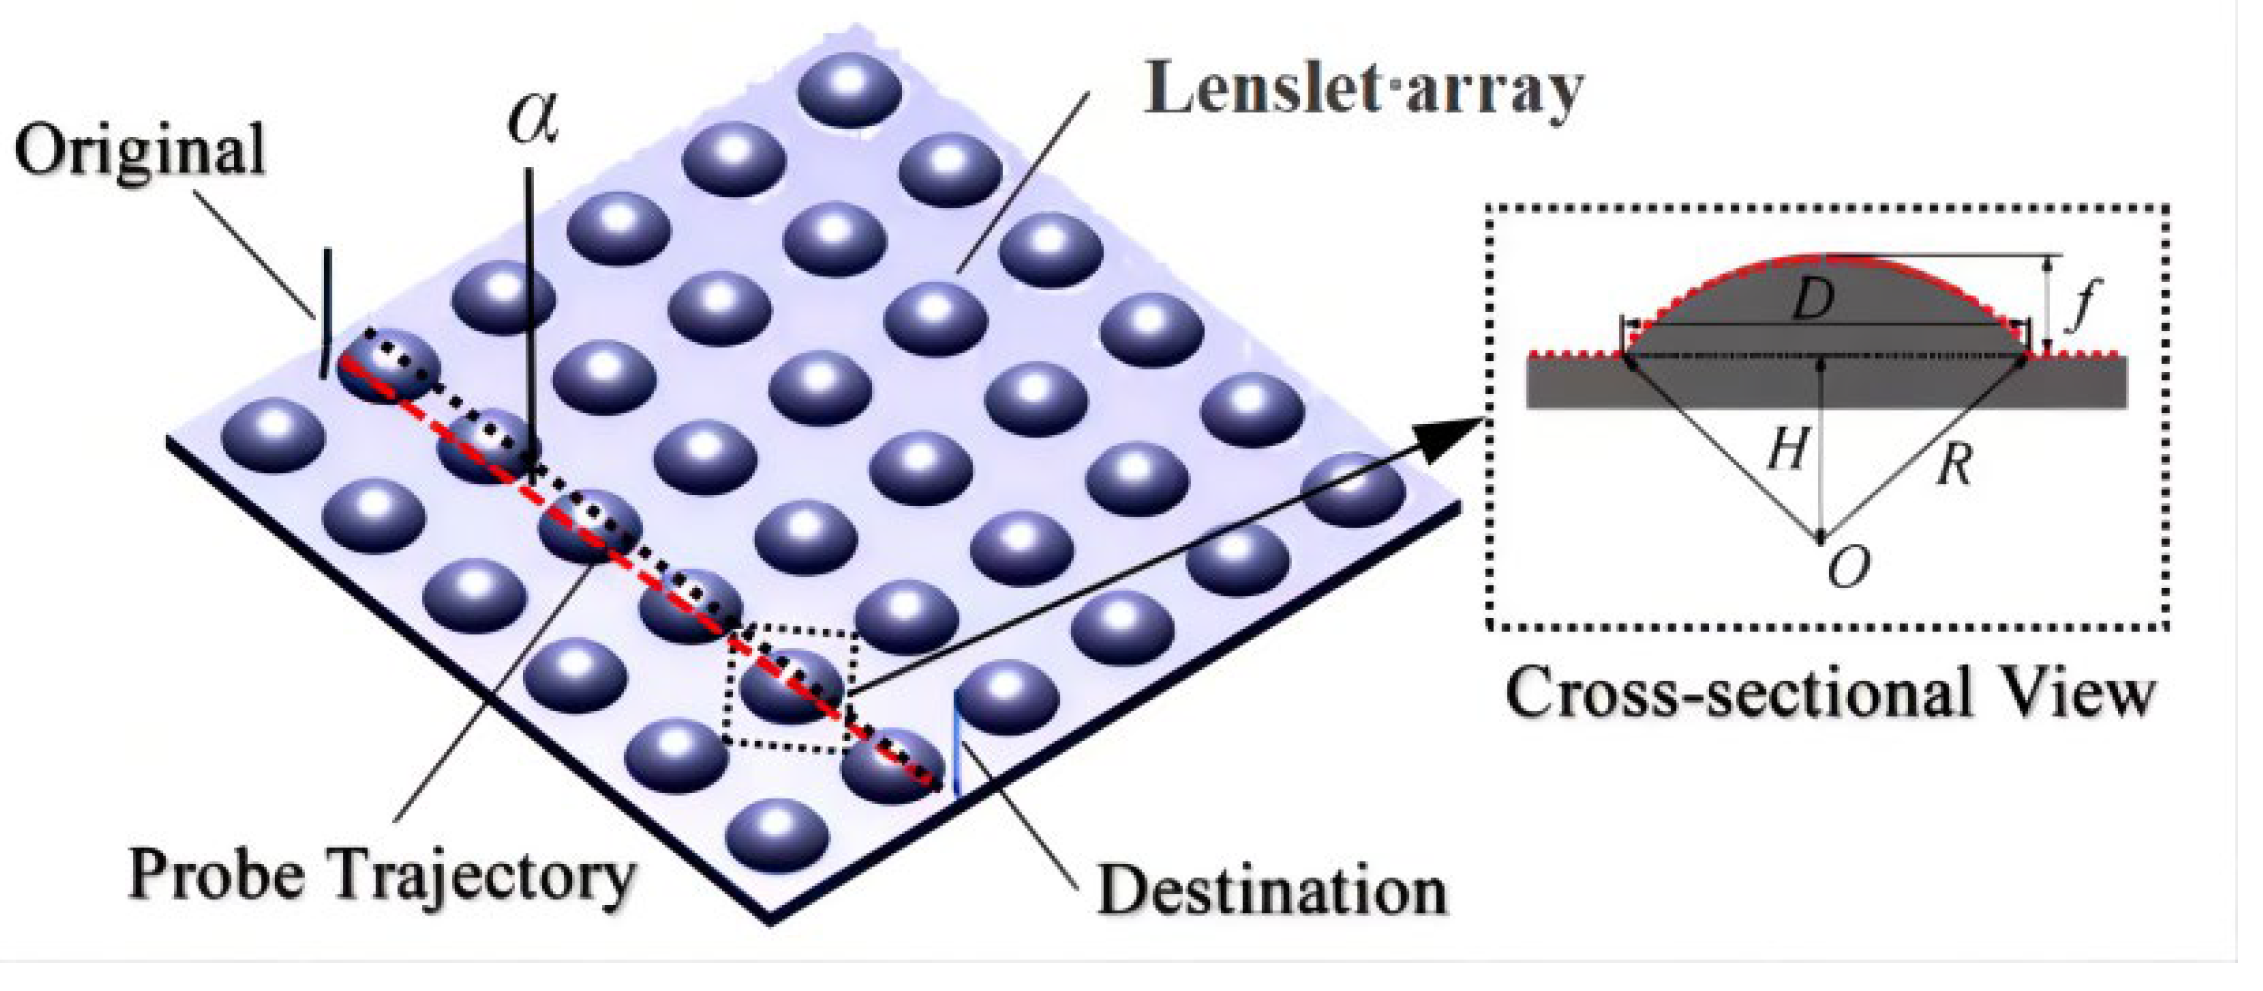
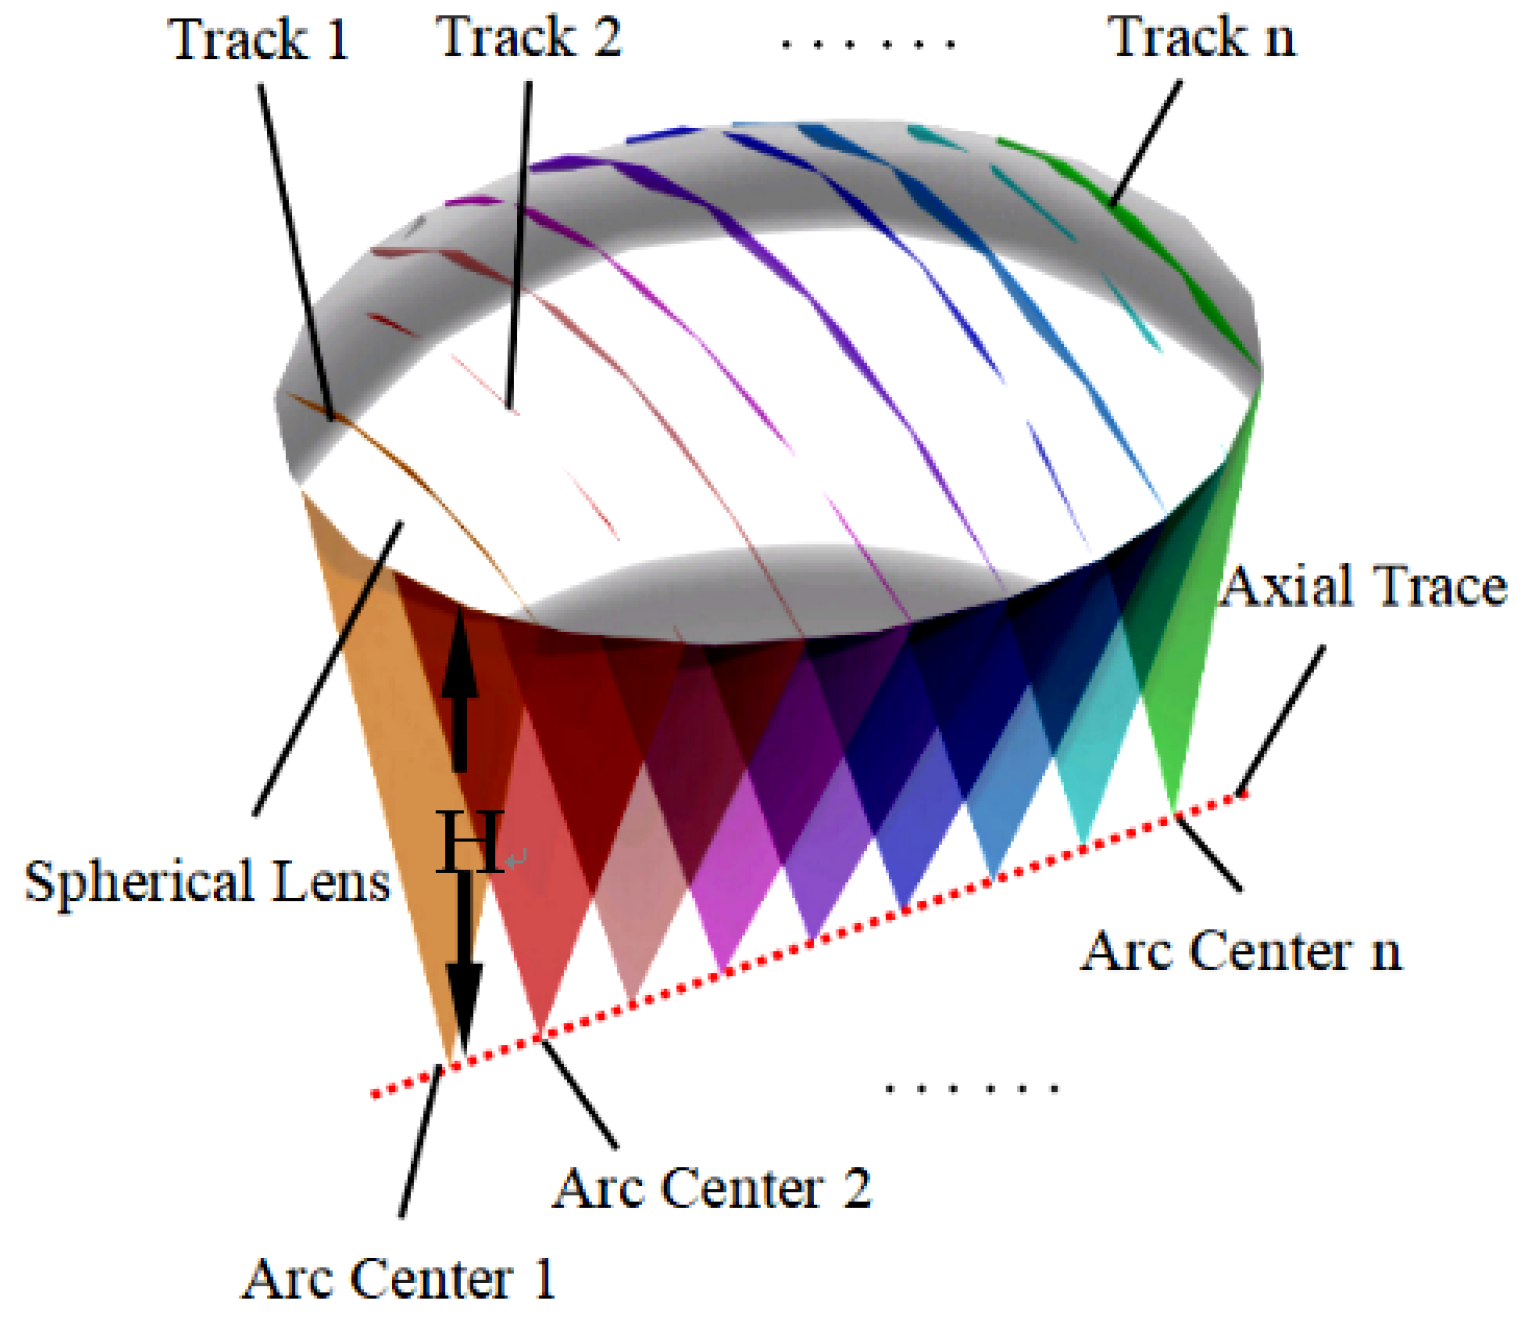
2.1. Off-Axis Trajectory Modeling and Geometric Analysis

Figure 1 is the measuring principle of the contact profilometer. The coordinate information of the profiler stylus is read by a laser phase grating interferometric sensor and transferred to a computer for storage and processing. For the measurement of small and medium aperture spherical lenslet arrays as shown in Figure 2, the area between the stylus and the array orientation of the lens is difficult to avoid. This will cause the stylus trajectory of the measured compound eye lens to deviate from the main optical axis in different degrees. The radius R and the vector height f of the trajectory arc of each unit lens cut by the stylus are different. Because of these shortcomings, the vertex detection method is only suitable for unit-by-unit lens measurements; a cumbersome operation will result in an inefficient measurement.
For an ideal spherical lens, the distance H (cardinal distance) from the center of the circle to the base of the lens is equal for trajectory arcs with different off-axis degrees, and the center of the arc circle of the trajectory with different off-axis degrees forms a line segment parallel to the base of the lens (circle center line), which is shown in Figure 3.
The vector height f and radius R of the stylus trajectory arc can be solved by fitting, and the center surface distance H can be found from Equation (1) according to the structural characteristics of the spherical lens. The vector height f0 and the radius of spherical curvature R0 at the main optical axis of the lens can be calculated from the cardinal distance H and the lens aperture value D. The off-axis trajectory parameters of the spherical unit lens can be reduced to the structural parameters at the main optical axis. The algorithm is shown in Equation (2).
H = R f
{ R 0 = H 2 + ( D 2 ) 2 f 0 = R 0 H

2.2. Analysis of the Error Mechanism of Off-Axis Measurement

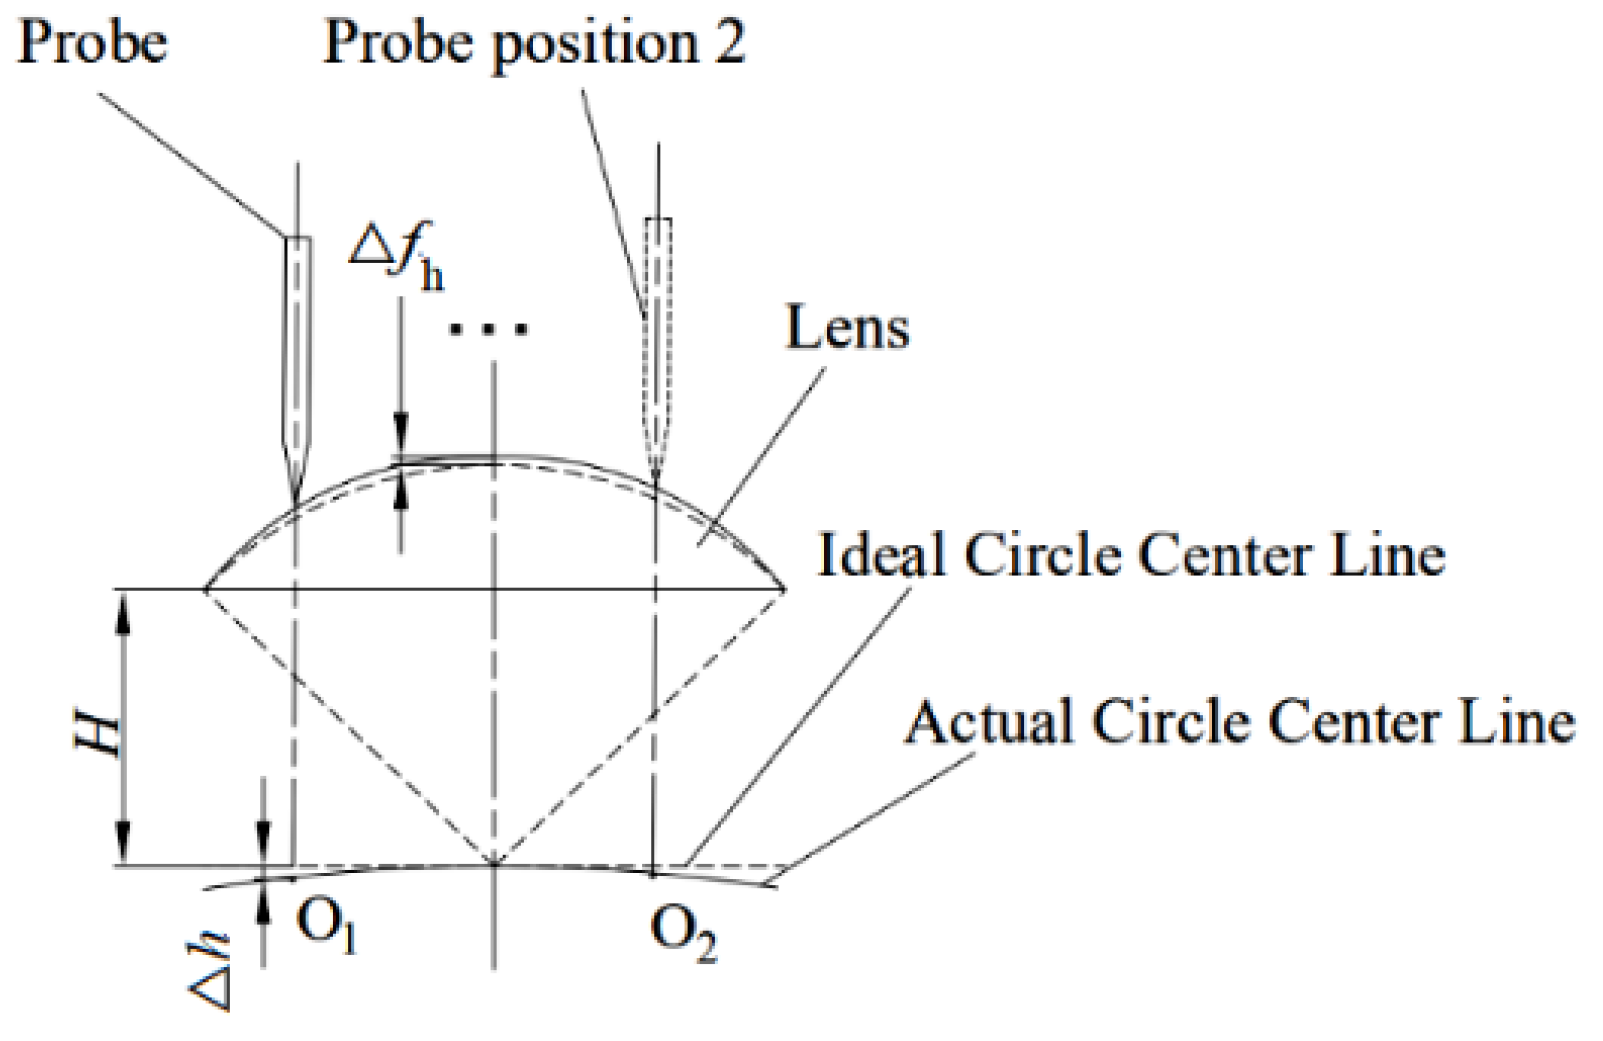
2.2.1. Error Analysis of Stylus Deflection Angle on Measurement Results

A 3D model of the spherical lens and stylus is created, as shown below, in Figure 4. The angle between the stylus and the main optical axis of the lens under ideal measurement conditions is 0°. However, in reality, due to the uneven thickness of the measured lens substrate, the arching deformation of the mirror surface and the tilting of the contour meter loading table, etc., there is a small declination β between the axis of the contact pin and the main optical axis of the lens. The center O2 of the trajectory arc in this eccentricity mechanism deviates from the ideal circle centerline, which is one of the factors for the error of the cardinality distance H.
From the geometric relationship, the trajectory arc span M is constant under the small declination mechanism. The two different modes of convergence and divergence of the stylus with the main optical axis result in the following changes in the vector height f and radius R of the trajectory arc:
The concentrated stylus trajectory arc is shown in the red curve in Figure 4. The radius of the trajectory arc R is small in this mode, and the vector height f is large. From Equations (1) and (2), the declination angle leads to a small center distance H, a small lens vector height f0 and a small radius of curvature R0. In addition, this will also lead to a divergent stylus trajectory arc with the opposite result of the former. The error of the declination on the radius of the curvature is denoted as Δrβ, and the error on the vector height is denoted as Δfβ.

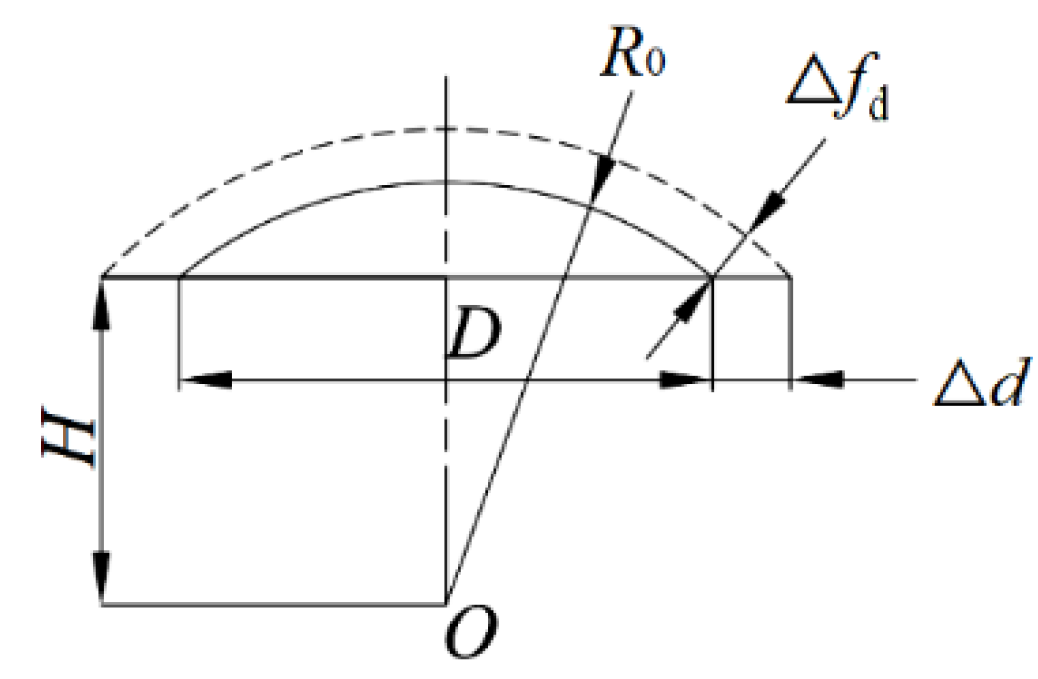
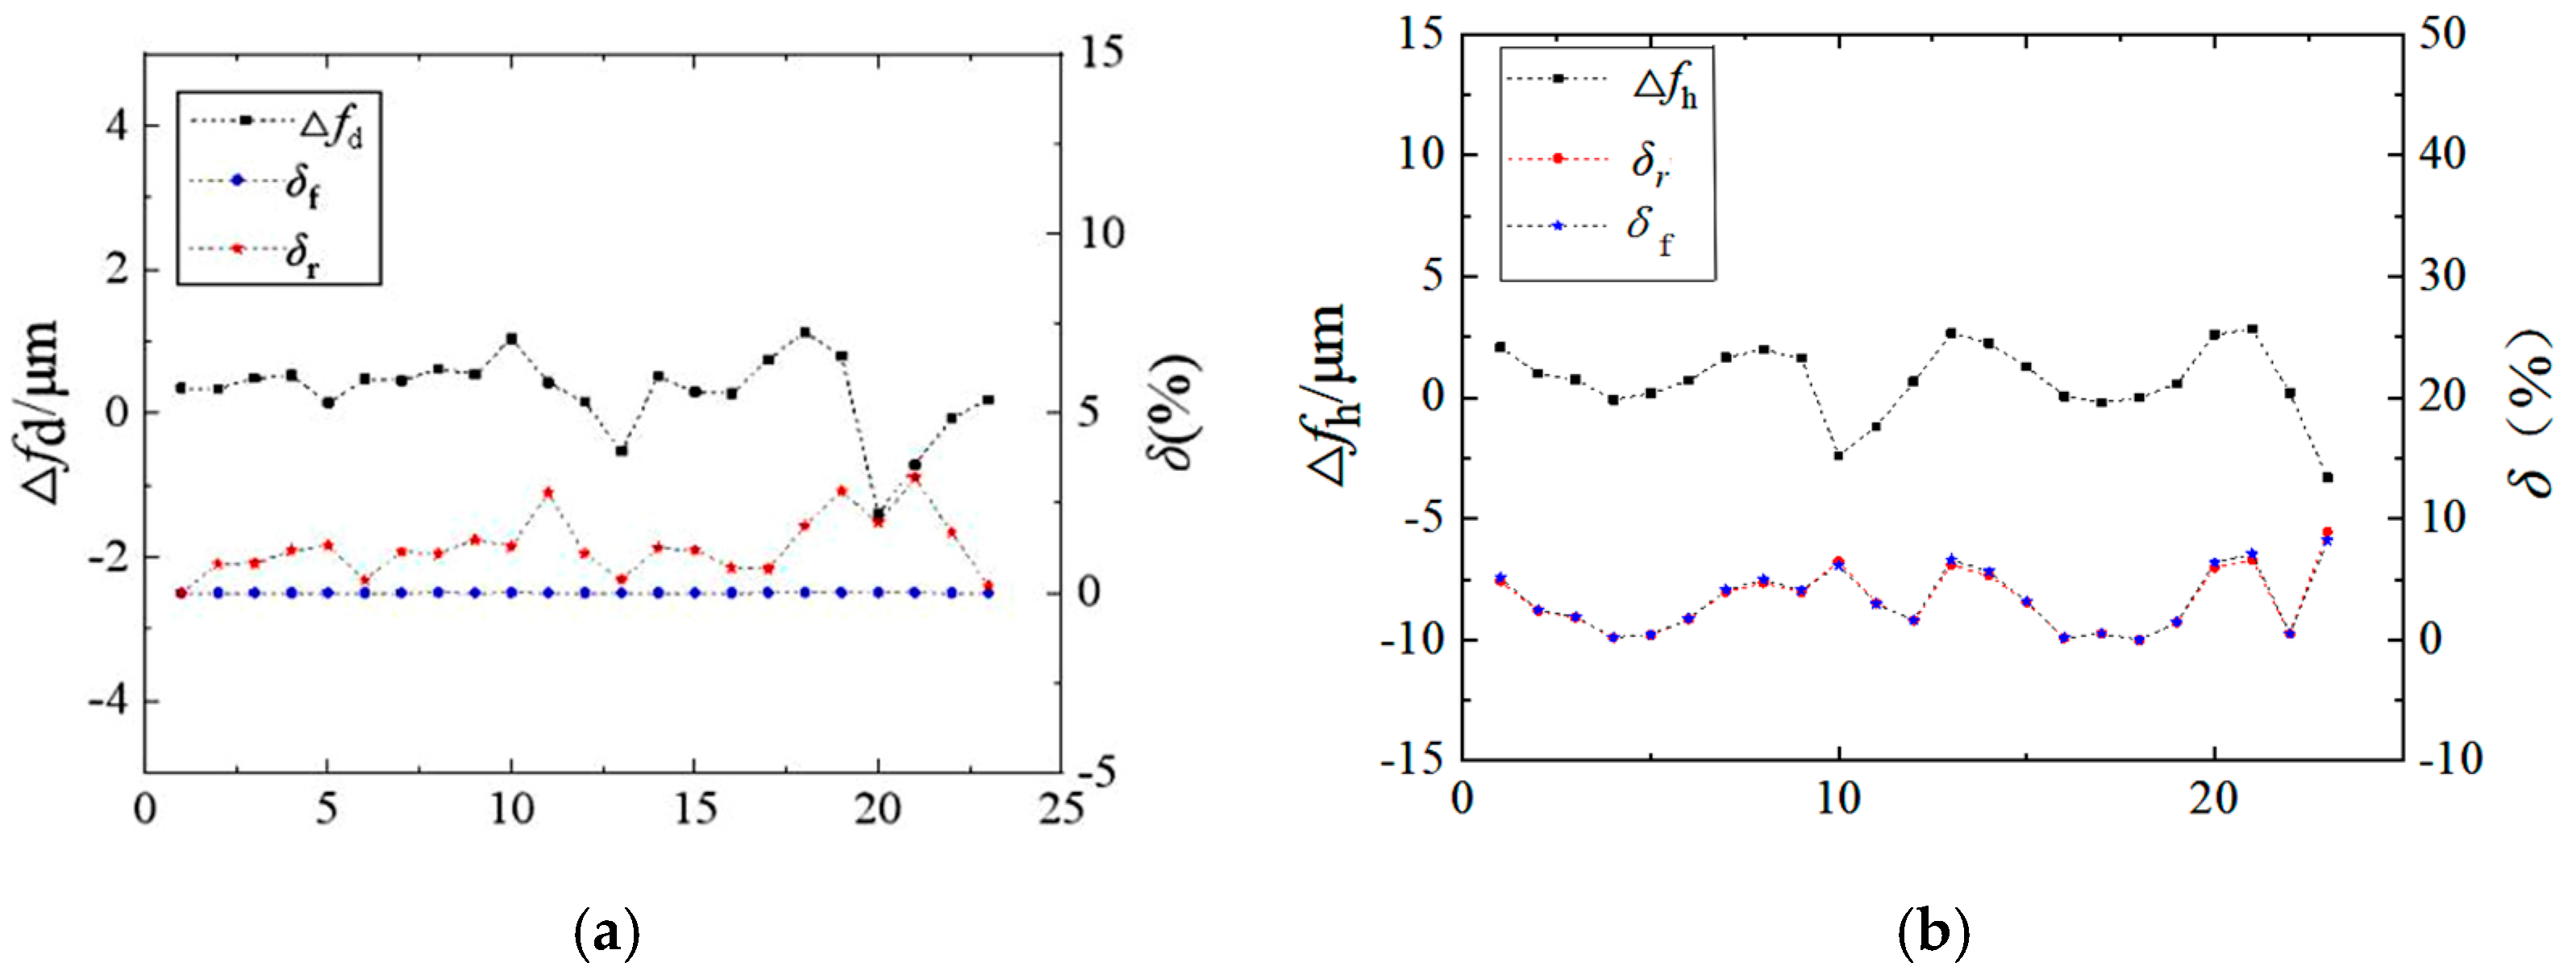
2.2.2. Error Analysis of Measurement Results by Caliber Deviation

The geometric relationship of the measurement error caused by the caliber deviation 2Δd is shown in Figure 5. The dashed line in the figure indicates the actual contour curve of the lens, and the solid arc indicates the contour curve of the lens as under ideal. The vector height error and radius error due to Δd are both Δfd, and the mathematical relationship between Δfd and Δd is Equation (3).
Δ f d = H 2 + ( D 2 + Δ d ) 2 H 2 + ( D 2 ) 2

2.2.3. Error Analysis of Spherical Distortion on Measurement Results

The process error of the lens leads to a certain amount of distortion on the outer surface of the lens, so that the actual centerline is curved. Taking the structural parameters at the main optical axis as the reference, the center surface distance H has a deviation Δh with respect to the ideal circle centerline. In the case of lenses with lost circles, Δh is different at different off-axis degrees, as shown in Figure 6.
The deviation of the vector height measurement due to Δh is Δfh and the mathematical relationship is shown in Equation (4).
Δ f h = ( H + Δ h ) 2 + D 2 4 H 2 + D 2 4 Δ h
The deviation of the radius of curvature in the spherical out-of-round mechanism is approximately the sum of Δfh and Δh. From the above analysis, it can be observed that the measurement accuracy of the off-axis detection method stems from the system error on the one hand; on the other hand, from the processing accuracy of the measured device. The lens vector height error Δf and the radius of curvature error Δr are shown in Equation (5).
{ Δ f = Δ f β + Δ f d + Δ f h Δ r = Δ r β + Δ d + Δ h + Δ f h

3. Mathematical Analysis

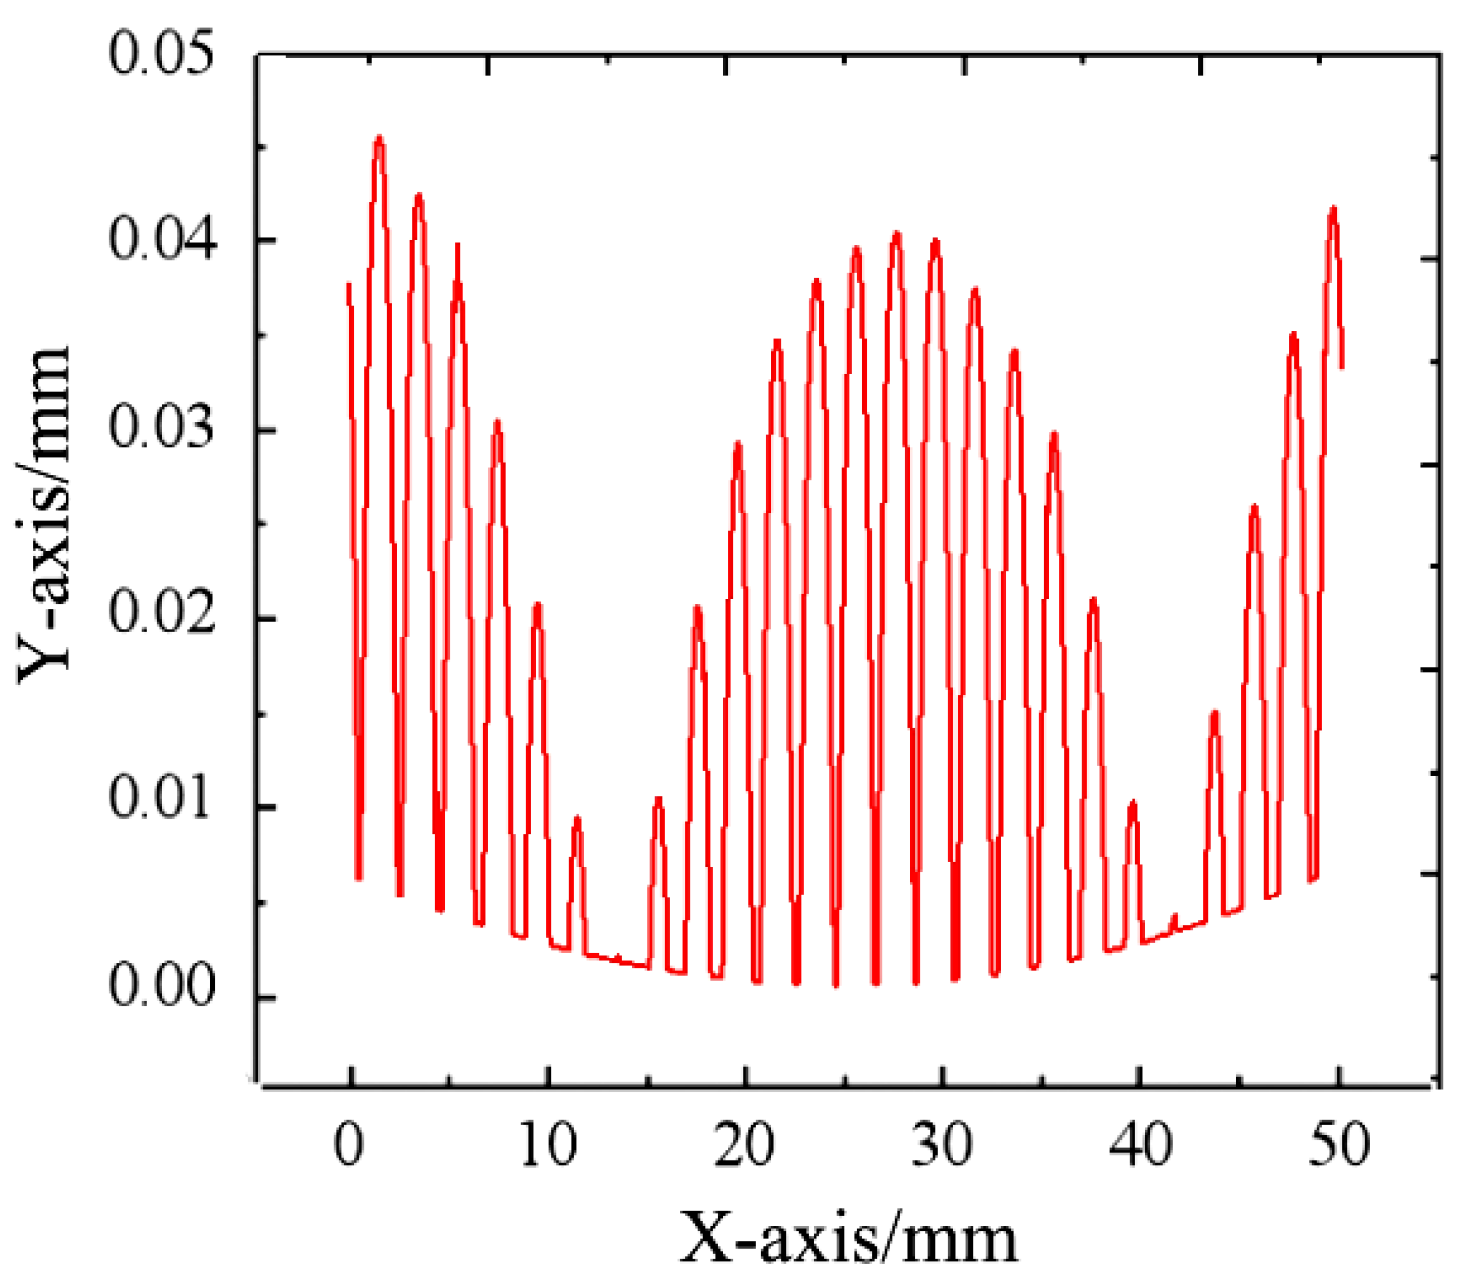
3.1. Parametric Fitting of the Trajectory Arc

The stylus is in row i and column j of the lenslet array, where i = 1,2,…,m; j = 1,2,…,n. The set of coordinates of the trajectory points scribed on the surface of the unitary lens is ( x i , j , k , y i , j , k ) , where k = 1,2,…, k is the number of feature point coordinates collected by the stylus. A circle is fitted to each trajectory arc by the least squares method and the error-squared objective function of the fitted circle is shown in Equation (6).
i = 1 , j = 1 m , n F i , j = i = 1 , j = 1 , k = 1 m , n , p i , j ( x i , j , k 2 2 x i , j x i , j , k + x i , j 2 + y i , j , k 2 2 y i , j y i , j , k + y i , j 2 r i , j 2 )
where ( x i , j , y i , j ) and ri,j are the center coordinates and radius of the lens trajectory arc in row i and column j, respectively.
Rectify Equation (6) to obtain the system of Equation (7), where A = 2 x i , j , B = 2 y i , j , C = x i , j 2 + y i , j 2 + R i , j , The radius of the best-fit circle is R i , j obtained by solving for A, B and C. Extract M i , j which is the value of the trajectory span of the stylus on the compound eye, and substitute it into the Equation (1) to find the cardinal distance of the i-th row and j-th column of the lens, as follows H i , j .
i = 1 , j = 1 m , n { F i , j A = 2 i = 1 , j = 1 , k = 1 m , n , p i , j ( x i , j , k 2 + y i , j , k 2 + A x i , j , k + B y i , j , k + C ) x i , j , k = 0 F i , j B = 2 i = 1 , j = 1 , k = 1 m , n , p i , j ( x i , j , k 2 + y i , j , k 2 + A x i , j , k + B y i , j , k + C ) y i , j , k = 0 F i , j C = 2 i = 1 , j = 1 , k = 1 m , n , p i , j ( x i , j , k 2 + y i , j , k 2 + A x i , j , k + B y i , j , k + C ) = 0
Bringing H i , j into Equation (2) yields the spherical radius and the principal vector height of the complex eye in row i and column j. The equation is shown in Equation (8).
{ R 0 i , j = H i , j 2 + ( D 2 ) 2 f 0 i , j = R 0 i , j H i , j

3.2. Consistency of Structural Parameters of Lenslet Arrays

The vector height f0 of the lenslet array, the standard deviation and the standard deviation of the radius of curvature R0 of the lens reflect the consistency of the structural parameters of the lenslet array, as shown in Equation (9); the smaller the standard deviation, the better the consistency of the array structure and the clearer the lens imaging.
{ S r = i = 1 , j = 1 m , n ( R 0 i , j R 0 ¯ ) 2 m n 1 S f = i = 1 , j = 1 m , n ( f 0 i , j f 0 ¯ ) 2 m n 1
Where R 0 ¯ = i = 1 , j = 1 m , n R i , j m · n ; f 0 ¯ = i = 1 , j = 1 m , n f i , j m · n , R 0 ¯ and f 0 ¯ are the average values of radius and vector height, respectively.

4. Experimental Validation

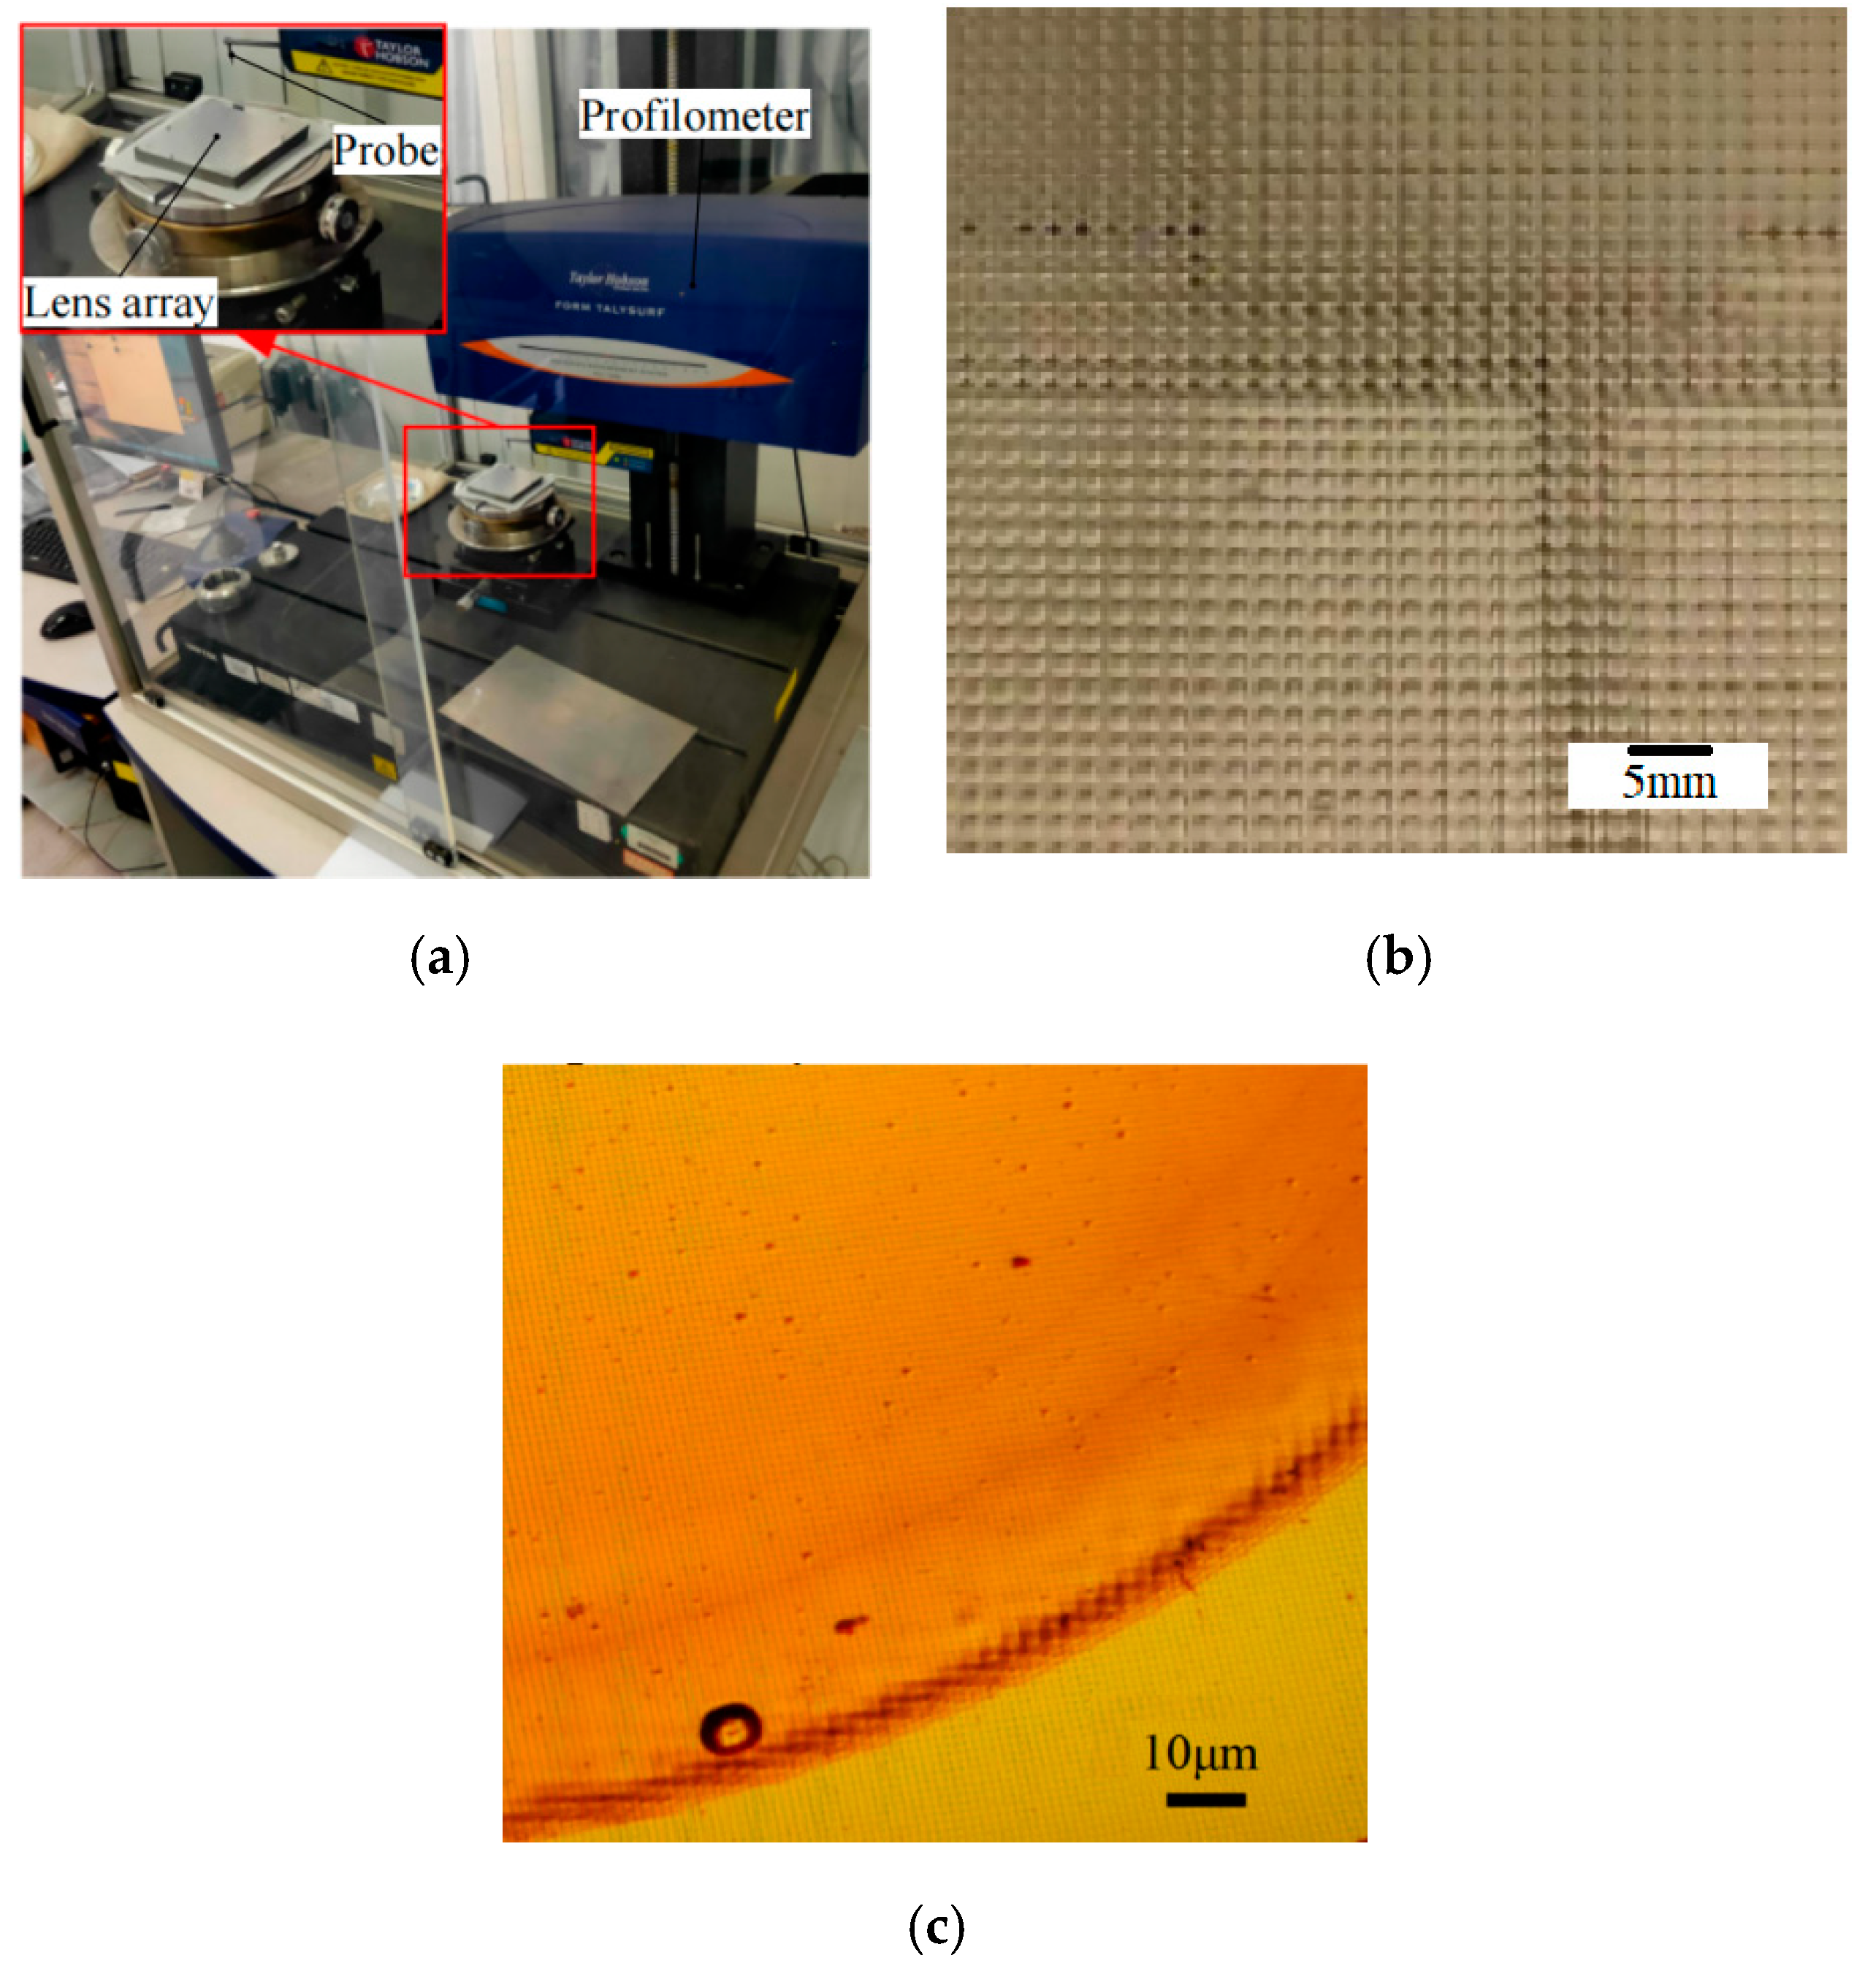
4.1. Experimental Equipment and Materials

The profilometer used in the experiment is Taylor-Hobson PGI 1240 and the detection system is shown in Figure 7a. The temperature of the laboratory where the testing system is located is 22.1 °C and the humidity is 22.2% in a constant temperature and humidity super clean room. The top of the stylus’s clamping angle is 60°, the vertex radius is 2 μm and the contact force of the stylus does not exceed 1 mN. The deformation error caused by the contact force of silicon lens can be ignored. To prevent contact contamination of the mirror surface, a protective film is placed on the back of the compound lenslet array on the profilometer carrier. The angle between the load table surface and the stylus axis after adjustment is less than 0.25° after tuning.
The experimentally used lenslet array is an infrared single crystal silicon circular aperture spherical lenslet array. The actual photo is shown in Figure 7b and the surface of the lens is not coated. The specific process design parameters are shown in Table 1.
The experiment scratch imaging inspection of the lens surface by using the mirror quality inspection system, which is mainly consisted of the Nikon SC3-E1 universal tool microscope to scratch an imaging inspection of the lens surface. There are no stylus scratches on the surface of the lens after microscopic examination. Figure 7c is the Micrograph.

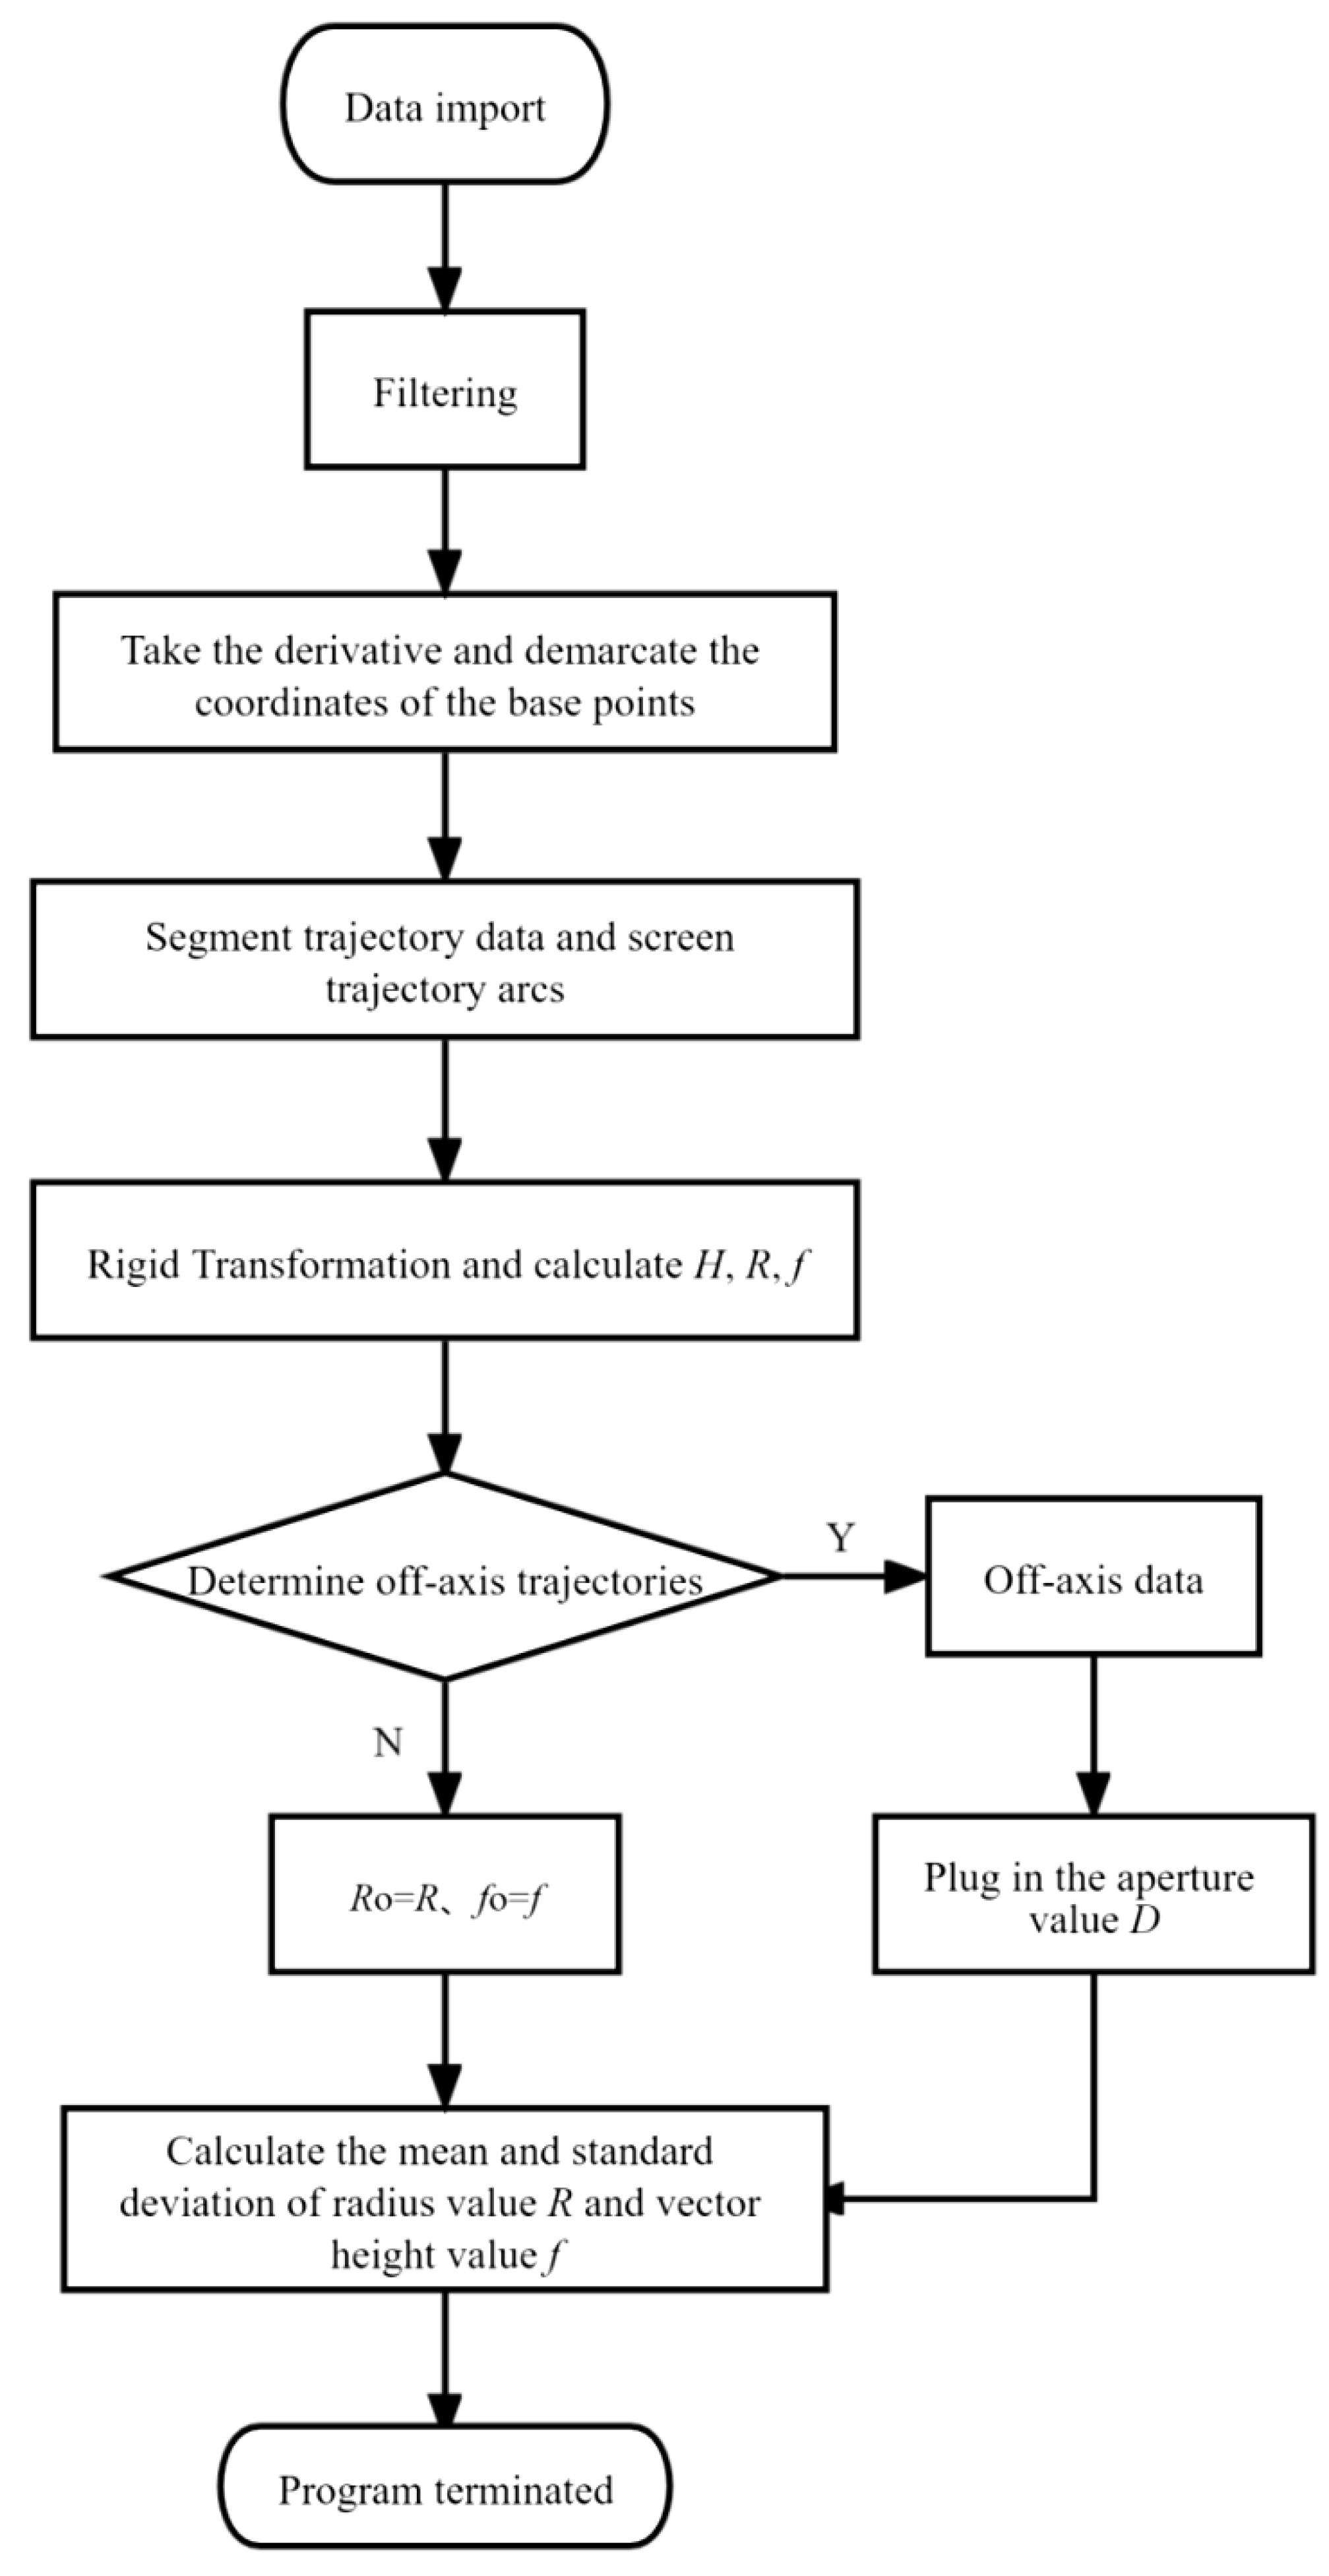
4.2. Experimental Data Processing Flow

Export the original coordinate data of the stylus of the profiler, and analyze and calculate the stylus trajectory data with a self-editing third-party program. Figure 8 is a processing flow chart. First, the data are filtered to make the trajectory arc smooth. Then, find the coordinates of each base point (intersection of lens and lens base) of the trajectory arc by deriving. The base point is used as a breakpoint to separate the complete trajectory arc data set of each lens under test M i , j , 2 . Use the equation group (10) to perform rigid transformations such as rotations and translations and correct the attitude of each trajectory arc to simplify the calculation procedure. The rigidly transformed trajectory arc matrix is Qi,j. Equations (7) and (8) are used to calculate Qi,j to solve for the structural parameters of each group of lenses at the main optical axis and to make statistics and analysis.
{ M i , j , 1 = [ 1 0 x i 0 , j 0 0 1 y i 0 , j 0 0 0 1 ] ; M i , j , 2 = [ x i , j , 1 x i , j , 2 x i , j , 3 x i , j , p i , j y i , j , 1 y i , j , 2 y i , j , 3 y i , j , p i , j 1 1 1 1 ] M i , j , 3 = [ cos ( θ i , j ) sin ( θ i , j ) 0 - sin ( θ i , j ) cos ( θ i , j ) 0 0 0 1 ] ; Q i , j = M i , j , 1 M i , j , 2 M i , j , 3
Where Mi,j,1—row i, column j lens trajectory arc translation matrix, the translation is the base point coordinates ( x i 0 , j 0 , y i 0 , j 0 ) ;
  • Mi,j,2—Data matrix for the row i, column j of the lens trajectory arc.
  • Mi,j,3—Row i, column j lens data rotation matrix, rotation angle θi,j.
  • Qi,j—The data matrix after rigid transformation.

4.3. Validation Experiments

4.3.1. Off-Axis Detection Method

The starting position of the stylus measurement is placed in front of the first column of the 9th row of the lenslet array. Stylus X-directional step spacing of 1.0 μm for α-angle random long span measurement and its trajectory contains the complete trajectory arc of 23 lenses, as shown in the Figure 9. From the geometric relationship between the lenslet array spacing and the span value of two adjacent stylus trajectory arcs, the declination angle α of the stylus trajectory is calculated to be about 4°. Due to the large stylus measurement stroke of the setup, the detection trajectory of the stylus spans the 9th and 10th rows of the lenslet array.

4.3.2. Vertex Detection Method

The experimental results reflect the structural parameters of the meridian surface of a certain compound eye lens by the vertex detection method. In addition, the parametric consistency evaluation of the lens is usually conducted by comparing the sagittal height and radius of this plane. The results of this experiment are used to check the data accuracy of the off-axis detection method, and to quantify the detection accuracy and detection efficiency of the off-axis detection method.
By adjusting the starting measurement position of the stylus, the stylus passes through the apex of the unit lens. Set stylus stroke to 3.0 mm and stylus X-direction step pitch to 1.0 μm. Columns 1–10 of row 9, columns 11–23 of row 10 and columns 24–33 of row 11 are examined one by one for a total of 33 compound eye lens units.

4.4. Experimental Results

4.4.1. Off-Axis Detection Method Accuracy and Efficiency

Using the least squares method to mathematically process the 23 groups of unit stylus trajectory arcs in Figure 9, the fitted trajectory arcs original radius R and original vector height f are the fitted values. The result after processing with Equation (8) on the basis of the fitted value is the normalized value. The normalized value is the detection result of the off-axis detection method, as shown in Figure 10. The radius values under the two algorithms are approximately coincidental, which is due to the small contribution of the vector height error to the radius, as shown in Figure 10a. The horizontal axes in this and the following graphs indicate the ordinal number of the lens of the unit under examination. The normalization of each trajectory arc vector height f in the meridian plane of the lens by Equation (8) yields the vector height f0 of the corresponding compound eye lens, and the comparison of the fitted value of the trajectory arc vector height f and the normalized value of the vector height f0 is shown in Figure 10b.
The data of the 33 groups of compound eye sublenses measured by the vertex trajectory experiment are shown in Figure 11, where the number of lens ranks measured by the 1st to 23rd unit lenses and the off-axis detection method are in the same order. The measurement statistics of the two testing methods are shown in Table 2.
In this experiment, the off-axis detection method takes about 2 min to detect 23 unit lenses at the scale of sampling and measurement of compound eye lenses, with an average efficiency of 11.5 lenses/min. Because of the need to re-adjust the stylus position before each measurement, this method takes 84 min to detect the 23rd compound eye lens, and the average detection efficiency is 0.27/min. Due to the realization of the computer-initiated calculation of the data sent for inspection, the computational processing time is negligible, yielding a detection efficiency of 43 times that of the vertex detection method for the off-axis detection method.

4.4.2. Evaluation of the Measurement Error of the Off-Axis Detection Method

From Figure 9, it can be observed that there is a slight arch deformation of 50″ from the edge to the center of the lens base surface on a macroscopic scale. Combined with the angle between the carrier surface and the stylus axis less than 0.25°, it is concluded that the maximum deflection angle βmax between the base surface of the lens and the stylus axis is βmax <0.25° + 50″ ≈ 0.27°, cos0.27° ≈ 1.0°. It is verified by calculation that the maximum calculated errors of β on the lens main vector height f0 and lens radius of curvature R0 do not exceed 0.44 nm and 0.12 μm, respectively, and the relative errors with the measured results are approximately 0. Therefore, the effect of β on the present experimental results is negligible.
The structural parameters, measured by the vertex detection method, are shown in Figure 12, in which the average value of the actual aperture D of the lens is 1.90 mm and the maximum value is 1.93 mm, as shown in Figure 12a. For the off-axis measurement method, the average measurement error of aperture deviation Δd to the rise f0 is only 0.29 μm, and the error of radius R0 is negligible, which also reflects the reliability of the method of the parameter regression of radius and rise using aperture D. According to the analysis in Chapter 1.2.2 and Chapter 1.2.3, the mean value of the deviation δ h of the center line is 172.83 μm, and the maximum value is 993.80 μm, which has a relatively great influence on the measurement results. See Table 3 for detailed data. On the whole, the superposition relative errors of the three influencing factors on f0 and R0 measurement results are 4.50% and 3.28%, respectively, among which Δh has the highest influence on the measurement results, and Δh is mainly caused by the lens out of the circle. That is to say, the off-axis measurement results reflect the comprehensive differences of individual sizes and out-of-roundness among small lenses, which cannot be realized by the paraxial measurement method.
The off-axis detection method has the same sensitivity and accuracy as the paraxial detection method, except that the measurement result of the off-axis detection method is affected by the out-of-roundness of the tested lens, which depends on the machining accuracy of the tested part rather than the measurement method. The off-axis detection method is suitable for the detection of spherical lenslets arrayed on curved and flat surfaces, because the radius of spherical lenses is unique, and different detection trajectory arcs can be regressed.

5. Conclusions

Circular aperture spherical lenslet array for compound eye subaperture of millimeter scale, a three-dimensional model of the relationship between the spherical lens and the stylus, was established, which was based on the contact measurement principle. Then, we analyzed the off-axis trajectory characteristics of the spherical lenslet array and the error geometry model under the off-axis condition of the stylus and established the error mathematical relationship. The value of the error and the corresponding influence level were given in combination with the test data. The mathematical model of the lens structure parameters was constructed based on the geometric characteristics of the off-axis trajectory arc, and the accuracy and speed of calculation were improved by computer programming. A comparison experiment between the vertex detection method and the off-axis detection method was conducted, and the following conclusions were drawn.
(1)
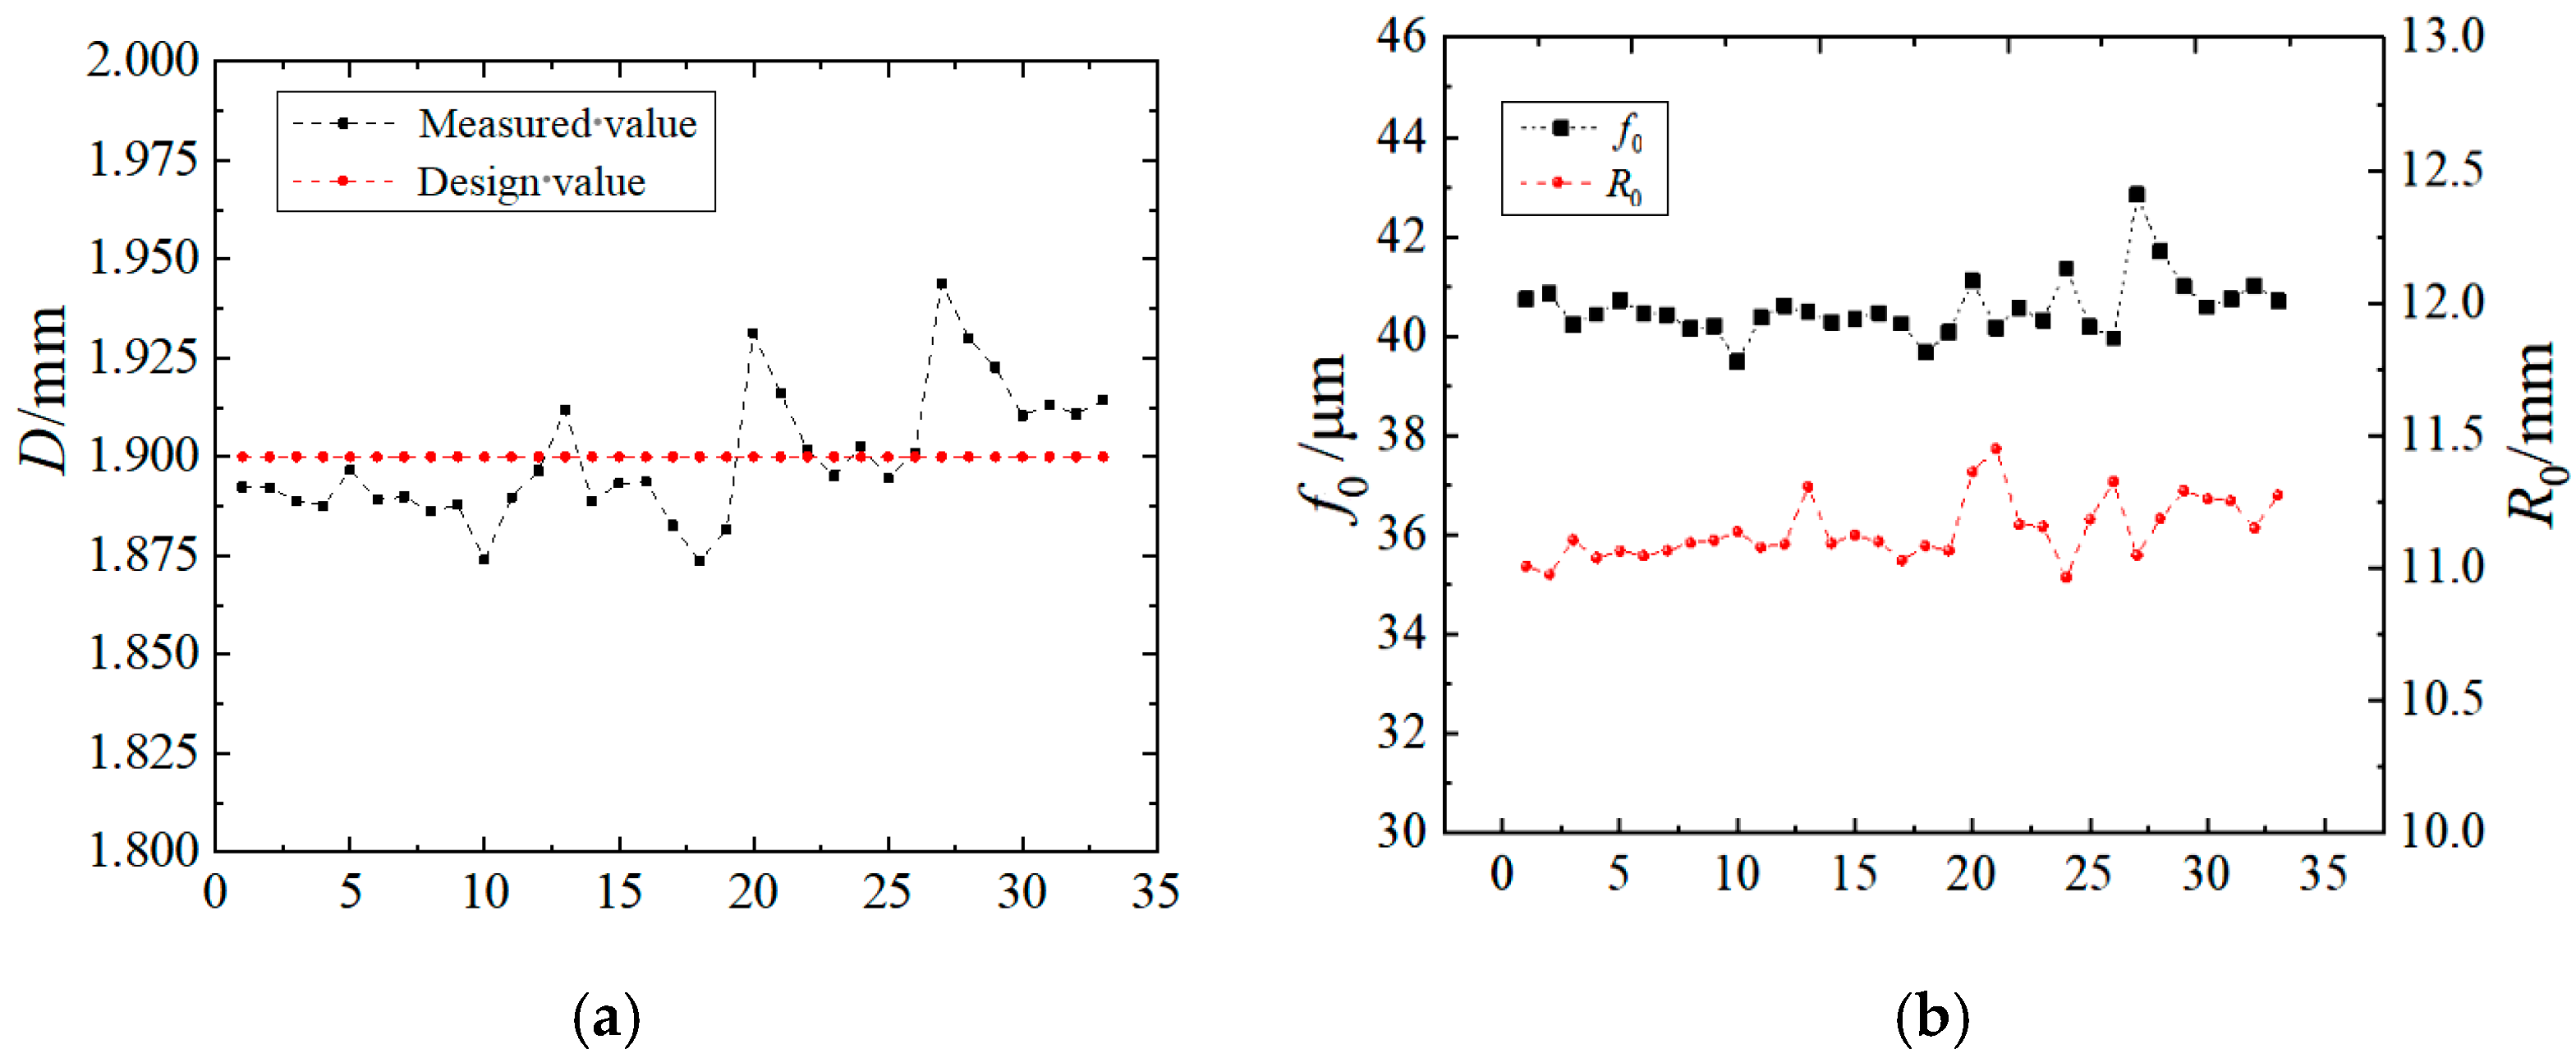
The relative errors δ of R0 and f0 measured by the off-axis detection method were 1.71% and 1.95%, respectively, and it shows that the detection accuracy of the off-axis detection method meets the detection requirements.
(2)
The average detection efficiency of the off-axis detection method is 43 times higher than that of the vertex detection method at the sampling measurement scale of this experiment. The off-axis inspection method enables full inspection of large scale spherical circular aperture lenslet arrays.
(3)
This method is sensitive to the accuracy of the outer surface of the lens. The Sr and Sf were increased by 2.77 and 1.99 times, respectively, compared with the vertex detection method and the test results, reflecting the accuracy of the face shape of the compound eye sublens.
(4)
The off-axis inspection method reduces the difficulty of the experiment, significantly reduces the professional skills required of the measurement personnel, and realizes the simplification of the precision measurement technology.

Author Contributions

J.Z. (Jianjun Zhang) writing; J.L. conceptual analysis; X.G. data interpretation; J.Z. (Jianlong Zhang) study design; Y.Z. data analysis; Z.Y. data collection. All authors have read and agreed to the published version of the manuscript.

Funding

This research was funded by National Natural Science Foundation of China, grant number 51405113.

Informed Consent Statement

Informed consent was obtained from all subjects involved in the study.

Acknowledgments

All individuals(authors) included in this section have consented to the acknowledgement.

Conflicts of Interest

The authors declare no conflict of interest.

References

  1. Zhang, R.; Zhang, G.; Zhang, J.; Xu, D.; Sun, G.; Liu, S.; Yang, S. Uniform illumination of large area divergent solar simulator. Opt. Precis. Eng. 2019, 3, 552–560. [Google Scholar] [CrossRef]
  2. Tao, K.; Lian, G.; Liu, Y.; Xing, H.; Xing, Y.; Su, X.; Feng, X.; Wu, Y. Design and Integration of the Single-Lens Curved Muti-Focusing Compound Eye Camera. Micromachines 2021, 12, 331. [Google Scholar] [CrossRef] [PubMed]
  3. Guo, X.; Yang, Z.; Yang, K.; Zhang, J.; Wang, Y. Detection technology of infrared guidance device box based on compound eye array. Syst. Eng. Electron. Technol. 2020, 42, 1668–1672. [Google Scholar]
  4. Cui, C.; Zhang, Y.; Yi, D.; Kong, L.; Liu, Z. Image quality optimization method of optical microscope system. J. Huaqiao Univ. 2017, 11, 768–774. [Google Scholar]
  5. Gong, X.; Yu, W.; Zhang, H.; Lu, Z.; Sun, Q.; Shen, H. Research progress in design and fabrication of bionic compound eye imaging system. Opt. China 2013, 6, 34–45. [Google Scholar] [CrossRef]
  6. Yang, S. Morphology Measurement and Error Analysis in Ultra Precision Machining of Microstructure Array; Zhejiang University: Hangzhou, China, 2018. [Google Scholar]
  7. Shang, W.; Zhang, W.; Wu, Z.; Li, Y.; Kong, X. Three-dimensional measurement system based on full-field heterodyne-interferometry. Opt. Precis. Eng. 2019, 27, 2097–2104. [Google Scholar] [CrossRef]
  8. Zhang, H.; Li, L.; McCray, D.L.; Scheiding, S.; Naples, N.J.; Gebhardt, A.; Risse, S.; Eberhardt, R.; Tünnermann, A.; Allen, Y.Y. Development ofa low cost high precision three-layer 3D artificial compound eye. Opt. Express 2013, 21, 22232–22245. [Google Scholar] [CrossRef] [PubMed]
  9. Zhu, X.; Wu, F.; Cao, X.; Wu, S. Focal length detection of micro-lenslet array based on Hartman Shack wavefront detection principle. Opt. Precis. Eng. 2013, 21, 1122–1128. (In Chinese) [Google Scholar]
  10. Sun, Y.; Leng, Y.; Chen, Z.; Dong, L. Research on square aperture spherical micro lenslet array for infrared focal plane. Acta Photonica Sin. 2012, 4, 400–403. [Google Scholar]
  11. Zhou, P.; Yu, Y. Algorithmic Research Based on White Light Scanning Profilometers. Chin. J. Sci. Instrum. 2002, 23, 533–535. [Google Scholar]
  12. Ren, F.; Wang, Z.; Qian, J.; Liang, Y.; Dang, S.; Cai, Y.; Bianco, P.R.; Yao, B.; Lei, M. Multi-view Object Topography Measurement with Optical Sectioning Structured Illumination Microscopy. Appl. Opt. 2019, 58, 6288–6294. [Google Scholar] [CrossRef]
  13. Xu, Y.; Chen, L.; Zhu, R. Study on the measurement of radii of curvature of mini-spheres. Chin. J. Sci. Instrum. 2006, 27, 1159–1162. [Google Scholar]
  14. Zhou, Y. Three-Dimensional Morphology and Super-Resolution Detection of Micro Nano Structure Based on WHITE light Micro Interferometry; University of Chinese Academy of Sciences (Institute of Optoelectronic Technology, Chinese Academy of Sciences): Beijing, China, 2018. [Google Scholar]
  15. Tomlinson, K.; Schroen, D.G. Using an Interferometric Profilometersr and Gage Block to Determine Sample Thickness. Fusion Sci. Technol. 2013, 63, 288–295. [Google Scholar] [CrossRef]
  16. Wu, J.; Chen, J.; Xu, C.; Gao, X. Focal length measurement based on Hartmann Shack wavefront measurement principle. Acta Photonica Sin. 2011, 40, 912–915. [Google Scholar]
  17. Han, Z.; Li, S.; Feng, Y.; Zhao, L. Development of contact profilometer contact needle state check graph block. Micro Nano Electron. Technol. 2019, 56, 761–765. [Google Scholar]
Figure 1. Contact detection principle diagram.
Electronics 11 01716 g001
Figure 2. Relationship between lenslet array and off-axis trajectory of stylus.
Electronics 11 01716 g002
Figure 3. Trajectory characteristics of stylus at different off-axis degrees.
Electronics 11 01716 g003
Figure 4. Three-dimensional relationship between spherical lens and stylus with different inclination angles.
Electronics 11 01716 g004
Figure 5. Geometric relationship between caliber deviation and measurement error.
Electronics 11 01716 g005
Figure 6. Geometric relationship between spherical out-of-roundness and measurement error.
Electronics 11 01716 g006
Figure 7. Physical pictures of detection system and components. (a) Physical photo of the detection system; (b) Infrared lenslet array physical partial photo; (c) Micrograph of the stylus crossing area of the lens.
Electronics 11 01716 g007
Figure 8. Data processing flow chart.
Electronics 11 01716 g008
Figure 9. Off-axis trajectory of stylus.
Electronics 11 01716 g009
Figure 10. Comparison of processing results of off-axis detection method. (a) Radius values at 4° declination; (b) Value of vector height at 4° declination angle.
Electronics 11 01716 g010
Figure 11. Graph of experimental data of vertex detection method. (a) Vector height error; (b) Relative error.
Electronics 11 01716 g011
Figure 12. Sagittal height error and relative error due to caliber deviation. (a) Lens aperture value; (b) Radius of curvature of the lens with respect to the vector height.
Electronics 11 01716 g012
Table 1. Complex eye lenslet array process design parameters (unit: mm).
RadiusRiseCaliberArray SpacingProcessMaterial
11.00.04051.902.0LithographySilicon
Table 2. Comparison table of test results.
Methods/ParameterR0/mmf0/μmSr/mmSf/μmη/min
Vertex detection method11.1440.560.1160.6040.27
Off-axis detection method10.9541.350.3211.18911.50
Table 3. Statistics of error values.
Parameters\FactorsStylus Deflection Angle βLens Aperture Deviation ΔdSpherical Aberration Δh
Δf/μm max/mean0/01.12/0.293.30/0.70
δf(%) max/mean0/03.21/1.298.91/3.21
Δr/μm max/mean0.12/00/0993.81/172.85
δr(%) max/mean0/00/08.21/3.28
Impact levelMinutenessSmallLarge
Publisher’s Note: MDPI stays neutral with regard to jurisdictional claims in published maps and institutional affiliations.

