
Channel-Wise Attention Mechanism in the 3D Convolutional Network for Lung Nodule Detection


Abstract
:1. Introduction
- An end-to-end lung nodule detection network with a U-shaped encoder-decoder structure is proposed to improve model sensitivity and specificity.
- Improved attention gates (AGs) are designed in skip connections, which are conducive to reducing false positives in a one-stage pulmonary nodules detector.
- A post-processing module—the channel interaction unit (CIU)—is introduced to obtain the importance of each feature channel, and more targeted image features are extracted to fully optimize the network performance.
- We validate our proposed framework on the LUNA16 dataset. GHM loss is used as the loss function to solve the imbalance between positive and negative samples. Experimental results show that our proposed method can achieve high sensitivity and specificity.
2. Materials and Methods
2.1. Network Structure
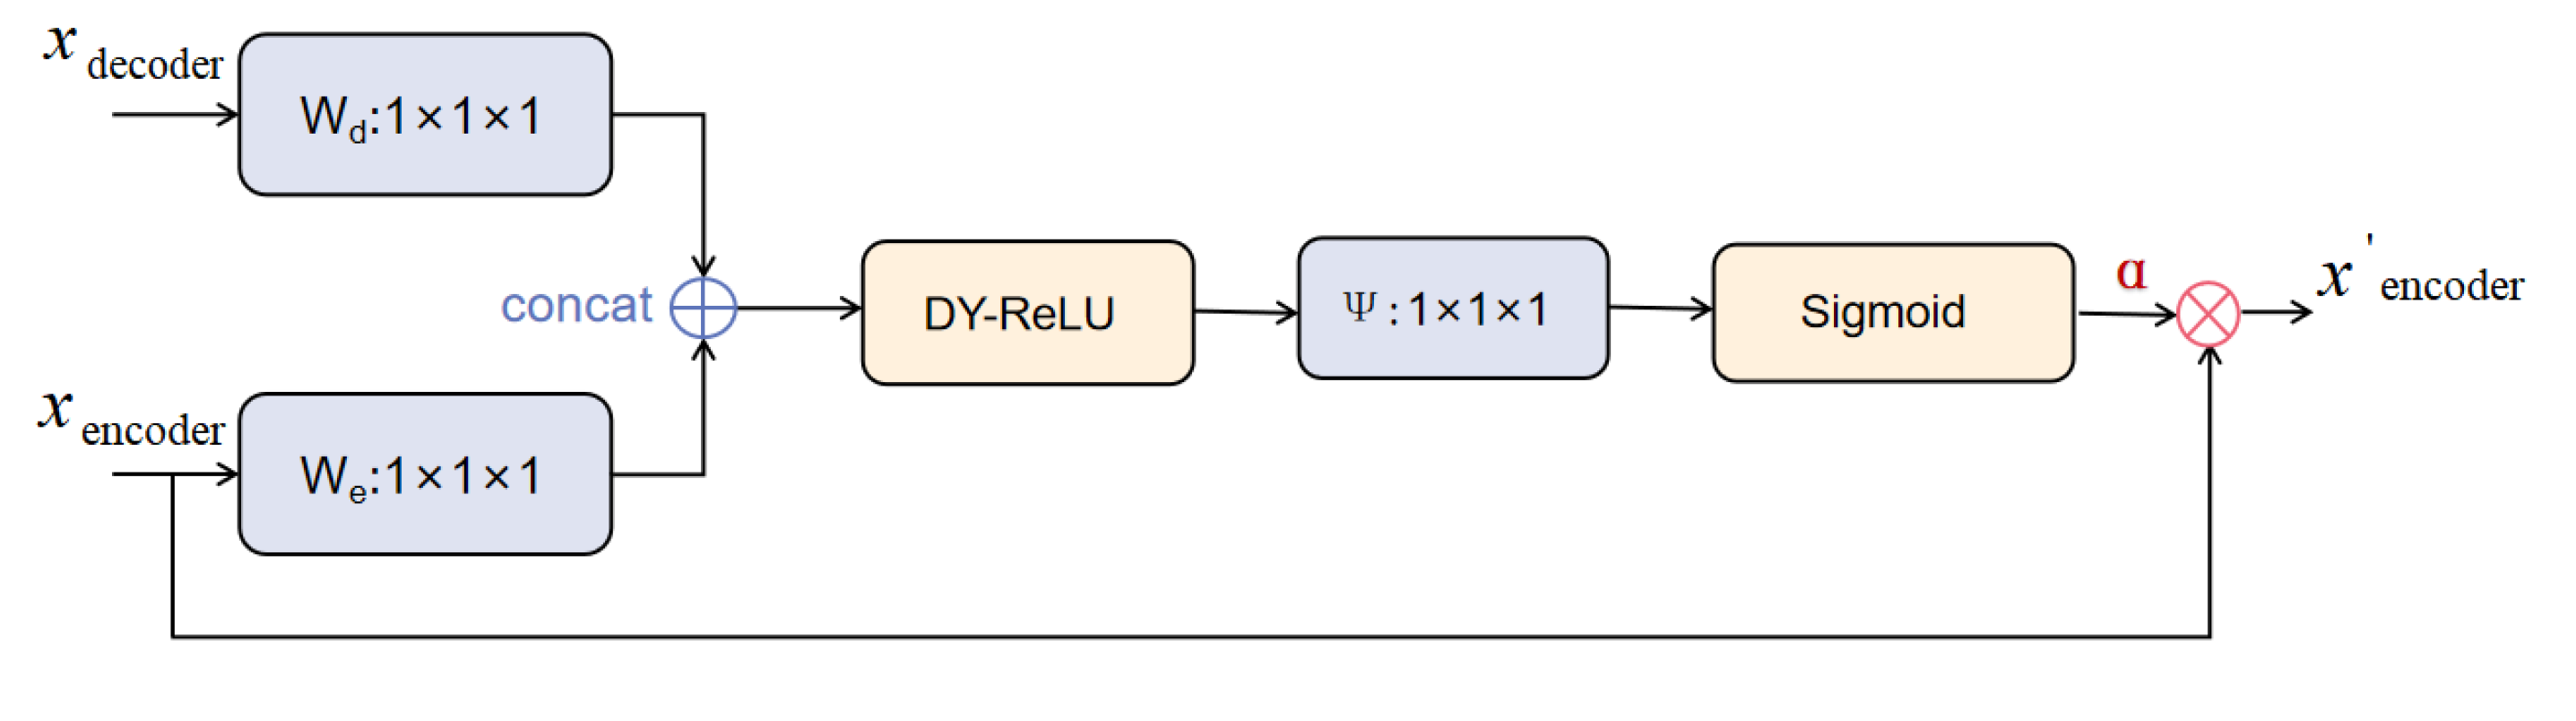
2.2. The Improved Attention Gate
2.3. Channel Interaction Unit
2.4. Designed Loss Functions for Sample Imbalance
3. Experimental Results
3.1. Datasets
3.2. Implementation Details
3.3. Experiments on LUNA2016
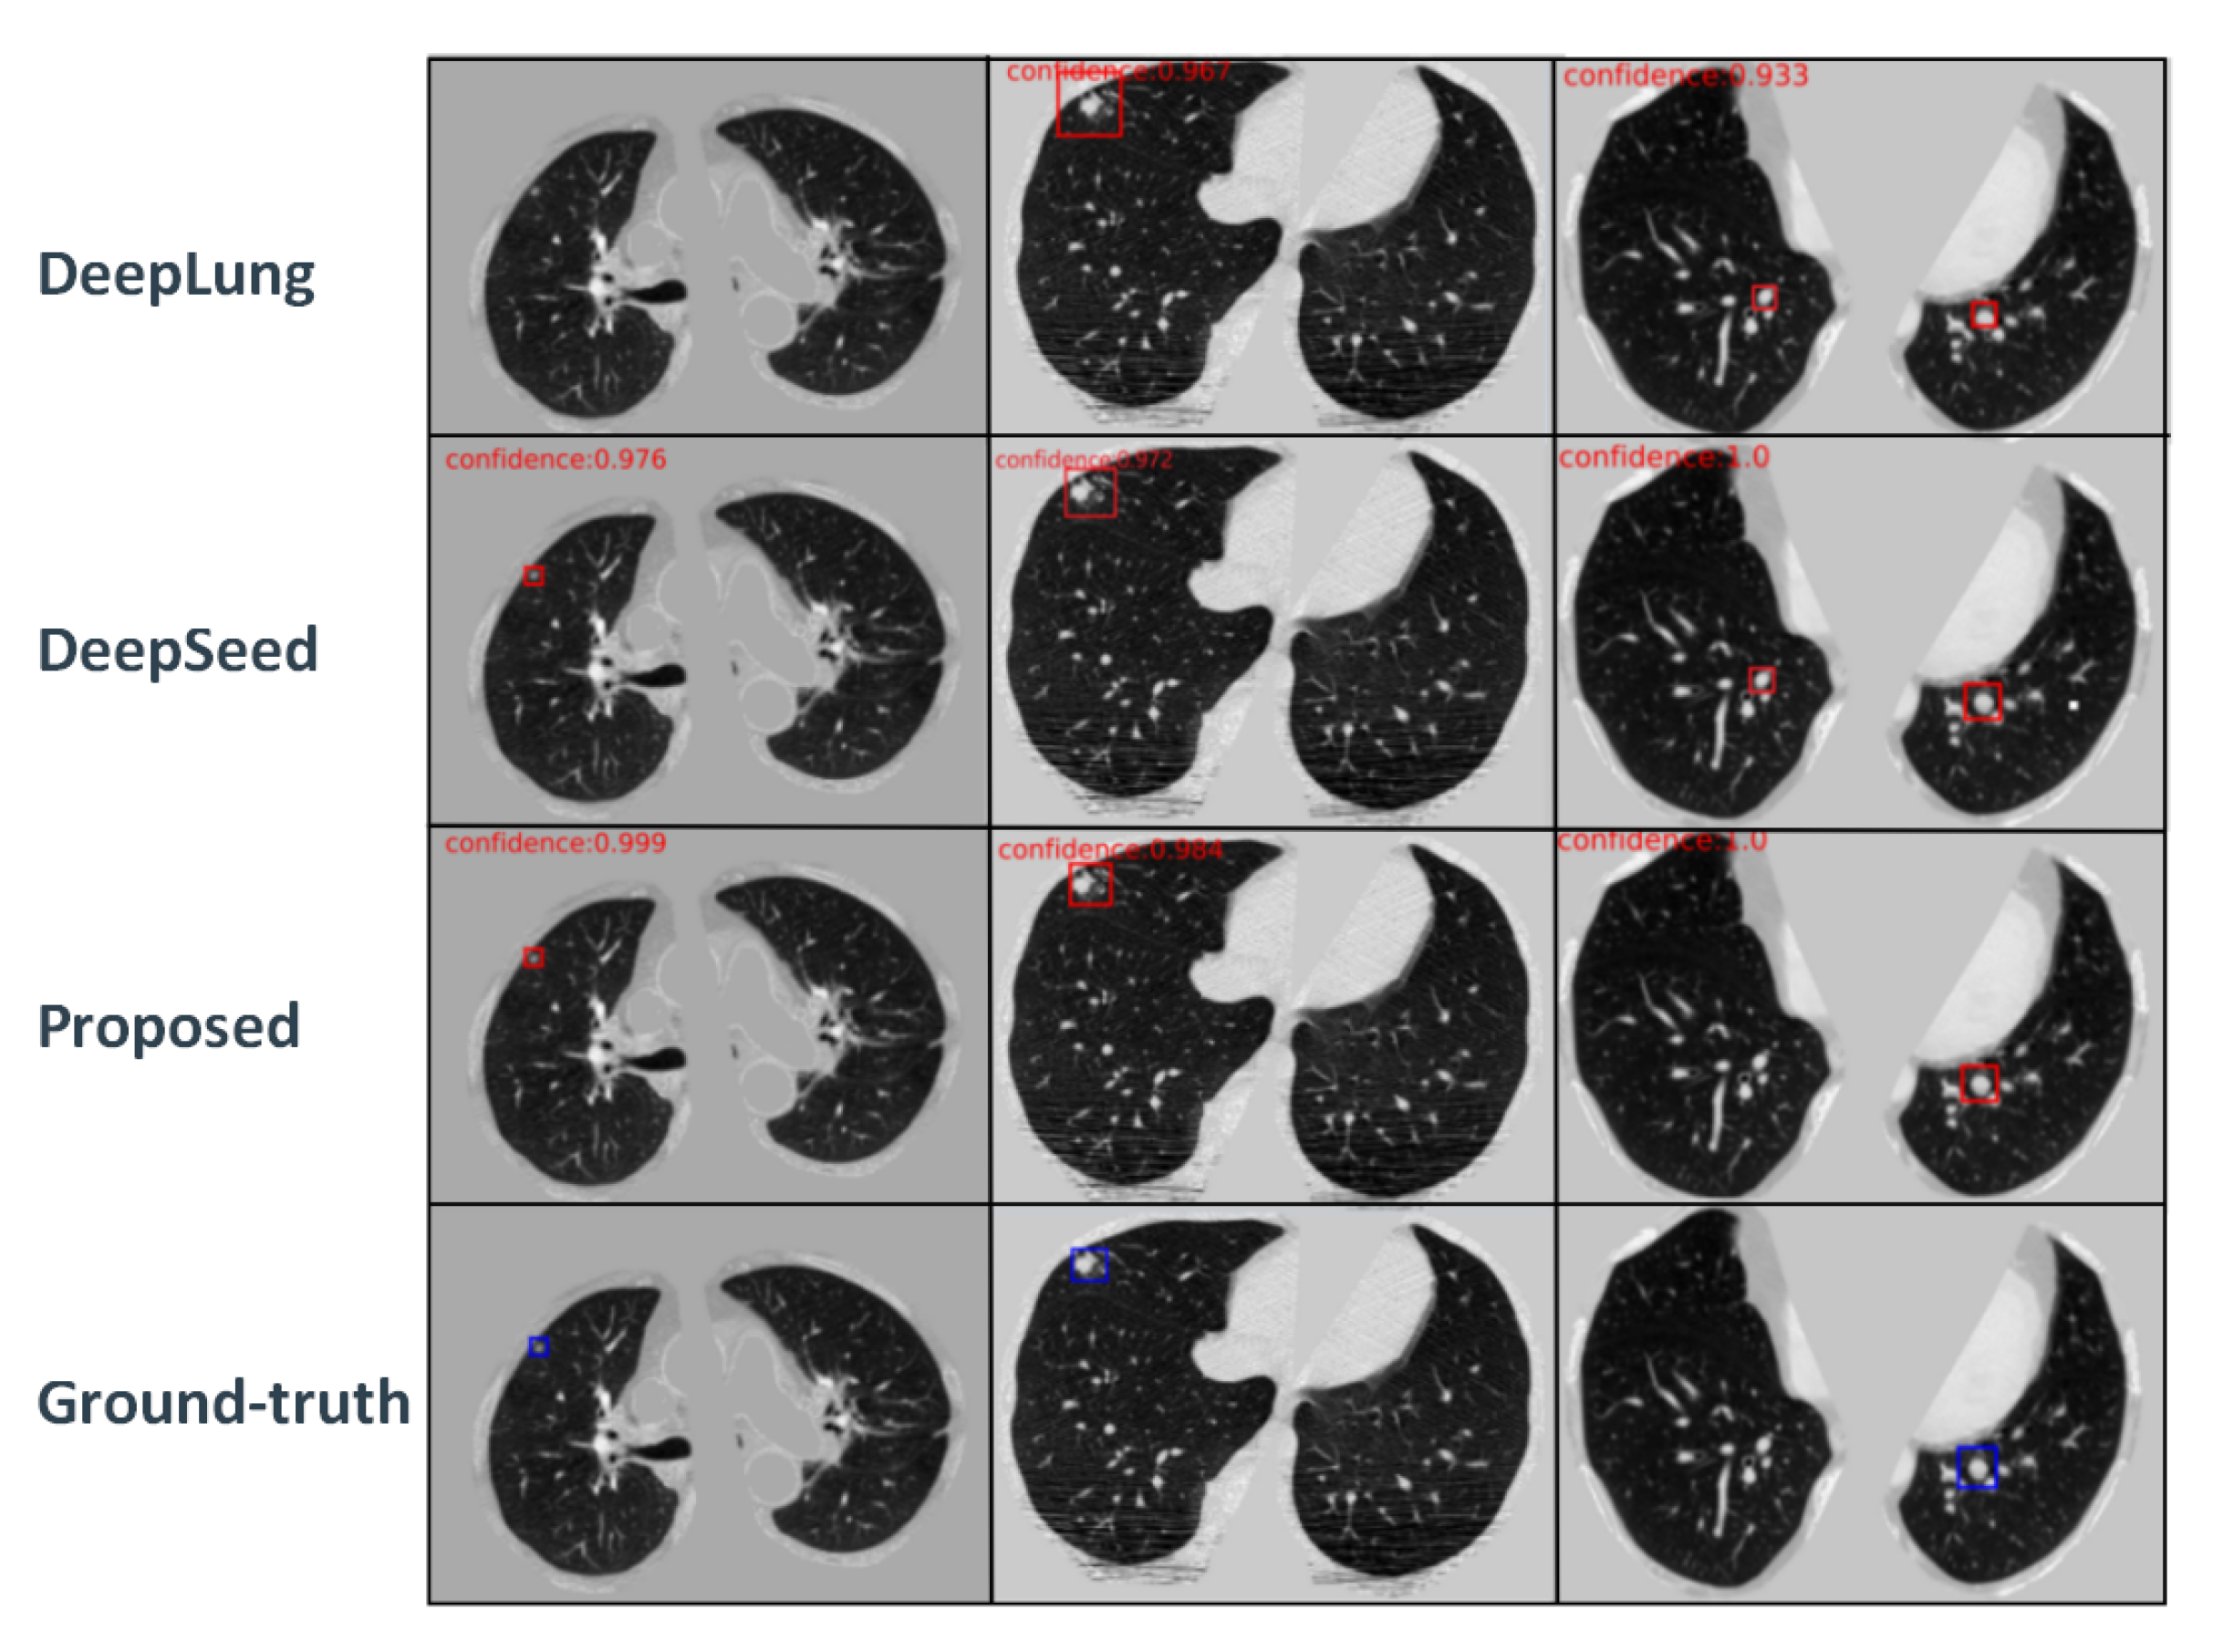
3.3.1. Performance of Different Methods under Comparison
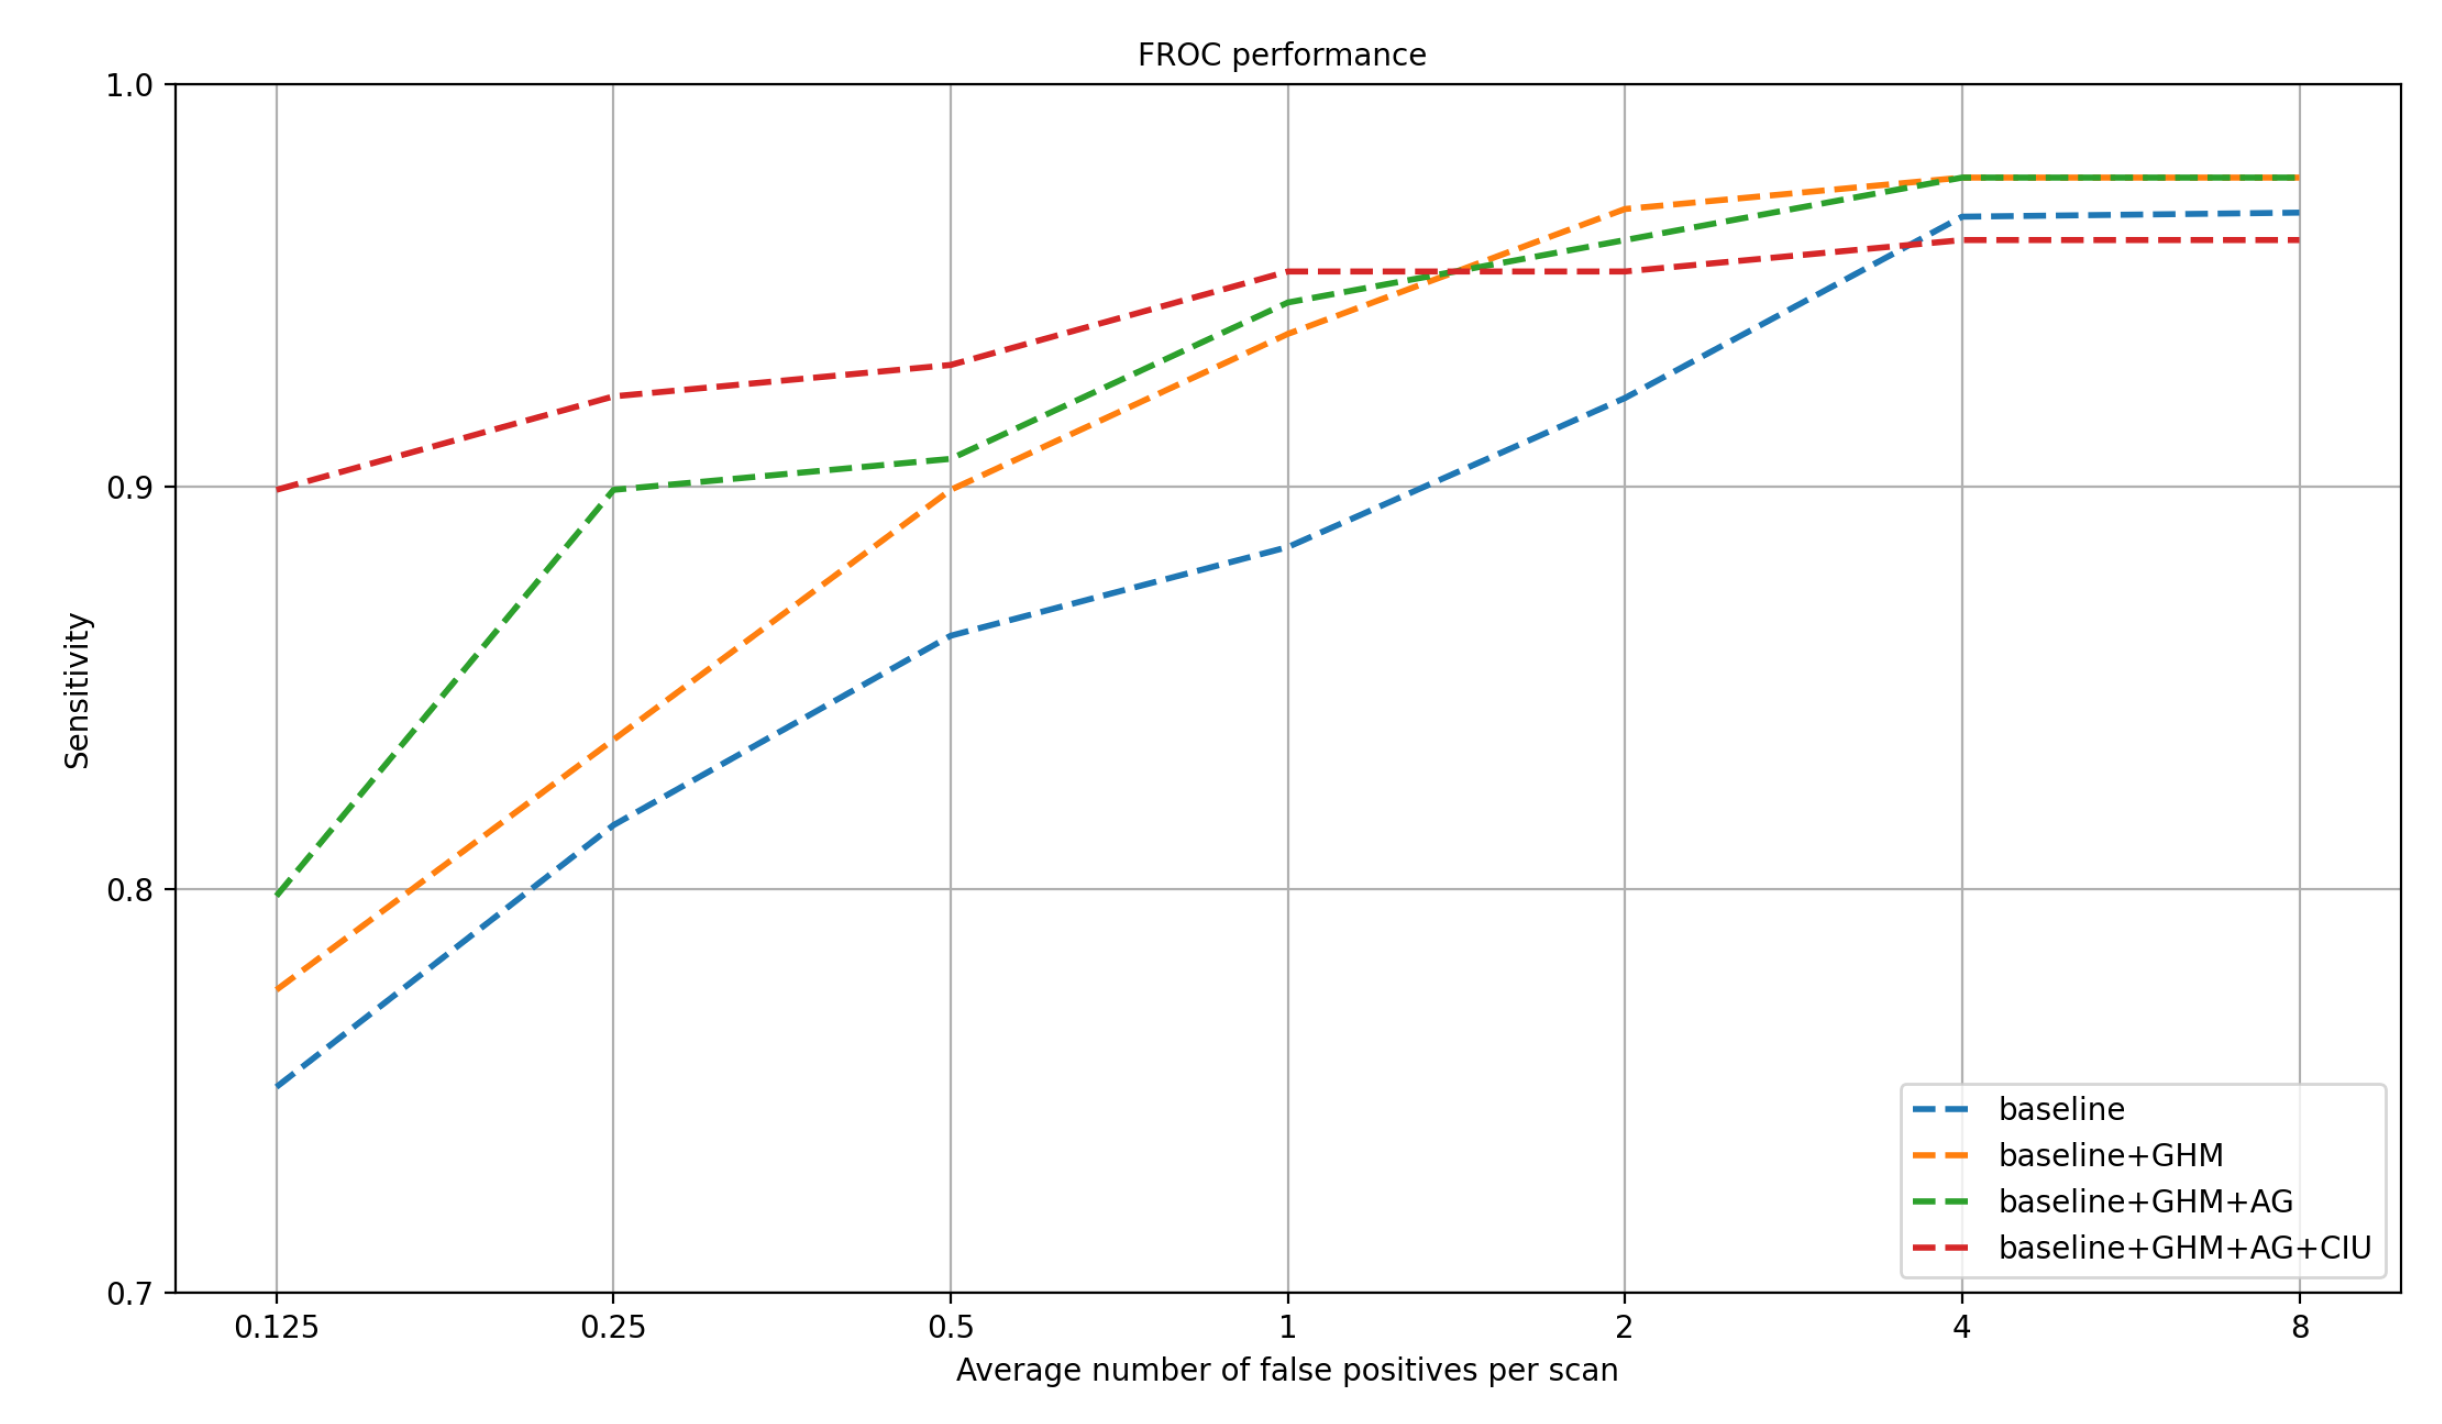
3.3.2. Ablation Studies
3.3.3. Grad-CAM Visualizations
4. Conclusions
Author Contributions
Funding
Data Availability Statement
Conflicts of Interest
References
- Jemal, A.; Siegel, R.; Xu, J.Q.; Ward, E. Cancer Statistics. CA Cancer J. Clin. 2017, 67, 7–30. [Google Scholar]
- Firmino, M.; Angelo, G.; Morais, H.; Dantas, M.R.; Valentim, R. Computer-aided detection (CADe) and diagnosis (CADx) system for lung cancer with likelihood of malignancy. Biomed. Eng. Online 2016, 15, 15–17. [Google Scholar] [CrossRef] [PubMed] [Green Version]
- Ding, J.; Li, A.; Hu, Z.; Wang, L. Accurate pulmonary nodule detection in computed tomography images using deep convolutional neural networks. In Proceedings of the International Conference on Medical Image Computing and Computer-Assisted Intervention, Quebec City, QC, Canada, 10–14 September 2017; Springer: Berlin/Heidelberg, Germany, 2017; pp. 559–567. [Google Scholar]
- Setio, A.A.; Ciompi, F.; Litjens, G.; Gerke, P.; Jacobs, C.; Van Riel, S.J.; Wille, M.M.; Naqibullah, M.; Sánchez, C.I.; Van Ginneken, B. Pulmonary nodule detection in CT images: False positive reduction using multi-view convolutional networks. IEEE Trans. Med Imaging 2016, 35, 1160–1169. [Google Scholar] [CrossRef] [PubMed]
- Cao, P.; Yang, J.; Li, W.; Zhao, D.; Zaiane, O. Ensemble-based hybrid probabilistic sampling for imbalanced data learning in lung nodule CAD. Comput. Med. Imaging Graph. 2014, 38, 137–150. [Google Scholar] [CrossRef] [PubMed]
- Dou, Q.; Chen, H.; Yu, L.; Qin, J.; Heng, P.A. Multilevel contextual 3-D CNNs for false positive reduction in pulmonary nodule detection. IEEE Trans. Biomed. Eng. 2017, 64, 1558–1567. [Google Scholar] [CrossRef] [PubMed]
- Kang, G.; Liu, K.; Hou, B.; Zhang, N. 3D multi-view convolutional neural networks for lung nodule classification. PLoS ONE 2017, 12, e0188290. [Google Scholar] [CrossRef] [PubMed] [Green Version]
- Liu, J.; Cao, L.; Akin, O.; Tian, Y. 3DFPN-HS2: 3D Feature Pyramid Network Based High Sensitivity and Specificity Pulmonary Nodule Detection; Springer: Cham, Switzerland, 2019. [Google Scholar]
- Mps, A.; Tv, B. Multiscale CNN with compound fusions for false positive reduction in lung nodule detection—ScienceDirect. Artif. Intell. Med. 2021, 113, 102017. [Google Scholar]
- Zhu, W.; Liu, C.; Fan, W.; Xie, X. Deeplung: Deep 3D dual path nets for automated pulmonary nodule detection and classification. In Proceedings of the 2018 IEEE Winter Conference on Applications of Computer Vision (WACV), Lake Tahoe, NV, USA, 12–15 March 2018; pp. 673–681. [Google Scholar]
- Khosravan, N.; Bagci, U. S4ND: Single-shot single-scale lung nodule detection. In Proceedings of the International Conference on Medical Image Computing and Computer-Assisted Intervention, Granada, Spain, 16–20 September 2018; pp. 794–802. [Google Scholar]
- Li, Y.; Fan, Y. DeepSEED: 3D Squeeze-and-Excitation Encoder-Decoder Convolutional Neural Networks for Pulmonary Nodule Detection. In Proceedings of the 2020 IEEE 17th International Symposium on Biomedical Imaging, Iowa City, IA, USA, 3–7 April 2020; pp. 1866–1869. [Google Scholar]
- Shi, Y.; Li, H.; Zhang, H.; Wu, Z.; Ren, S. Accurate and Efficient LIF-Nets for 3D Detection and Recognition. IEEE Access 2020, 8, 98562–98571. [Google Scholar] [CrossRef]
- Oktay, O.; Schlemper, J.; Folgoc, L.L.; Lee, M.; Heinrich, M.; Misawa, K.; Mori, K.; McDonagh, S.; Hammerla, N.Y.; Kainz, B.; et al. Attention U-Net: Learning Where to Look for the Pancreas. arXiv 2018, arXiv:1804.03999. [Google Scholar]
- Vaswani, A.; Shazeer, N.; Parmar, N.; Uszkoreit, J.; Jones, L.; Gomez, A.N.; Kaiser, Ł.; Polosukhin, I. Attention is all you need. Adv. Neural Inf. Process. Syst. 2017, 30, 5998–6008. [Google Scholar]
- Devlin, J.; Chang, M.W.; Lee, K.; Toutanova, K. BERT: Pre-training of Deep Bidirectional Transformers for Language Understanding. arXiv 2018, arXiv:1810.04805. [Google Scholar]
- Zhu, X.; Su, W.; Lu, L.; Li, B.; Dai, J. Deformable DETR: Deformable Transformers for End-to-End Object Detection. arXiv 2020, arXiv:2010.04159. [Google Scholar]
- Li, X.; Zhou, T.; Li, J.; Zhou, Y.; Zhang, Z. Group-Wise Semantic Mining for Weakly Supervised Semantic Segmentation. arXiv 2020, arXiv:2012.05007. [Google Scholar]
- Zhou, T.; Wang, S.; Zhou, Y.; Yao, Y.; Li, J.; Shao, L. Motion-Attentive Transition for Zero-Shot Video Object Segmentation. IEEE Trans. Image Process. 2020, 34, 13066–13073. [Google Scholar] [CrossRef]
- Zhou, T.; Wang, W.; Qi, S.; Ling, H.; Shen, J. Cascaded Human-Object Interaction Recognition. In Proceedings of the IEEE/CVF Conference on Computer Vision and Pattern Recognition, Seattle, WA, USA, 13–19 June 2020. [Google Scholar]
- He, K.; Zhang, X.; Ren, S.; Sun, J. Deep Residual Learning for Image Recognition. In Proceedings of the 2016 IEEE Conference on Computer Vision and Pattern Recognition (CVPR), Las Vegas, NV, USA, 27–30 June 2016; pp. 770–778. [Google Scholar]
- Liao, F.; Liang, M.; Li, Z.; Hu, X.; Song, S. Evaluate the Malignancy of Pulmonary Nodules Using the 3D Deep Leaky Noisy-or Network. IEEE Trans. Neural Netw. Learn. Syst. 2019, 30, 3484–3495. [Google Scholar] [CrossRef] [PubMed] [Green Version]
- Ioffe, S.; Szegedy, C. Batch Normalization: Accelerating Deep Network Training by Reducing Internal Covariate Shift. In Proceedings of the International Conference on Machine Learning, Lille, France, 6–11 July 2015. [Google Scholar]
- Chen, Y.; Dai, X.; Liu, M.; Chen, D.; Yuan, L.; Liu, Z. Dynamic ReLU. arXiv 2020, arXiv:2003.10027. [Google Scholar]
- He, K.; Zhang, X.; Ren, S.; Sun, J. Delving Deep into Rectifiers: Surpassing Human-Level Performance on ImageNet Classification. In Proceedings of the IEEE International Conference on Computer Vision, Washington, DC, USA, 7–13 December 2015. [Google Scholar]
- Jie, H.; Li, S.; Gang, S.; Albanie, S. Squeeze-and-excitation networks. In Proceedings of the 2018 IEEE/CVF Conference on Computer Vision and Pattern Recognition, Salt Lake City, UT, USA, 18–23 June 2018; pp. 7132–7141. [Google Scholar]
- Wang, Q.; Wu, B.; Zhu, P.; Li, P.; Hu, Q. ECA-Net: Efficient Channel Attention for Deep Convolutional Neural Networks. In Proceedings of the 2020 IEEE/CVF Conference on Computer Vision and Pattern Recognition (CVPR), Seattle, WA, USA, 13–19 June 2020; pp. 11531–11539. [Google Scholar]
- Li, B.; Liu, Y.; Wang, X. Gradient Harmonized Single-stage Detector. arXiv 2018, arXiv:1811.05181. [Google Scholar] [CrossRef]
- Setio, A.A.; Traverso, A.; De Bel, T.; Berens, M.S.; Van Den Bogaard, C.; Cerello, P.; Chen, H.; Dou, Q.; Fantacci, M.E.; Geurts, B.; et al. Validation, comparison, and combination of algorithms for automatic detection of pulmonary nodules in computed tomography images: The luna16 challenge. Med. Image Anal. 2017, 42, 1–13. [Google Scholar] [CrossRef] [PubMed] [Green Version]
- Liu, W.; Anguelov, D.; Erhan, D.; Szegedy, C.; Reed, S.; Fu, C.Y.; Berg, A.C. Ssd: Single shot multibox detector. In Proceedings of the European Conference on Computer Vision, Amsterdam, The Netherlands, 11–14 October 2016; pp. 21–37. [Google Scholar]
- Gong, Z.; Li, D.; Lin, J.; Zhang, Y.; Lam, K.M. Towards Accurate Pulmonary Nodule Detection by Representing Nodules as Points With High-Resolution Network. IEEE Access 2020, 8, 157391–157402. [Google Scholar] [CrossRef]
- Selvaraju, R.R.; Cogswell, M.; Das, A.; Vedantam, R.; Parikh, D.; Batra, D. Grad-cam: Visual explanations from deep networks via gradient-based localization. In Proceedings of the IEEE Conference on Computer Vision and Pattern Recognition, Honolulu, HI, USA, 21–26 July 2017; pp. 618–626. [Google Scholar]


| Encoder | Weights | Output |
| preblock | ||
| resblock1 | ||
| maxpooling | ||
| resblock2 | ||
| maxpooling | ||
| resblock3 | ||
| maxpooling | ||
| resblock4 | ||
| maxpooling | ||
| Decoder | Weights | Output |
| deconvolution1+concat | ||
| resblock5 | ||
| deconvolution2+concat | ||
| resblock6 | ||
| CIU | ||
| detection head |
| FROC | 0.125 | 0.25 | 0.5 | 1 | 2 | 4 | 8 | CPM |
|---|---|---|---|---|---|---|---|---|
| 3D FPN [22] | 0.662 | 0.746 | 0.815 | 0.864 | 0.902 | 0.918 | 0.932 | 0.834 |
| DeepLung [10] | 0.692 | 0.769 | 0.824 | 0.865 | 0.893 | 0.917 | 0.933 | 0.842 |
| DeepSeed [12] | 0.739 | 0.803 | 0.858 | 0.888 | 0.907 | 0.916 | 0.920 | 0.862 |
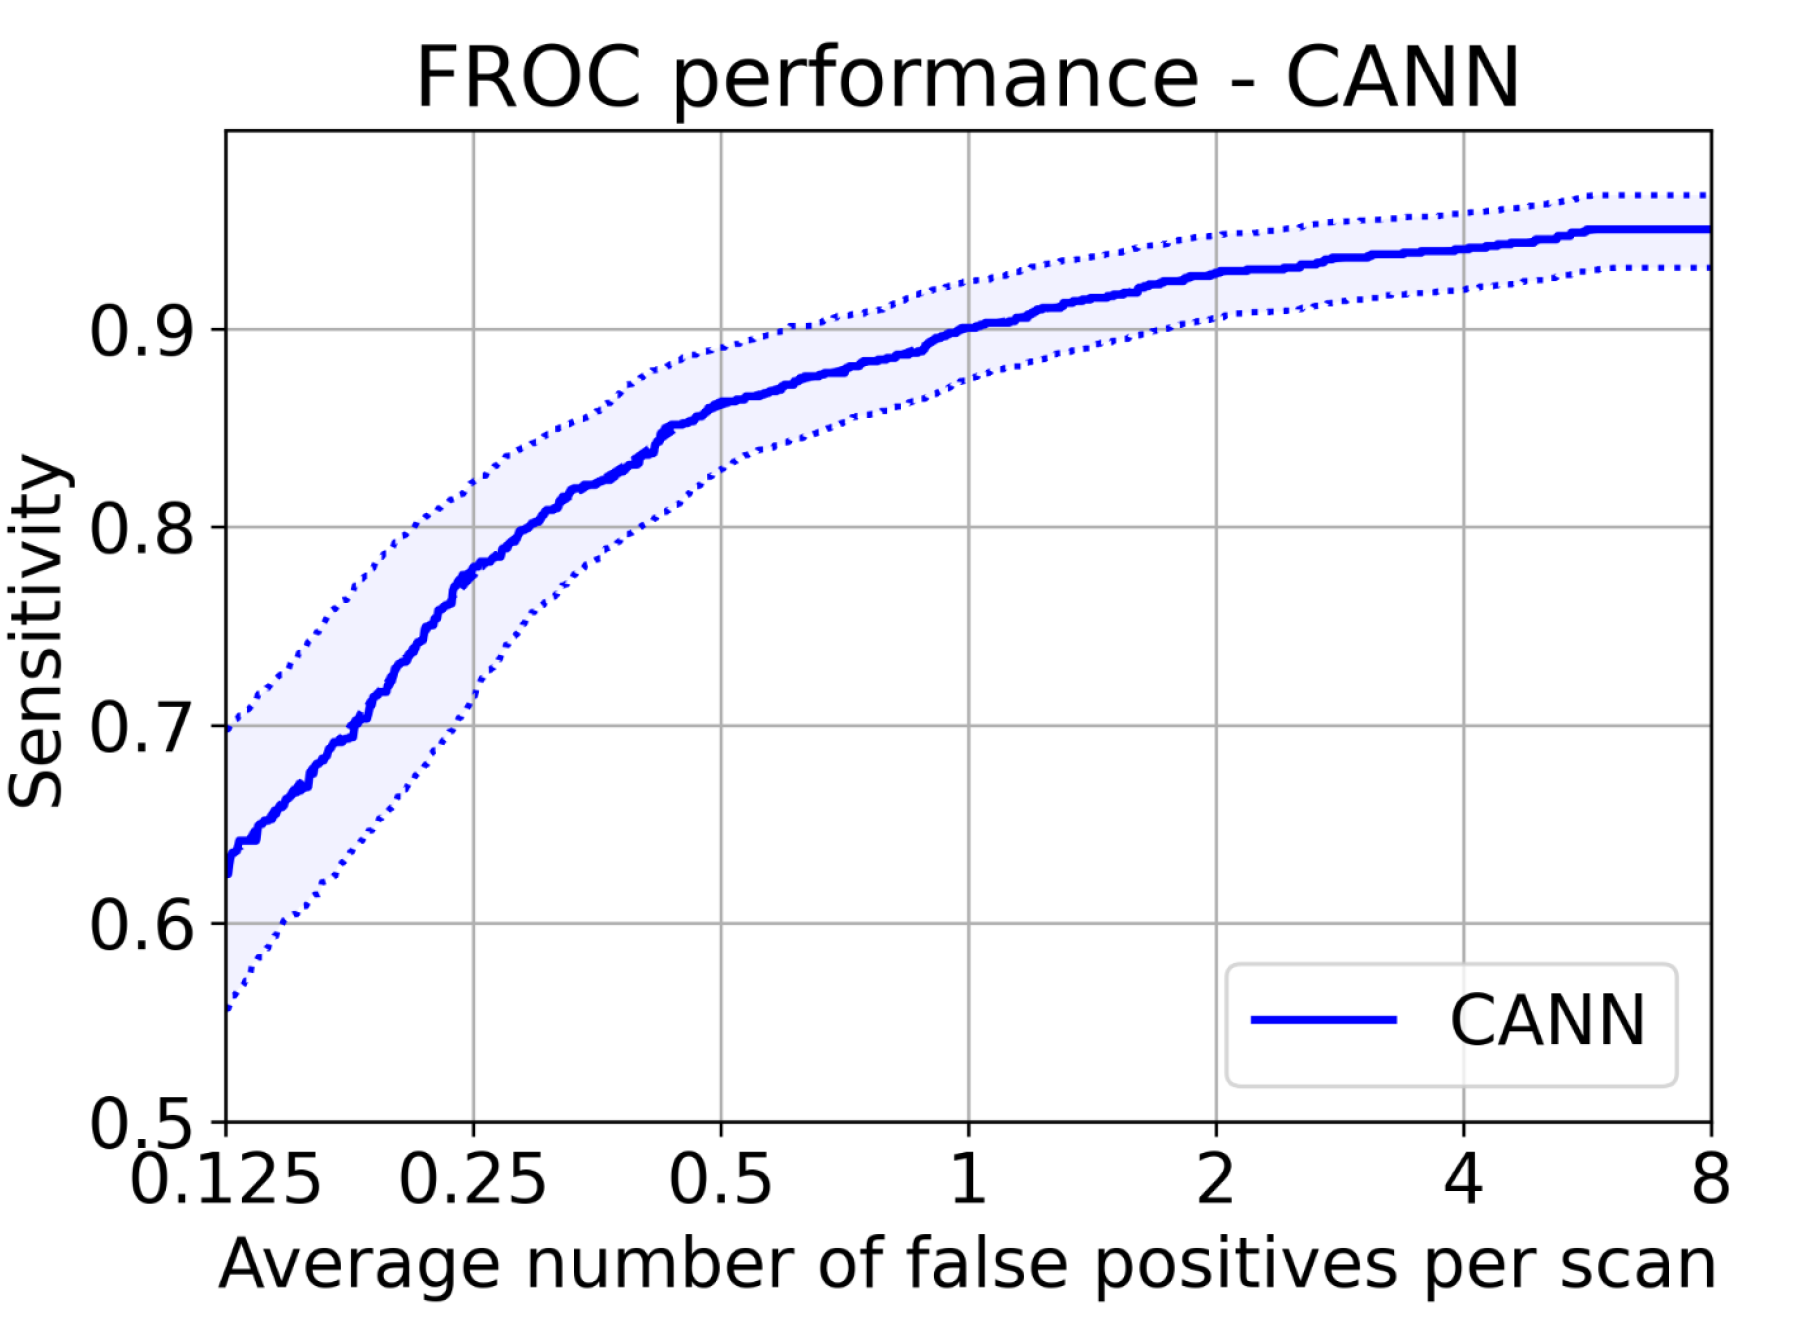
| Proposed | 0.782 | 0.834 | 0.893 | 0.917 | 0.932 | 0.952 | 0.956 | 0.895 |
| Model | Number of Parameters | Sensitivity % |
|---|---|---|
| 2D SSD [30] | 59,790,787 | 77.8 |
| 2D Dense Avepool [11] | 67,525,635 | 84.8 |
| 2D Dense Maxpool [11] | 67,525,635 | 87.5 |
| 3D DCNN [3] | 11,720,032 | 94.6 |
| Proposed | 6,282,970 | 95.0 |
| FPs/Scan | 0.125 | 0.25 | 0.5 | 1 | 2 | 4 | 8 | CPM |
|---|---|---|---|---|---|---|---|---|
| Baseline | 0.751 | 0.816 | 0.863 | 0.885 | 0.922 | 0.967 | 0.968 | 0.882 |
| Baseline + GHM | 0.775 | 0.837 | 0.899 | 0.938 | 0.969 | 0.977 | 0.977 | 0.910 |
| Baseline + GHM + AG | 0.798 | 0.899 | 0.907 | 0.946 | 0.961 | 0.977 | 0.977 | 0.924 |
| Baseline + GHM + AG + CIU | 0.899 | 0.922 | 0.930 | 0.953 | 0.953 | 0.961 | 0.961 | 0.940 |
| FPs/Scan | 0.125 | 0.25 | 0.5 | 1 | 2 | 4 | 8 | CPM |
|---|---|---|---|---|---|---|---|---|
| Baseline | 0.761 | 0.780 | 0.828 | 0.866 | 0.895 | 0.924 | 0.924 | 0.855 |
| Baseline + AG1 | 0.676 | 0.781 | 0.857 | 0.905 | 0.914 | 0.924 | 0.924 | 0.860 |
| Baseline + AG2 | 0.752 | 0.800 | 0.838 | 0.886 | 0.914 | 0.943 | 0.943 | 0.869 |
| Baseline + AG1 + AG2 | 0.762 | 0.790 | 0.895 | 0.914 | 0.914 | 0.933 | 0.943 | 0.879 |
Publisher’s Note: MDPI stays neutral with regard to jurisdictional claims in published maps and institutional affiliations. |
© 2022 by the authors. Licensee MDPI, Basel, Switzerland. This article is an open access article distributed under the terms and conditions of the Creative Commons Attribution (CC BY) license (https://creativecommons.org/licenses/by/4.0/).
Share and Cite
Zhu, X.; Wang, X.; Shi, Y.; Ren, S.; Wang, W. Channel-Wise Attention Mechanism in the 3D Convolutional Network for Lung Nodule Detection. Electronics 2022, 11, 1600. https://doi.org/10.3390/electronics11101600
Zhu X, Wang X, Shi Y, Ren S, Wang W. Channel-Wise Attention Mechanism in the 3D Convolutional Network for Lung Nodule Detection. Electronics. 2022; 11(10):1600. https://doi.org/10.3390/electronics11101600
Chicago/Turabian StyleZhu, Xiaoyu, Xiaohua Wang, Yueting Shi, Shiwei Ren, and Weijiang Wang. 2022. "Channel-Wise Attention Mechanism in the 3D Convolutional Network for Lung Nodule Detection" Electronics 11, no. 10: 1600. https://doi.org/10.3390/electronics11101600
APA StyleZhu, X., Wang, X., Shi, Y., Ren, S., & Wang, W. (2022). Channel-Wise Attention Mechanism in the 3D Convolutional Network for Lung Nodule Detection. Electronics, 11(10), 1600. https://doi.org/10.3390/electronics11101600