1. Introduction
With the rapid advancement of technology, the popularization of 5G communications in recent years has greatly promoted the development of social media, and the scale of online social networks and the number of users have grown rapidly. According to Internet World Statistics (IWS) data, as of 31 December 2020, there have been more than 5 billion Internet users worldwide, an increase of 1300% in the past 20 years [
1]. Moreover, according to the 47th “Statistical Report on China’s Internet Development Status” released by the China Internet Network Information Center (CNNIC) on 3 February 2021, as of December 2020, the number of Chinese Internet users has reached 989 million [
2]. The Global Mobile Suppliers Association (GSA) also released the latest statistics on 5G networks. As of April 2021, 162 commercial 5G networks have been launched worldwide [
3]. As a social network containing many nodes and intricate relationships between nodes, there is an obvious community structure within it. This increase in scale has led to an increase in the complexity of the community structure in social networks. Due to the rise in the Internet of Things, various mobile devices that people carry with them, such as mobile phones, notebooks, and smartwatches [
4,
5], can be regarded as social nodes in social networks [
6], increasing the complexity of the community. As a result, the cost of selecting the target transmission node increases. Therefore, research on data transmission in complex social networks has great theoretical significance and application value.
In recent years, an opportunistic network based on the Delay Tolerant network (DTN) and Mobile Ad-Hoc network (MANET) has provided a better solution to the complex social networks’ data transmission problem. As an intermittently connected network, the main difference between opportunistic networks and traditional multi-hop wireless networks, such as DTN and Ad Hoc, is that they do not have an end-to-end path [
7], instead realizing the communication between nodes via the routing mode of “storage-carry-forward” [
8]. In previous opportunistic social networks, information transmission mainly relied on one or two source nodes, but under the 5G communication standard, the data are large, and the transmission speed is fast [
9,
10], resulting in an excessive overhead and insufficient cache for these nodes. There are not enough resources to maintain the calculation, selection, and tracking of the target transmission node [
11,
12,
13,
14].
Current research on opportunistic networks has mainly focused on the improvement of routing algorithms. Traditional opportunistic network routing algorithms mostly only consider the topological relationship of nodes (link prediction based on existing nodes and their connection attributes) but do not consider the social relationship between people in real social networks [
7,
15]. Therefore, it is challenging to effectively use the traditional socialist network in real social networks. Even some of the current routing algorithms only quantify part of the characteristic social attributes, which is one-sided. In addition, because there is no stable connection link between the opportunistic network nodes, it is easy to cause delays by relying on meeting to achieve data forwarding. In this case, the information-carrying node will cause a high cost due to long-term data storage, making it difficult for nodes with limited resources to update information on time, which ultimately degrades the network’s overall performance [
16,
17,
18,
19].
Therefore, this paper proposed a link prediction model based on the triangle relationship (LPMBT) in opportunistic social networks to solve the above problems. This algorithm scores links based on the frequency of nodes using links in the social networks’ topological structure. An optimal relay node is selected to efficiently track the target node and reconstruct the sub-community based on the score. The optimal relay node selection can reduce redundant data in social networks, reduce unnecessary resource overhead, and effectively improve the data transmission efficiency.
The main contributions of this article are as follows:
An effective link prediction model was proposed for routing and forwarding. The link is scored based on the frequency, and the optimal relay node is selected according to the score. This algorithm avoids the unnecessary data transmission, reduces the data transmission overhead in opportunistic networks, and improves the tracking target nodes’ efficiency and accuracy.
In the link prediction algorithm, the graph structure is introduced, and the sub-community is reconstructed according to the special sub-graph. According to the new link obtained from the prediction of the subgraph’s evolution, the subcommunity is selected for the data transmission.
According to the simulation experimental results, compared with the three routing algorithms of the Spray and Wait algorithm, EIMCT, and ICMT, the model proposed in this paper shows good performance in improving the data transmission efficiency and reducing the overhead. It also has stable performance in different environments.
This paper discusses the problem of target node tracking and sub-community reconstruction in opportunistic social networks. The second section presents the related work, the third section presents the model design, the fourth section presents the simulation experiments, and the fifth section presents the conclusions and prospects.
2. Related Work
At present, scholars around the world have conducted many studies on opportunistic networks, mainly on the design of routing algorithms. After years of improvement and expansion, various routing algorithms can be flexibly used in various fields. Some routing algorithms and link prediction algorithms used in opportunistic networks are as follows.
Vahdat et al. [
20] proposed an Epidemic routing algorithm that uses node encounters to transmit information, guaranteeing a 100% data transfer between nodes when they meet. However, this flood-based routing mechanism has too much overhead in terms of bandwidth and cache space. During actual use, limited network resources also bear a large amount of redundant information, which is likely to cause congestion and reduce network performance. After improvement, Rango et al. [
21] proposed an n-Epidemic routing algorithm, which provides a method to manage n parameters dynamically. Considering the degree of energy dissipation of node movement can increase or decrease the amount of the network’s data dissemination.
Lindgren et al. [
22] proposed a routing algorithm called ProPHET. Compared with the Epidemic routing algorithm, ProPHET proposed a new index: delivery probability. Nodes deliver their own predictive capabilities when they meet, to a certain extent, to avoid the extra overhead caused by blindly transmitting data in the Epidemic routing algorithm, but it does not consider the duration of node encounters. Duan et al. [
23] proposed an improved PRoPHET algorithm based on connection time. The algorithm considers the duration of the encounter and uses it as an influencing factor of the predicted value of delivery to improve the prediction accuracy.
Wang et al. [
24] innovatively proposed a dynamic Spray and Wait routing algorithm based on the improved Epidemic routing algorithm. This algorithm has two stages: (1) Spraying stage: the source node produces several copies and sprays them on the social network. (2) Waiting stage: waiting for the copy to be transmitted to the target node. This algorithm’s message transmission efficiency is high, which improves some of the shortcomings of the Epidemic algorithm based on the flooding mechanism. However, the large number of copies sprayed on the network will still cause redundancy. Huang et al. [
25] proposed a Spray and Wait algorithm based on social network location prediction. The algorithm makes full use of node movement information to predict the possible future locations of relay nodes and forwards the copy to a relay closer to the target node. This algorithm speeds up the message transmission and effectively reduces the message delay in the waiting phase.
Yu et al. [
26] proposed a node social features relationship evaluation algorithm (NSFRE), which builds a fuzzy similarity matrix based on the characteristics of the node characteristics and social attributes, and selects the forwarding node based on the weight. It can effectively improve the transmission success rate and reduce the transmission delay. Burgess et al. [
27] proposed an effective MaxProp routing algorithm, which schedules the data packets to be transmitted and the data packets to be discarded according to the priority. This algorithm effectively reduces the overhead and improves the transmission efficiency. Abdali and Sammou [
28] proposed the combination of the MaxProp routing protocol with the custody transfer (custody transfer) [
29,
30] model, using nodes as the common carrier of information between networks. The algorithm combines control routing technology and technical routing prediction, and it also performs better.
Lichtenwalter et al. [
31] proposed a link prediction algorithm based on the substructure of social network graphs, also known as the vertex collocation profile (VCP), which retains as much information about the source and target vertices as possible. The algorithm can also encode various additional information, so it has a high practicability and versatility. Gong et al. [
32] proposed a link prediction method based on a restricted Boltzmann machine, which improves the accuracy of link prediction through a feature conversion method that simplified the original features. Fadaee et al. [
33] proposed a supervised and structured link prediction algorithm, which predicts the new link between two consecutive social network snapshots by finding the triple evolution model within a specific time interval.
Based on the above research and problems, this paper proposed a link prediction model based on the triangle relationship in the opportunity social network (LPMBT), which can be used to solve problems such as low data transmission efficiency and high cost in complex social networks. Theoretically, it can improve the delivery ratio in the opportunity social network, and it also can reduce the delay and overhead.
3. System Model
3.1. Link Prediction Model Design
3.1.1. Modeling Steps
In this paper, we designed a link prediction algorithm for routing and forwarding. The algorithm predicts links based on the mobile nodes’ movement behavior (usually people carrying mobile devices) in the community. In an opportunistic social network, nodes will meet other nodes and forward information during their movement. In this case, the weight of the path that the node moves from the source node to the information interaction node increases. The increase in weight is proportional to the amount and quality of the data obtained. The weight shows the coordination mechanism between nodes in the social process, enabling other nodes to find the optimal path to obtain information faster, and to track the transmission target node as quickly as possible to complete the community structure reconfiguration. This article used this algorithm to model the research problem and design a link prediction model based on triangulation (LPMBT), which mainly contained the following three steps:
Step 1: Set the probability,
, of a person/mobile device
k from node
i to node
j in the social network graph, as shown in Equation (1).
where
wij is the weight of the corresponding path,
cij is the cost of moving from node
i to node
j, Ni is the set of critical points of node
i, and the coefficients α and β are the basic parameters of the model. This model assumes that all edges in the social network graph have initial weights.
Step 2: The optimal solution to the problem is that the target node must obtain information. The link where people obtain information will increase the weight, as shown in Equations (2) and (3).
where
Lk is the path traversed by the person/mobile device
k from the starting point to the information source, the length is
ck, and
t is the total number of existing people, which indicates the search for the shortest path from the starting point to the information source. Assuming that each edge’s weight will gradually decrease, and the more the path is traversed, the greater the weight.
Step 3: Analyze the reduction mechanism of path weights, as shown in Equation (4).
where
p is the basic parameter.
This summarizes the main steps of LPMBT model modeling. Next, we introduce the model’s overall design and three core algorithms.
3.1.2. Overall Design of LPMBT Model
The LPMBT model is based on the link prediction of the subgraph’s evolution. First, we find the special subgraph (triangle relationship) in the opportunistic social network graph. Then, in the subgraph, the new link is scored based on the frequency, and the link with the highest score is the predicted one—the new link. When routing and forwarding, the new link with the highest score is always selected.
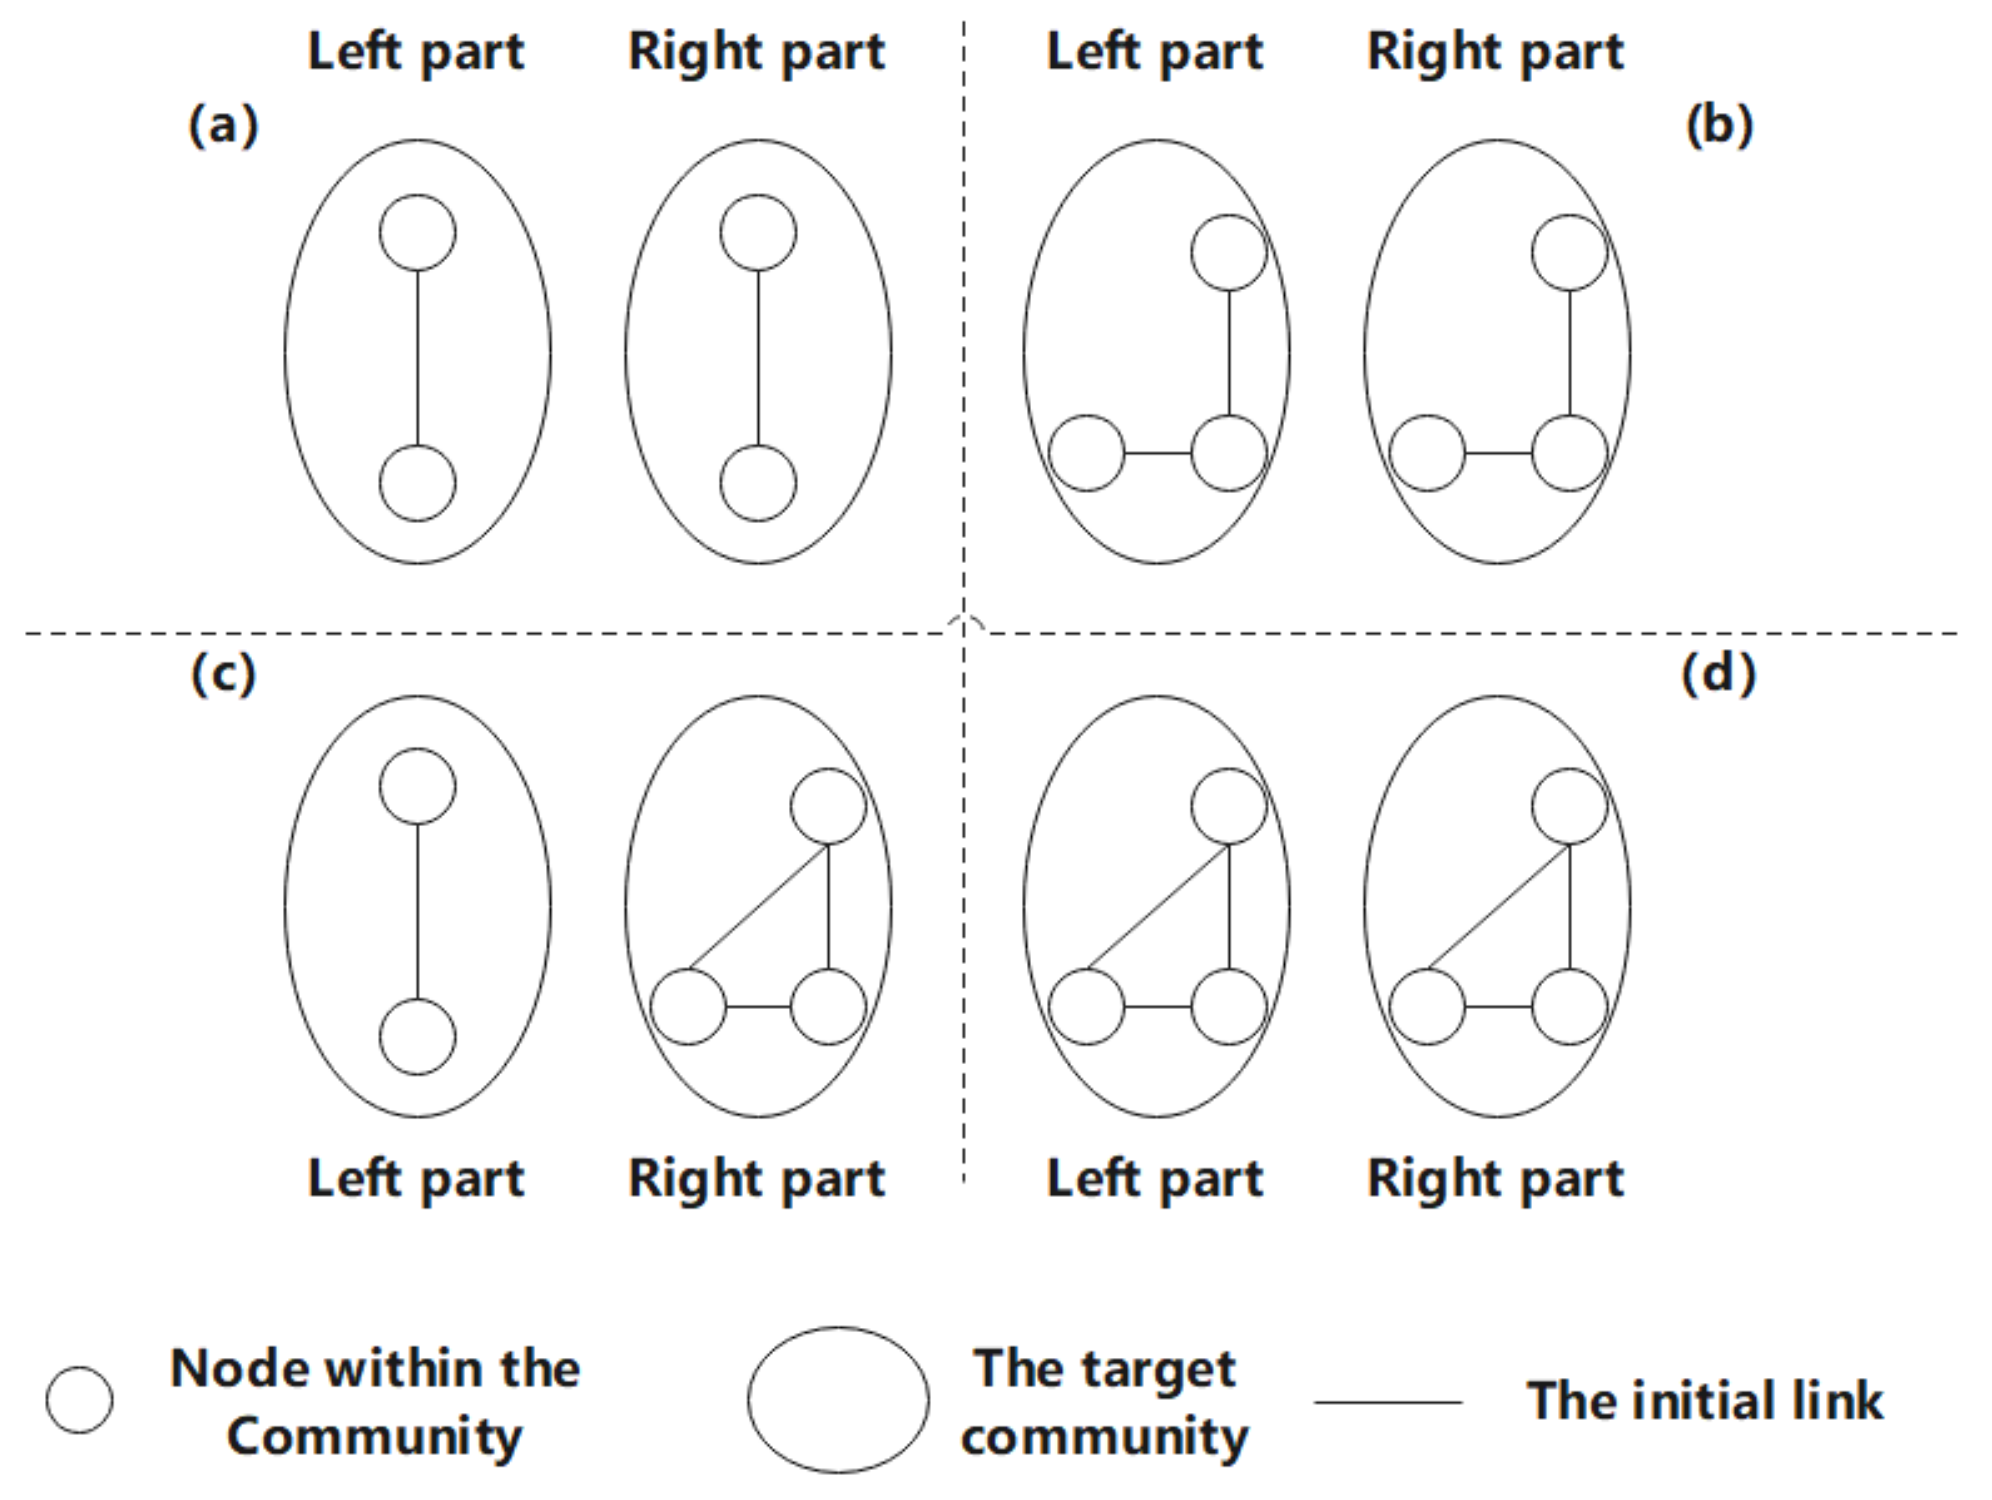
Nodes can represent each entity in the opportunistic social network, and links represent the connections between nodes. When we predict the link between the source node and the target node in the community, we must also pay attention to the correlation between the nodes due to their social attributes, such as the common interests, goals, and interests between people. In an opportunistic network, the possible correlation between a particular node and a specific community is shown in
Figure 1. Among them, to better predict the new links in the opportunity social network, more complex communities should be considered, and there are at least two nodes in each community. With the increase in the number of nodes within the community, the possibility that the source node establishes a new link with it also increases.
In
Figure 1, the number of nodes in the target social network is used to divide the hierarchy. The snapshot at time t indicates the network structure at a specific time t. The link prediction algorithm predicts the new links generated in the following snapshot based on this structure. Moreover, when predicting the possible new link between two nodes, at least one link exists between them. In
Figure 1, level 1 shows the simplest relationship. That is, only one link is generated in the target community. It can be seen from the snapshots at time t and t + 1 that no link is retained as a prediction for the following snapshot. In Level 2, the target community contains two nodes. The snapshot at time t shows the possible links between the left and right parts, and the snapshot at time t + 1 shows the links between the left and right parts of the substructure predicted by the snapshot at time t. The four situations in level 3 indicate that there are four possible links because the ownership is equal, so the homogeneous network structure that may be generated is not considered. According to the number of nodes in the network, the network motifs are usually divided into low-order motifs and high-order motifs. Generally speaking, network motifs composed of three or four nodes are usually called low-order motifs, and a network phantom with five or more nodes is called high-order motifs. This model is mainly based on the low-order sub-network motifs structure of level 4 to introduce link prediction algorithms. On the one hand, because the calculation of the high-order motif is more complicated, counting in large networks is often difficult and time-consuming to detect. On the other hand, due to the wide variety of high-level motifs structures, it is difficult to distinguish which ones are of practical significance [
34]. Therefore, in order to achieve a balance between the time complexity and the practicality of the algorithm, this article does not consider the more complex opportunistic network structure. Here, we only show the complex interactions between two sub-community entities in a certain opportunistic network as an example, as shown in
Figure 2.
For level 4 in
Figure 1, it can be seen that it was initially a node and a triangular relationship community. At time
t, two subgraphs (i) and (ii) are obtained, and the structural attributes of (i) with one less possible link are less than those of (ii). Through Huang’s experiment [
35], it can be confirmed that the more structural attributes it has, the more likely it is to predict the correct link, so (ii) has a bigger value.
Algorithm 1 obtains the sub-communities (i) and (ii) based on the snapshot of the opportunity social network at time t; it then predicts the new links that may generate at time t + 1; next, it finds the triangular relationship-like level 4 in the new opportunity social network, thereby reconstructing sub-communities (i) and (ii).
3.1.3. Positioning of the Triangle Relationship
In the process of finding the triangle relationship, we have the following conventions for each element in the modeling:
In the beginning, all people are scattered at the nodes in the opportunity social network.
Unlike algorithms in traditional opportunistic networks, people here prefer to choose paths with lower weights, that is, to explore more paths that have never been routed before in opportunistic social networks. Here, the probability of a person moving from node
i to node
j is shown in Equation (5).
where
wij is the weight of the corresponding path, and the coefficient α is the basic parameter of the model, which is set to 1. Comparing formula (1), we can see that β = 0, and it is inversely proportional to the weight value.
| Algorithm 1 LPMBT, Link prediction model based on triangulation |
| Input: Triangles (G) |
| Output: Predict path: Result ← Result + Link |
| Require: G = (V, E) |
| 1: | Load(G) |
| 2: | Triangles = Find Triangles (G) // See algorithm 2 |
| 3: | Result = null |
| 4: | n = size (Triangles) |
| 5: | i = 1 |
| 6: | While i ≤ n do |
| 7: | NewLinks = Predict (Triangles) [i] |
| 8: | For All Links ∈ NewLinks do |
| 9: | If Results contains Link Then |
| 10: | Result [Link]++ |
| 11: | Else |
| 12: | Result = Result + Link |
| 13: | End If |
| 14: | End For |
| 15: | i = i + 1 |
| 16: | End While |
| 17: | Result = Sort Descending Result |
| 18: | Return result |
| 19: | End |
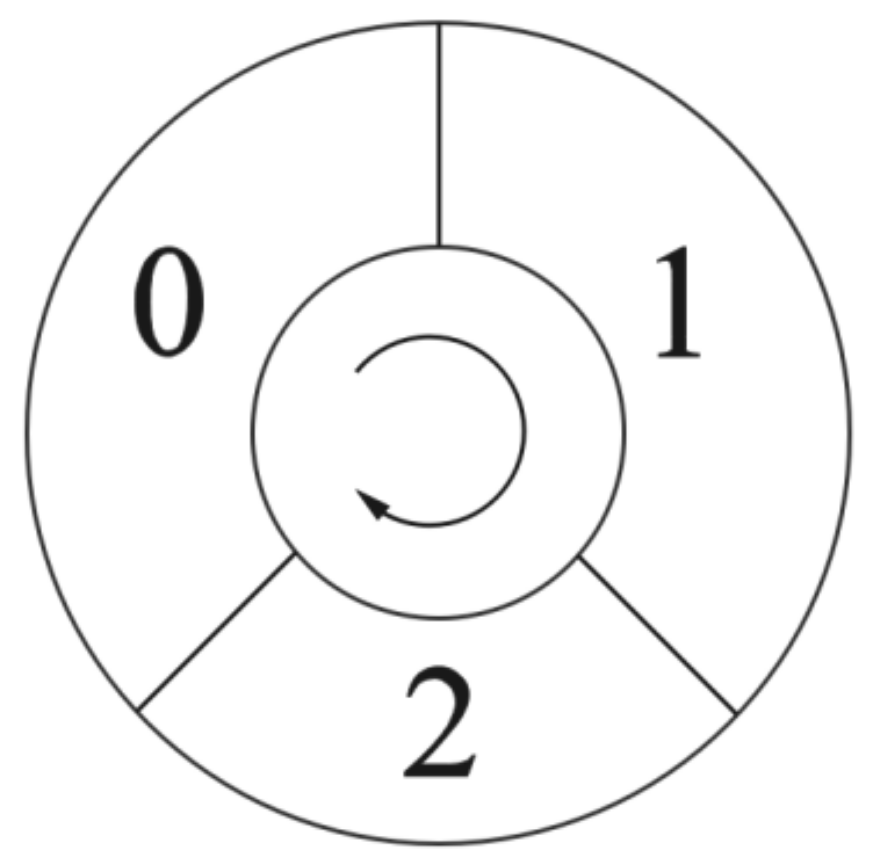
Information is expressed as a triangular relationship, so people must find the triangular relationship if they want to obtain information. As the triangle relationship is composed of three nodes, in order to store node information, we define people as having memory modules, as shown in
Figure 3, to store the passed node information (0, 1, and 2 represent the serial numbers of the three modules, and the arrow represents the order of coverage). If the current memory module is filled, it will be covered one by one according to the order of the arrow’s direction on the way. In addition, each time we obtain three new nodes, the correctness of each node is verified. If the data to be written already exist in one of the memory modules, it is considered that a triangular relationship has been found.
The initial weight a of all paths is 1. Each time a new triangle relationship is found, the weight of each path is increased by 1. If the current path belongs to an existing triangle relationship, the edge’s weight is increased by 1.
The weight of each path will not fade away over time.
People have the attribute of death, so they will not detect the visited nodes in the opportunistic social network. People will die in the following situations: they have visited all paths; they are always are in between two nodes or edge nodes.
| Algorithm 2 Find Triangles |
| Input: Unit Weignt (E) |
| Output: Triange (G) |
| Require: G = (V, E) |
| 1: | Unit Weignt (E) |
| 2: | People = Init People (V) |
| 3: | (Triangles) = null |
| 4: | PeopleNum = Numberof (People) |
| 5: | iteration = 1 |
| 6: | While 0 < iteration ≤ Max do |
| 7: | For All People ∈ People do |
| 8: | Next = ChooseNextNode() // Base on formula (5) |
| 9: | If Privious Node in Memory() == next Then |
| 10: | Triangles = Save Triangle() |
| 11: | Increase Weignt of (Triangles) |
| 12: | Triangles = Triangles + Triangle |
| 13: | Else |
| 14: | Put into Memory (Next) |
| 15: | End If |
| 16: | If Health (People) == False Then |
| 17: | Delete (People) |
| 18: | End If |
| 19: | End For |
| 20: | PeopleNum = Numberof (People) |
| 21: | Iteration ++ |
| 22: | End While |
| 23: | Return Triangles |
| 24: | End |
It can be seen from Algorithm 2 that in an opportunistic social network with n nodes, the time complexity of finding the triangle relationship is
O(n3), and the space complexity is
O(n2). According to the research of Gong et al. [
32], the lowest time complexity for finding the triangle relationship is
O(n 2.376), and the space complexity is
O(n2). For sparse graphs and low-weight graphs, the time and space complexities of current commonly used algorithms are not high, but for large nonsparse graphs, the required overhead is relatively large.
3.1.4. Link Prediction Based on Triangle Relationship
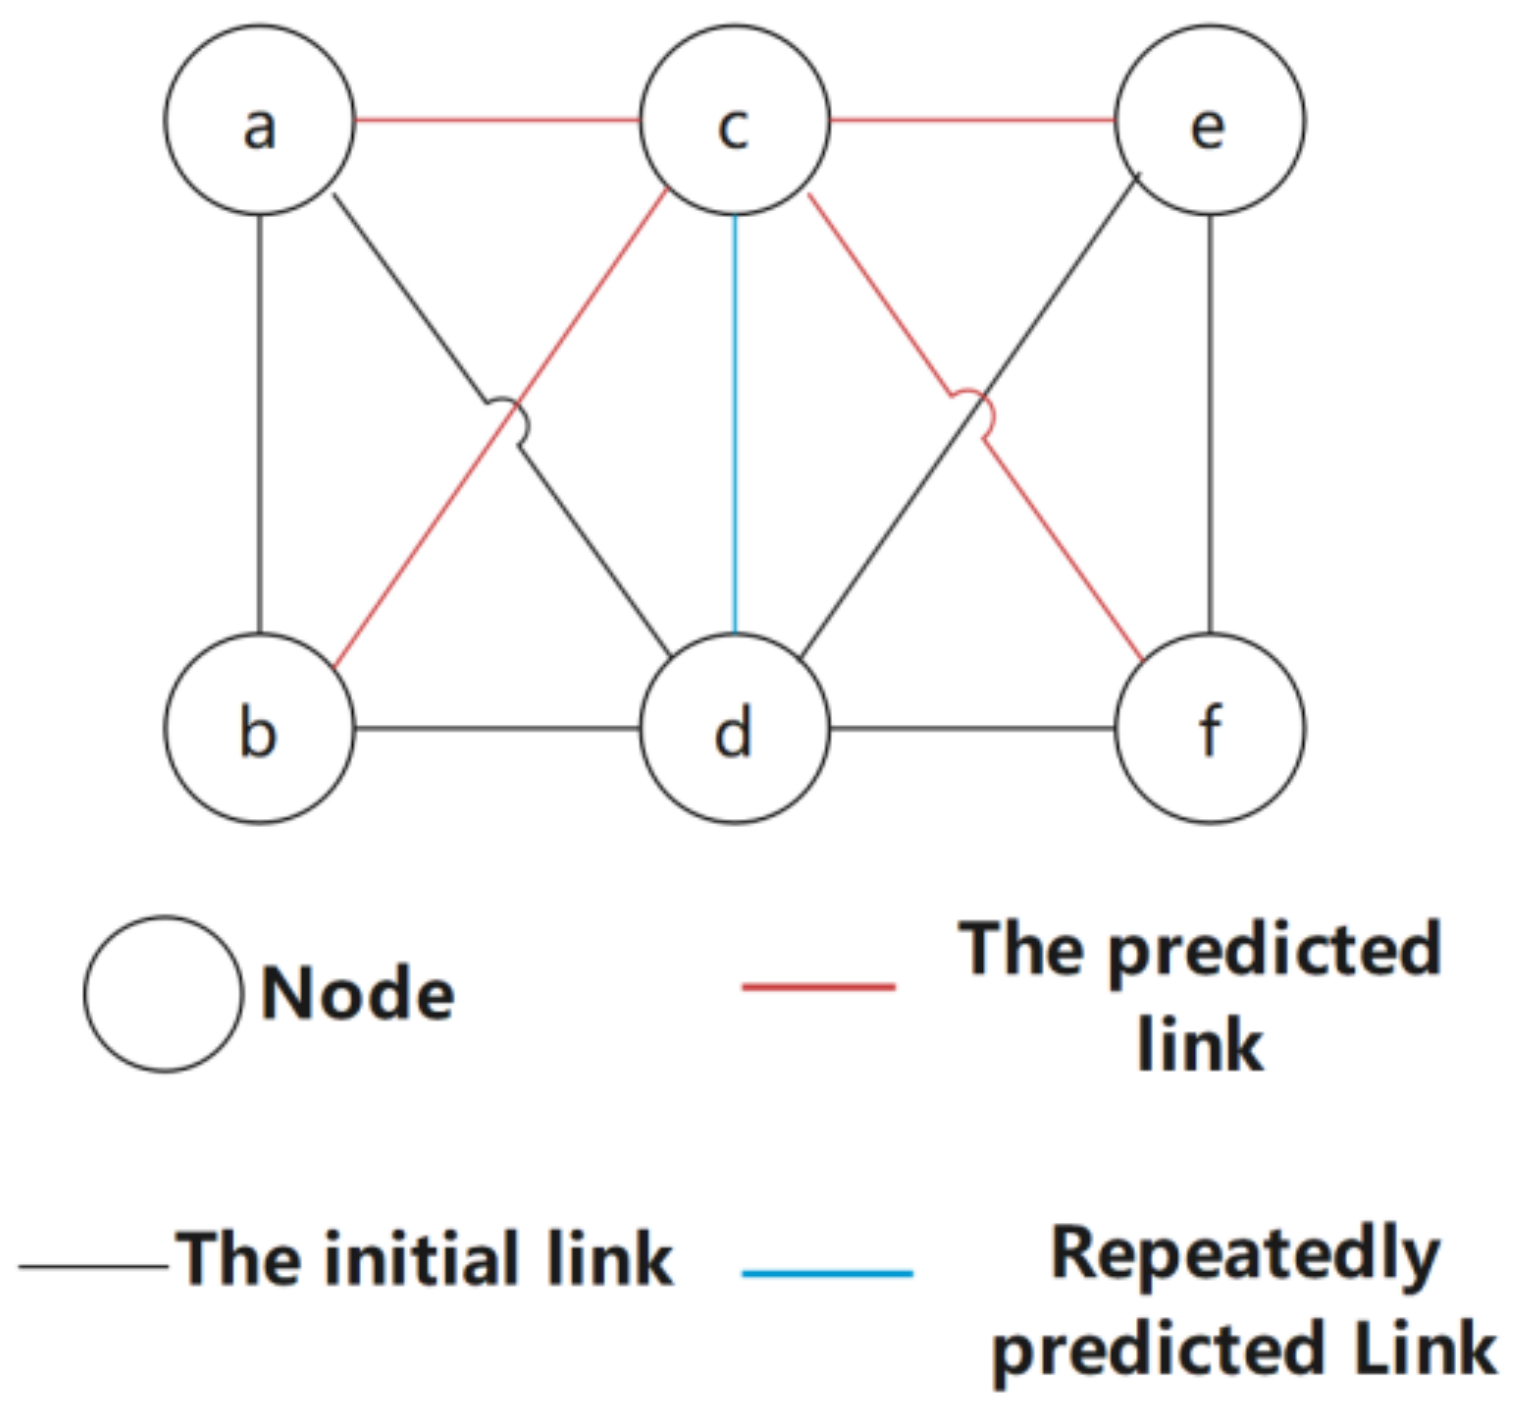
Algorithm 3 involves performing link prediction based on the triangle relationship obtained in Algorithm 2. The first step is to divide each neighbor of the triangle relationship into subgraph (i) or subgraph (ii). It can be seen previously that the value of subgraph (ii) is greater than that of subgraph (i), so for nonsparse opportunistic social networks, we only need to study subgraph (ii). When performing link prediction of potential links in subgraphs (i) or (ii), the subgraphs are scored, and the scores are based on two aspects: (1) weight; (2) subgraph type. The greater the weight or the subgraph type is, the higher the score. As the sub-pictures may overlap, points may also be added for repeated predictions. For example, in the situation shown in
Figure 4, the blue link where the two subgraphs overlap is predicted twice, so its score is high.
| Algorithm 3 Predict |
| 1: | Neighbors = Neighbors(Triangle) |
| 2: | NewLinks = Null |
| 3: | For All Neighbor ∈ Neighbors do |
| 4: | If Neighbor ∈ SubGraph (b) Then |
| 5: | Link = Get Non-Existed Link(b) |
| 6: | Calculate Score(Link) |
| 7: | NewLinks = NewLinks + Link |
| 8: | Else if Neighbor ∈ SubGraph(a) Then |
| 9: | Links = Get Non-Existed Link(a) |
| 10: | Calculate Score (Link) |
| 11: | NewLinks = NewLinks + Link |
| 12: | End If |
| 13: | End For |
| 14: | Return NewLinks |
| 15: | End |
3.2. Community Model
The nodes in the opportunistic social network communicate with each other in a “storage-carry-forward” manner. Therefore, an opportunistic social network has randomness and variability due to the movement of nodes. To analyze the relationship between nodes, we must first understand the essential criteria that a community and its nodes must meet. We explain the community’s randomness and variability through modularization, thereby reconstructing the sub-community and tracking the target node. All the nodes comply with the following assertions:
The degree of modularity of the community at a certain moment is:
where
Qt represents the community’s modularization degree at time
t, ſx shows the total weights of all edges in the community
x, F represents the total weight with edges, and
λs represents the total degree of node
S in the community.
Theorem 1. Increasing the weight of an edge in the opportunity social network can increase the correlation between the community to which the edge belongs and the opportunity social network.
Proof of Theorem 1. From time
t to time
t + 1, the degree of modularity of the community changes from
Qt to:
As Δſ > 0, so if we want to prove Qt+1 − Qt > 0, we only need to prove (2F2 − 2Fλs − λsΔſ × (2F − λs) > 0.
In other words, to prove:
2F is the sum degree of nodes in the network; thus, there will be no community in the network with a degree greater than 2F. Therefore, in summary, it can be proved that adding the weight of an edge in the opportunistic social network can increase the degree of relevance between the community to which the edge belongs and the opportunistic social network. □
Theorem 2. When the weight of the edge connecting the two sub-communities satisfies, the community is divided.
Proof of Theorem 2. Assuming that community
X is split into two sub-communities
xi and
xj, the total weight in the community is reduced, and there is
When the total weight decreases, the formula can be expressed as:
Thus, the sub-communities xi and xj in the community satisfy , and the community is separated. □
Theorem 3. Two nodes ni and nj in the opportunistic network are connected by edge eij, and edge eij is the only edge of node ni. Then, if the weight of edge eij changes, ni will not be separated from the community.
Proof of Theorem 3. When the community meets the following three conditions, it will be divided:
When the weight changes, the weight in the community is:
By formulas (5) and (6), we can obtain:
Therefore, is false. □
It can be proved that, in the opportunistic social network, if a node is connected with another node by a unique edge, when this edge’s weight decreases, the node is not separated from the community.
In summary, all nodes in the opportunistic network satisfy the above assertions.
4. Simulation
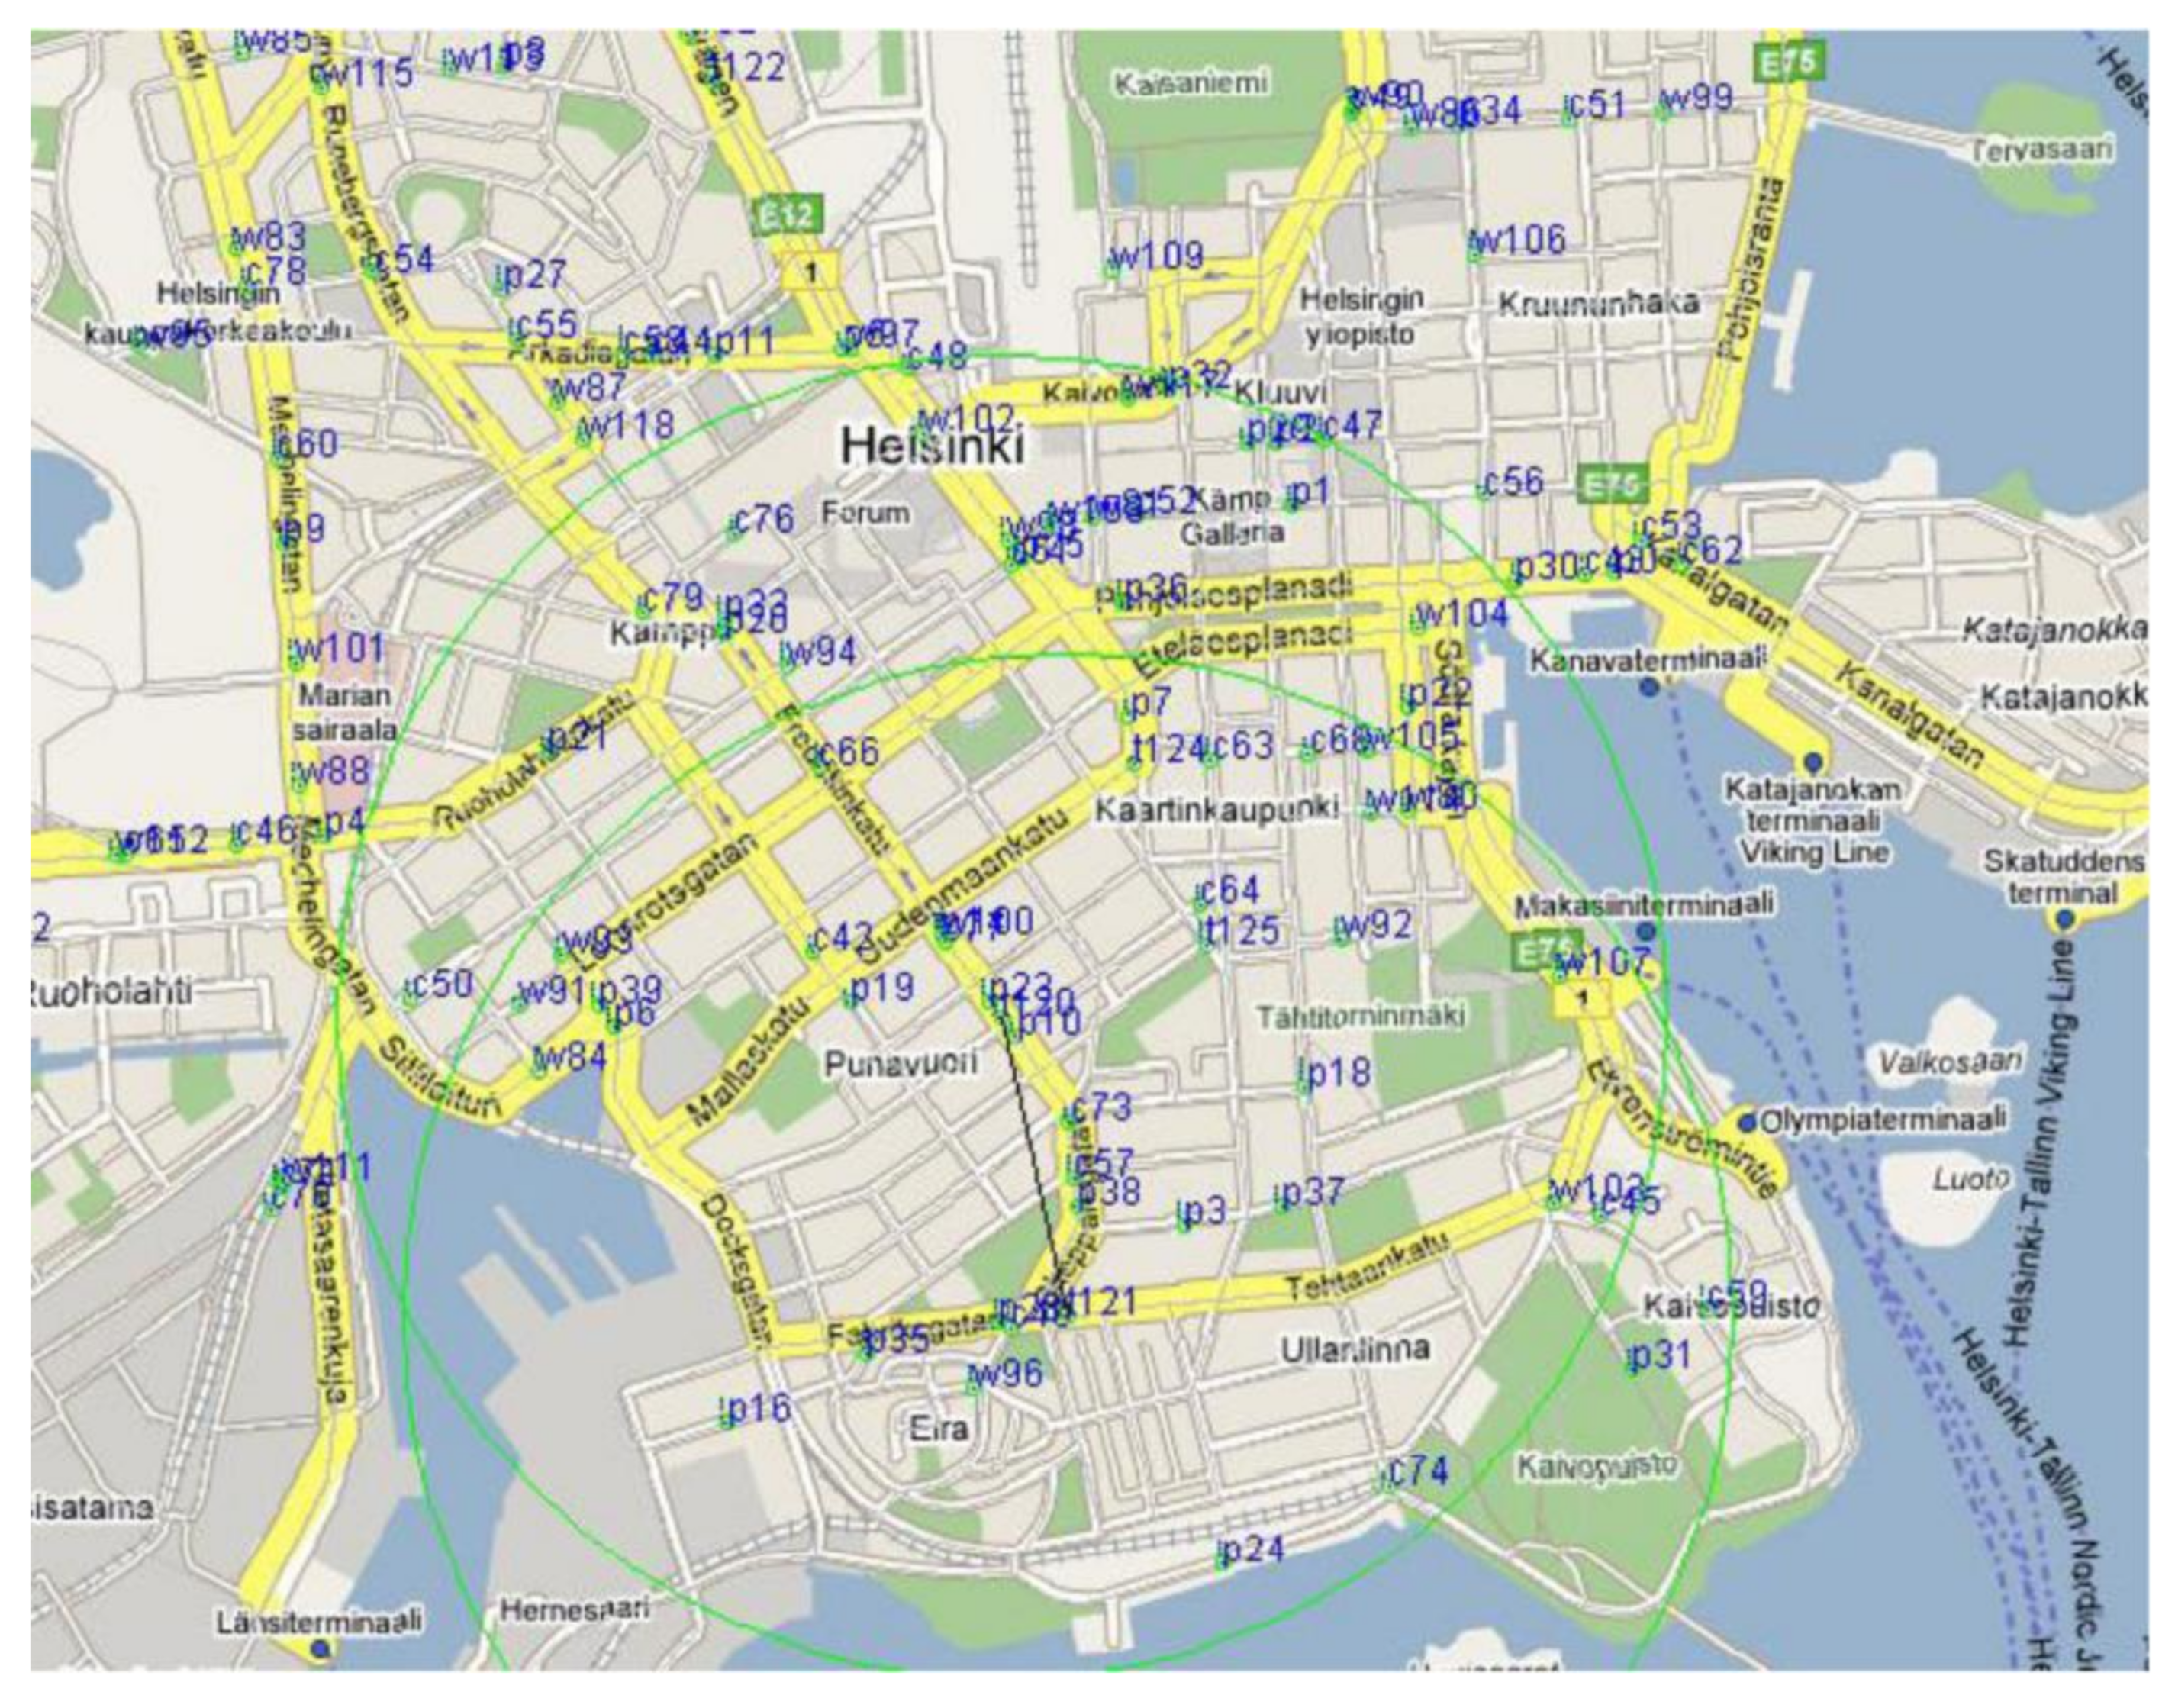
This article used the ONE (opportunistic network environment) tool for simulation testing to analyze and evaluate the performance of LPMBT. To meet the needs of data, we chose an open street map to edit the city map. There are different parks, streets, and shops on the map, which can show the real environment. As shown in
Figure 5, the simulation used a real map of Helsinki.
We set the following simulation environment parameters. The signal transmission power was set to 1200 W, the node’s movement model was SPMBM (Shortest Path Map-Based Movement) model, and each data packet transmission consumed 1 J of energy. Other specific experimental parameters are shown in
Table 1:
At the same time, in order to gain a clearer understanding of the results, we chose the Spray and Wait algorithm [
24], EIMCT (Effective Information Multi-Controlling node Transmission algorithm) [
8], and ICMT (information cache management and data transmission algorithm) [
36]. Comparison and analysis of various algorithms and LPMBT:
Spray and Wait algorithm [
24]: This algorithm first sprays a certain amount of copies into the network and then waits for a node that obtains a copy to achieve its goal. It overcomes the shortcomings of the traditional Epidemic algorithm based on the flooding mechanism.
EIMCT [
8]: The algorithm selects the time to forward the message based on the defined stop time h. When t < h, the node forwards the message with the most significant probability, and when t > h, the node stops sending the message. It effectively reduces the time complexity and overhead and improves network communication performance to a certain extent.
ICMT [
36]: This algorithm evaluates the transmission probability by identifying neighbor nodes, thereby adjusting the cache. Besides, the cooperation between nodes shares the node’s cache task for effective data transmission, which can avoid accidental deletion of the cache.
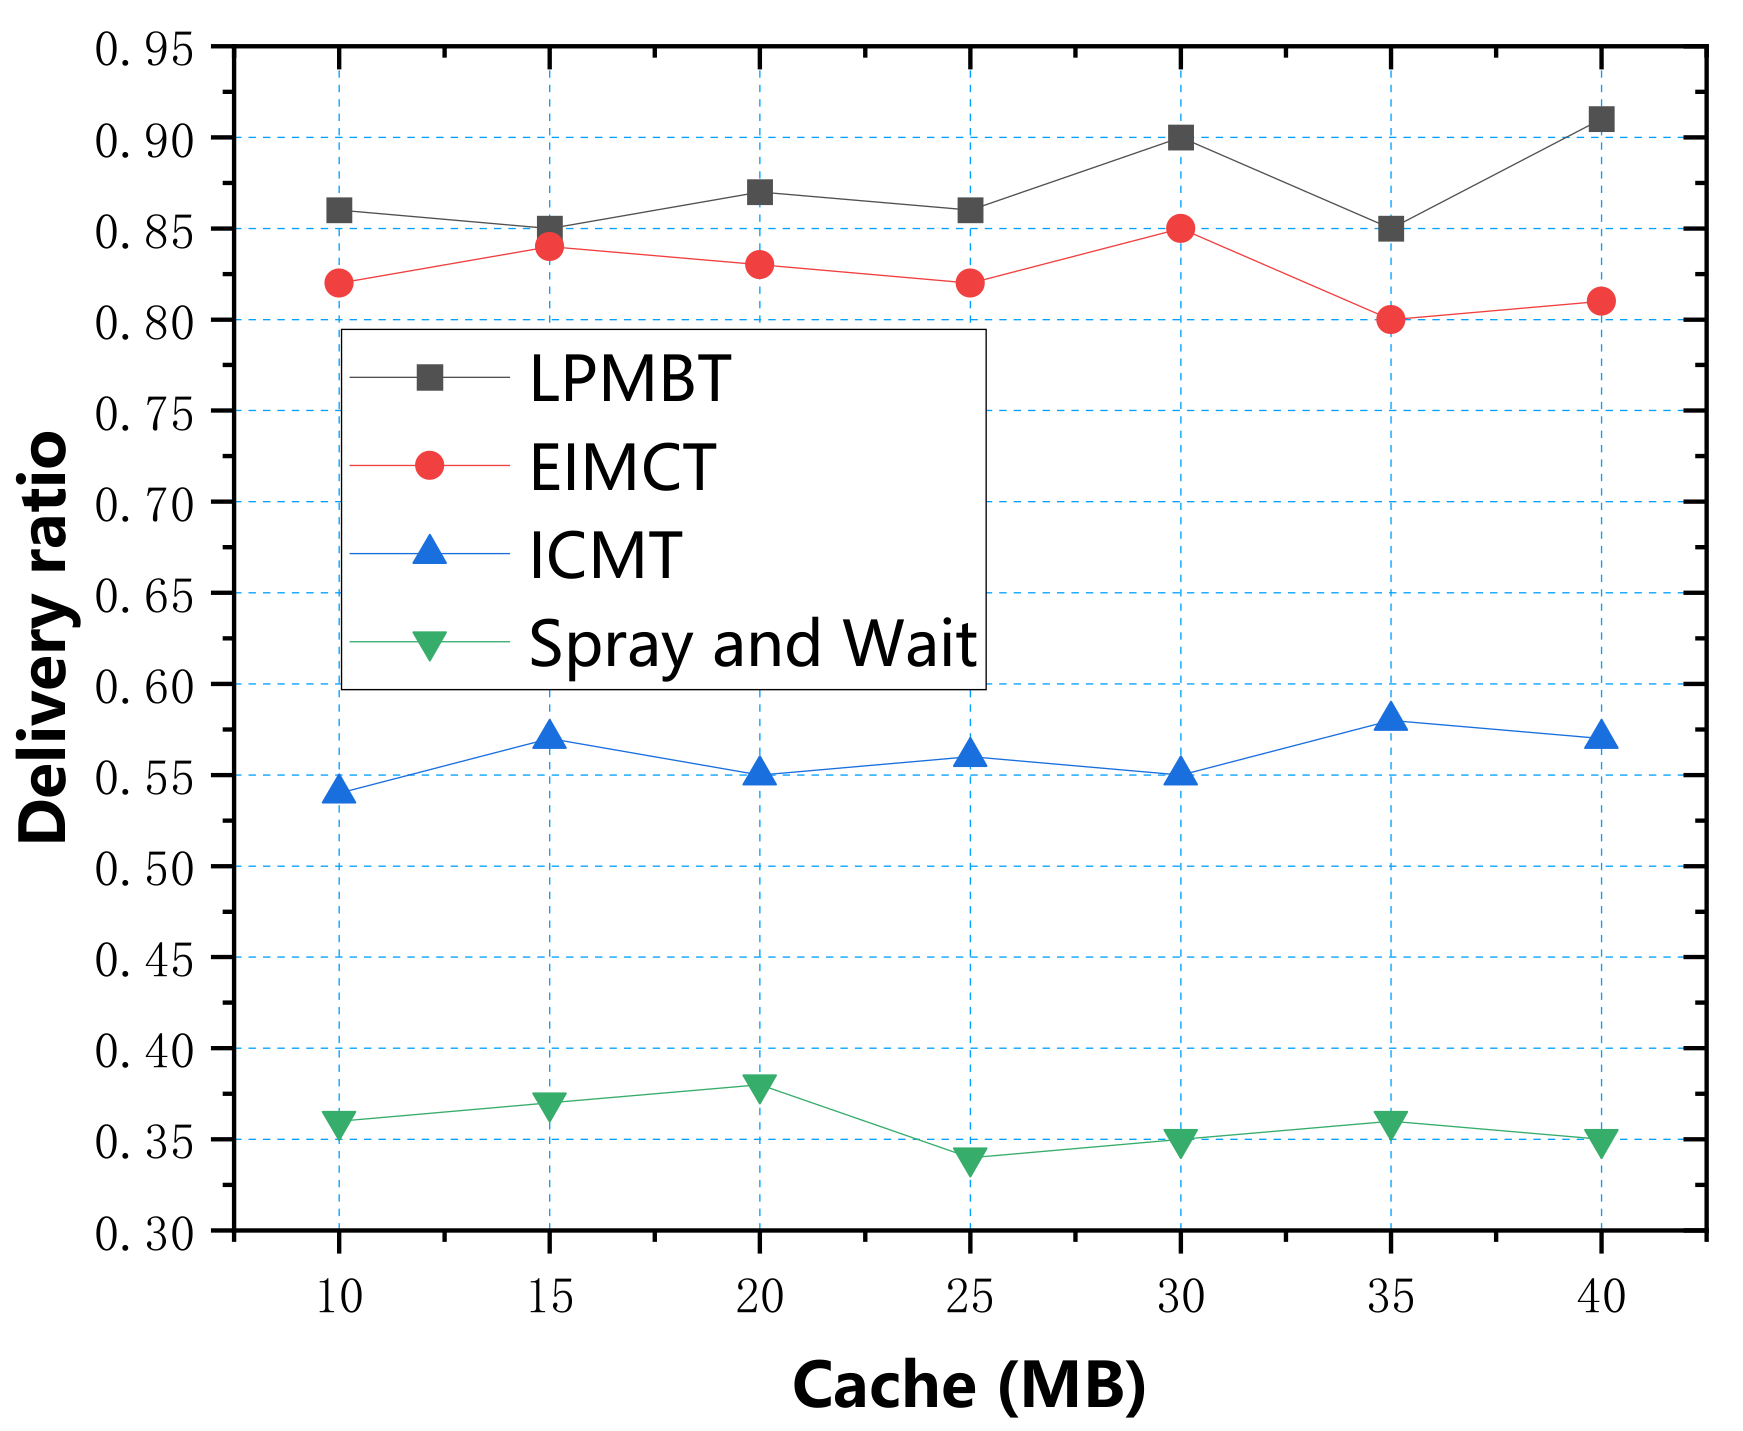
In the simulation experiment, we used four parameters: data transfer rate, energy consumption, average end-to-end delay, and average overhead, to measure the algorithm’s performance. First, we used the cache as a variable to explore four evaluation indicators, respectively. According to the simulation test results, the relationship between the cache and the four evaluation indicators is shown in
Figure 6,
Figure 7,
Figure 8 and
Figure 9.
Figure 6 shows the relationship between delivery ratio and cache. The data in the table show that the LPMBT delivery ratio was highest, up to 0.91. As the LPMBT selects the optimal relay node according to the scoring result of link prediction and accurately transmits it to the target node, the utilization rate of cache resources is high, so the delivery ratio is highest. The second highest was EIMCT because EIMCT considers the cooperative relationship between nodes during the information transmission process, and the delivery rate was relatively good. However, when the cache space was ample, the EIMCT cache utilization rate decreased and the delivery ratio decreased slightly. ICMT achieved a better delivery ratio by improving the information transmission conditions, with an average value exceeding 0.55. The Spray and Wait algorithm’s delivery ratio was lowest because the flooding mechanism causes a large number of copies in the network. This redundant information occupies most of the cache space. As a result, there is increasingly more information in the waiting queue, which leads to network congestion and the delivery ratio. It should be kept at a low level.
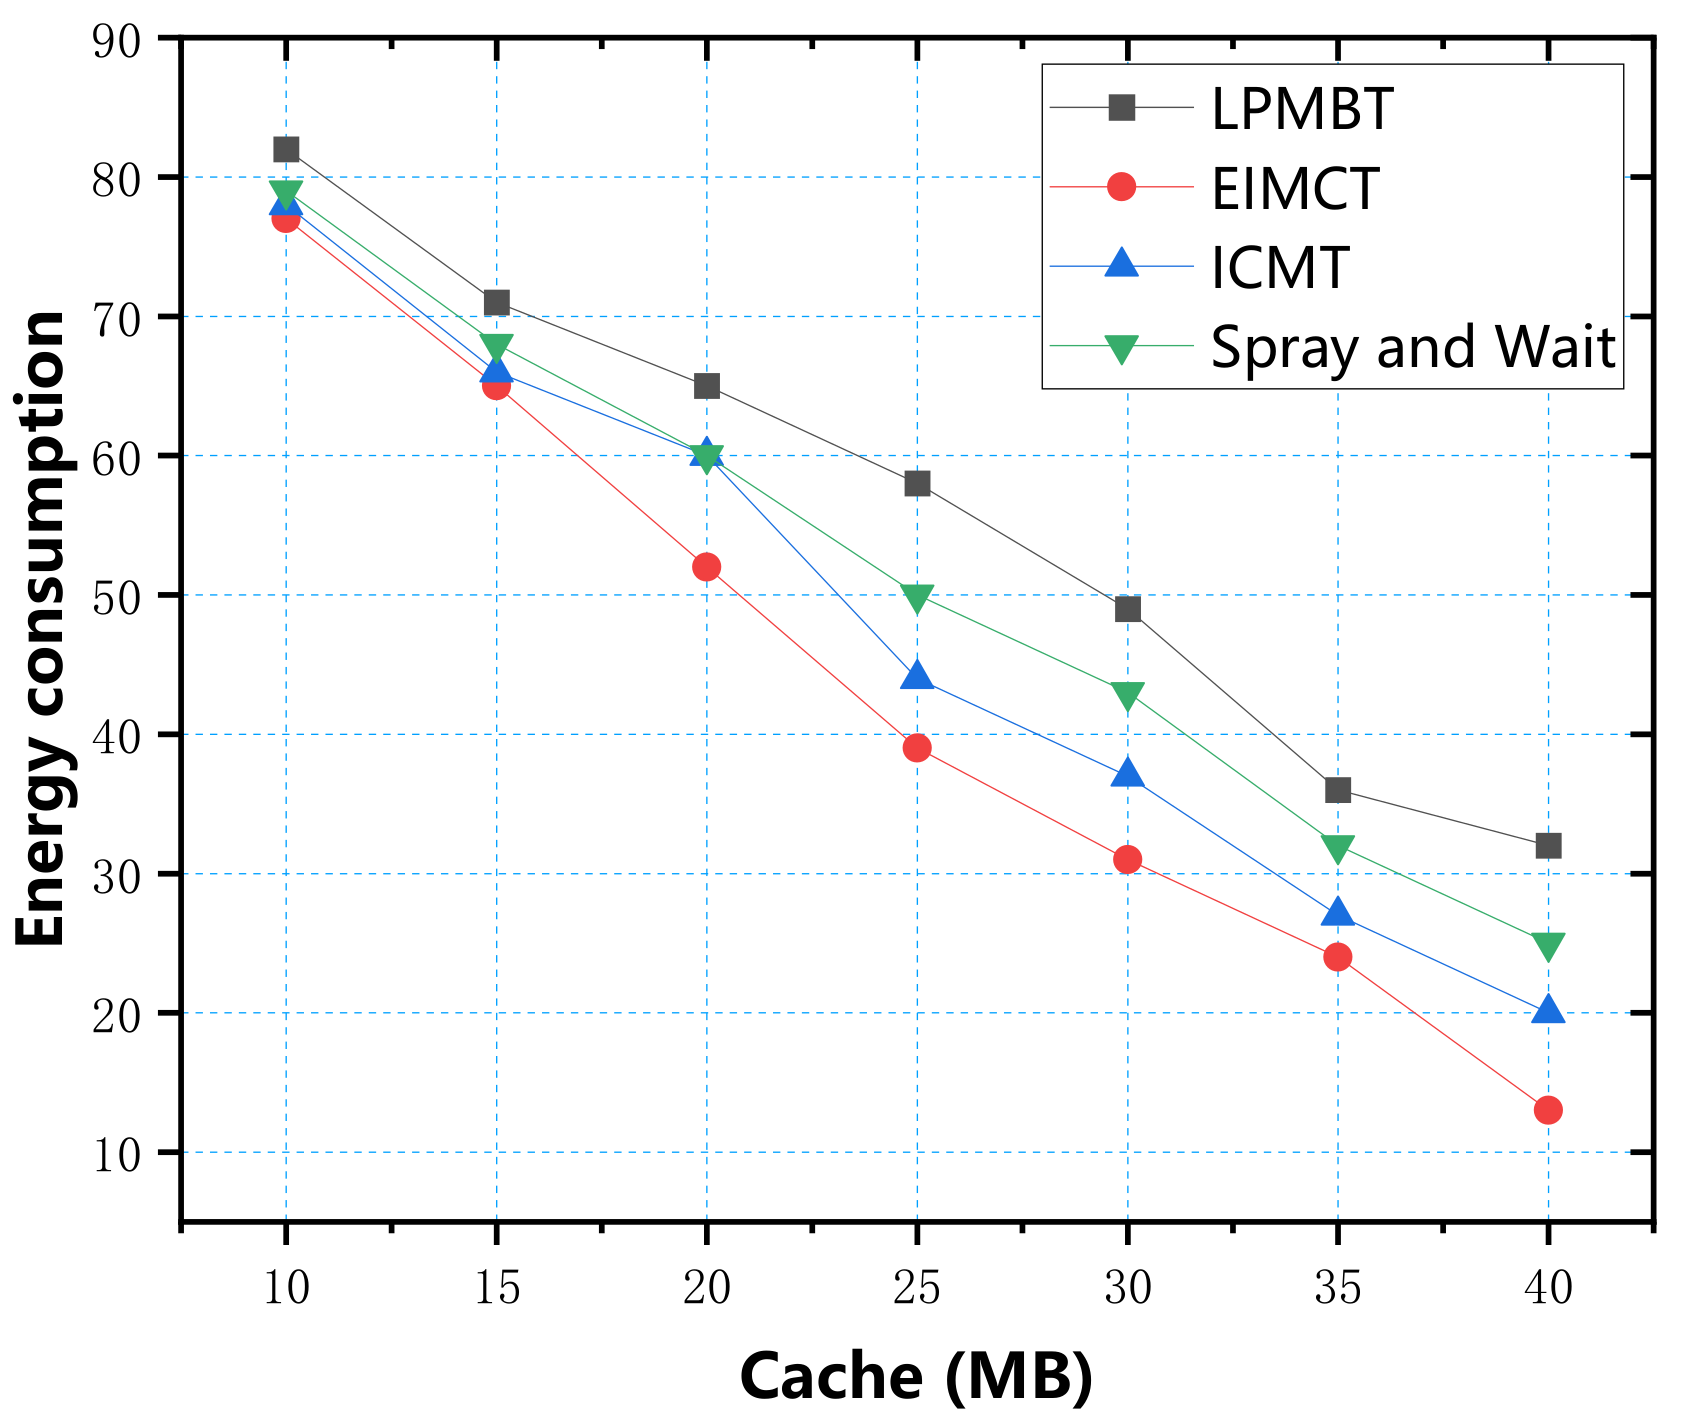
The correlation between transmission energy consumption and buffering is shown in
Figure 7. From the data in the figure, it can be seen that Spray and Wait algorithm consumed the most energy because the Spray and Wait algorithm copies a large number of copies and sprays them to all neighbors. Most of the energy consumption is used to copy files instead of transmission, so its energy consumption is largest. In contrast, selective information transmission helps ICMT reduce energy consumption. EIMCT screens the relay nodes for data transmission by calculating the probability of nodes meeting in the opportunistic social network, which improves the delivery ratio and reduces energy consumption. LPMBT avoids most of the low-scoring relay nodes, so it reduces a lot of additional energy consumption. When the buffer space was greater than 35 MB, the energy consumption was only 36 J. In terms of energy consumption, LPMBT was the best choice.
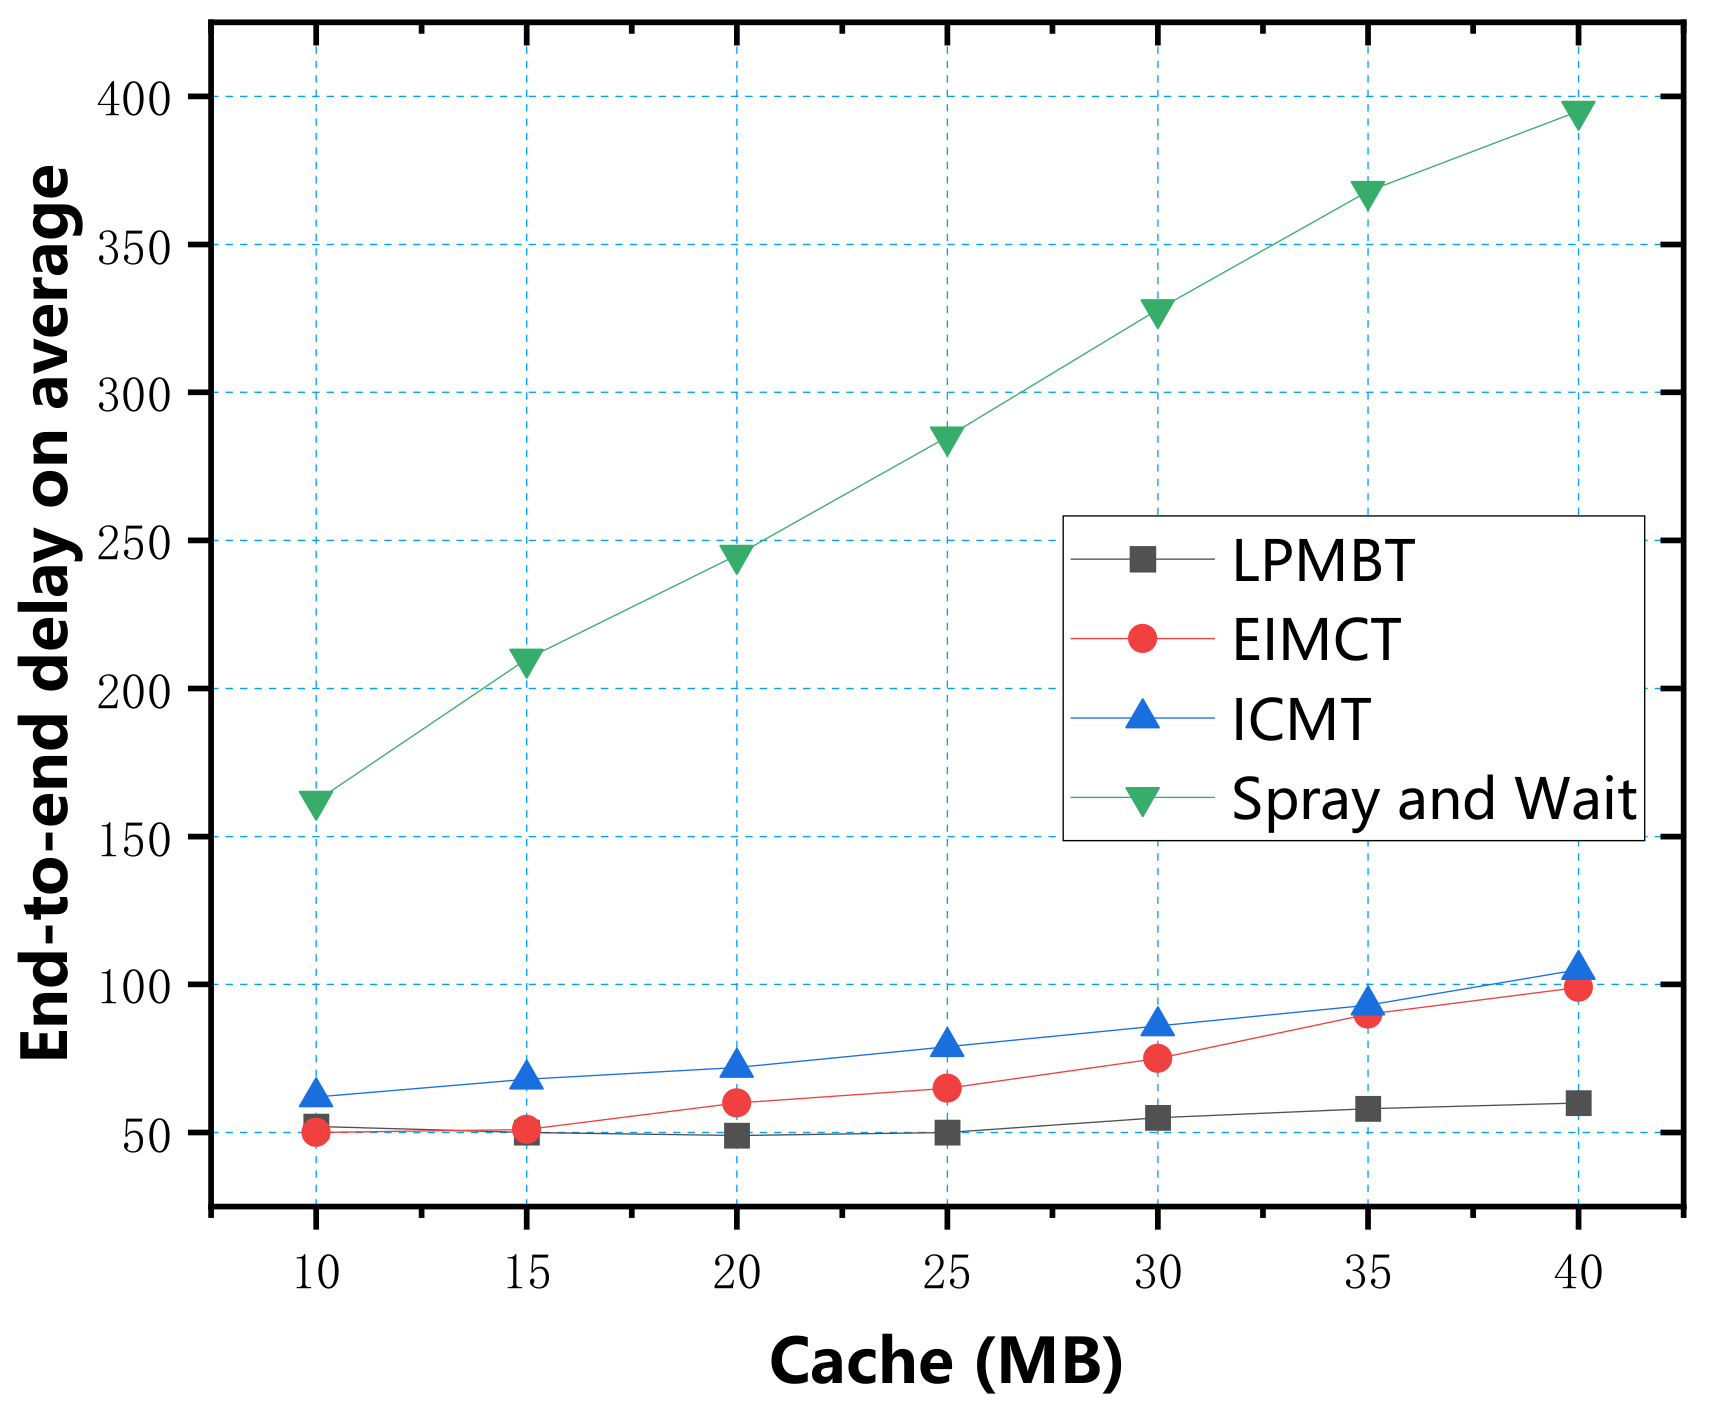
In
Figure 8, we can see the relationship between the average end-to-end delay and the cache. The lowest average delay was LPMBT and EIMCT. LPMBT was stable between 50 and 60, which was because LPMBT had a higher delivery ratio and could effectively use the cache space. Therefore, the additional cache was not necessary for LPMBT and EIMCT. Their delay was not significantly affected by the cache space. EIMCT was stable between 50 and 100 because its replication mechanism caused data packets to be lost during transmission, so the average delay was slightly lower. The ICMT algorithm effectively reduced the average delay because it controlled the time interval of information transmission. Because of the flooding mechanism, a large amount of information was congested in the waiting queue, resulting in a greatly increased average delay, so Spray and Wait was the algorithm with the highest average end-to-end delay.
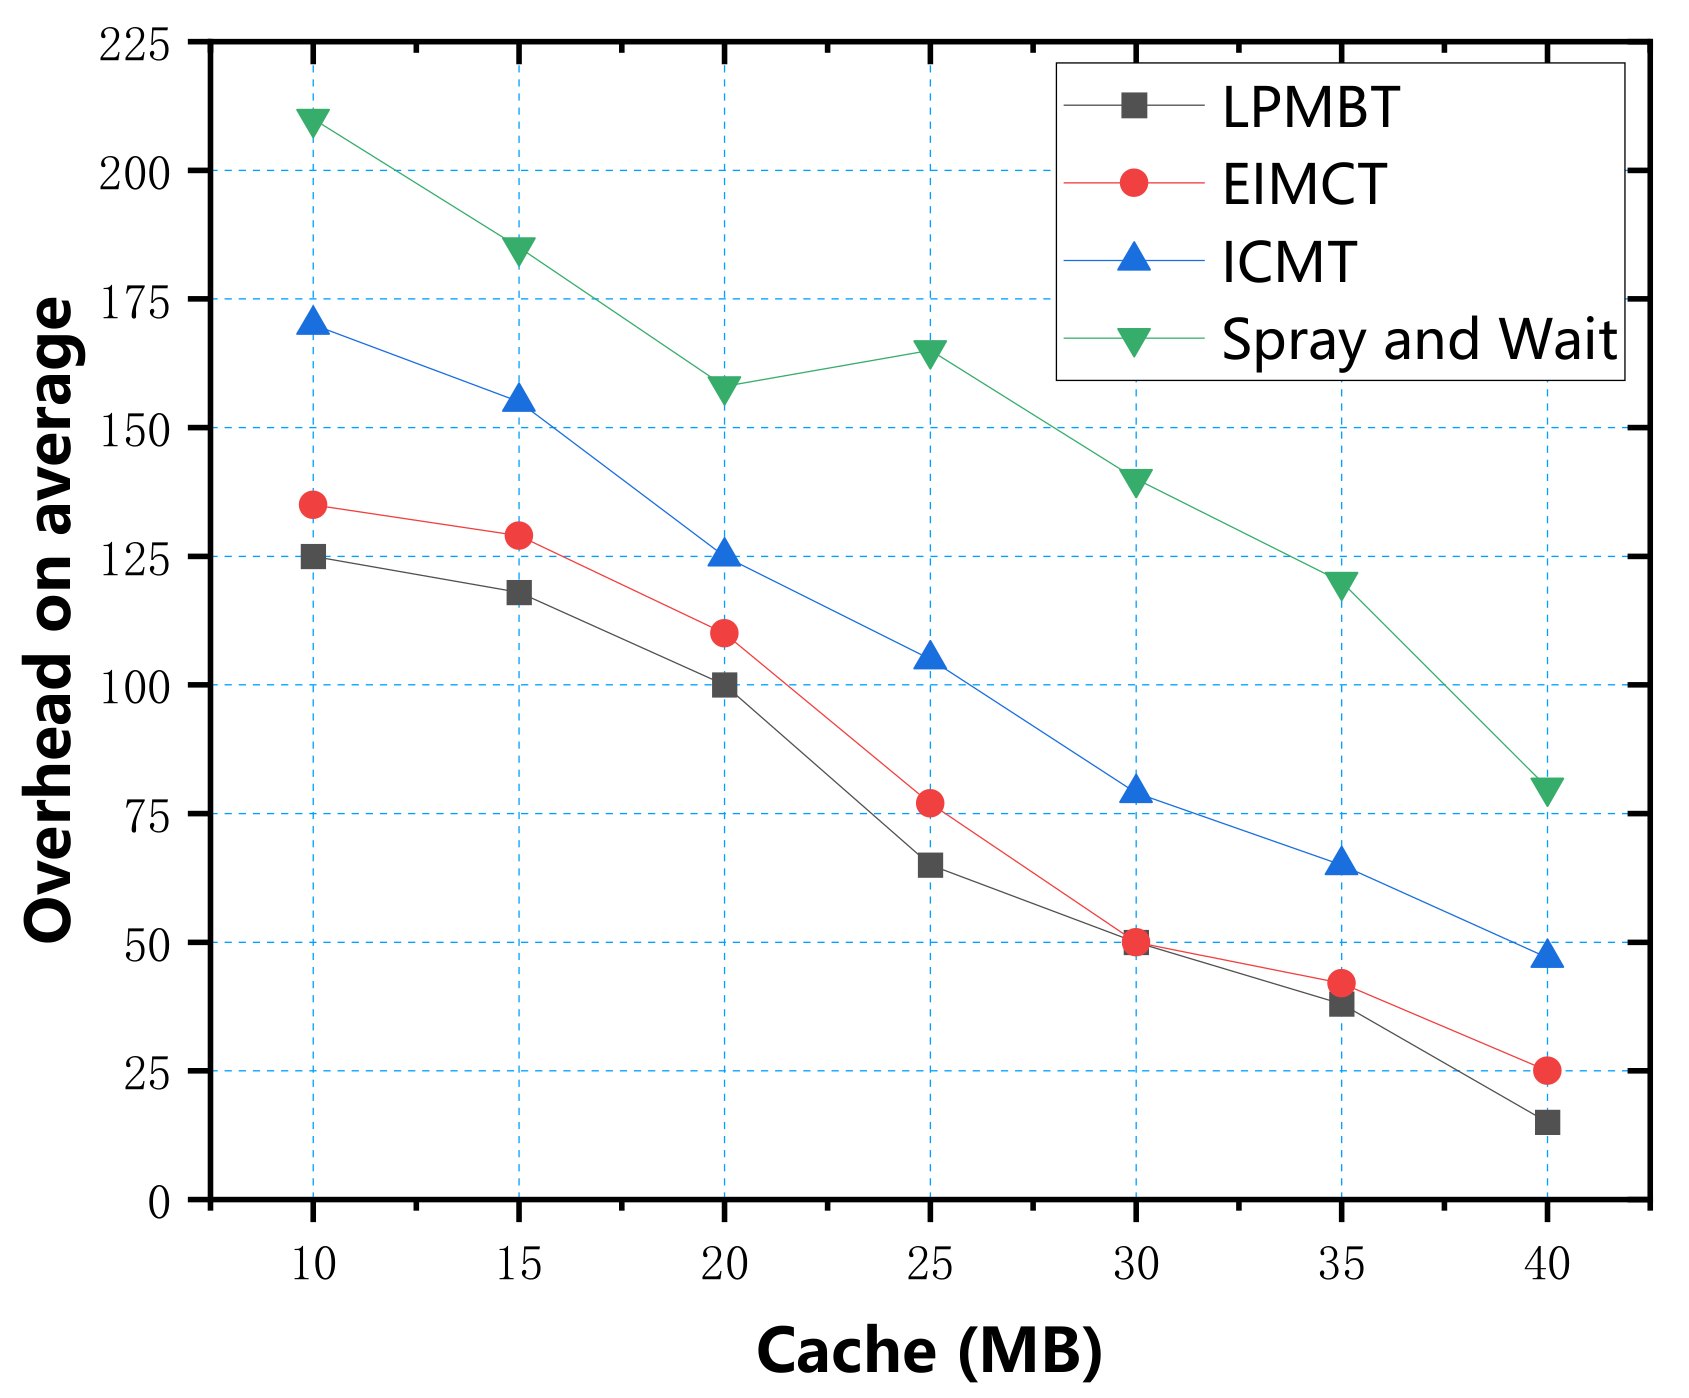
In
Figure 9, we can see the relationship between average overhead and cache. The data in the figure show that the average overhead of the four algorithms decreased with the cache. A large amount of redundant data in the Spray and Wait algorithm dramatically increased the cost of information transmission, so in contrast, the cost of Spray and Wait algorithm was largest. ICMT’s average overhead dropped from 175 to 51, slightly better than that of Spray and Wait. The average overhead of LPMBT and EIMSP was smallest and not much different. As LPMBT selects the relay node with the best score every time, it managed the node cache more effectively, dramatically reducing redundant information and the average overhead.
In addition to the simulation test through the above four parameters, we considered that there might be a variety of information transmission methods in the real environment, so we chose three mobile models to determine the performance of LPMBT in different environments: SPMBM (Shortest Path Map-Based Movement), random way point (RWP), and random walk (RM) models [
37].
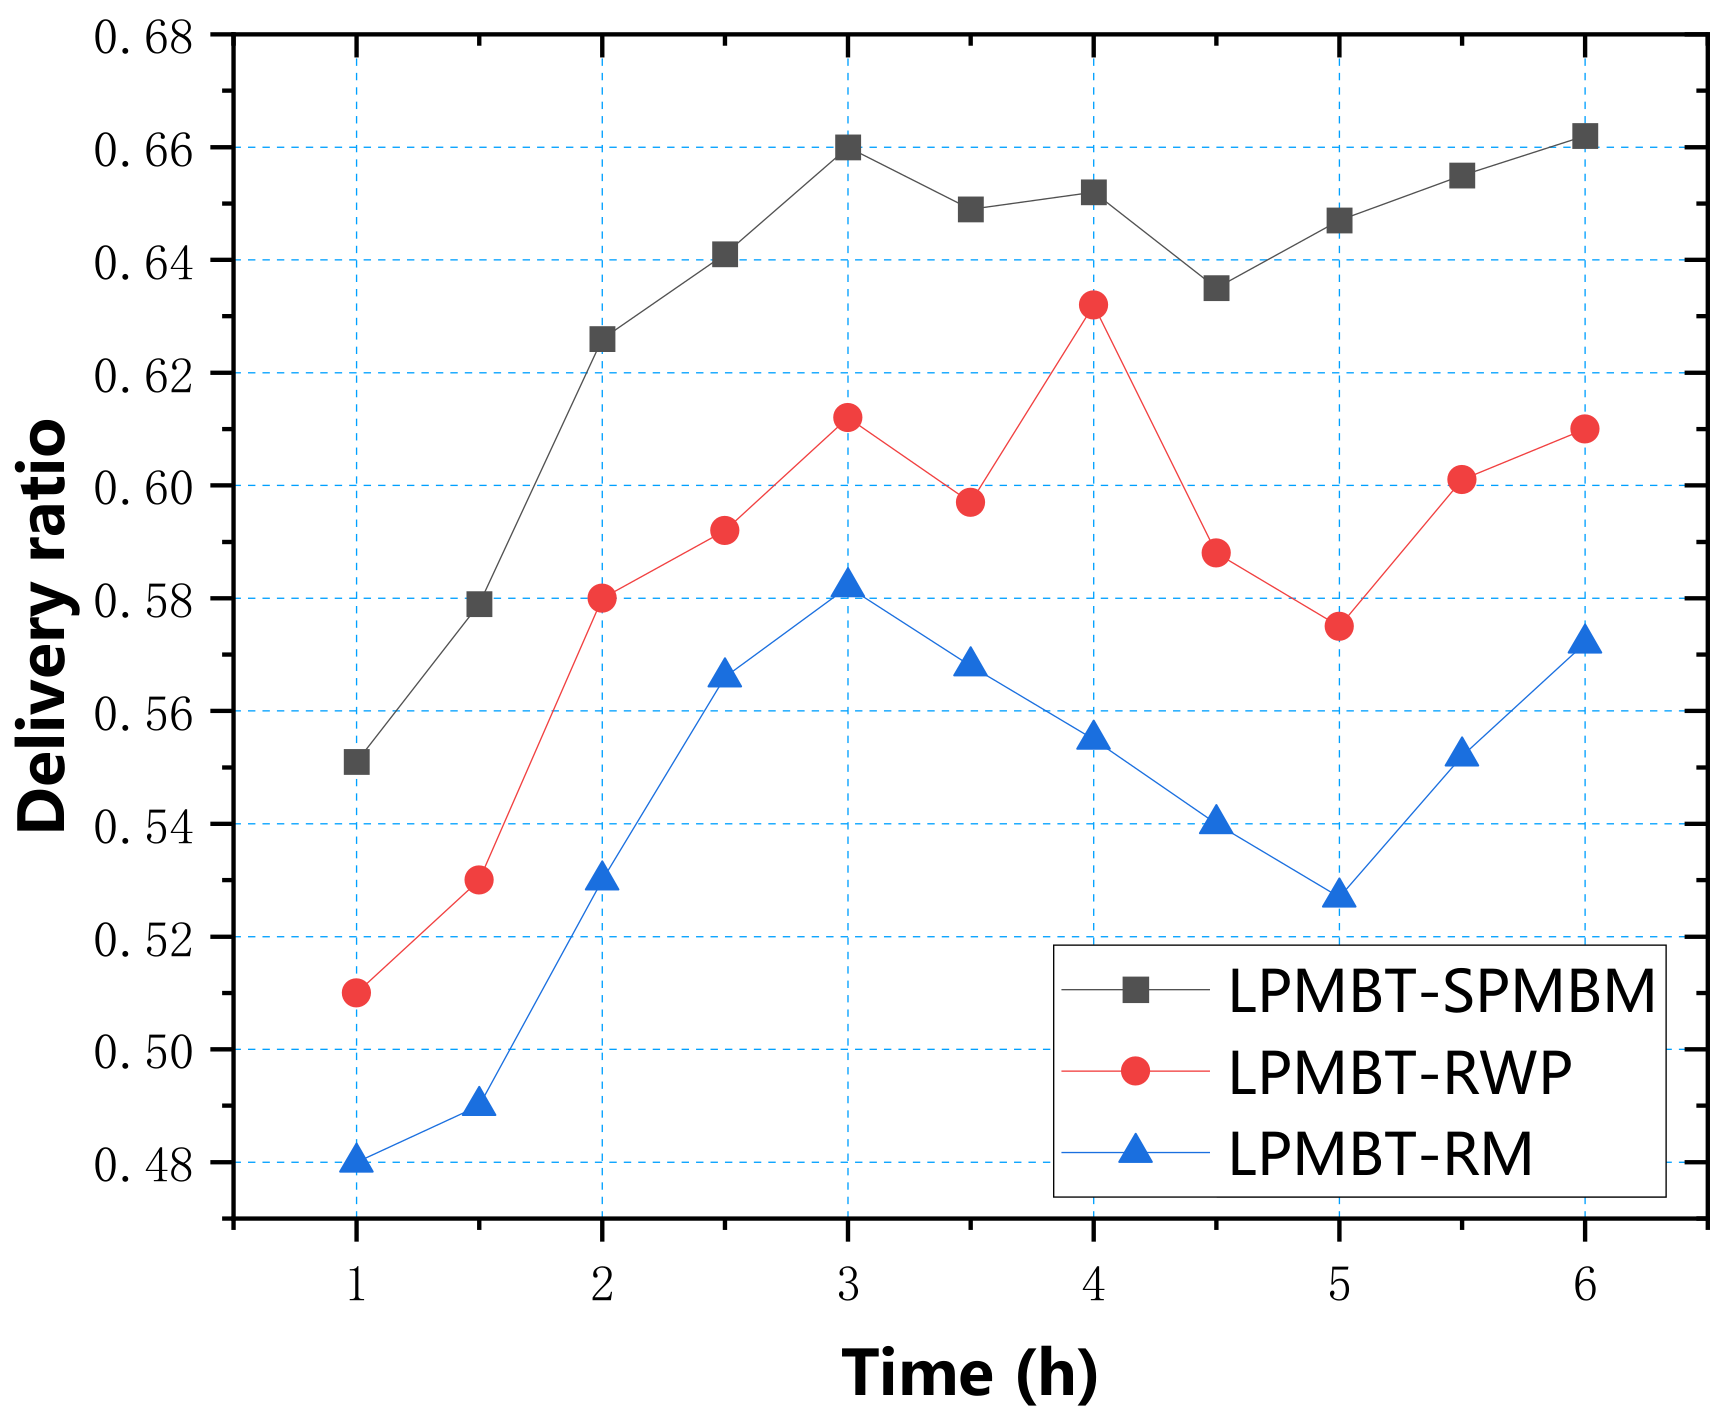
Figure 10 shows the delivery ratio of the LPMBT algorithm in the three mobile models. From the data in the figure, it can be seen that the SPMBM model had the highest delivery ratio, which reached 0.66 in three hours. Under the RWP model, the delivery ratio reached a peak of 0.632 in four hours. The delivery ratio of the RM model reached a peak of 0.582 in three hours. Overall, the performance and delivery ratios of the LPMBT algorithm in the SPMBM model were better than those of the RWP model and the RM model.
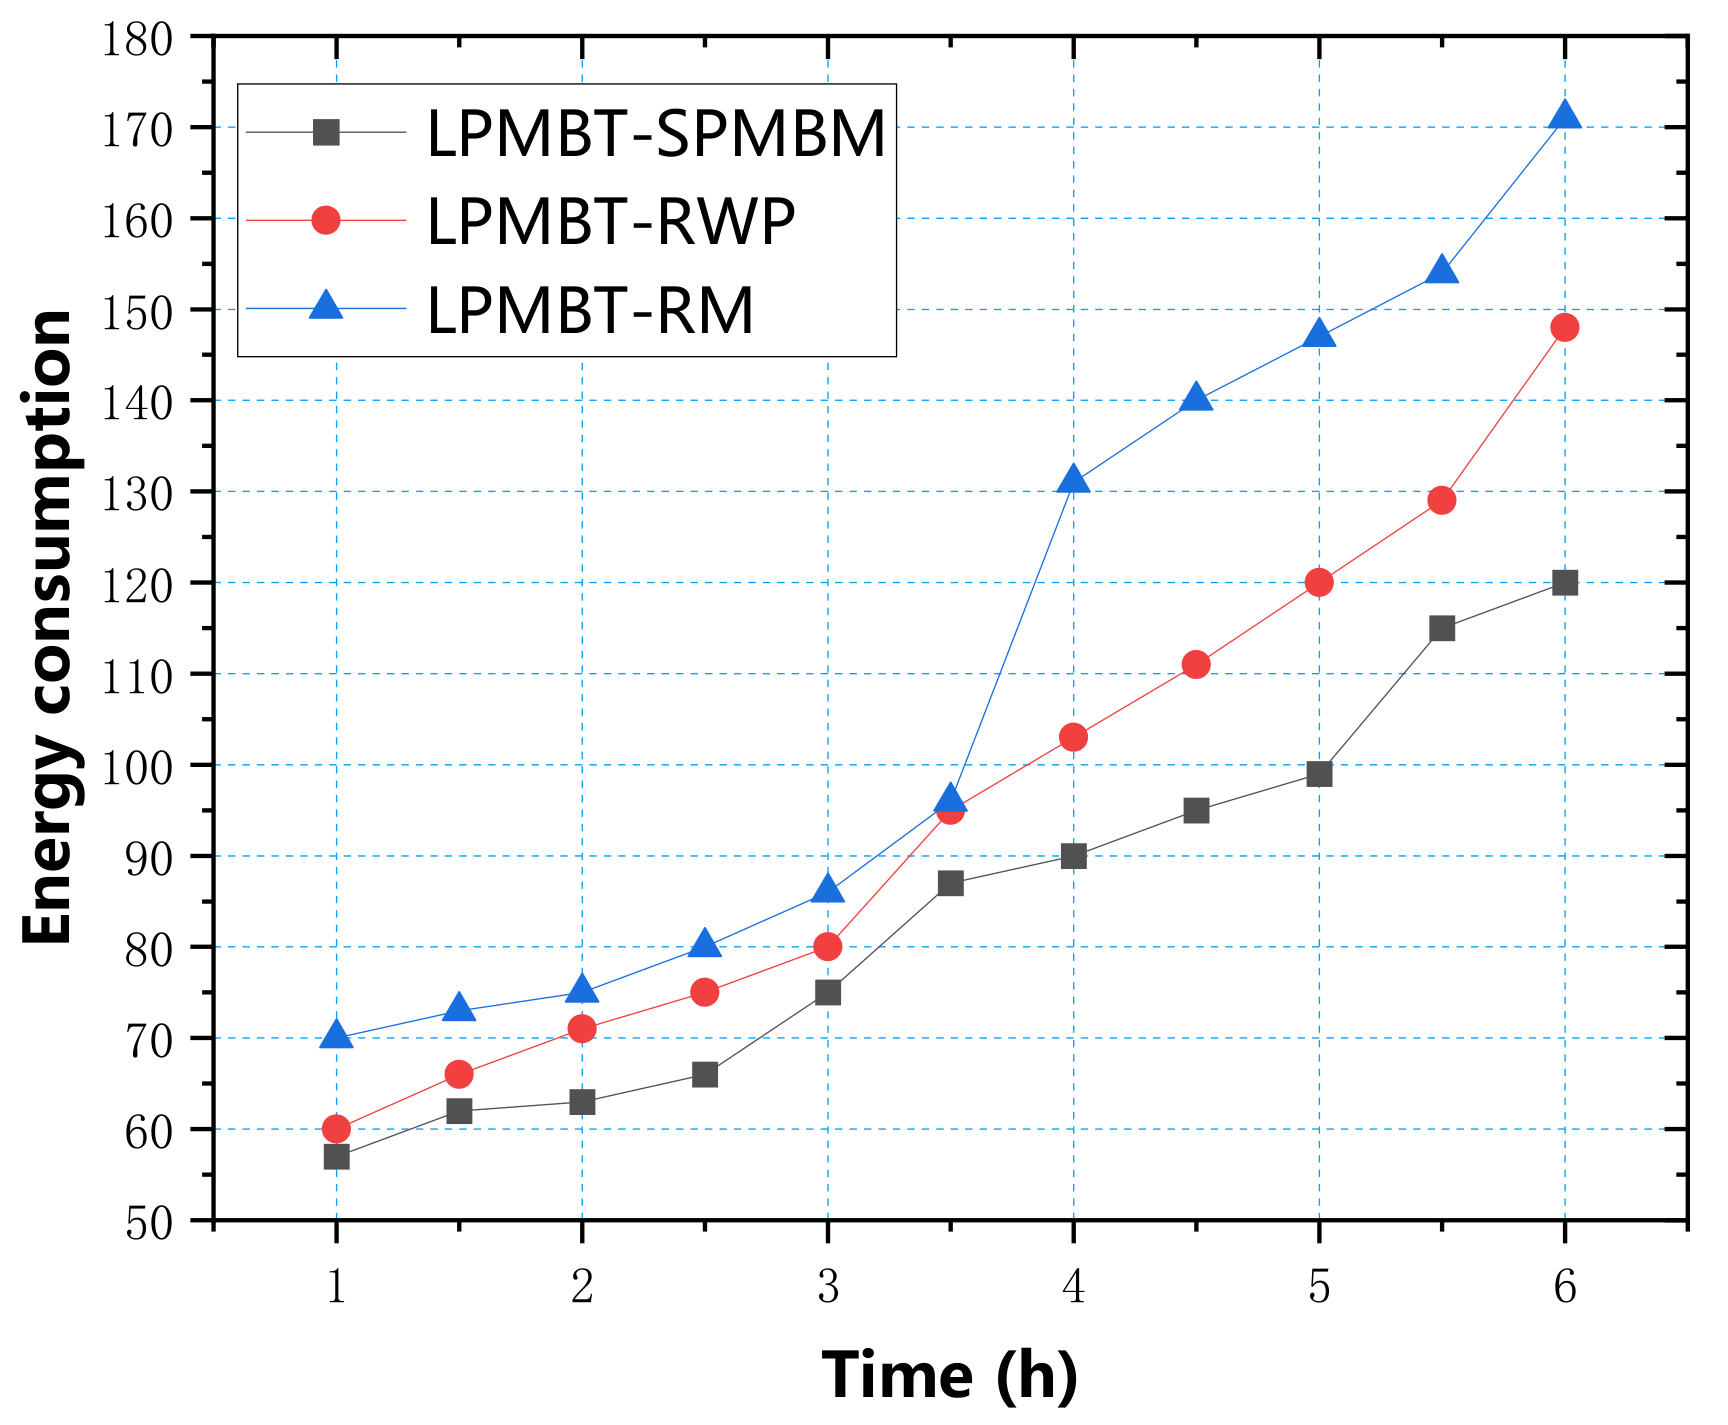
In
Figure 11, we can see the energy consumption of the LPMBT algorithm in the three mobile models. The energy consumption under the three mobile models was not much different, and all increased over time. It can be seen that the LPMBT algorithm consumed less energy and had a stable information transmission performance.
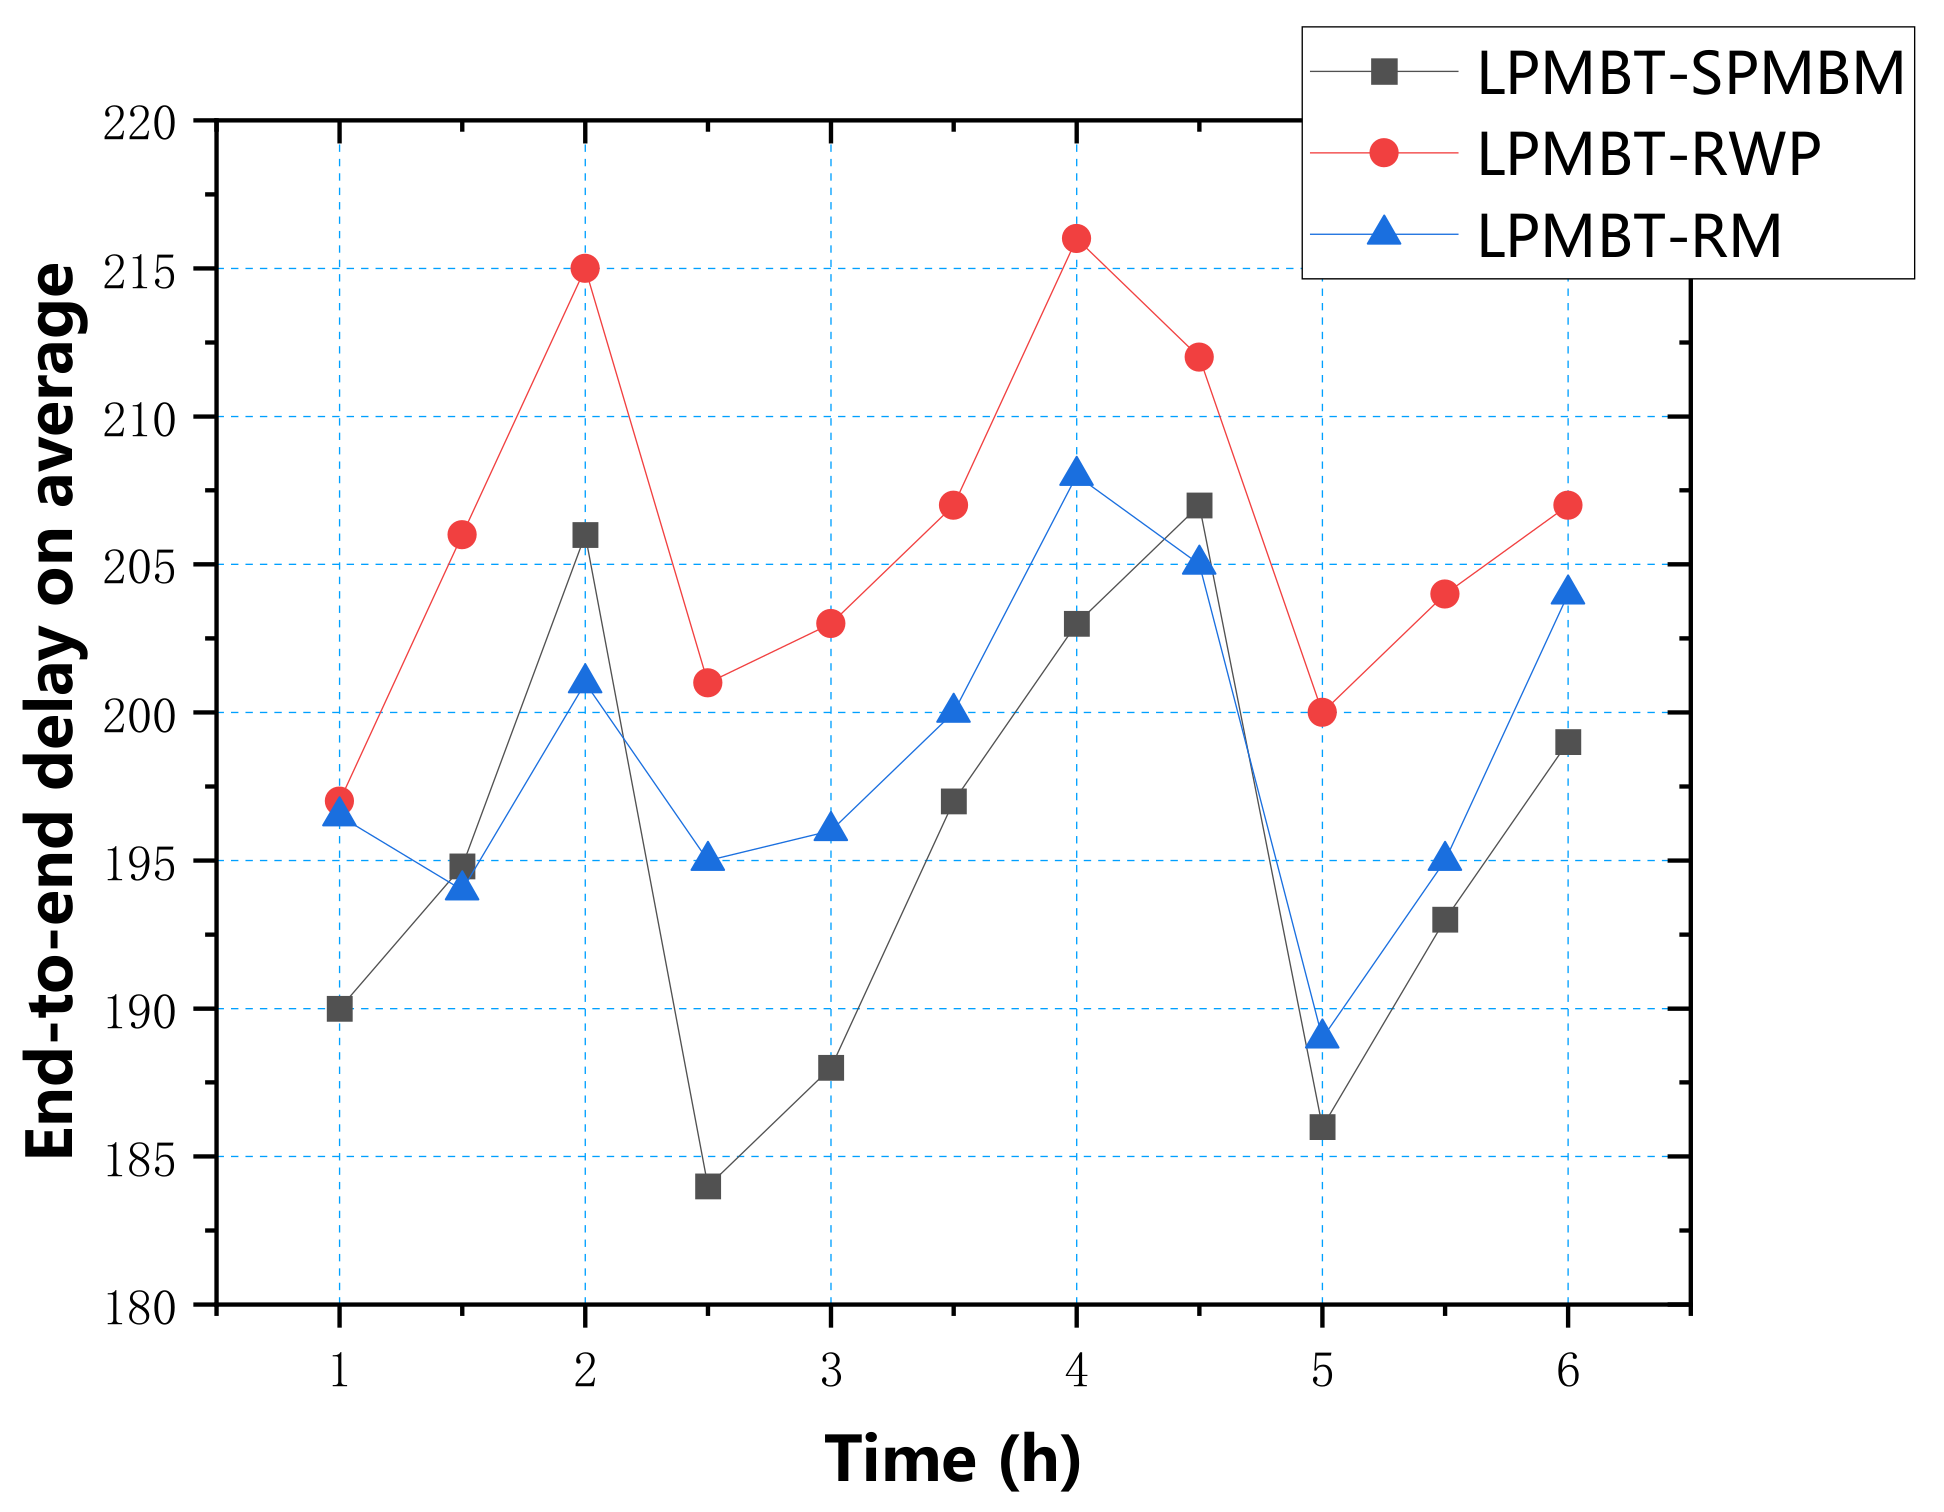
Figure 12 shows the average delay of the LPMBT algorithm in the three mobile models. According to the data in the figure, the average delay of the three models was mainly concentrated between 185 and 215. The highest delay was mainly the RWP model. The results show that the LPMBT algorithm could effectively transmit information in different environments.
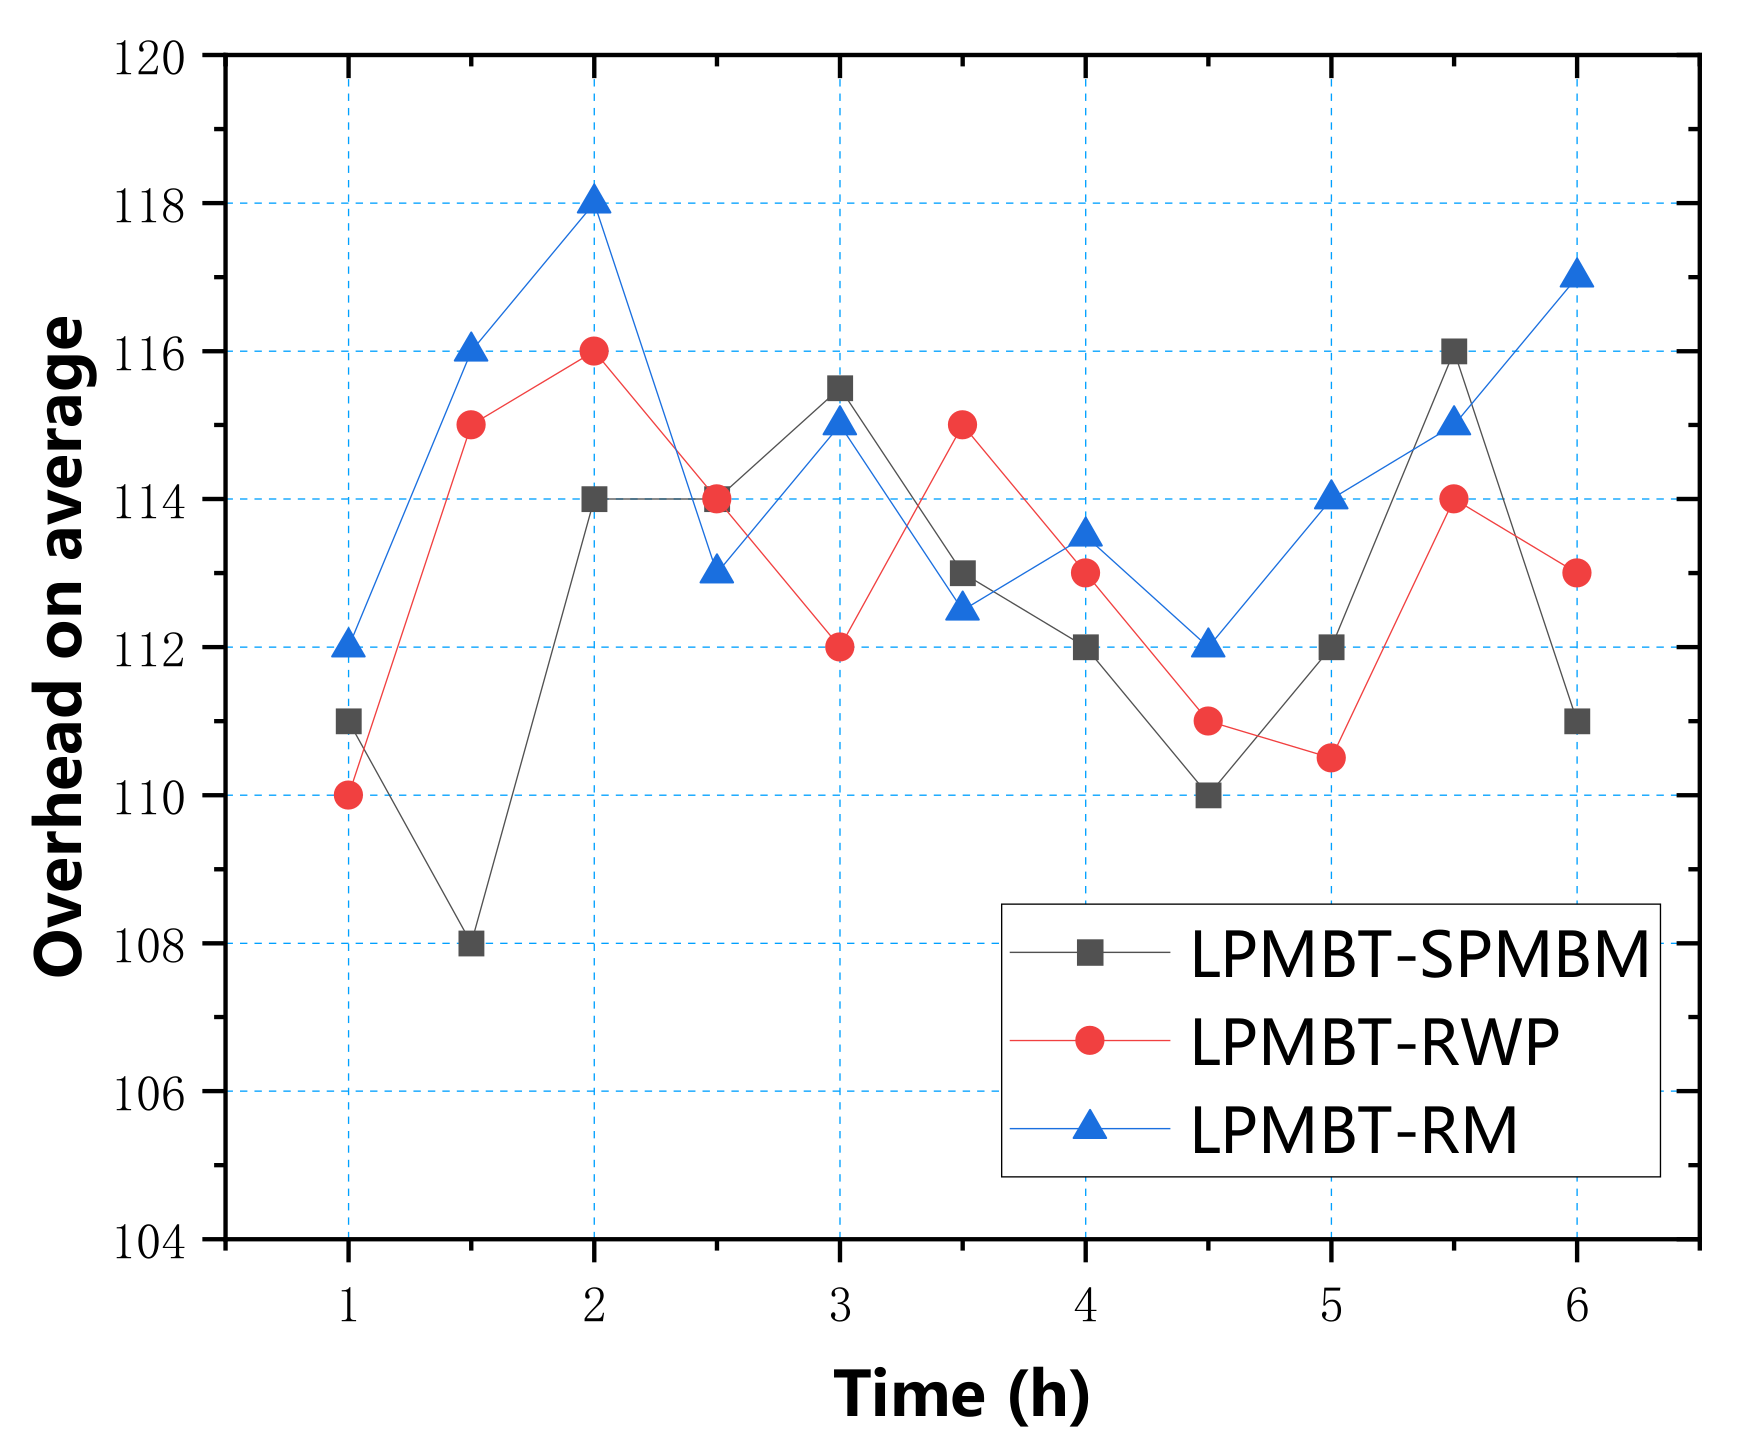
In
Figure 13, we can see the average overhead of the LPMBT algorithm in the three mobile models. The figure shows that the costs of the three models were not much different and were concentrated in the 108–118 range. Therefore, different environments had little effect on the overhead of the LPMBT algorithm.
5. Conclusions
This paper proposed a link prediction model based on triangular relations (LPMBT) in opportunistic social networks. The algorithm analyzes the topological structure in social networks, scores links based on the frequency, and obtains the optimal relay node based on the score. When a node is forwarding information, it always selects the optimal relay node for data transmission. Compared with the EIMCT, ICMT, and Spray and Wait algorithms, the simulation results showed that the LPMBT algorithm had an excellent performance, effectively reduced the end-to-end delay and overhead, and dramatically improved the data transfer rate of opportunistic networks. It also maintained a stable performance in different environments.
However, the current model only considered the network structure in
Figure 1, which only contained two sub-graph structures, which resulted in the model’s low versatility. In future work, we will consider using more complex subgraph structures for algorithm improvements and conducting experimental tests in complex real-world environments to explore the impact of large-scale and complex environments on information transmission and how to optimize complex network structures. In addition, in order to improve the experience of 5G network users, we will also consider the impact of 5G energy consumption on information transmission and study how to route and forward with lower energy consumption efficiently.


