
Deep Item Response Theory as a Novel Test Theory Based on Deep Learning


Abstract
1. Introduction
- One can estimate examinees’ abilities while minimizing the effects of heterogeneous or aberrant items that have low estimation accuracy.
- IRT produces examinee ability estimates on a single scale, even for results obtained from different tests.
- IRT predicts an individual examinee’s correct response probability to an item from the examinee’s past response histories.
- Based on deep learning technology, a novel IRT is proposed. It requires no linkage procedures because it does not assume random sampling of examinees.
- Deep-IRT estimated examinees’ abilities with high accuracy when the examinees are not sampled randomly from a single distribution or when there are no common items among the different tests.
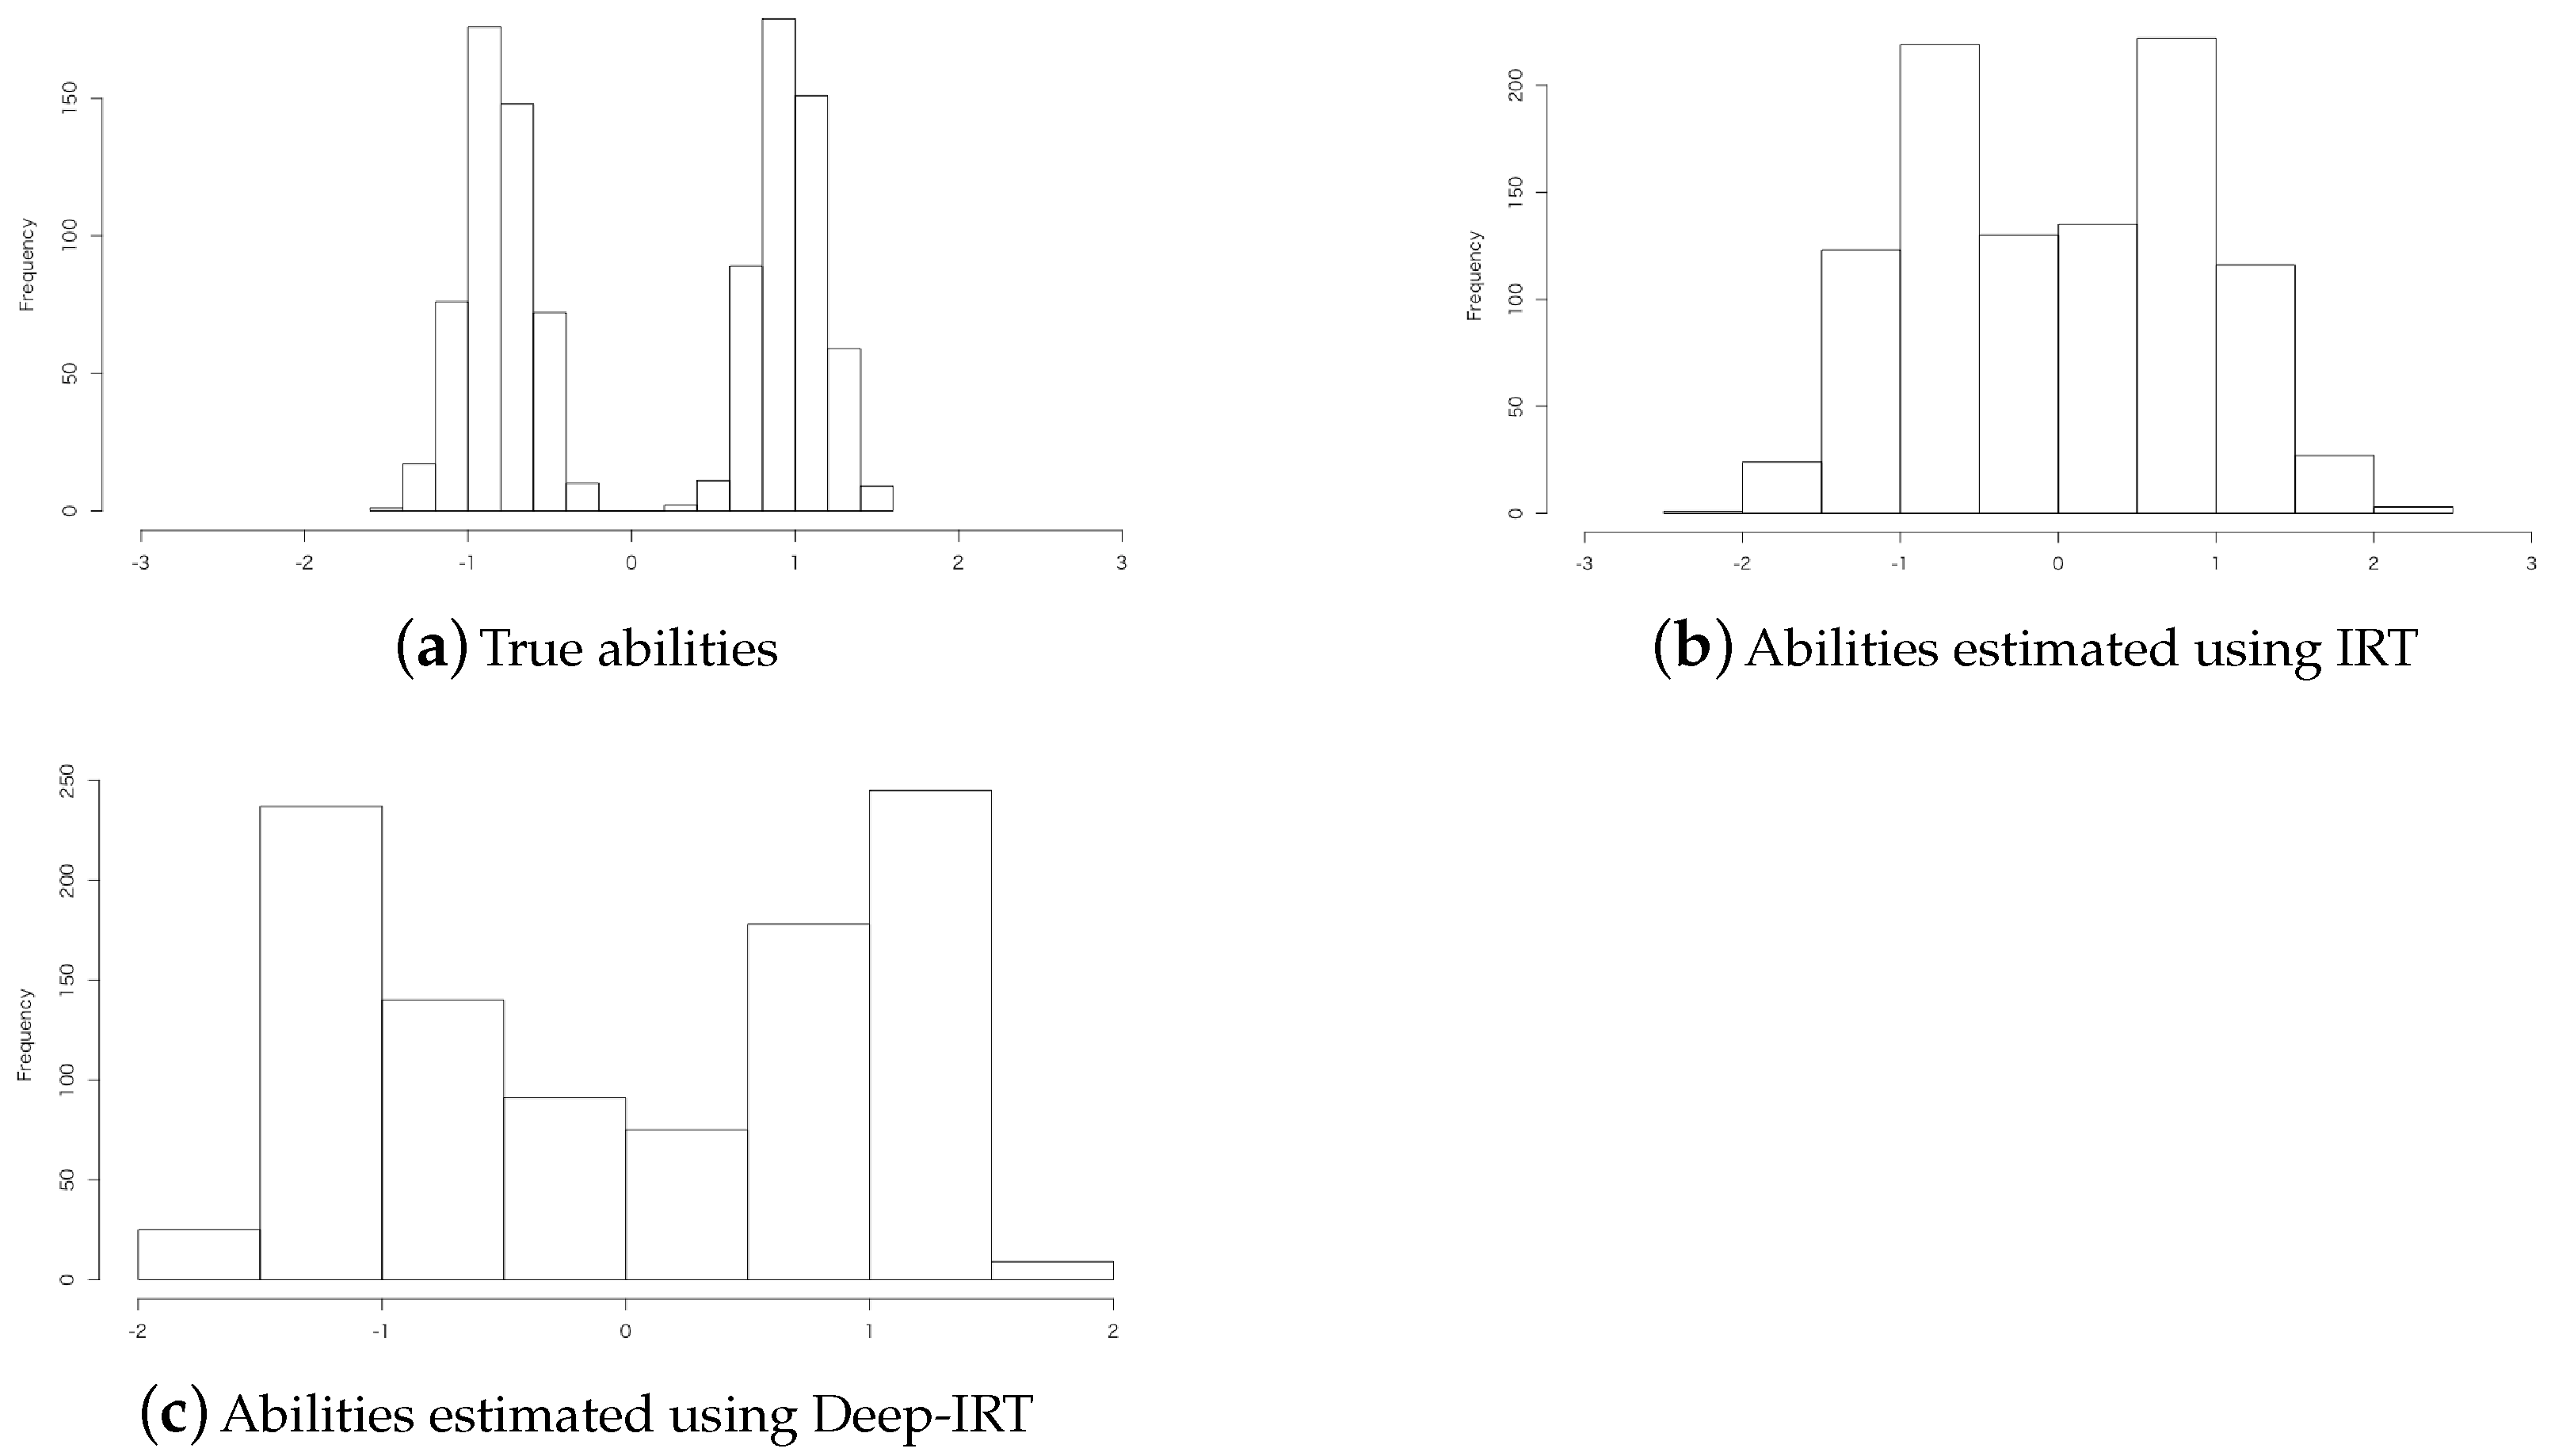
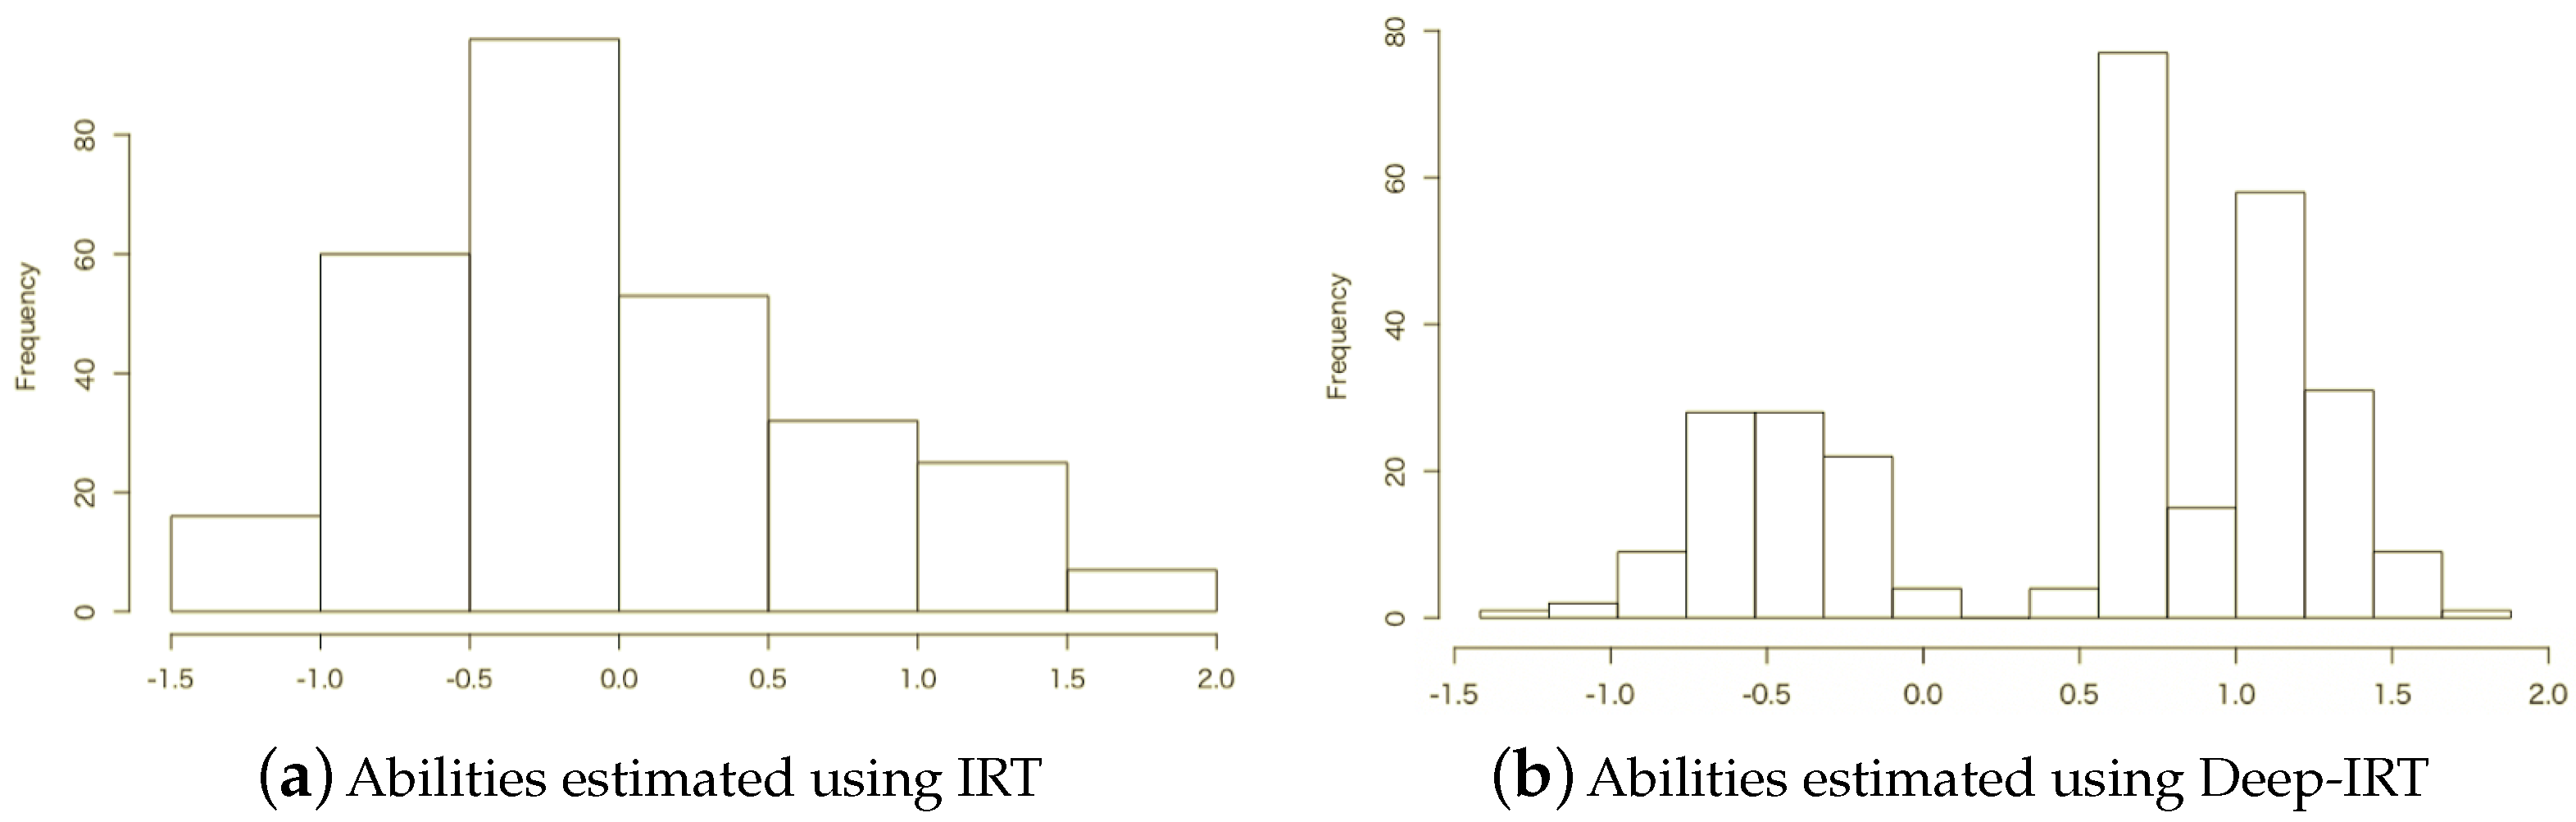
- Deep-IRT can express actual examinees’ abilities distributions flexibly. It does not follow a standard normal distribution.
- The proposed method provides more reliable and robust ability estimation for actual data than IRT does.
2. Related Works
3. Item Response Theory
4. Deep-IRT
4.1. Method
4.2. Learning Parameters
5. Simulation Experiments
5.1. Experiment Settings
Estimation Accuracy
5.2. Estimation Accuracy for Randomly Sampled Examinee Data
- Examinees are sampled randomly from Equation (17).
- The examinees are sorted in order of their ascending ability. Furthermore, the examinees are divided equally into groups of 10 examinees in order of their respective abilities.
- The k th examinee group is assigned to the k-th test.
5.3. Estimation Accuracy for Multi-Population Data
6. Actual Data Experiments
6.1. Actual Datasets
- Information datasets consist of two test data (Information 1, 2) related to information technology. Information 1 has 169 examinees over 50 items. Information 2 has 266 examinees over 50 items. The tests were conducted of the learning management system, “Samurai” developed by [57,58,59]. Rate.Sparse is 0%.
- The critical thinking dataset has 1221 undergraduate examinees over 179 items about critical thinking. Rate.Sparse is 87.8%.
- Program datasets consist of two test data (Program 1, 2) about programming. Program 1 has 93 examinees over 13 items. Rate.Sparse is 0%. Program 2 has 74 examinees over 19 items with 6.8% Rate.Sparse.
- Practice Exam dataset consists of two test data for high school students. Each test relates to mathematics and physics. Mathematics data have 12,348 examinees over 48 items. Physics data have 9172 examinees over 24 items. The respective values of Rate.Sparse are 16.4% and 12.0%.
- Assistments dataset is the 2009–2010 dataset of Assistments (https://sites.google.com/site/assistmentsdata/\home/assistment-2009-2010-data (accessed on 23 April 2021).), which is a large dataset that is used widely for knowledge tracing. Here, we removed examinees answering only one item and items answered by fewer than 30 examinees. For that reason, our dataset has 3941 examinees over 2921 items with 84.4% Rate.Sparse.
- CDM datasets, which are widely used open datasets, are included in the R package CDM [60]. We used two datasets: ECPE and TIMSS. ECPE data include those for 2922 examinees over 28 language-related items. TIMSS data include those for 757 examinees over 23 math items. Rate.Sparse is 0%.
- Statistics dataset includes those of 26 undergraduate examinees over 25 items about statistics. Rate.Sparse is 33.8%.
- Information Ethics dataset has 31 undergraduate examinees over 90 items related to information ethics. Rate.Sparse is 46.3%.
- Engineer Ethics dataset has 85 undergraduate examinees over 69 items related to engineer ethics. Rate.Sparse is 26.4%.
- Classi datasets consist of three test data for high school examinees: tests relate to physics, chemistry, and biology. The tests were conducted on the web-based system, “Classi (https://classi.jp (accessed on 23 April 2021).)” using a tablet. Datasets have 239, 1139, and 192 examinees, respectively, and 119, 364, and 114 items. The respective values of Rate.Sparse are 92.4%, 96.4%, and 93.5%.
6.2. Reliability of Ability Estimation
6.3. Prediction of Responses to Unknown Items
7. Conclusions
- (1)
- Deep-IRT does not assume random sampling of examinees’ abilities from a statistical distribution because the weight matrix of the ability parameters estimates the relation between an examinee’s ability and all other examinees’ abilities.
- (2)
- Deep-IRT estimates examinees’ abilities with high accuracy when the examinees are not sampled randomly from a single distribution or when no common items exist among the different tests.
- (3)
- Deep-IRT flexibly expresses actual examinees’ ability distributions that do not follow a standard normal distribution.
Author Contributions
Funding
Conflicts of Interest
References
- Songmuang, P.; Ueno, M. Bees Algorithm for Construction of Multiple Test Forms in E-Testing. IEEE Trans. Learn. Technol. 2011, 4, 209–221. [Google Scholar] [CrossRef]
- Ishii, T.; Songmuang, P.; Ueno, M. Maximum Clique Algorithm for Uniform Test Forms Assembly. In Proceedings of the 16th International Conference on Artificial Intelligence in Education, Memphis, TN, USA, 9–13 July 2013; Volume 7926, pp. 451–462. [Google Scholar] [CrossRef]
- Ishii, T.; Songmuang, P.; Ueno, M. Maximum Clique Algorithm and Its Approximation for Uniform Test Form Assembly. IEEE Trans. Learn. Technol. 2014, 7, 83–95. [Google Scholar] [CrossRef]
- Ishii, T.; Ueno, M. Clique Algorithm to Minimize Item Exposure for Uniform Test Forms Assembly. In Proceedings of the International Conference on Artificial Intelligence in Education, Madrid, Spain, 22–26 June 2015; pp. 638–641. [Google Scholar] [CrossRef]
- Ishii, T.; Ueno, M. Algorithm for Uniform Test Assembly Using a Maximum Clique Problem and Integer Programming. In Proceedings of the Artificial Intelligence in Education, Wuhan, China, 28 June–1 July 2017; Springer International Publishing: Berlin/Heidelberg, Germany, 2017; pp. 102–112. [Google Scholar] [CrossRef]
- Lin, Y.; Jiang, Y.S.; Gong, Y.J.; Zhan, Z.H.; Zhang, J. A Discrete Multiobjective Particle Swarm Optimizer for Automated Assembly of Parallel Cognitive Diagnosis Tests. IEEE Trans. Cybern. 2018, 1–14. [Google Scholar] [CrossRef] [PubMed]
- Vie, J.J.; Popineau, F.; Bruillard, E.; Bourda, Y. Automated Test Assembly for Handling Learner Cold-Start in Large-Scale Assessments. Int. J. Artif. Intell. Educ. 2018, 28. [Google Scholar] [CrossRef]
- Rodríguez-Cuadrado, J.; Delgado-Gómez, D.; Laria, J.; Rodriguez-Cuadrado, S. Merged Tree-CAT: A fast method for building precise Computerized Adaptive Tests based on Decision Trees. Expert Syst. Appl. 2019, 143, 113066. [Google Scholar] [CrossRef]
- Linden, W.; Jiang, B. A Shadow-Test Approach to Adaptive Item Calibration. Psychometrika 2020, 85. [Google Scholar] [CrossRef]
- Ren, H.; Choi, S.; Linden, W. Bayesian adaptive testing with polytomous items. Behaviormetrika 2020, 47. [Google Scholar] [CrossRef]
- Lord, F.; Novick, M. Statistical Theories of Mental Test Scores; Addison-Wesley: Boston, MA, USA, 1968; p. xiii. 274p. [Google Scholar]
- Van der Linden, W.J. Handbook of Item Response Theory, Volume Three: Applications; Chapman and Hall/CRC Statistics in the Social and Behavioral Sciences; Chapman and Hall/CRC: Boca Raton, FL, USA, 2016. [Google Scholar]
- Lord, F. Applications of Item Response Theory to Practical Testing Problems; Lawrence Erlbaum Associates: Hillsdale, NJ, USA, 1980. [Google Scholar]
- Van der Linden, W.J. Handbook of Item Response Theory, Volume Two: Statistical Tools; Chapman and Hall/CRC Statistics in the Social and Behavioral Sciences; Chapman and Hall/CRC: Boca Raton, FL, USA, 2016. [Google Scholar]
- Joo, S.H.; Lee, P.; Stark, S. Evaluating Anchor-Item Designs for Concurrent Calibration With the GGUM. Appl. Psychol. Meas. 2017, 41, 83–96. [Google Scholar] [CrossRef]
- Ogasawara, H. Standard Errors of Item Response Theory Equating/Linking by Response Function Methods. Appl. Psychol. Meas. 2001, 25, 53–67. [Google Scholar] [CrossRef]
- van der Linden, W.; Barrett, M.D. Linking Item Response Model Parameters. Psychometrika 2016, 81, 650–673. [Google Scholar] [CrossRef]
- Andersson, B. Asymptotic Variance of Linking Coefficient Estimators for Polytomous IRT Models. Appl. Psychol. Meas. 2018, 42, 192–205. [Google Scholar] [CrossRef]
- Barrett, M.D.; van der Linden, W.J. Estimating Linking Functions for Response Model Parameters. J. Educ. Behav. Stat. 2019, 44, 180–209. [Google Scholar] [CrossRef]
- Yeung, C. Deep-IRT: Make Deep Learning Based Knowledge Tracing Explainable Using Item Response Theory. In Proceedings of the 12th International Conference on Educational Data Mining, EDM, Montreal, QC, Canada, 2–5 July 2019. [Google Scholar]
- Cheng, S.; Liu, Q. Enhancing Item Response Theory for Cognitive Diagnosis. CoRR 2019, abs/1905.10957. Available online: http://xxx.lanl.gov/abs/1905.10957 (accessed on 23 April 2021).
- Ghosh, A.; Heffernan, N.; Lan, A.S. Context-Aware Attentive Knowledge Tracing. In Proceedings of the 26th ACM SIGKDD International Conference on Knowledge Discovery & Data Mining, Virtual Event, CA, USA, 23–27 August 2020. [Google Scholar]
- Gan, W.; Sun, Y.; Sun, Y. Knowledge Interaction Enhanced Knowledge Tracing for Learner Performance Prediction. In Proceedings of the 2020 Seventh International Conference on Behavioural and Social Computing (BESC), Bournemouth, UK, 5–7 November 2020; pp. 1–6. [Google Scholar] [CrossRef]
- He, H.; Huang, G.; Yuan, Y. Asymmetric Valleys: Beyond Sharp and Flat Local Minima. In Advances in Neural Information Processing Systems 32; Curran Associates, Inc.: New York City, NY, USA, 2019; pp. 2553–2564. [Google Scholar]
- Morcos, A.; Yu, H.; Paganini, M.; Tian, Y. One ticket to win them all: Generalizing lottery ticket initializations across datasets and optimizers. In Advances in Neural Information Processing Systems 32; Curran Associates, Inc.: New York City, NY, USA, 2019; pp. 4932–4942. [Google Scholar]
- Nagarajan, V.; Kolter, J.Z. Uniform convergence may be unable to explain generalization in deep learning. In Advances in Neural Information Processing Systems 32; Curran Associates, Inc.: New York City, NY, USA, 2019; pp. 11615–11626. [Google Scholar]
- Tsutsumi, E.; Kinoshita, R.; Ueno, M. Deep-IRT with independent student and item networks. In Proceedings of the 14th International Conference on Educational Data Mining, EDM, Paris, France, 29 June–2 July 2021. [Google Scholar]
- Corbett, A.T.; Anderson, J.R. Knowledge tracing: Modeling the acquisition of procedural knowledge. User Model. User-Adapt. Interact. 1994, 4, 253–278. [Google Scholar] [CrossRef]
- González-Brenes, J.; Huang, Y.; Brusilovsky, P. Fast: Feature-aware student knowledge tracing. In Proceedings of the NIPS 2013 Workshop on Data Driven Education, Lake Taho, NV, USA, 9–10 December 2013. [Google Scholar]
- Piech, C.; Bassen, J.; Huang, J.; Ganguli, S.; Sahami, M.; Guibas, L.J.; Sohl-Dickstein, J. Deep Knowledge Tracing. In Advances in Neural Information Processing Systems 28; Cortes, C., Lawrence, N.D., Lee, D.D., Sugiyama, M., Garnett, R., Eds.; Curran Associates, Inc.: New York City, NY, USA, 2015; pp. 505–513. [Google Scholar]
- Khajah, M.; Lindsey, R.V.; Mozer, M.C. How Deep is Knowledge Tracing? arXiv 2016, arXiv:1604.02416. [Google Scholar]
- Zhang, J.; Shi, X.; King, I.; Yeung, D.Y. Dynamic Key-Value Memory Network for Knowledge Tracing. In Proceedings of the 26th International Conference on World Wide Web, WWW ’17, Perth, Australia, 3–7 May 2017; International World Wide Web Conferences Steering Committee: Geneva, Switzerland, 2017; pp. 765–774. [Google Scholar]
- Vie, J.; Kashima, H. Knowledge Tracing Machines: Factorization Machines for Knowledge Tracing. arXiv 2018, arXiv:1811.03388. [Google Scholar] [CrossRef]
- Pandey, S.; Karypis, G. A Self-Attentive model for Knowledge Tracing. In Proceedings of the International Conference on Education Data Mining, Montreal, QC, Canada, 2–5 July 2019. [Google Scholar]
- Hochreiter, S.; Schmidhuber, J. Long Short-Term Memory. Neural Comput. 1997, 9, 1735–1780. [Google Scholar] [CrossRef] [PubMed]
- Rasch, G. Probabilistic Models for Some Intelligence and Attainment Tests; MESA Press: San Diego, CA, USA, 1993. [Google Scholar]
- Hanson, B.A.; Béguin, A.A. Obtaining a Common Scale for Item Response Theory Item Parameters Using Separate Versus Concurrent Estimation in the Common-Item Equating Design. Appl. Psychol. Meas. 2002, 26, 3–24. [Google Scholar] [CrossRef]
- Hu, H.; Rogers, W.T.; Vukmirovic, Z. Investigation of IRT-Based Equating Methods in the Presence of Outlier Common Items. Appl. Psychol. Meas. 2008, 32, 311–333. [Google Scholar] [CrossRef]
- Kolen, M.J.; Brennan, R.L. Test Equating, Scaling, and Linking: Methods and Practices, 2nd ed.; Springer: New York City, NY, USA, 2004. [Google Scholar]
- Gonzãlez, J.; Wiberg, M. Applying Test Equating Methods: Using R; Springer: Berlin/Heidelberg, Germany, 2017. [Google Scholar]
- Marco, G.L. Item Characteristic Curve Solutions to Three Intractable Testing Problems. J. Educ. Meas. 1977, 14, 139–160. [Google Scholar] [CrossRef]
- Loyd, B.H.; Hoover, H.D. Vertical Equating Using the Rasch Model. J. Educ. Meas. 1980, 17, 179–193. [Google Scholar] [CrossRef]
- Haebara, T. Equating Logistic Ability Scales by a Weighted Least Squares Method. Jpn. Psychol. Res. 1980, 22, 144–149. [Google Scholar] [CrossRef]
- Stocking, M.L.; Lord, F.M. Developing a Common Metric in Item Response Theory. Appl. Psychol. Meas. 1983, 7, 201–210. [Google Scholar] [CrossRef]
- Arai, S.; Mayekawa, S. A Comparison of Equating Methods and Linking Designs for Developing an Item Pool Under Item Response Theory. Behaviormetrika 2011, 38, 1–16. [Google Scholar] [CrossRef]
- Sansivieri, V.; Wiberg, M.; Matteucci, M. A Review of Test Equating Methods with a Special Focus on IRT-Based Approaches. Statistica 2018, 77, 329–352. [Google Scholar] [CrossRef]
- He, Y.; Cui, Z. Evaluating Robust Scale Transformation Methods With Multiple Outlying Common Items Under IRT True Score Equating. Appl. Psychol. Meas. 2020, 44, 296–310. [Google Scholar] [CrossRef]
- Robitzsch, A. Robust Haebara Linking for Many Groups: Performance in the Case of Uniform DIF. Psych 2020, 2, 155–173. [Google Scholar] [CrossRef]
- Robitzsch, A.; Lüdtke, O. Supplemental Material: A Review of Different Scaling Approaches under Full Invariance. Psych. Test Assess. Model 2020, 62, 233–279. [Google Scholar] [CrossRef]
- Bock, R.D.; Zimowski, M.F. Multiple Group IRT. In Handbook of Modern Item Response Theory; Springer: Berlin/Heidelberg, Germany, 1997; pp. 433–448. [Google Scholar]
- Jodoin, M.; Keller, L.; Swaminathan, H. A Comparison of Linear, Fixed Common Item, and Concurrent Parameter Estimation Equating Procedures in Capturing Academic Growth. J. Exp. Educ. 2003, 71, 229–250. [Google Scholar] [CrossRef]
- Li, Y.; Tam, H.; Tompkins, L.J. A Comparison of Using the Fixed Common-Precalibrated Parameter Method and the Matched Characteristic Curve Method for Linking Multiple-Test Items. Int. J. Test. 2004, 4, 267–293. [Google Scholar] [CrossRef]
- Shen, W.; Wang, X.; Bai, X.; Zhang, Z. DeepContour: A deep convolutional feature learned by positive-sharing loss for contour detection. In Proceedings of the 2015 IEEE Conference on Computer Vision and Pattern Recognition (CVPR), Boston, MA, USA, 7–12 June 2015; pp. 3982–3991. [Google Scholar] [CrossRef]
- Kingma, D.P.; Ba, J. Adam: A Method for Stochastic Optimization. arXiv 2014, arXiv:1412.6980. [Google Scholar]
- Kilmen, S.; Demirtasli, N. Comparison of Test Equating Methods Based on Item Response Theory According to the Sample Size and Ability Distribution. Procedia Soc. Behav. Sci. 2012, 46, 130–134. [Google Scholar] [CrossRef]
- Uysal, I.; Kilmen, S. Comparison of Item Response Theory Test Equating Methods for Mixed Format Tests. Int. Online J. Educ. Sci. 2016, 8, 1–11. [Google Scholar] [CrossRef]
- Ueno, M. Animated agent to maintain learner’s attention in e-learning. In Proceedings of the E-Learn: World Conference on E-Learning in Corporate, Government, Healthcare, and Higher Education 2004; Nall, J., Robson, R., Eds.; Association for the Advancement of Computing in Education (AACE): Washington, DC, USA, 2004; pp. 194–201. [Google Scholar]
- Ueno, M. Data Mining and Text Mining Technologies for Collaborative Learning in an ILMS “Samurai”. In Proceedings of the ICALT ’04 Proceedings of the IEEE International Conference on Advanced Learning Technologies, Joensuu, Finland, 30 August–1 September 2004; pp. 1052–1053. [Google Scholar] [CrossRef]
- Ueno, M. Intelligent LMS with an agent that learns from log data. In Proceedings of E-Learn: World Conference on E-Learning in Corporate, Government, Healthcare, and Higher Education 2005; Richards, G., Ed.; Association for the Advancement of Computing in Education (AACE): Vancouver, BC, Canada, 2005; pp. 3169–3176. [Google Scholar]
- George, A.C.; Robitzsch, A.; Kiefer, T.; Groß, J.; Ünlü, A. The R Package CDM for Cognitive Diagnosis Models. J. Stat. Softw. Artic. 2016, 74, 1–24. [Google Scholar] [CrossRef]
- Ueno, M.; Miyazawa, Y. Probability Based Scaffolding System with Fading. In Proceedings of the Artificial Intelligence in Education—17th International Conference, AIED, Madrid, Spain, 21–25 June 2015; pp. 237–246. [Google Scholar] [CrossRef]
- Ueno, M.; Miyazawa, Y. IRT-Based Adaptive Hints to Scaffold Learning in Programming. IEEE Trans. Learn. Technol. 2018, 11, 415–428. [Google Scholar] [CrossRef]
- Wilson, K.H.; Karklin, Y.; Han, B.; Ekanadham, C. Back to the basics: Bayesian extensions of IRT outperform neural networks for proficiency estimation. In Proceedings of the 9th International Conference on Educational Data Mining, Raleigh, NC, USA, 29 June– 2 July 2016; Volume 1, pp. 539–544. [Google Scholar]
- Ueno, M.; Pokpong, S. Computerized Adaptive Testing Based on Decision Tree. In Proceedings of the Advanced Learning Technologies (ICALT), 2010 IEEE Tenth International Conference, Sousse, Tunisia, 5–7 July 2010; pp. 191–193. [Google Scholar]
- Ueno, M. Adaptive testing based on Bayesian decision theory. In Proceedings of the International Conference on Artificial Intelligence in Education, Memphis, TN, USA, 9–13 July 2013; pp. 712–716. [Google Scholar]


| Parameter | Value | Parameter | Value |
|---|---|---|---|
| 50 | 0.1 | ||
| 50 | 0.1 | ||
| 50 | 0.1 | ||
| 50 | 0.1 | ||
| Epoch | 300 | 0.2 | |
| - | - | 0.8 | |
| - | - | 0.2 | |
| - | - | 0.8 |
| Assignment | No. Items of Each Test | No. Common Items (Total No. Items) | No. Examinees for Each Test (Total No. Examinees) | Method | RMSE | Pearson | Kendall |
|---|---|---|---|---|---|---|---|
| random | 10 | 5 (55) | 50 (500) | Deep-IRT | 0.469 | 0.890 | 0.748 |
| IRT | 0.420 | 0.912 | 0.781 | ||||
| 100 (1000) | Deep-IRT | 0.447 | 0.900 | 0.766 | |||
| IRT | 0.438 | 0.904 | 0.770 | ||||
| 500 (5000) | Deep-IRT | 0.434 | 0.907 | 0.769 | |||
| IRT | 0.432 | 0.907 | 0.776 | ||||
| 1000 (10,000) | Deep-IRT | 0.424 | 0.908 | 0.771 | |||
| IRT | 0.411 | 0.911 | 0.733 | ||||
| 0 (100) | 50 (500) | Deep-IRT | 0.458 | 0.896 | 0.747 | ||
| IRT | 0.456 | 0.896 | 0.751 | ||||
| 100 (1000) | Deep-IRT | 0.455 | 0.832 | 0.765 | |||
| IRT | 0.440 | 0.903 | 0.767 | ||||
| 500 (5000) | Deep-IRT | 0.433 | 0.852 | 0.785 | |||
| IRT | 0.423 | 0.861 | 0.789 | ||||
| 1000 (10,000) | Deep-IRT | 0.412 | 0.910 | 0.799 | |||
| IRT | 0.403 | 0.914 | 0.794 | ||||
| 30 | 5 (255) | 50 (500) | Deep-IRT | 0.328 | 0.921 | 0.855 | |
| IRT | 0.301 | 0.941 | 0.865 | ||||
| 100 (1000) | Deep-IRT | 0.319 | 0.949 | 0.865 | |||
| IRT | 0.292 | 0.957 | 0.870 | ||||
| 500 (5000) | Deep-IRT | 0.339 | 0.942 | 0.834 | |||
| IRT | 0.290 | 0.958 | 0.873 | ||||
| 1000 (10,000) | Deep-IRT | 0.329 | 0.947 | 0.844 | |||
| IRT | 0.298 | 0.968 | 0.879 | ||||
| 0 (300) | 50 (500) | Deep-IRT | 0.328 | 0.946 | 0.860 | ||
| IRT | 0.308 | 0.952 | 0.858 | ||||
| 100 (1000) | Deep-IRT | 0.339 | 0.943 | 0.851 | |||
| IRT | 0.314 | 0.951 | 0.858 | ||||
| 500 (5000) | Deep-IRT | 0.321 | 0.941 | 0.853 | |||
| IRT | 0.299 | 0.945 | 0.873 | ||||
| 1000 (10,000) | Deep-IRT | 0.302 | 0.938 | 0.853 | |||
| IRT | 0.281 | 0.948 | 0.881 | ||||
| 50 | 5 (455) | 50 (500) | Deep-IRT | 0.317 | 0.950 | 0.882 | |
| IRT | 0.251 | 0.969 | 0.895 | ||||
| 100 (1000) | Deep-IRT | 0.312 | 0.964 | 0.891 | |||
| IRT | 0.243 | 0.970 | 0.896 | ||||
| 500 (5000) | Deep-IRT | 0.288 | 0.959 | 0.894 | |||
| IRT | 0.232 | 0.973 | 0.901 | ||||
| 1000 (10,000) | Deep-IRT | 0.278 | 0.961 | 0.894 | |||
| IRT | 0.234 | 0.973 | 0.901 | ||||
| 0 (500) | 50 (500) | Deep-IRT | 0.360 | 0.935 | 0.856 | ||
| IRT | 0.274 | 0.962 | 0.876 | ||||
| 100 (1000) | Deep-IRT | 0.261 | 0.966 | 0.884 | |||
| IRT | 0.251 | 0.968 | 0.892 | ||||
| 500 (5000) | Deep-IRT | 0.341 | 0.942 | 0.887 | |||
| IRT | 0.241 | 0.971 | 0.899 | ||||
| 1000 (10,000) | Deep-IRT | 0.266 | 0.968 | 0.889 | |||
| IRT | 0.241 | 0.972 | 0.901 | ||||
| system | 10 | 5 (55) | 50 (500) | Deep-IRT | 0.665 | 0.778 | 0.568 |
| IRT | 1.111 | 0.381 | 0.237 | ||||
| 100 (1000) | Deep-IRT | 0.622 | 0.807 | 0.629 | |||
| IRT | 0.779 | 0.696 | 0.466 | ||||
| 500 (5000) | Deep-IRT | 0.611 | 0.812 | 0.639 | |||
| IRT | 0.792 | 0.702 | 0.499 | ||||
| 1000 (10,000) | Deep-IRT | 0.621 | 0.822 | 0.651 | |||
| IRT | 0.712 | 0.702 | 0.501 | ||||
| 0 (100) | 50 (500) | Deep-IRT | 0.997 | 0.502 | 0.267 | ||
| IRT | 1.170 | 0.314 | 0.184 | ||||
| 100 (1000) | Deep-IRT | 0.721 | 0.740 | 0.561 | |||
| IRT | 1.176 | 0.308 | 0.197 | ||||
| 500 (5000) | Deep-IRT | 0.701 | 0.761 | 0.591 | |||
| IRT | 1.016 | 0.498 | 0.277 | ||||
| 1000 (10,000) | Deep-IRT | 0.698 | 0.782 | 0.591 | |||
| IRT | 0.808 | 0.673 | 0.457 | ||||
| 30 | 5 (255) | 50 (500) | Deep-IRT | 0.561 | 0.835 | 0.696 | |
| IRT | 0.613 | 0.786 | 0.622 | ||||
| 100 (1000) | Deep-IRT | 0.501 | 0.875 | 0.716 | |||
| IRT | 0.573 | 0.836 | 0.672 | ||||
| 500 (5000) | Deep-IRT | 0.499 | 0.878 | 0.722 | |||
| IRT | 0.553 | 0.846 | 0.679 | ||||
| 1000 (10,000) | Deep-IRT | 0.495 | 0.892 | 0.731 | |||
| IRT | 0.534 | 0.851 | 0.691 | ||||
| 0 (300) | 50 (500) | Deep-IRT | 0.661 | 0.781 | 0.586 | ||
| IRT | 0.786 | 0.691 | 0.489 | ||||
| 100 (1000) | Deep-IRT | 0.579 | 0.832 | 0.664 | |||
| IRT | 0.762 | 0.709 | 0.506 | ||||
| 500 (5000) | Deep-IRT | 0.561 | 0.852 | 0.684 | |||
| IRT | 0.732 | 0.705 | 0.512 | ||||
| 1000 (10,000) | Deep-IRT | 0.539 | 0.850 | 0.644 | |||
| IRT | 0.712 | 0.709 | 0.506 | ||||
| 50 | 5 (455) | 50 (500) | Deep-IRT | 0.376 | 0.929 | 0.802 | |
| IRT | 0.426 | 0.909 | 0.760 | ||||
| 100 (1000) | Deep-IRT | 0.393 | 0.923 | 0.811 | |||
| IRT | 0.805 | 0.750 | 0.543 | ||||
| 500 (5000) | Deep-IRT | 0.372 | 0.930 | 0.810 | |||
| IRT | 1.044 | 0.454 | 0.282 | ||||
| 1000 (10,000) | Deep-IRT | 0.392 | 0.914 | 0.798 | |||
| IRT | 0.923 | 0.512 | 0.342 | ||||
| 0 (500) | 50 (500) | Deep-IRT | 0.635 | 0.798 | 0.599 | ||
| IRT | 0.782 | 0.694 | 0.489 | ||||
| 100 (1000) | Deep-IRT | 0.408 | 0.916 | 0.785 | |||
| IRT | 0.612 | 0.812 | 0.532 | ||||
| 500 (5000) | Deep-IRT | 0.421 | 0.891 | 0.765 | |||
| IRT | 0.598 | 0.822 | 0.495 | ||||
| 1000 (10,000) | Deep-IRT | 0.411 | 0.901 | 0.785 | |||
| IRT | 0.602 | 0.829 | 0.498 |
| No. Examinees for Each Test | No. Common Items | μ1 | μ2 | σ2 | IRT | Deep-IRT |
|---|---|---|---|---|---|---|
| 500 | 5 | −0.3 | 0.3 | 0.7 | 0.186 ** | 0.216 |
| −0.5 | 0.5 | 0.5 | 0.184 ** | 0.232 | ||
| −0.7 | 0.7 | 0.3 | 0.210 | 0.206 | ||
| −0.9 | 0.9 | 0.1 | 0.207 | 0.195 * | ||
| 0 | −0.3 | 0.3 | 0.7 | 0.358 | 0.325 * | |
| −0.5 | 0.5 | 0.5 | 0.501 | 0.324 ** | ||
| −0.7 | 0.7 | 0.3 | 0.993 | 0.382 ** | ||
| −0.9 | 0.9 | 0.1 | 1.027 | 0.385 ** |
| Dataset | Method | RMSE | Pearson | Kendall |
|---|---|---|---|---|
| Information 1 | 2PLM | 0.466 | 0.891 | 0.685 |
| Deep-IRT | 0.514 | 0.867 | 0.687 | |
| Information 2 | 2PLM | 0.562 | 0.841 | 0.668 |
| Deep-IRT | 0.555 | 0.845 | 0.662 | |
| Critical Thinking | 2PLM | 1.064 | 0.464 | 0.318 |
| Deep-IRT | 1.025 | 0.474 | 0.327 | |
| Program 1 | 2PLM | 0.890 | 0.599 | 0.403 |
| Deep-IRT | 0.864 | 0.622 | 0.417 | |
| Program 2 | 2PLM | 0.752 | 0.713 | 0.468 |
| Deep-IRT | 0.720 | 0.737 | 0.475 | |
| Practice_Math | 2PLM | 0.589 | 0.748 | 0.533 |
| Deep-IRT | 0.744 | 0.723 | 0.514 | |
| Practice_Physics | 2PLM | 0.884 | 0.609 | 0.424 |
| Deep-IRT | 0.911 | 0.585 | 0.411 | |
| ASSISTMENTS | 2PLM | 0.827 | 0.658 | 0.441 |
| Deep-IRT | 0.849 | 0.639 | 0.478 | |
| ECPE | 2PLM | 0.875 | 0.615 | 0.435 |
| Deep-IRT | 0.874 | 0.618 | 0.440 | |
| TIMSS | 2PLM | 0.753 | 0.716 | 0.525 |
| Deep-IRT | 0.753 | 0.716 | 0.523 | |
| Statistics | 2PLM | 0.619 | 0.801 | 0.398 |
| Deep-IRT | 0.545 | 0.846 | 0.582 | |
| Information Ethics | 2PLM | 0.394 | 0.920 | 0.643 |
| Deep-IRT | 0.382 | 0.925 | 0.712 | |
| Engineer Ethics | 2PLM | 0.544 | 0.850 | 0.403 |
| Deep-IRT | 0.517 | 0.865 | 0.313 | |
| Classi_Physics | 2PLM | 1.053 | 0.444 | 0.299 |
| Deep-IRT | 0.943 | 0.554 | 0.403 | |
| Classi_Chemistry | 2PLM | 1.077 | 0.420 | 0.297 |
| Deep-IRT | 0.923 | 0.574 | 0.439 | |
| Classi_Biology | 2PLM | 1.020 | 0.475 | 0.326 |
| Deep-IRT | 0.748 | 0.717 | 0.531 | |
| Average | 2PLM | 0.764 | 0.680 | 0.451 |
| Deep-IRT | 0.742 | 0.707 | 0.495 * |
| Data | No. Examinees | No. Items | Rate.Sparse | IRT | Deep-IRT |
|---|---|---|---|---|---|
| Information 1 | 169 | 50 | 0% | 0.734 | 0.737 |
| Information 2 | 266 | 50 | 0% | 0.699 | 0.700 |
| Critical Thinking | 1221 | 179 | 87.8% | 0.695 | 0.689 |
| Program 1 | 94 | 13 | 0% | 0.719 | 0.729 |
| Program 2 | 74 | 19 | 6.8% | 0.676 | 0.685 |
| Practice_Math | 12,348 | 48 | 16.4% | 0.783 | 0.780 |
| Practice_Physics | 9172 | 24 | 12.0% | 0.721 | 0.710 |
| ASSISTMENTS | 3941 | 2921 | 84.4% | 0.685 | 0.679 |
| ECPE | 2922 | 28 | 0% | 0.719 | 0.729 |
| TIMSS | 757 | 24 | 0% | 0.711 | 0.712 |
| Statistics | 26 | 25 | 33.8% | 0.852 | 0.893 |
| Information Ethics | 31 | 90 | 46.3% | 0.746 | 0.803 |
| Engineer Ethics | 85 | 69 | 26.4% | 0.634 | 0.685 |
| Classi_Physics | 239 | 119 | 92.4% | 0.720 | 0.721 |
| Classi_Chemistry | 1139 | 364 | 96.4% | 0.710 | 0.711 |
| Classi_Biology | 192 | 114 | 93.5% | 0.722 | 0.725 |
| Average | 0.719 | 0.728 * |
Publisher’s Note: MDPI stays neutral with regard to jurisdictional claims in published maps and institutional affiliations. |
© 2021 by the authors. Licensee MDPI, Basel, Switzerland. This article is an open access article distributed under the terms and conditions of the Creative Commons Attribution (CC BY) license (https://creativecommons.org/licenses/by/4.0/).
Share and Cite
Tsutsumi, E.; Kinoshita, R.; Ueno, M. Deep Item Response Theory as a Novel Test Theory Based on Deep Learning. Electronics 2021, 10, 1020. https://doi.org/10.3390/electronics10091020
Tsutsumi E, Kinoshita R, Ueno M. Deep Item Response Theory as a Novel Test Theory Based on Deep Learning. Electronics. 2021; 10(9):1020. https://doi.org/10.3390/electronics10091020
Chicago/Turabian StyleTsutsumi, Emiko, Ryo Kinoshita, and Maomi Ueno. 2021. "Deep Item Response Theory as a Novel Test Theory Based on Deep Learning" Electronics 10, no. 9: 1020. https://doi.org/10.3390/electronics10091020
APA StyleTsutsumi, E., Kinoshita, R., & Ueno, M. (2021). Deep Item Response Theory as a Novel Test Theory Based on Deep Learning. Electronics, 10(9), 1020. https://doi.org/10.3390/electronics10091020