Article

Hierarchic Clustering-Based Face Enhancement for Images Captured in Dark Fields

1
Beijing Engineering Research Center of Industrial Spectrum Imaging, University of Science and Technology, Beijing 100083, China
2
School of Electronic and Electrical Engineering, School of Mechanical Engineering, University of Leeds, Leeds LS2 9JT, UK
*
Author to whom correspondence should be addressed.
Electronics 2021, 10(8), 936; https://doi.org/10.3390/electronics10080936
Submission received: 9 March 2021 / Revised: 3 April 2021 / Accepted: 12 April 2021 / Published: 14 April 2021
(This article belongs to the Section Computer Science & Engineering)

Abstract

:
A hierarchic clustering-based enhancement is proposed to solve the luminance compensation of face recognition in the dark field. First, the face image is divided into five levels by a clustering method. Second, the results above are mapped into three hierarchies according to the histogram thresholds. A low, a middle, and a high-intensity block are found. Third, two kinds of linear transforms are performed to the high and the low-intensity blocks. Finally, a center wrap function-based enhancement is carried out. Experiment results show our method can improve both the face recognition accuracy and image quality.

1. Introduction

Facial recognition has been widely used in modern society; however, its application in dark fields is still limited. For example, face recognition accuracy becomes low at night [1]. In engineering, a dark field means the environment luminance is lower than 300 lx, which may cause a low contrast and a serious detail occlusion problem. Currently, three types of methods have been developed to solve this problem [2]: preprocessing-based methods, lighting model-based techniques, and lighting normalization-based algorithms. The first method processes image by histogram equalization [3,4,5], gamma correction [6], or homomorphic filtering [7], etc. Clearly, shadow occlusion problems cannot be solved well. The second technique uses lighting modeling and a 3D face [8,9,10,11] for recognition. Unfortunately, complex calculation limits its application. Moreover, the third algorithm uses the Retinex-related model [12,13,14] to improve the face details. However, facial characteristics may be lost.
A hierarchic clustering-based enhancement is proposed to realize robust face recognition in this investigation. This method combines preprocessing-based methods and lighting normalization-based techniques. Affected by light, the face will be divided into multiple areas, i.e., the normal face region, the shadow, and the glare approximately. Obviously, the extreme dark or bright parts will cause issues of a wide dynamic range, which can decrease the processing effects of related algorithms. Currently, the clustering method has been extensively used for lighting compensation and shadow elimination. Devi [15] used the Gaussian membership function and fuzzy C-mean clustering to enhance the image contrast. Lin [16] optimized universal contrast enhancement variable by a fuzzy clustering method. After investigations, it can be found the methods above still have some problems: when carrying out the region segmentation, the amounts of categories are only determined by the human-involved experiences. After segmentation, the impact of ambient light is not considered for the detail enhancement.
This study aims to solve the problem of face enhancement in dark fields, which leads to low contrast, lost details, and difficult recognition. The main contributions of this study are: (1) a novel hierarchical clustering-based face recognition method is proposed, which has better computational robustness and stability in solving the negative influence of dark field environment light; (2) a new Beer–Lambert law-related dimension reduction of face cluster and an automatic threshold and average gray value-based linear transform approach are also developed.
The rest of the paper is organized as follows: In Section 2, the algorithm’s main contents are outlined. In Section 3, a series of experiments are undertaken, and the results are presented. In Section 4, the conclusions are emphasized, and future directions for possible extensions are suggested.

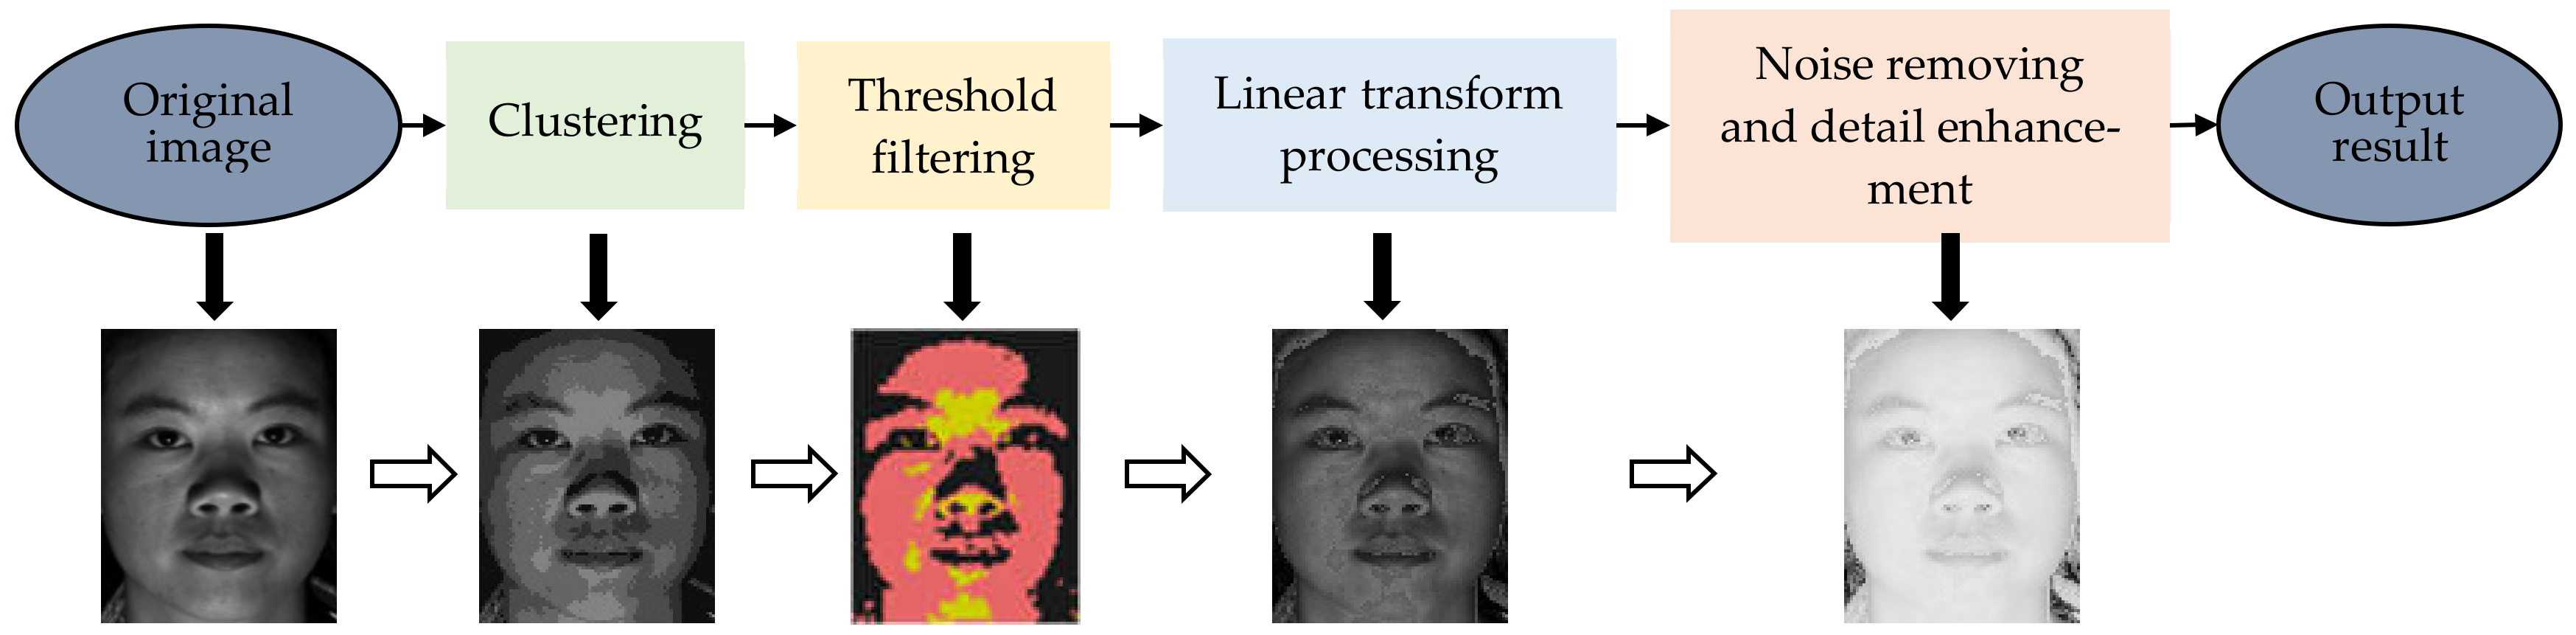
2. Proposed Algorithm

Figure 1 presents the computational flowchart of the proposed algorithm. When performing our calculations, first, the face image is divided into multiple levels by clustering. Since the reflection characteristic of skin, eyes, mouth, and eyebrows are totally different, a melanin and hemoglobin imaging-based method [17] is considered to segment the original image into 5 levels. Both the histogram of the original image and the confidence interval theory of Gaussian distribution [18] are used to map the clustering results above into 3 categories. In Figure 1, a low, a middle, and a high segmented result can be observed by the black, pink, and yellow colors, respectively. After this, two kinds of linear transforms are performed to the low and the high segmented regions. These operations can decrease the imaging effect of the over bright and the over dark phenomena. Finally, a center wrap function-based contrast enhancement is carried out to improve the face details.

2.1. Initial Clustering of Face Image

The first step uses the k-means clustering technique to segment the original face into 5 levels, and melanin and hemoglobin imaging-based methods are developed to determine its clustering amount. The k-means is considered here just because this method is simple, efficient, and easy to use. Without loss of generality, four methods are compared to assess the computational performance of k-means: the k-means, the balanced iterative reducing and clustering using hierarchies (BIRCH), the agglomerative clustering, and the density-based spatial clustering of applications with noise (DBSCAN) [19,20]. Table 1 shows the average running time of these algorithms above under the same amount of data sets, and the time of k-means is the shortest one. Clearly, k-means also has merits, such as fast speed and few control parameters [21,22], while some other algorithms are effective but slow in efficiency.
When implementing the k-means calculation, first, the class centers are selected randomly; then the initial clustering is performed to get the initial segmentation results of pixel blocks; after this, some new cluster centers are computed by the segmented regions above according to the minimum distance principle, and then the next round of clustering will be carried out. Equation (1) presents the calculation method of clustering. This computational procedure above will be implemented repeatedly until the maximum iteration number is reached. Clearly, when performing the k-means, it is necessary to set the clustering amount, i.e., the variable k in (1).
V = k i = 1 x i c i x i u i 2
where x i is the input data; u i is the ith class center, and its value is mapped into [0,1]; and i = 1 , 2 , , k .
Since the over bright or the over dark regions will occlude the image details seriously, two methods are developed to determine k . The dichromatic reflection model [23] is applied to model the light incident on the skin. In general, the skin color is determined by different concentrations of melanin and hemoglobin. According to the Beer–Lambert law [24], after the incident light is scattered by the skin surface and the dermis, the intensity of emitted light can be estimated by (2). When processing the over the dark region, the Tsumura’s principle [25] has told us the relative absorbance σ m and σ h will not change with different races and genders. Thus the value k can be estimated by the ratio between the middle-level and the next to last-level gray values of the clustered image (Equations (3) and (4)). When dealing with the over bright region, the diffuse reflectance [26] can be defined and computed by (5) and (6); and its estimation can be calculated by (7). Clearly, the bigger the diffuse reflectance A is, the better the face recognition effect will be:
R p , λ = e ρ m p θ m λ l m λ + ρ h p θ h λ l h λ E p , λ
δ = u k / 2 / u 2
S T D = 1 N N i = 1 δ ¯ δ i 2
A = σ m ρ m p σ h ρ h p = e θ m λ l m λ ρ m p e θ h λ l h λ ρ h p
A = R p , λ / E p , λ
A ^ = u k / 2 / u k
where R p , λ means the irradiance of the emergent light; E p , λ indicates the irradiance of the incident light; λ is the wavelength of the incident light; p means the observed pixel; ρ m p and ρ h p are the densities of melanin and hemoglobin; θ m λ and θ h λ are the spectral cross-sections of melanin and hemoglobin, respectively; l m λ and l h λ are the mean path lengths of photons in epidermis and dermis; δ is the ratio between u k / 2 and u 2 ; means to get the integral value of symbol *; S T D is the standard deviation of δ ; δ ¯ is the average of δ i ( i = 1, 2, …, N ); N is the number of images; σ m and σ h are the relative absorbance; A is the diffuse reflectance; and A ^ is the estimation of A .
Figure 2 presents the relationship between the clustering amount and the S T D . According to (4), a small standard deviation indicates the data are stable, and the corresponding clustering amount is optimal. Thus the clustering amount should be set by 5 according to Figure 2 and Figure 3, which provides the relationship between the clustering amount and the estimated diffuse reflectance A . In Equation (7), the brightest gray value divided by the intermediate gray value is defined as the diffuse reflectance. From Figure 3, the categories 5 gets the largest evaluation value. Finally, category 5 is selected for our algorithm. Figure 4 shows the image samples and the results after clustering. These pictures are selected by considering the gender, the postures, the shadow, and the glare. If the gray intensity is blackest, its corresponding gray level is 1; differently, its gray level will be 5 when the gray intensity is brightest.

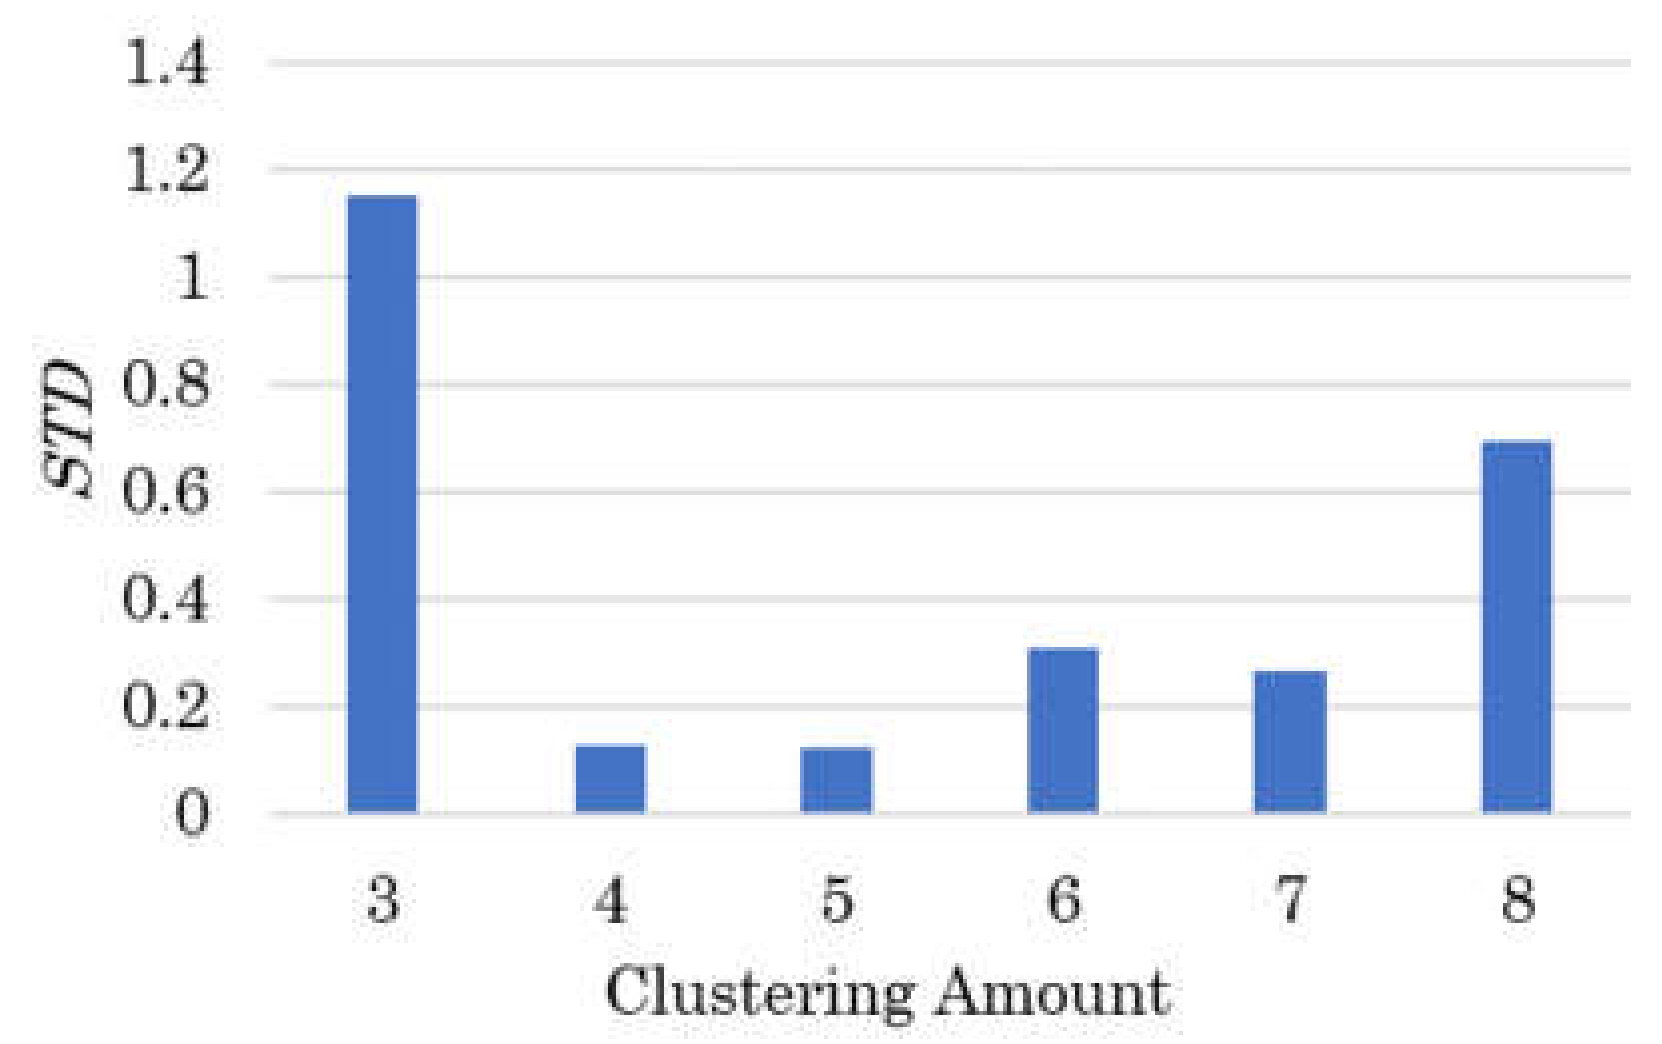
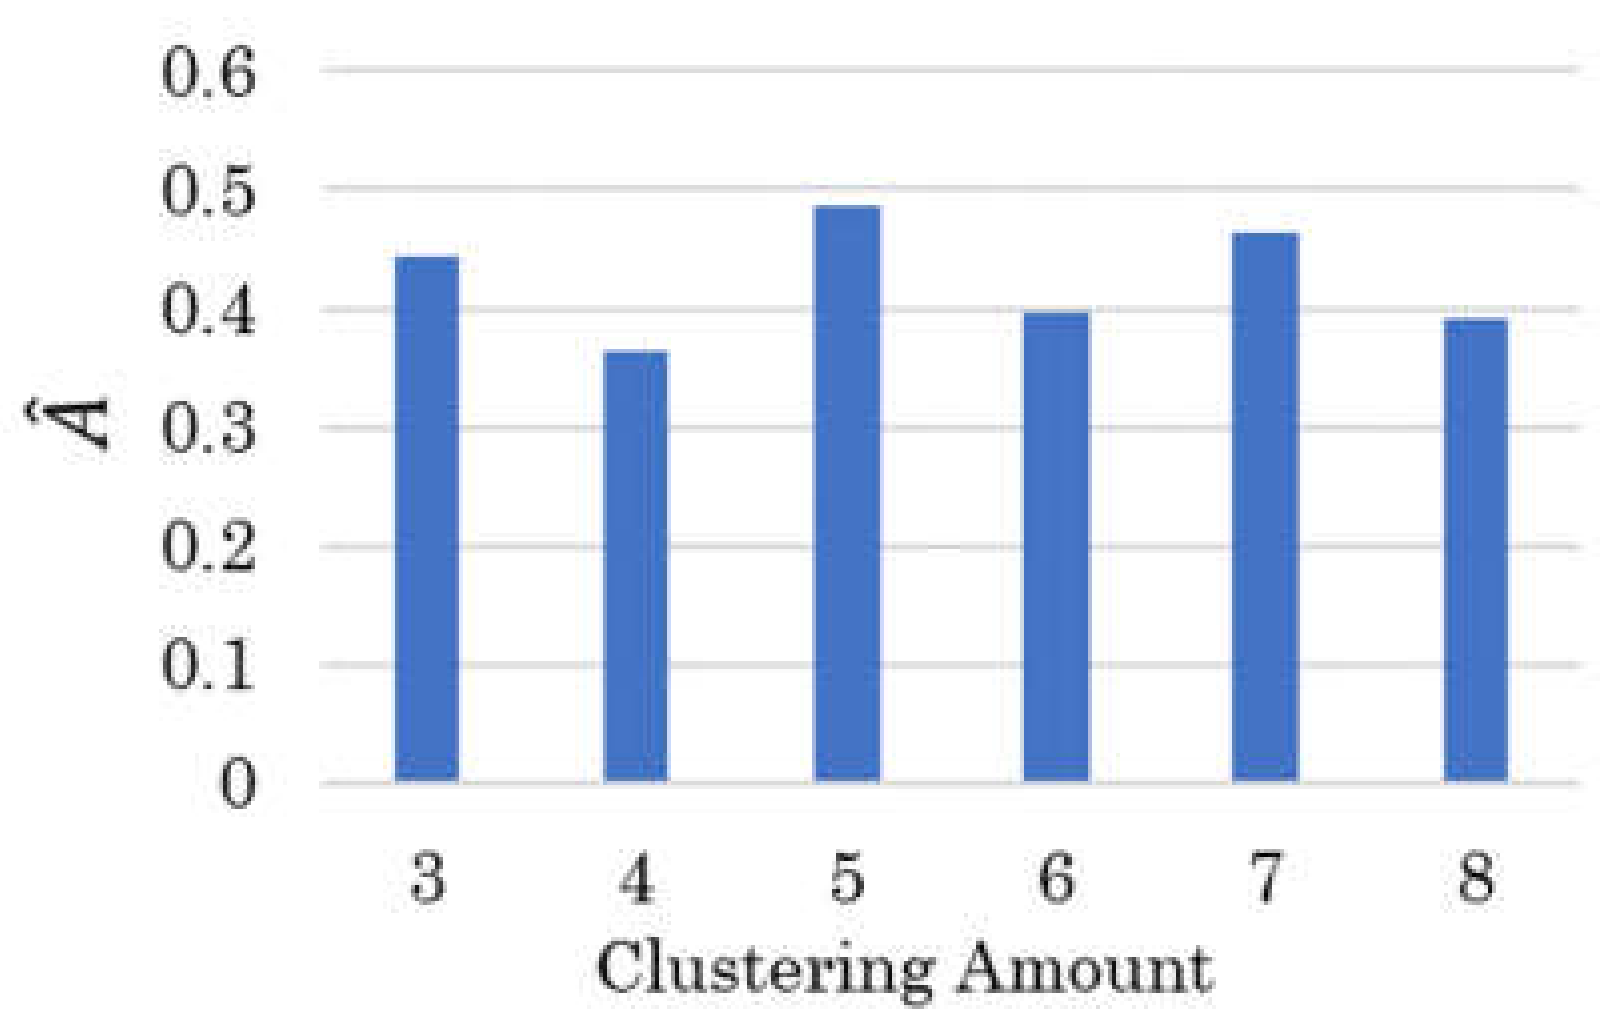
2.2. Dimension Reduction of Face Clustering

The second step is to reduce the clustering dimension further, which can optimize face recognition efficiency. Both the histogram of the original image and the confidence interval theory of Gaussian distribution is considered to combine 5 clustered image regions into 3 or 2 segmentation blocks, i.e., the low, the middle, and the high-intensity regions, or the low and the middle-intensity regions, respectively. First, the histogram of the original image is computed. Second, the combination thresholds are estimated by using the histogram and the confidence interval theory of Gaussian distribution. Third, a merging computation is implemented to the clustered image.
When computing the combination thresholds, the confidence interval theory of Gaussian distribution is used. Without loss of generality, let us take the 2D Gaussian distribution as an example: it is supposed the gray intensity distribution of the statistic face [27] is similar to a Gaussian distribution. Therefore, the probability P 1 when the gray value locates into μ σ , μ + σ is 68.2689%, and the probability P 2 when the gray value lies in μ 2 σ , μ + 2 σ is 95.4500%, where μ and σ are the mean and the standard deviation of Gaussian distribution, respectively. Figure 5 illustrates the corresponding analysis results. From Figure 5, if the pixels locate in the pink region, they probably belong to the normal face region, such as skin or month under the normal lighting condition; differently, if the pixels lie in the yellow region, they always are the high light regions; and if the pixels drop into the blue region, they will be affected by the over dark problem. Clearly, both P 1 and P 2 can contain some segmentation information.
Equation (8) is the computational method of the cumulative histogram. This calculation method is to accumulate the frequency from the smallest gray value to the largest one. Equations (9) and (10) show the estimation methods of combination thresholds. The normalization processing will be carried out to get the combination thresholds when the cumulative frequency reaches 1 P 1 and P 2 . In Equation (11), according to the clustering centers and two combination thresholds, five regions are combined into three blocks, i.e., the low, the middle, and the high-intensity regions. For example, if the clustering center u 1 is less than the combination threshold T 1 then its clustering result will be classified into the low-intensity region. Table 2 shows the gray value of the clustering center, the combination thresholds, and the division results of three blocks. From Table 2, the dimension reduction results can get two or three categories: images 1, 2, 3, 6, and 8 can get three category levels; while images 4, 5, and 7 only has two levels:
p r r k = i = 1 k n i n ,   k = 0 , 1 , 2 , , L 1
T 1 = r s L ,   i f   p r r s = 1 P 1
T 2 = r g L ,   i f   p r r g = P 2
P = { R 1 B l , u 1 T 1 R 1 B m , u 1 > T 1 R 2 B l , u 2 T 1 R 2 B m , u 2 > T 1 R 3 B m , R 4 B m , u 4 < T 2 R 4 B h , u 4 T 2 R 5 B m , u 5 < T 2 R 5 B h , u 5 T 2
where p r r k   means the cumulative probability; r k is different gray values, and its range is located into (0, 255); n i is the number of pixels whose gray is r k , and L is the maximum of gray levels; n is the total number of pixels; T 1 and T 2 are the combination thresholds; r s and r g are the typical gray values of r k ; R i is the segmentation results of the face region whose clustering center is u i ; i = 1 ,   2 , , 5 ; the symbol B l is the low-intensity block, B m is the middle-intensity block, and B h is the high-intensity block.

2.3. Intensity Mapping of over Dark or over Bright Region

The third step is used to balance the intensities of the low and the high blocks. In step 2, the clustering results are mapped into two or three hierarchies, i.e., low- and high-intensity blocks, or low-, middle-, and high-intensity blocks. Since the low and the high-intensity blocks represent the over dark and the overly bright regions, which may affect the following face recognition, two linear transforms are performed. For a low-brightness area, its pixel intensity needs to be multiplied by a factor for amplification. Equations (12) and (13) show their computational method. This coefficient can be determined by a threshold and an average gray value. Similarly, for a high-brightness area, an intensity correction is also needed. Equations (12) and (14) illustrate its calculation method. Figure 6a presents the processing results:
m = 1 N 1 N 1 i = 1 o x , y
n l x , y = T 2 m × o x , y , x , y B l
n h x , y = u 5 u 4 m × o x , y , x , y B h
where o x , y means the gray value of the image in coordinate x , y ; m is the average gray value of o x , y ; N 1 is the total pixel amount; n l x , y and n h x , y are the correction results of the overly dark and the overly bright parts, respectively.

2.4. Contrast Enhancement and Noise Removement
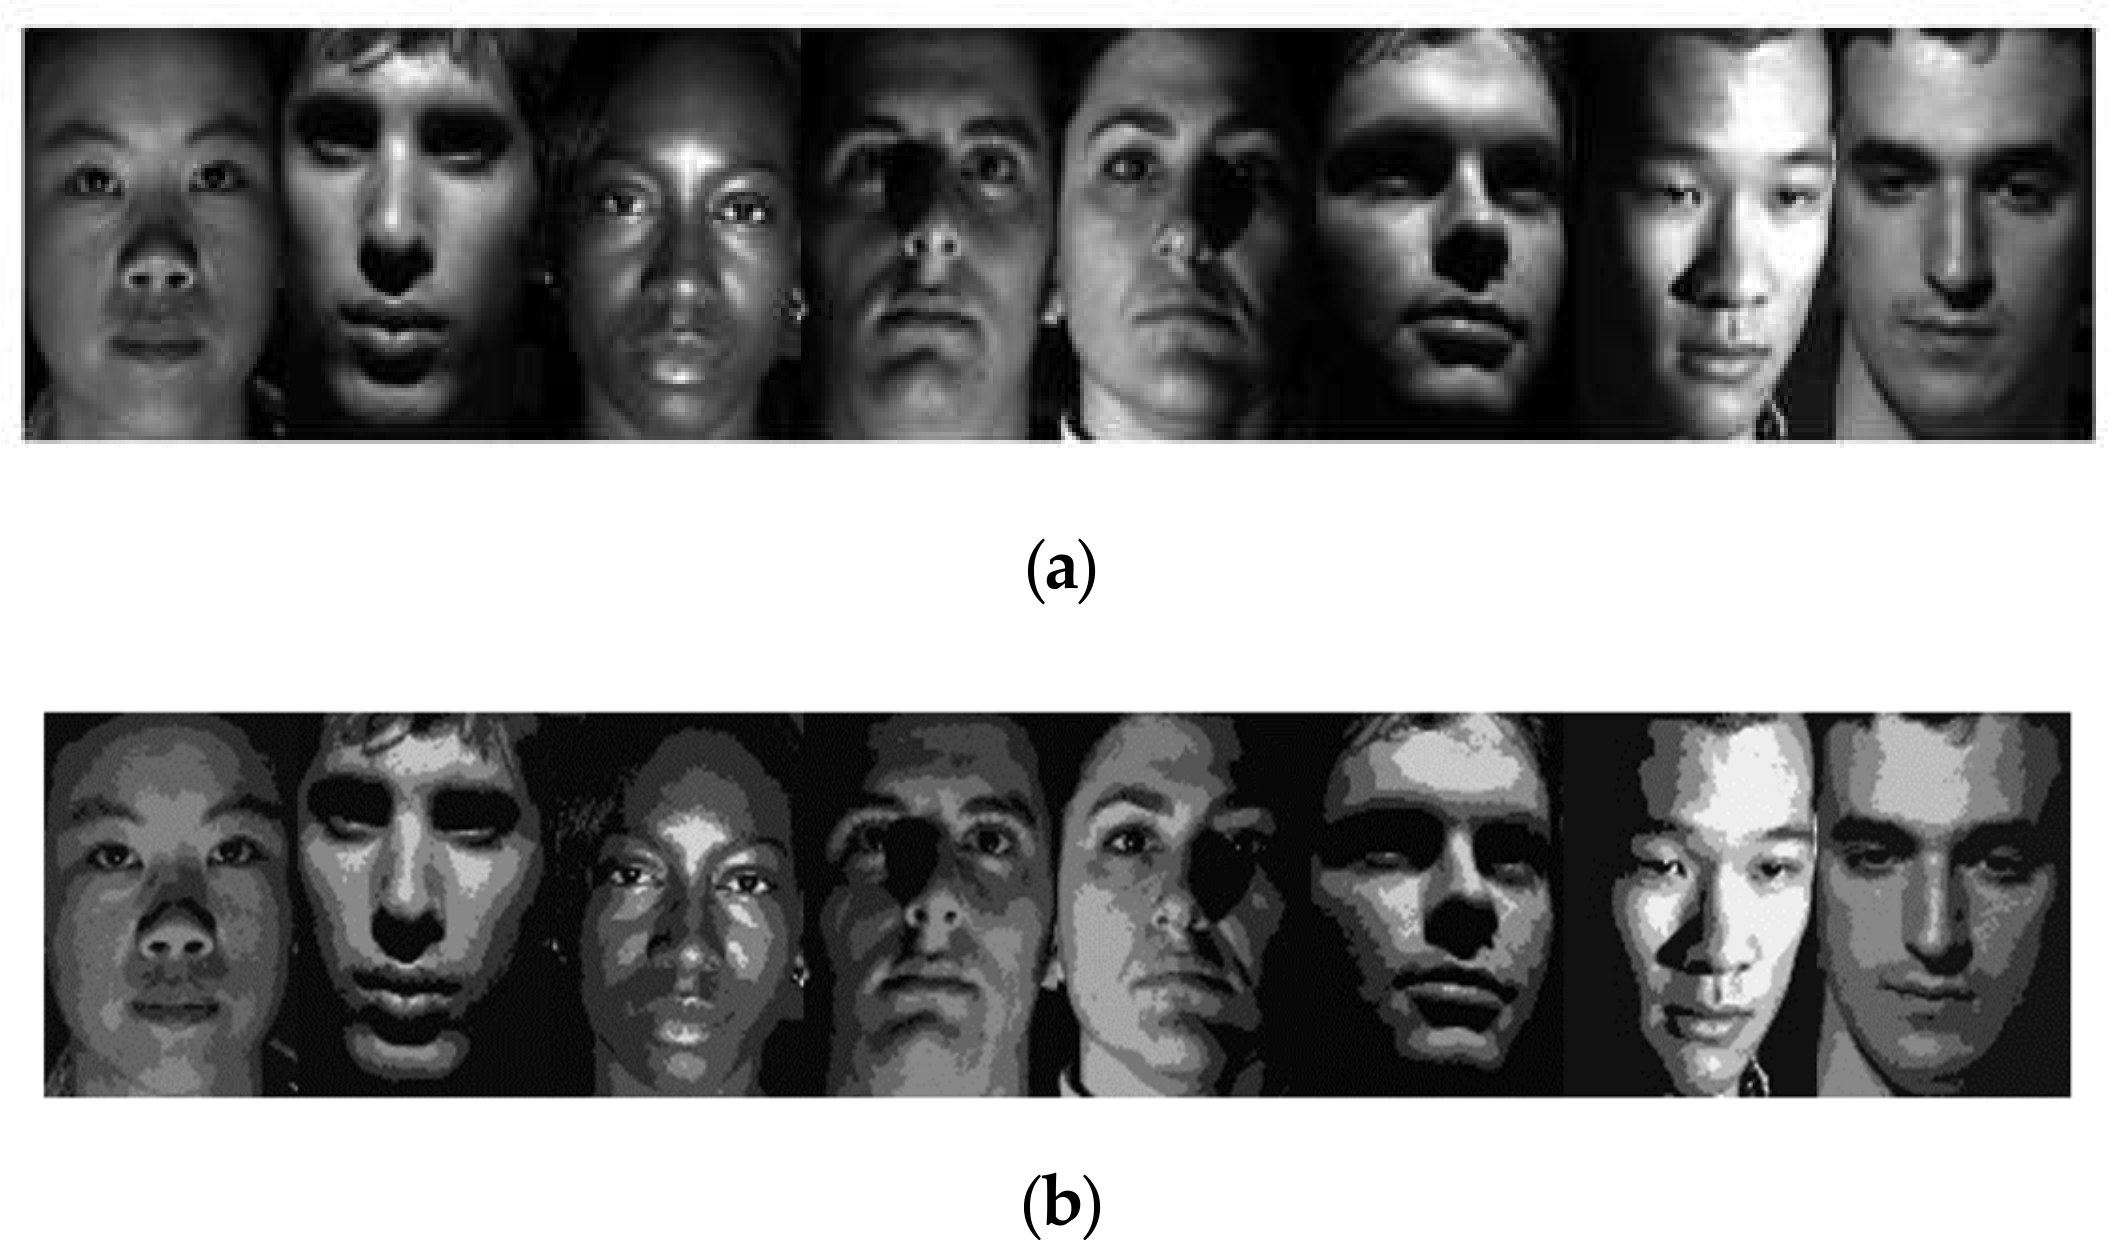
The last step is used to enhance the contrast and remove the noise furtherly. After the clustering computation and the linear transform processing, the ambient light effect still can be observed apparently; and the negative influence of the clustering quantization effect can also create some noise regions. To solve these problems to some extent, the Retinex theory is considered to enhance the image; a center wrap function-based enhancement is implemented. Equation (15) presents its computational procedure. Unlike the classic Retinex algorithm, a guided filter function is employed to replace the Gaussian function, which can maintain a better image edge. Figure 6b illustrates the processing results of this step:
r x , y = K k = 1 w k log I x , y log F k x , y I x , y
where r x , y is the output image; I x , y is the input image; K is the number of center-surround functions; F k x , y is the center-wrap function; w k is the weight ( K = 3), w 1 = w 2 = w 3 ; the symbol represents the convolution.

3. Experiments

An integrated evaluation experiment is performed to test the validity of the proposed algorithm on our PC (Intel® Core™ i7, 8 GB RAM). The Yale face database B [28] is employed in this experiment. The corresponding image size is 640 × 480. A series of image enhancement methods are compared, including the multiscale Retinex (MSR), the multi-deviation fusion (MF) [29], the bio-inspired multi-exposure fusion framework (BIMEF) [30], the regional similarity transfer function (RSTF) [31], the mini-type version of our proposed method, and our method. Here the mini-type version of our proposed method only implements step 2 to step 4 of the total proposed procedure to accomplish the face enhancement task. Clearly, the computational effect of k-means can be tested by this method. Two evaluation indices are considered for algorithm assessment, i.e., the face recognition rate (FRR) and the image quality assessment metrics (IQAM).
Regarding the first evaluation index, both the sparse representation-based method [32] and the principal component analysis (PCA)-based technique [33] are considered for face recognition because of their fast computation speeds, the small requirements of the training dataset, and the convenient hardware implementation for our application. The sparse representation-based method exploits the discriminative nature of sparse representation to perform classification. The PCA-based technique uses the eigenface and PCA methods to accomplish classification. Equations (16) and (17) illustrate their individual calculation methods. Table 3 shows the corresponding FRR on our test datasets. After filtering out all the black images, the training set and the test set are randomly selected on the Yale face database B. The training set type of the sparse representation method includes 9 categories, and each category has 100 images. Its test set type also has 9 categories, and each category has 30 images. The training set type of PAC method has 9 categories with 85 images in each category. Its test set type has 9 categories, and each category has 15 images. In Table 3, it can be seen that the FRR of our method is significantly improved comparing with other methods:
x ^ 1 = a r g m i n x 1                       subject   to     R A x y ˜ 2 ε spare
Ω test Ω train 2 ε P C A
where x ^ 1 is the spare solution; A is a matrix for the entire training set; R A is the matrix of features; x is a coefficient vector; y ˜ is the features of the test set; ε spare   is a given error tolerance, and the symbol ε spare   is set to 0.05 in the experiments of this investigation; Ω t e s t is the facial vector of a test face; Ω t r a i n is the facial vector of a train face; ε P C A is a given distance threshold, and the symbol ε PCA   is set to 0.01 in the experiments of this investigation.
As for the second evaluation index, three IQAM metrics are employed: the blind/referenceless image spatial quality evaluator (BRISQUE) [34], the image region contrast degree (IRCD) [35], and the Brenner-based image sharpness (BIS) [36]. The BRISQUE can evaluate the image edges and details. The bigger the BRISQUE index is, the better the image details would be. The IRCD can assess the region intensity difference between the foreground and the background of an image. Regarding the face recognition application captured in the dark field, the foreground means the eyes, the mouth, or the nose, etc. The bigger the IRCD index is, the better the image contrast would be. The BIS is a kind of image sharpness index. Equations (18)–(20) illustrate their individual calculation methods. The parameters in this evaluation experiment are set according to the corresponding references above. For example, in the BRISQUE method, the parameter of the two-dimensional circularly symmetric Gaussian weighting function is set as K = L = 3 , etc. Among all the evaluation methods in Table 3, our method can achieve the best processing effect:
M B R I S Q U E = I i , j μ i , j σ i , j + C
M I R C D = 1 N 2 N 2 k = 1 I k m a x + I k m i n I k m a x I k m i n
M B I S = i j I i + 2 , j I i , j 2 M S E
where I i , j is the input image, μ i , j is the result after Gaussian filtering of the input image; σ i , j is the standard deviation of the input image; C is a constant, which can be used to avoid the denominator to be zero, C = 1 in this investigation; I k m a x and I k m i n are the maximum and the minimum gray values of the kth image block; N 2 is the number of sample block, N 2 = 100 ; M S E is the mean square error of the input image.
Generally, the better the IQAM is, the higher the FRR. Thus the relationship between the head pose and the IQAM is investigated in this study. Figure 7 and Figure 8 show two experiment results. Regarding the first experiment, the subjects shake their heads from left to right. As for the second experiment, the subjects nod their head up and down. The movement angles of the two experiments are all from −45° to 45°. Then a series of head pose images can be accumulated. Finally, we use the dataset above to test the IQAMs of different image enchantment methods. From Figure 7 and Figure 8, our method can achieve the best processing effect. These results may be explained: on one hand, our proposed method can restrain or balance the over dark and the overly bright regions; on the other hand, both the dichromatic reflection model and the confidence interval theory of Gaussian distribution are utilized to realize a kind of reasonable hierarchic clustering.
The merits of the proposed method include: first, its environment adaptability is high. This method can be used for face enhancement application of the dark field environment. In many cases, the dynamic scope of the images captured in the dark field is larger than those collected in the normal environment light. This problem will improve the processing difficulty of face recognition. After experimental evaluation, our method can solve that problem well. Second, its computational effect is good. For example, both the FRR and the IQAM can be improved a lot by using this method. Third, its automatic processing ability and robustness are also excellent. The proposed method’s input is an original image, and its output is an image, which performs the enhancement processing. No experience parameters are needed to be set in the proposed method. As a result, it can read images in batches and automatically calculate the corresponding parameters without any manual inputs. Experimental results also indicate that this method can be used for face image enhancement captured under different deflection angles. Clearly, our method also has some shortcomings. For example, its processing speed is slower than some traditional methods, and some new techniques can be considered for its application expansion. This problem can be solved by using some hardware speedup methods and deep learning-based methods [37,38] in the future.

4. Conclusions

This investigation proposes a hierarchic clustering-based face enhancement method for images captured in the dark field. First, the hierarchic clustering method is applied to image segmentation. Second, the processing results above are mapped into three levels, i.e., the low-intensity block, the medium-intensity block, and the high-intensity block. Third, the over-bright and over-dark parts are balanced by two linear transform computations. Finally, noise removal and image enhancement are performed. Experimental results show that our method can improve both the FRR and the IQAM for the images captured in the dark field. In the future, the information characteristics of color images can be combined to improve the proposed method.

Author Contributions

Conceptualization, N.Z., H.L. and Z.Z.; methodology, N.Z. and H.L.; software, N.Z.; validation, H.L. and Z.Z.; formal analysis, N.Z.; investigation, N.Z.; resources, H.L. and Z.Z.; data curation, H.L.; writing—original draft preparation, N.Z.; writing—review and editing, H.L. and Z.Z.; supervision, Z.Z.; project administration, H.L. All authors have read and agreed to the published version of the manuscript.

Funding

This research was funded by the National Natural Science Foundation of China under Grant 61975011, the Fund of State Key Laboratory of Intense Pulsed Radiation Simulation and Effect under Grant SKLIPR2024, and the Fundamental Research Fund for the China Central Universities of USTB under Grant FRF-BD-19-002A.

Data Availability Statement

The data presented in this study are available on request from the corresponding author.

Conflicts of Interest

The authors declare no conflict of interest.

References

  1. Zhao, W.; Chellappa, R.; Phillips, P.J.; Rosenfeld, A. Face recognition: A literature survey. ACM Comput. Surv. 2003, 35, 399–458. [Google Scholar] [CrossRef]
  2. Wang, W.; Wu, X.; Yuan, X.; Gao, Z. An experiment-based review of low-light image enhancement methods. IEEE Access 2020, 8, 87884–87917. [Google Scholar] [CrossRef]
  3. Wang, M.; Chen, C.; Pan, J.; Zhu, Y.; Chang, X. A relative radiometric calibration method based on the histogram of side-slither data for high-resolution optical satellite imagery. Remote Sens. 2018, 10, 381. [Google Scholar] [CrossRef] [Green Version]
  4. Das, S.; Gulati, T.; Mittal, V. Histogram equalization techniques for contrast enhancement: A review. Int. J. Comput. Appl. 2015, 114, 32–36. [Google Scholar] [CrossRef]
  5. Mathias, A.; Tsamene, D. Enhancing gray scale images for face detection under unstable lighting condition. Int. J. Adv. Comput. Sci. Appl. 2017, 8, 12–20. [Google Scholar]
  6. Liu, B.; Wang, X.; Jin, W.; Chen, Y.; Liu, C.; Liu, X. Infrared image detail enhancement based on local adaptive gamma correction. Chin. Opt. Lett. 2012, 10, 25–29. [Google Scholar]
  7. Fan, C.; Zhang, F. Homomorphic filtering based illumination normalization method for face recognition. Pattern Recogn. Lett. 2011, 32, 1468–1479. [Google Scholar] [CrossRef]
  8. Shim, H.; Luo, J.; Chen, T. A subspace model-based approach to face relighting under unknown lighting and poses. IEEE Trans. Image Process. 2008, 17, 1331–1341. [Google Scholar] [CrossRef]
  9. Lagorce, X.; Orchard, G.; Galluppi, F.; Shi, B.E.; Benosman, R.B. HOTS: A hierarchy of event-based time-surfaces for pattern recognition. IEEE Trans. Pattern Anal. Mach. Intell. 2017, 39, 1346–1359. [Google Scholar] [CrossRef]
  10. Karczmarek, P.; Pedrycz, W.; Kiersztyn, A.; Rutka, P. A study in facial features saliency in face recognition: An analytic hierarchy process approach. Soft Comput. 2017, 21, 7503–7517. [Google Scholar] [CrossRef] [Green Version]
  11. Fnaiech, A.; Sahli, H.; Sayadi, M.; Gorce, P. Fear facial emotion recognition based on angular deviation. Electronics 2021, 10, 358. [Google Scholar] [CrossRef]
  12. Lecca, M. STAR: A segmentation-based approximation of point-based sampling milano Retinex for color image enhancement. IEEE Trans. Image Process. 2018, 27, 5802–5812. [Google Scholar] [CrossRef]
  13. Ren, X.; Yang, W.; Cheng, W.; Liu, J. LR3M: Robust low-light enhancement via low-rank regularized Retinex model. IEEE Trans. Image Process. 2020, 29, 5862–5876. [Google Scholar] [CrossRef]
  14. Park, S.; Yu, S.; Kim, M.; Park, K.; Paik, J. Dual autoencoder network for Retinex-based low-light image enhancement. IEEE Access 2018, 6, 22084–22093. [Google Scholar] [CrossRef]
  15. Devi, G.S.; Rabbani, M.M.A. Image contrast enhancement using histogram equalization with fuzzy approach on the neighbourhood metrics (FANMHE). In Proceedings of the International Conference on Wireless Communications, Signal Processing and Networking, Chennai, India, 23–25 March 2016. [Google Scholar]
  16. Lin, P.T.; Lin, B.R. Fuzzy automatic contrast enhancement based on fuzzy C-means clustering in CIELAB color space. In Proceedings of the IEEE/ASME International Conference on Mechatronic and Embedded Systems and Applications, Auckland, New Zealand, 29–31 August 2016. [Google Scholar]
  17. Zhong, X.; Wen, X.; Zhu, D. Lookup-table-based inverse model for human skin reflectance spectroscopy: Two-layered Monte Carlo simulations and experiments. Opt. Express 2014, 22, 1852–1864. [Google Scholar] [CrossRef]
  18. Sánchez-Reyes, L.-M.; Rodríguez-Reséndiz, J.; Salazar-Colores, S.; Avecilla-Ramírez, G.N.; Pérez-Soto, G.I. A High-accuracy mathematical morphology and multilayer perceptron-based approach for melanoma detection. Appl. Sci. 2020, 10, 1098. [Google Scholar] [CrossRef] [Green Version]
  19. Bijl, A.F. A Comparison of Clustering Algorithms for Face Clustering. Ph.D. Thesis, University of Groningen, Groningen, The Netherlands, 2018. [Google Scholar]
  20. Challa, A.; Danda, S.; Sagar, B.S.D.; Najman, L. Power spectral clustering. J. Math. Imaging Vis. 2020, 62, 1195–1213. [Google Scholar] [CrossRef]
  21. Saxena, A.; Prasad, M.; Gupta, A.; Bharill, N.; Patel, O.P.; Tiwari, A.; Er, M.J.; Ding, W.; Lin, C. A review of clustering techniques and developments. Neurocomputing 2017, 267, 664–681. [Google Scholar] [CrossRef] [Green Version]
  22. Ahmad, A.U.; Starkey, A. Application of feature selection methods for automated clustering analysis: A review on synthetic datasets. Neural Comput. Appl. 2018, 29, 317–328. [Google Scholar] [CrossRef] [Green Version]
  23. Giampietro, C.; Roberto, G. Towards a generalized beer-lambert law. Fractal Fract. 2018, 2, 8. [Google Scholar]
  24. Masuda, Y.; Yamashita, T.; Hirao, T.; Takahashi, M. An innovative method to measure skin pigmentation. Skin Res. Tech. 2009, 15, 224–229. [Google Scholar] [CrossRef]
  25. Tsumura, N.; Ojima, N.; Sato, K.; Shiraishi, M.; Shimizu, H.; Nabeshima, H.; Akazaki, S.; Hori, K.; Miyake, Y. Image-based skin color and texture analysis/synthesis by extracting hemoglobin and melanin information in the skin. ACM Trans. Graph. 2003, 22, 770–779. [Google Scholar] [CrossRef]
  26. Blondel, W.; Delconte, A.; Khairallah, G.; Marchal, F.; Gavoille, A.; Amouroux, M. Spatially-resolved multiply-excited autofluorescence and diffuse reflectance spectroscopy: SpectroLive medical device for skin in vivo optical biopsy. Electronics 2021, 10, 243. [Google Scholar] [CrossRef]
  27. Li, P.; Wang, H.; Li, Y.; Liu, M. Analysis of face detection based on skin color characteristic and AdaBoost algorithm. J. Phys. Conf. Ser. 2020, 1601, 052019. [Google Scholar] [CrossRef]
  28. Georghiades, A.S.; Belhumeur, P.N.; Kriegman, D.J. From Few to Many: Illumination cone models for face recognition under variable lighting and pose. IEEE Trans. Pattern Anal. Mach. Intell. 2001, 23, 643–660. [Google Scholar] [CrossRef] [Green Version]
  29. Fu, X.; Zeng, D.; Huang, Y.; Liao, Y.; Ding, X.; Paisley, J. A fusion-based enhancing method for weakly illuminated images. IEEE Trans. Signal Process. 2016, 129, 82–96. [Google Scholar] [CrossRef]
  30. Wang, W.; Wei, C.; Yang, W.; Liu, J. GLADNet: Low-light enhancement network with global awareness. In Proceedings of the IEEE International Conference on Automatic Face and Gesture Recognition, Xi’an, China, 15–19 May 2018. [Google Scholar]
  31. Seyedali, M. Dragonfly algorithm: A new meta-heuristic optimization technique for solving single-objective, discrete, and multi-objective problems. Neural Comput. Appl. 2016, 27, 1053–1073. [Google Scholar]
  32. Wright, J.; Yang, A.Y.; Ganesh, A.; Sastry, S.S.; Ma, Y. Robust face recognition via sparse representation. IEEE Trans. Pattern Anal. Mach. Intell. 2009, 31, 210–227. [Google Scholar] [CrossRef] [Green Version]
  33. Chandra, R.; An-Nissa, S.; Zamzami, E.M. Comparative analysis of eigenface and learning vector quantization (lvq) to face recognition. J. Phys. Conf. Ser. 2020, 1566, 012012. [Google Scholar] [CrossRef]
  34. Mittal, A.; Moorthy, A.K.; Bovik, A.C. No-reference image quality assessment in the spatial domain. IEEE Trans Image Process. 2012, 21, 4695–4708. [Google Scholar] [CrossRef]
  35. Liu, H.; Lu, H.; Zhang, Y. Image enhancement for outdoor long-range surveillance using IQ-learning multiscale Retinex. IET Image Process. 2017, 11, 786–795. [Google Scholar] [CrossRef]
  36. De, K.; Masilamani, V. No-reference image sharpness measure using discrete cosine transform statistics and multivariate adaptive regression splines for robotic applications. Procedia Comput. Sci. 2018, 133, 268–275. [Google Scholar] [CrossRef]
  37. Liang, J.; Wang, J.; Quan, Y.; Chen, T.; Liu, J.; Ling, H.; Xu, Y. Recurrent exposure generation for low-light face detection. arXiv 2020, arXiv:2007.10963. [Google Scholar]
  38. Guo, Y.; Ke, X.; Ma, J.; Zhang, J. A pipeline neural network for low-light image enhancement. IEEE Access 2019, 7, 13737–13744. [Google Scholar] [CrossRef]
Figure 1. Processing flowchart of the proposed algorithm.
Electronics 10 00936 g001
Figure 2. Relationship between clustering amount and STD.
Electronics 10 00936 g002
Figure 3. Relationship between clustering amount and A ^ .
Electronics 10 00936 g003
Figure 4. The results of clustering face images under different lighting conditions. (a) Original images; (b) results after clustering.
Electronics 10 00936 g004
Figure 5. The Gaussian distribution and its region partitions for face clustering.
Electronics 10 00936 g005
Figure 6. Results of the linear transforms and the center wrap function-based enhancement. (a) Results of linear transforms; (b) results of center wrap function-based enhancement.
Electronics 10 00936 g006
Figure 7. Image quality assessment metrics (IQAM) comparison results of the horizontal deflection angle of head pose using different face enhancement methods. (a) results after the BRISQUE method; (b) results after the IRCD method; (c) results after the BIS method.
Electronics 10 00936 g007
Figure 8. IQAM comparison results of the vertical deflection angle of head pose using different face enhancement methods. (a) results after the BRISQUE method; (b) results after the IRCD method; (c) results after the BIS method.
Electronics 10 00936 g008
Table 1. Clustering time the same data by four clustering algorithms.
Clustering Algorithms
K-MeansBIRCHAgglomerative ClusteringDBSCAN
Times (s)0.81122.2448490.0283266.2787
Table 2. Clustering results of image samples and their corresponding combination thresholds.
Image ID
Image 1Image 2Image 3Image 4Image 5Image 6Image 7Image 8
Gray value of clustering
center
u 1 10.05920.04720.04230.03690.03560.03290.06800.0771
u 2 0.19220.19590.17720.14270.17960.20000.30870.2335
u 3 0.30390.36480.30710.24700.34120.40050.53400.3812
u 4 0.40330.53430.49860.38640.47530.61220.74490.5282
u 5 0.52340.75540.80970.51760.65060.82440.94270.7397
Threshold T 1 0.21170.06660.10980.11760.07840.03520.09410.1882
T 2 0.50190.65880.56470.52150.66270.74510.99210.7176
Intensity
region
Low u 1 u 2 u 1 u 1 u 1 u 1 u 1 u 1 u 1
Middle u 3 u 4 u 2 u 3 u 4 u 2 u 3 u 4 u 2 u 3 u 4 u 5 u 2 u 3 u 4 u 5 u 2 u 3 u 4 u 2 u 3 u 4 u 5 u 2 u 3 u 4
High u 5 u 5 u 5 -- u 5 - u 5
1 Subscripts indicate different gray levels (see Equation (11)).
Table 3. The face recognition rate and image quality evaluation metrics of different enhancement algorithms.
Evaluation Algorithms
Original ImageMSRMFBIMEFRSTFMini-Type Version of Our MethodOur Method
FRRSparse Representation-based method83.333386.666794.814884.814881.481593.954196.2963
PCA-based method60.000077.037080.740768.888967.407489.431893.3333
IQAMBRISQUE0.91790.81730.89230.87880.85540.91270.9509
IRCD0.10470.10870.10460.10500.10880.10930.1101
BIS0.05580.04570.10320.06680.08320.11150.1271
Publisher’s Note: MDPI stays neutral with regard to jurisdictional claims in published maps and institutional affiliations.

