Article

A Simulated Annealing Algorithm and Grid Map-Based UAV Coverage Path Planning Method for 3D Reconstruction

1
School of Intelligent Systems Engineering, Sun Yat-sen University, Guangzhou 510006, China
2
Southern Marine Science and Engineering Guangdong Laboratory (Zhuhai), Zhuhai 519082, China
*
Author to whom correspondence should be addressed.
Electronics 2021, 10(7), 853; https://doi.org/10.3390/electronics10070853
Submission received: 3 March 2021 / Revised: 21 March 2021 / Accepted: 23 March 2021 / Published: 2 April 2021
(This article belongs to the Special Issue Advances in SLAM and Data Fusion for UAVs/Drones)

Abstract

:
With the extensive application of 3D maps, acquiring high-quality images with unmanned aerial vehicles (UAVs) for precise 3D reconstruction has become a prominent topic of study. In this research, we proposed a coverage path planning method for UAVs to achieve full coverage of a target area and to collect high-resolution images while considering the overlap ratio of the collected images and energy consumption of clustered UAVs. The overlap ratio of the collected image set is guaranteed through a map decomposition method, which can ensure that the reconstruction results will not get affected by model breaking. In consideration of the small battery capacity of common commercial quadrotor UAVs, ray-scan-based area division was adopted to segment the target area, and near-optimized paths in subareas were calculated by a simulated annealing algorithm to find near-optimized paths, which can achieve balanced task assignment for UAV formations and minimum energy consumption for each UAV. The proposed system was validated through a site experiment and achieved a reduction in path length of approximately 12.6% compared to the traditional zigzag path.

1. Introduction

With the development of electronic technology and modern control technology, unmanned aerial vehicles (UAVs) are being increasingly applied in civilian affairs in addition to their previous use in the military field [1]. Unlike large UAVs that can individually execute a surveillance or strike mission, small-scale UAVs operate as a system and are often used in formations, which can decrease time consumption and improve robustness [2]. Such vehicles are used in many fields, including environmental and natural disaster monitoring, border surveillance, emergency assistance, search and rescue missions, delivery of goods, and construction [3]. One important application of UAVs is for 3D reconstruction: UAVs collect images from a specified target area, and then the 3D model of the area will be reconstructed from those images on a computer.
Compared to traditional 2D maps, 3D maps provide more detailed spatial information of the target and have been widely used in many applications, including automatic driving, map navigation, disaster rescue, historical heritage preservation, etc. [4,5,6]. The 3D shape of an object or scene is reconstructed through a set of corresponding images. Therefore, the result of the reconstructed 3D model is highly dependent on the quality of the image resources. For optimal reconstruction, the dataset should meet various requirements related to geometry discrimination, texture variance, sample sufficiency, content overlap, and image resolution [7].
The whole process of 3D reconstruction can be divided into two steps: (1) UAVs fly over the target area and take a series of photos with a sufficient overlap ratio, which is often considered a coverage path planning (CPP) problem. (2) The photos are then input into software on a computer to generate a 3D map of the target area. Since existing software programs such as Pix4D, Context Capture and Photo Scan have achieved ideal reconstruction results in the second step, this research focuses on the first step of finding optimized paths that can guarantee the required overlap ratio of the collected images. Although some commercial flight planners, such as Pix4D, Altizure, and DJI-TERRA, have realized common and simple path planning work, the lack of flexibility still limits the quality of the construction results. A small number of parameters are input into these planners, and a zigzag or circle path is generated to fill the target area. These methods make it difficult to collect images with sufficient overlap and guarantee the safety and energy efficiency of UAVs.
A variety of robotic CPP approaches have been proposed in recent years. In the past decade, the most successful CPP methods were reviewed by Galceran and Carreras in 2013 [5], such as cellular, grid-based, graph-based, 3D coverage, and multirobot coverage-based methods.
For the purpose of 3D reconstruction, the zigzag path is the most common solution to UAV CPP problems due to its easy availability and high applicability. It was first proposed by Huang in 2001 [8] and has been modified by many subsequent researchers. Torres et al. [9] proposed a concave area decomposition method to solve the problem of the zigzag path in concave target areas. They decomposed the target area into several convex subareas when the paths were interrupted by the edges of nonconvex areas.
Multiple separated region CPP problems were researched in the literature [10,11,12,13]. The combination of the traveling salesman problem (TSP) and CPP problem was solved by heuristic approaches, which considered the paths both in each region and between different regions [10,11]. Guastella et al. [12] considered the situation where there were no-fly zones between several subregions of a target area. A coverage algorithm that partitioned the target area into several parts and allocated them to different UAVs with different altitudes was proposed by Barrientos et al. [13], which avoided mutual collision.
Researchers have also employed 3D paths to handle vertical buildings and terrain changes. Zheng [14,15] presented a UAV path planning methodology that can be used to guide the process of data collection for efficient 3D reconstruction of building models. Both vertical and horizontal paths were employed to guarantee the surface coverage rate of the building model. Mansouri et al. [16] proposed a scheme that designed a sequence of circle paths to cover the surface of complex 3D infrastructure. Focusing on the CPP problem of natural environments with elevation changes, Wang et al. [17] proposed a coverage path that consists of a set of smooth 3D curves varying with 3D terrain.
Apart from the above-mentioned types of methods, some other CPP methods were also proposed to adjust to different application requirements [18,19,20,21]. The task difficulty map was utilized by Lin et al. [18] to assist path planning, achieving an efficient partial detection during UAV search missions. Huang et al. [19] used approximate cell decomposition and an improved Spanning Tree Covering algorithm to cover a target area with multiple land cover types. To reconstruct the 3D model of a tree, Liénard et al. [20] proposed a key-point matching-based method to collect images. In consideration of image overlap ratios, Yang et al. [21] proposed a grid map decomposition method to guarantee image overlapping, which motivated this work.
Although much work on the UAV CPP problem has been performed in the past decade, many realistic problems have not been clearly considered. The minimum energy consumption of a single UAV and balanced consumption of formation UAVs are important factors, especially in outdoor environments. Other factors, such as the image overlap ratio, take-off location selection, and mutual collision avoidance, are also important.
In this paper, a UAV path planning framework is proposed to solve the UAV CPP problem considering both image overlapping and energy efficiency. In addition, a self-developed UAV control system is utilized in our site experiments to guarantee the precision of the experimental execution. The result shows the superiority of the proposed method. This research may be helpful to those who need to collect image data and reconstruct outdoor digital terrain models.
The contributions of this paper are summarized as follows:
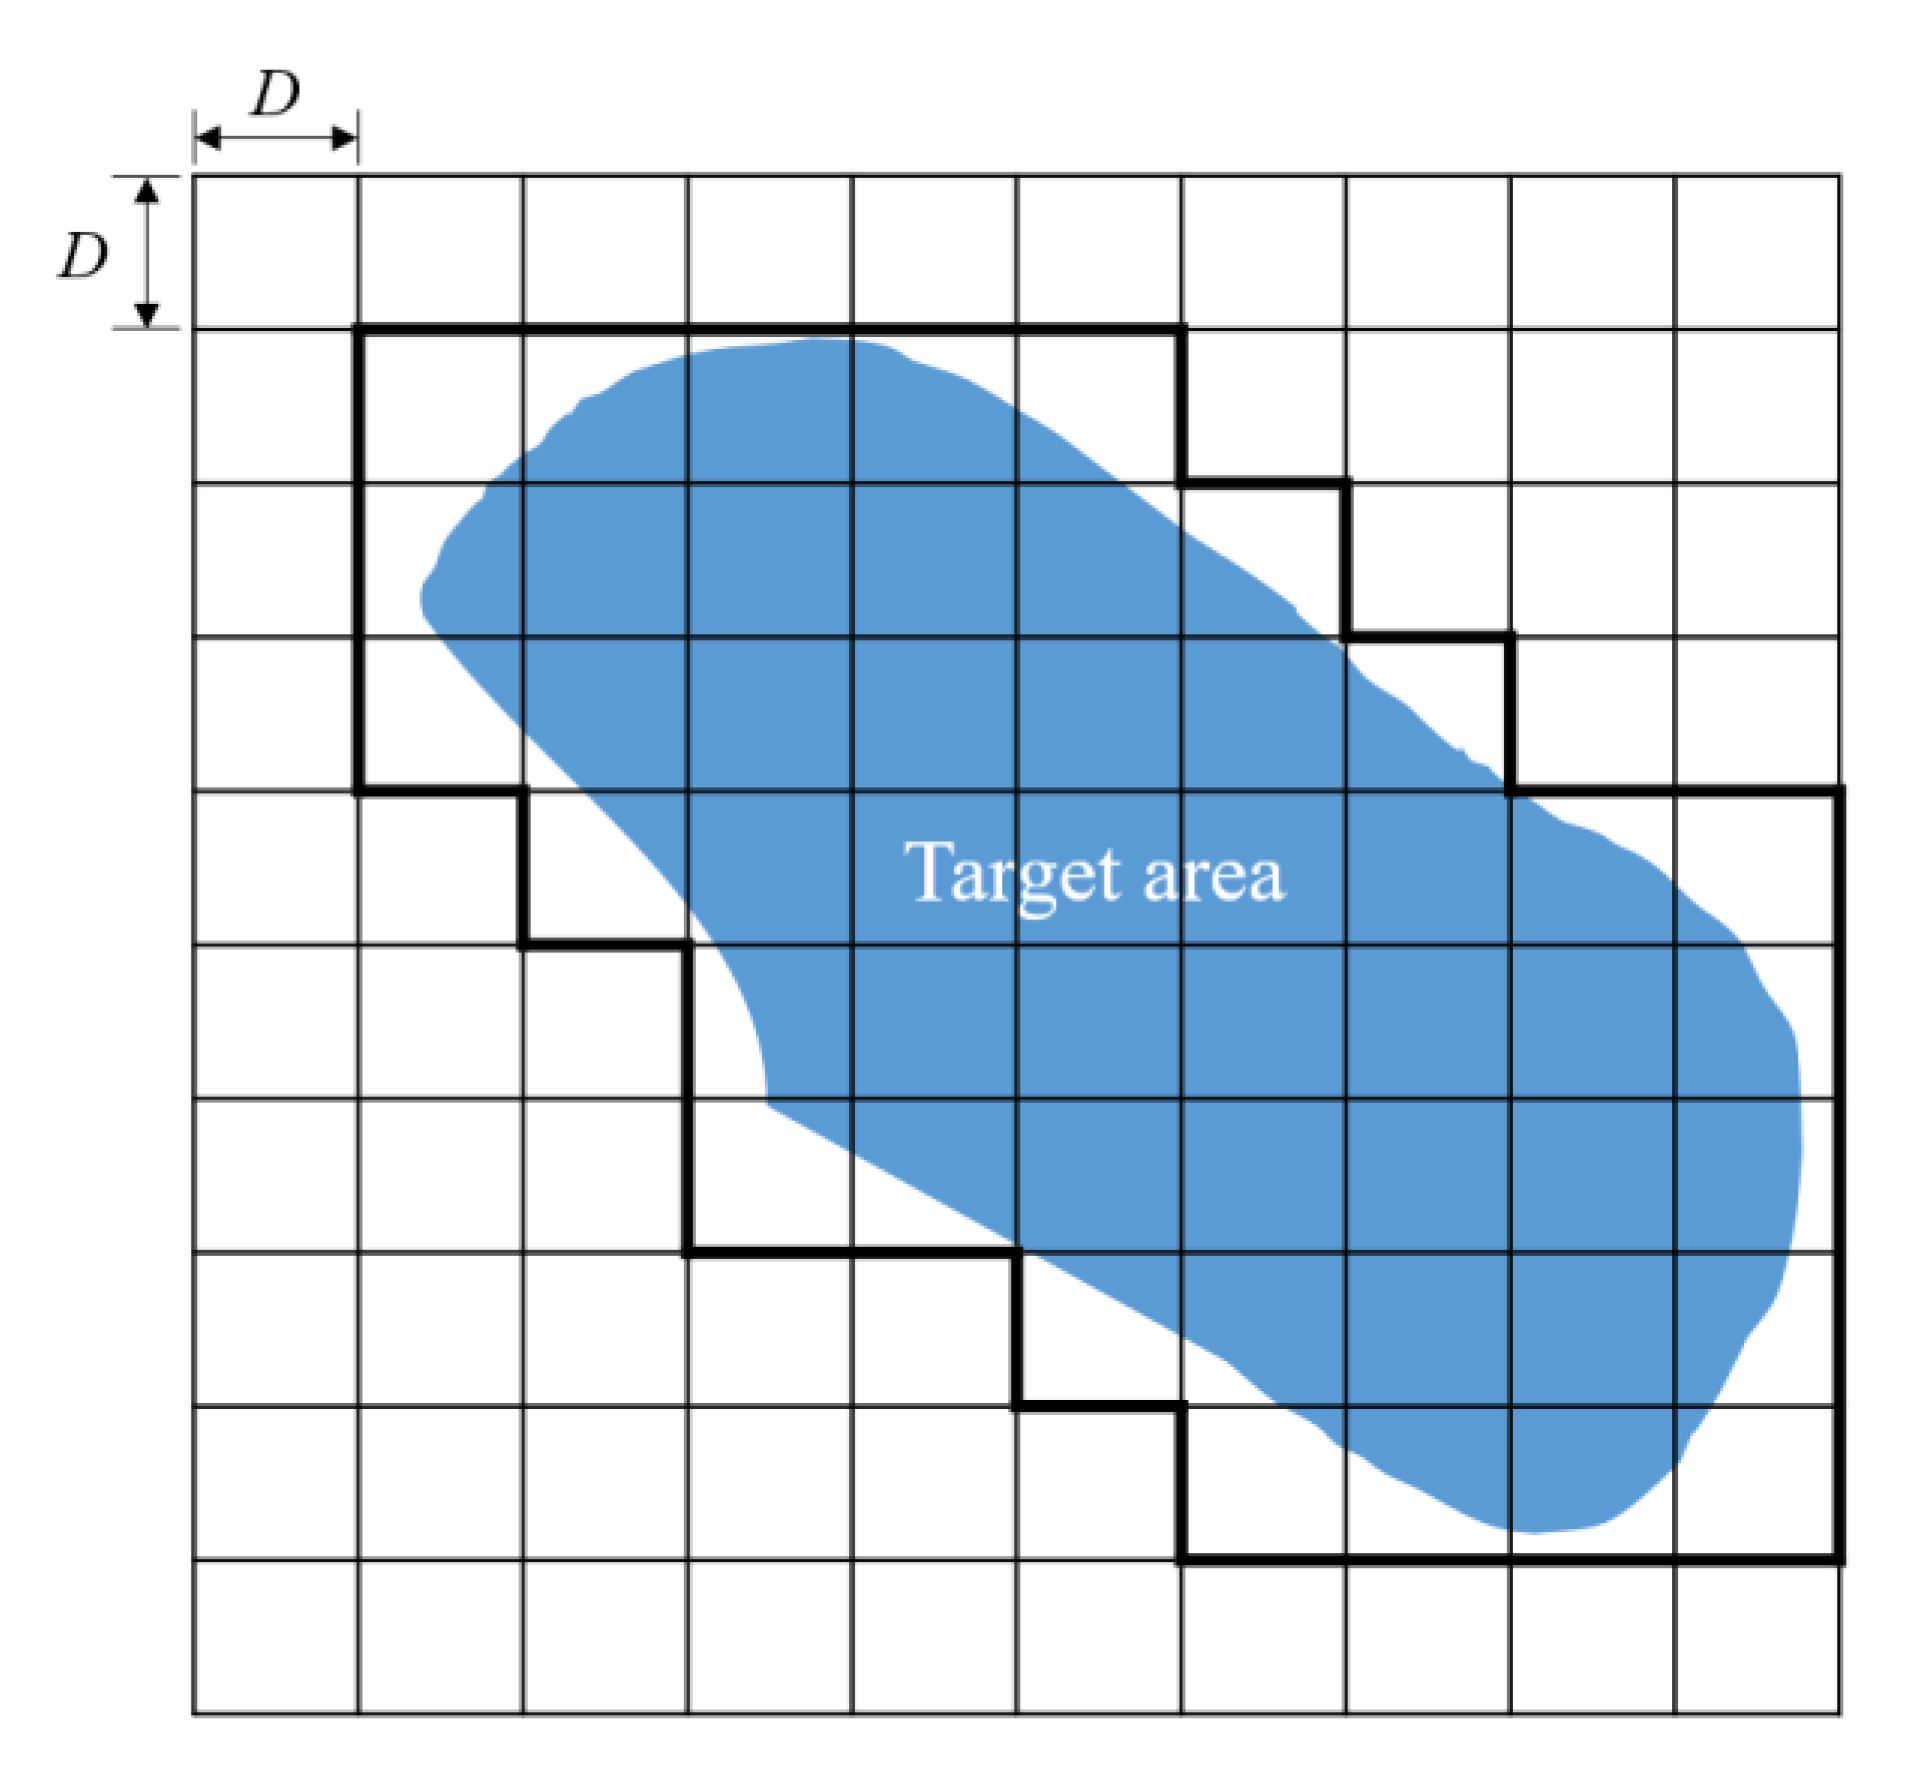
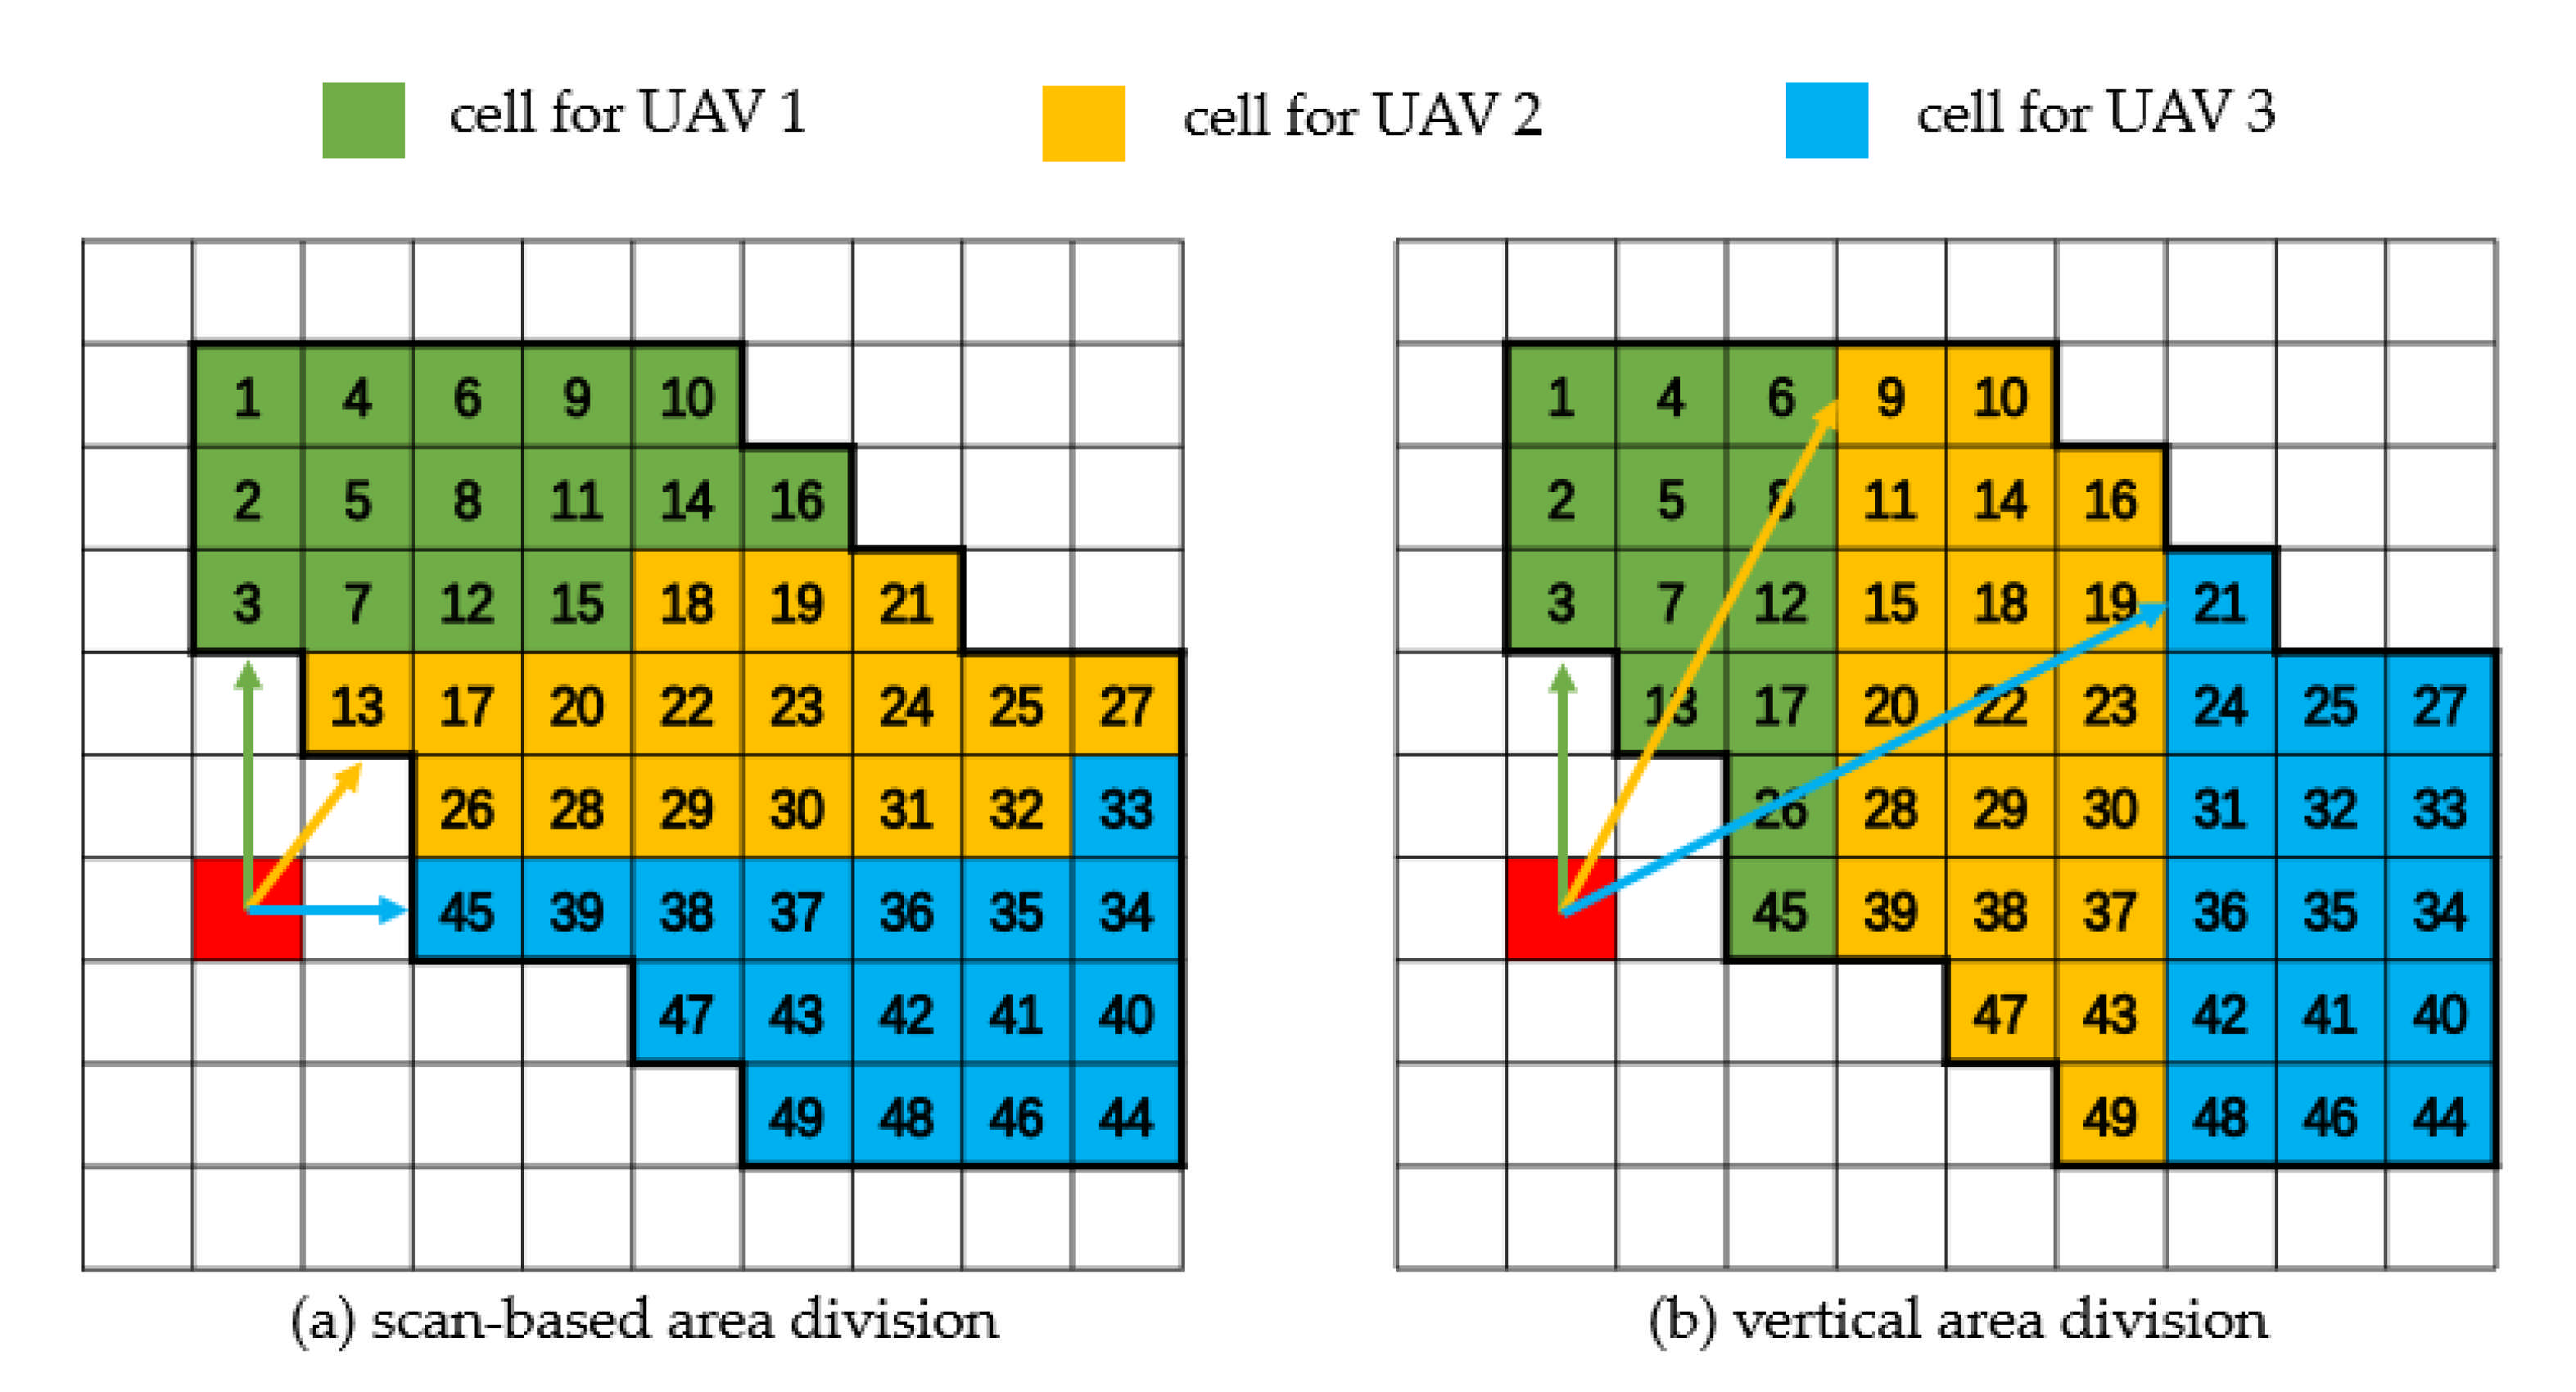
  • A map decomposition and area division method: the irregular target area is decomposed into many square cells with specified side lengths, which can guarantee image overlap. A ray-scan-based method is also introduced to perform approximate task allocation to ensure balanced energy consumption of the UAV formation.
  • Near-optimized path calculation: the simulated annealing algorithm (SAA) is utilized to calculate near-optimized paths in every subarea, resulting in lower energy consumption of UAVs. In addition, collision-free paths are automatically generated through task allocation and path calculation.
  • Site experiment validation: the efficiency of the proposed method is validated through a site experiment, and a self-developed system is used to guarantee the precision of the experiments.
The rest of this paper is organized as follows. The three steps of the proposed method are introduced in Section 2. After that, a site experiment was conducted to validate the proposed method, and it is presented in Section 3, along with our experimental platforms. Finally, this research is concluded in Section 4.

2. Methodology

The three steps of the methodology will be introduced in this section. First, the map decomposition method is proposed in Section 2.1. After the target is separated into discrete cells, a ray-scan-based method to segment the target area and allocate subareas to different UAVs is introduced in Section 2.2. Then, the near-optimized paths in each subarea will be calculated by the SAA, and this algorithm will be introduced in Section 2.3. In the end, the flowchart of the whole system is shown in Section 2.4.
Several assumptions are made before introducing our system:
  • There are no large or tall obstacles in the target area that may cause safety problems for the UAVs. Some brief terrain information of the target area should be known before the flights to prevent collisions between the vehicle and environment.
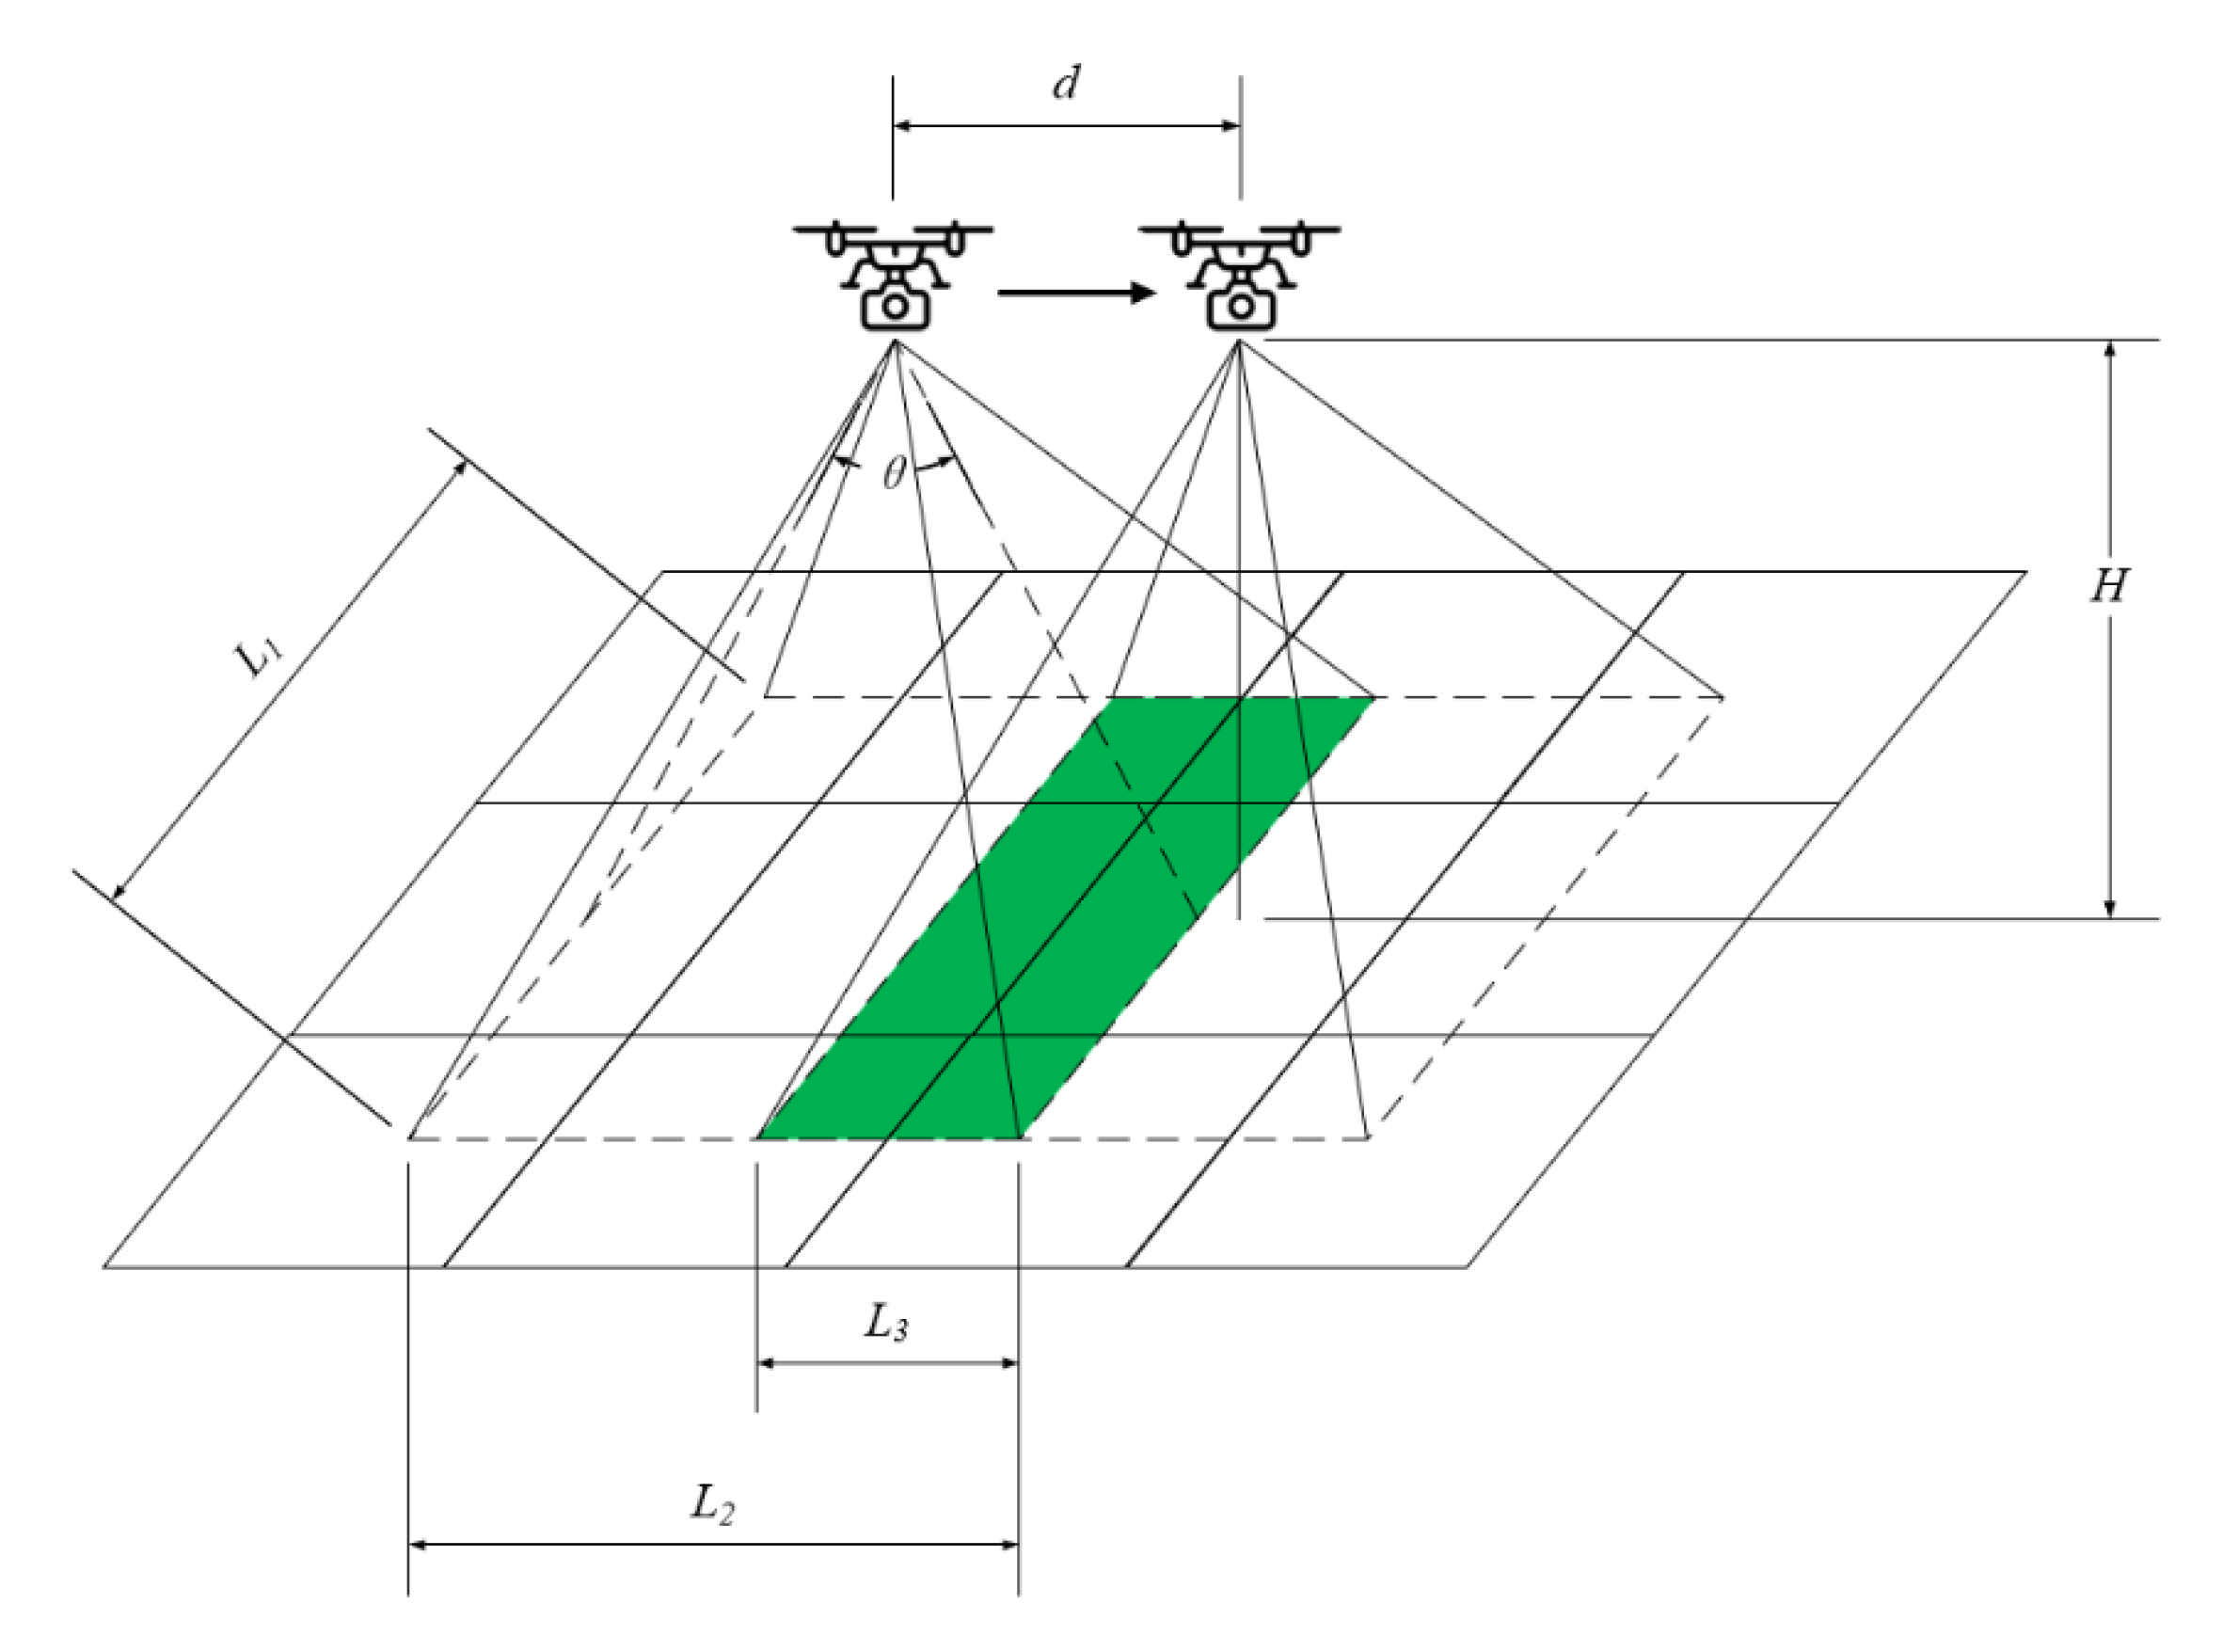
  • The whole target area should be relatively flat, and the terrain should not show distinctive changes. Since UAVs fly at a fixed altitude, abrupt changes in the terrain may affect the overlap ratios of different images.
  • The path length is the only variable that influences the energy consumption of UAVs. In this research, UAVs fly and take photos at a fixed altitude with a constant speed, which means the path length will decide energy consumptions directly. Therefore, one of the main goals of this research is to find almost the shortest paths for the clustered UAVs.

2.1. Map Decomposition

2.1.1. Partitioning the Map

To collect images possessing sufficient overlap, it is necessary to determine the sites where the UAVs will take photos. Considering that a UAV will take a photo at each point once, image overlap can be achieved if two adjacent points are sufficiently close. Therefore, the map is partitioned with many square cells (Figure 1), called map decomposition. D is the side length of each cell determined by several parameters, including the flight height, field of view (FOV) of the camera.
As Figure 1 shows, the whole map is decomposed into a collection of uniform grid cells, and the target area is surrounded by a closed thick black line. UAVs will fly above the target area and take photos at the center of each cell. Since each cell is a square, the distance between the centers of the two contacting cells equals their side length D. Thus, the image overlap requirements could be met if D is sufficiently small because the photo collected from one cell can always have a sufficient overlap ratio with those that are taken from its neighboring cells.

2.1.2. Cell Side Length Calculation

On the one hand, a small value of D can guarantee sufficient image overlap; on the other hand, it may lead to an extra computational burden for the reconstruction process because dense division means that the UAV will collect more image redundancy from the target area. As a result, the most important objective in this step is to determine the maximum value of slide length D, which can meet image overlap requirements without leading to unnecessary redundancy.
It is necessary to consider several camera parameters in order to determine the value of D. Figure 2 illustrates two adjacent photography sites for a UAV. L 1 refers to the length of the projection plane, and L 2 refers to the width. Since the projection plane is a rectangle, we assume that L 1   >   L 2 . L 3 is the overlap length of two photos (the overlapping region is shown in green in Figure 2). H is the distance between the camera lens and the projection plane, which is also the flight height. θ is the FOV of the camera, and d is the distance between the two photography sites.
The camera is perpendicular to the ground to optimize the view of the ground. Since the UAVs fly at a fixed altitude, L 1 and L 2 remain the same during the investigation. Therefore, the distance from the UAV’s prior location to the current location d equals the moving distance of the projection lane, which is L 2 L 3 . Thus, the relationship between the overlap ratio r and d can be referred to as:
r = L 3 L 2 = 1 L 2 L 3 L 2 =   1 d L 2 =   1 d 2 H t a n θ 2 .
Since θ and H are invariable, d can be calculated through a specified r .
The UAV is always moving from one cell to another, which means that the minimum value of d equals the side length D , which can be expressed as
d     D   .
D 2 1 r   H t a n θ 2 .
Therefore, the side lengths of the cells can be determined. It is worth mentioning that a UAV flies over a long distance in one movement, which will not affect image overlap. This is because a long-distance movement affects only the overlap ratio of two adjacent pictures, and the overlap of the whole picture set is unaffected by the order of the image collection.

2.2. Task Area Division

Considering that this research is based on the cooperative works of UAVs, the target area should be segmented into several parts and allocated to different UAVs. Compared to a single UAV operation, multiple UAVs can efficiently shorten investigation time and expand the area of the target area that can be investigated. The purpose of task allocation is to ensure nearly balanced energy consumption of each UAV in the formation.

2.2.1. Energy Consumption Assumption

In this research, since UAVs fly at a fixed altitude most of the time except taking off and landing, and the majority of energy is utilized to maintain UAV hovering and forward flight, the path length is taken as the only standard to estimate energy consumption. Namely, the shorter the paths are, the less energy UAVs consume. In addition, the goal of ensuring balanced energy consumption is promoted by evenly allocating the paths of UAVs.

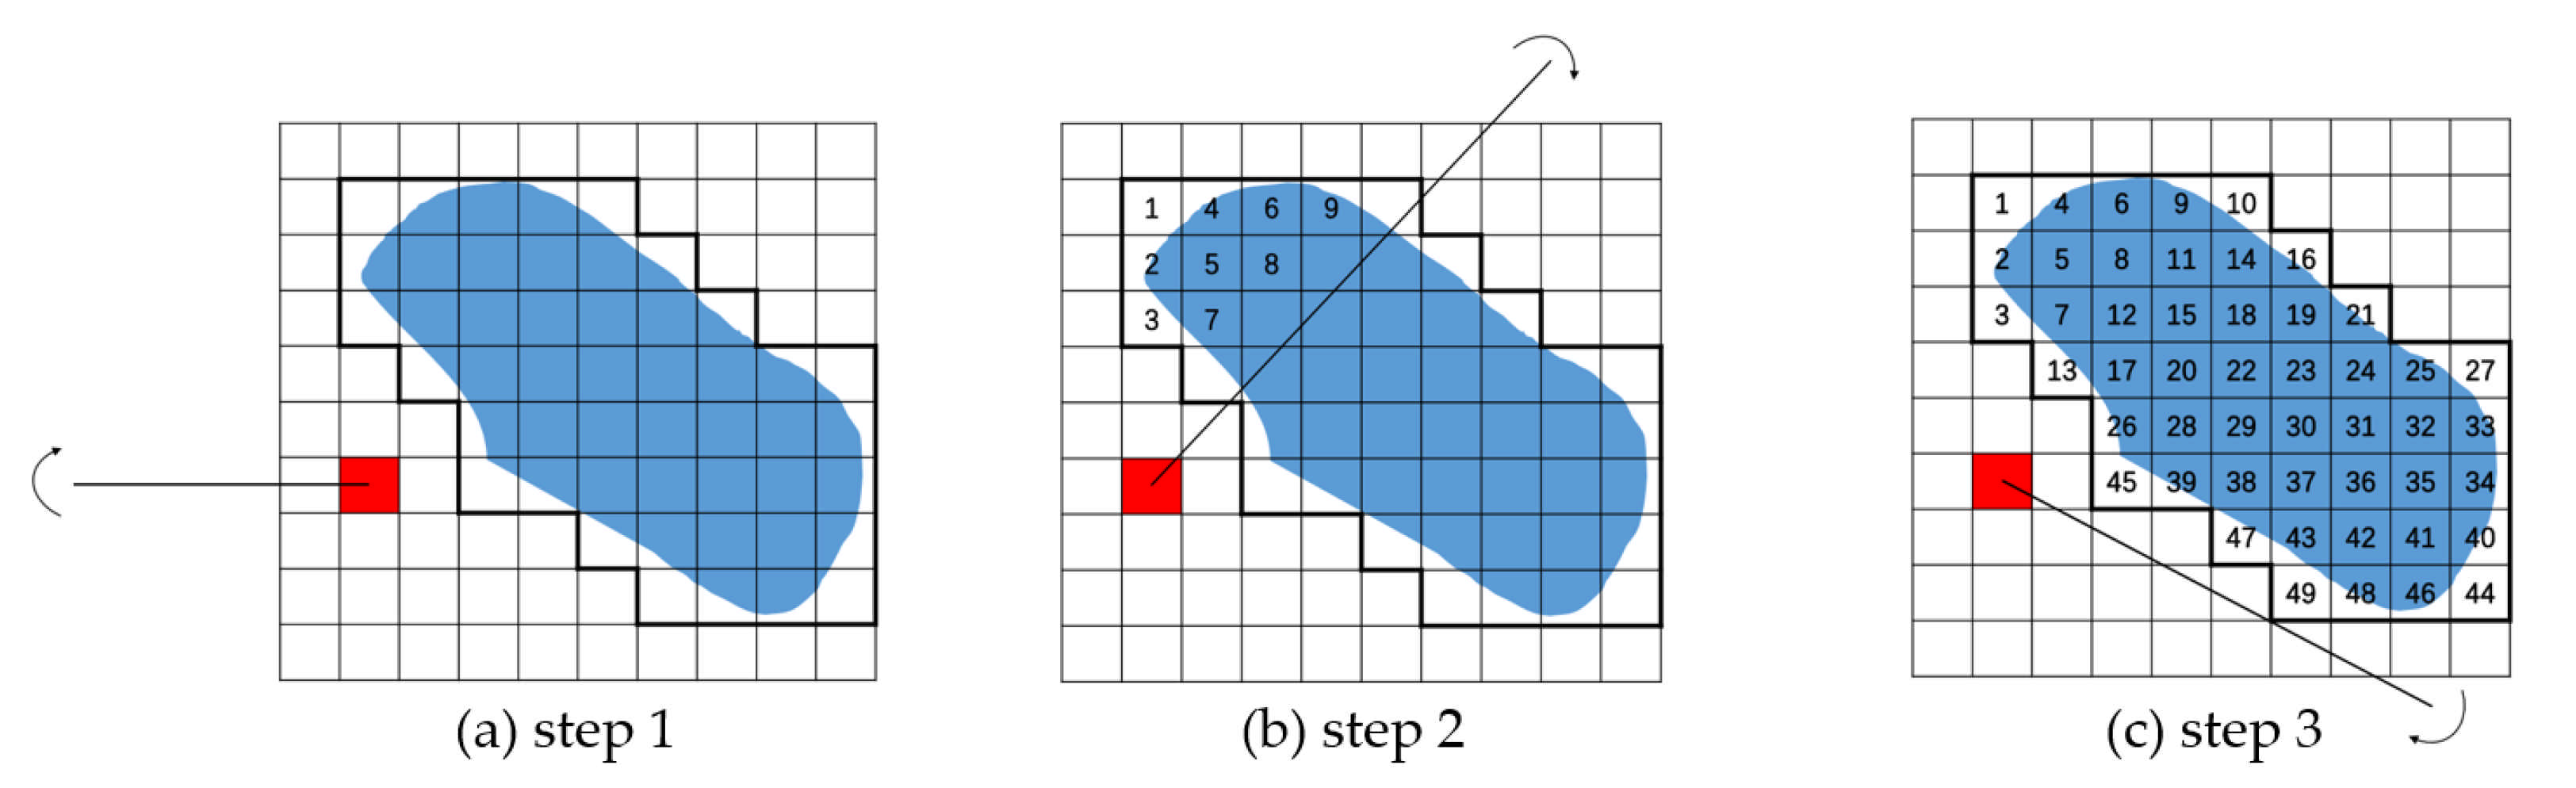
2.2.2. Take-Off Location Selection

Before area segmentation, an open and safe take-off location near the target area should be selected according to the site conditions. This take-off location should be close enough to the target area if conditions permit. A nearby take-off location can reduce unnecessary energy consumption for UAVs before entering and after leaving the target area.

2.2.3. Area Scan and Segmentation

After the take-off location is determined, a ray from the take-off location scans the whole area in a clockwise direction from 0 ° to 360 ° to mark each cell. As Figure 3 shows, the red cell represents the take-off location, and the cells which are fully scanned by the black ray are labeled in order. If two cells are fully scanned at the same time, the one that is closer to the prior cell should be numbered preferentially.
After the whole target area is fully scanned, all the cells are then divided into several parts depending on the quantity of the cells and UAVs in the formation. The objective of this step is to balance energy consumption for different UAVs and prevent UAVs crashing into each other. If there are N cells in the target area and n UAVs in the formation, all the cells are evenly divided into n parts. The first part contains cells from 1 to N n , the second part contains cells from | N n | + 1 to 2 N n , and so on. Without loss of generality, part i contains cells from | ( i 1 ) N n | + 1 to | i N n | . Figure 4a illustrates the result of this area scan division process. The whole target area is divided into three parts painted and shown in different colors (it is assumed that there are three UAVs in the formation). The balanced consumption of UAVs is achieved through the even area division since path lengths are highly dependent on the quantity of the cells.

2.2.4. Comparison between Scan-Based Area Division and Vertical Area Division

Different from simple horizontal or vertical segmentation, this ray-scan-based area division method distributes these subareas around the take-off location in a clockwise direction, which means that each subarea has several cells close to the take-off location. In this way, UAVs do not have to enter their allocated subarea by flying over long distances and crossing the fields of other UAVs, which may cause UAVs to crash into each other. Results of the proposed scan-based area division and general vertical area division is illustrated in Figure 4.

2.3. Simulated Annealing Algorithm-Based Path Planning

After dividing the target area and allocating subareas to UAVs, the near-optimized paths in each part should be considered. In this part, we take the path finding problem as a TSP and utilize the SAA to solve it.

2.3.1. Take-off Location Based Coordinate System

A Cartesian coordinate system is established at the origin of the take-off location. The unit length of the coordinate is the side length D . Since the location of each cell is already known, the distance between cell i and cell j can be obtained by:
d i j = x i x j 2 + ( y i y j ) 2 .
Here, x i , y i is the coordinate value of cell i in the grid map.
A = 0 d 12 d 13 d 1 N d 21 0 d 23 d 2 N d 31 d 32 0 d ( N 1 ) N d N 1 d N 2 d N ( N 1 ) 0 ,
where A is the distance matrix that contains the distances between each pair of cells, and we have:
d i j = d j i
The distance matrix A will be the only parameter input into the SAA.

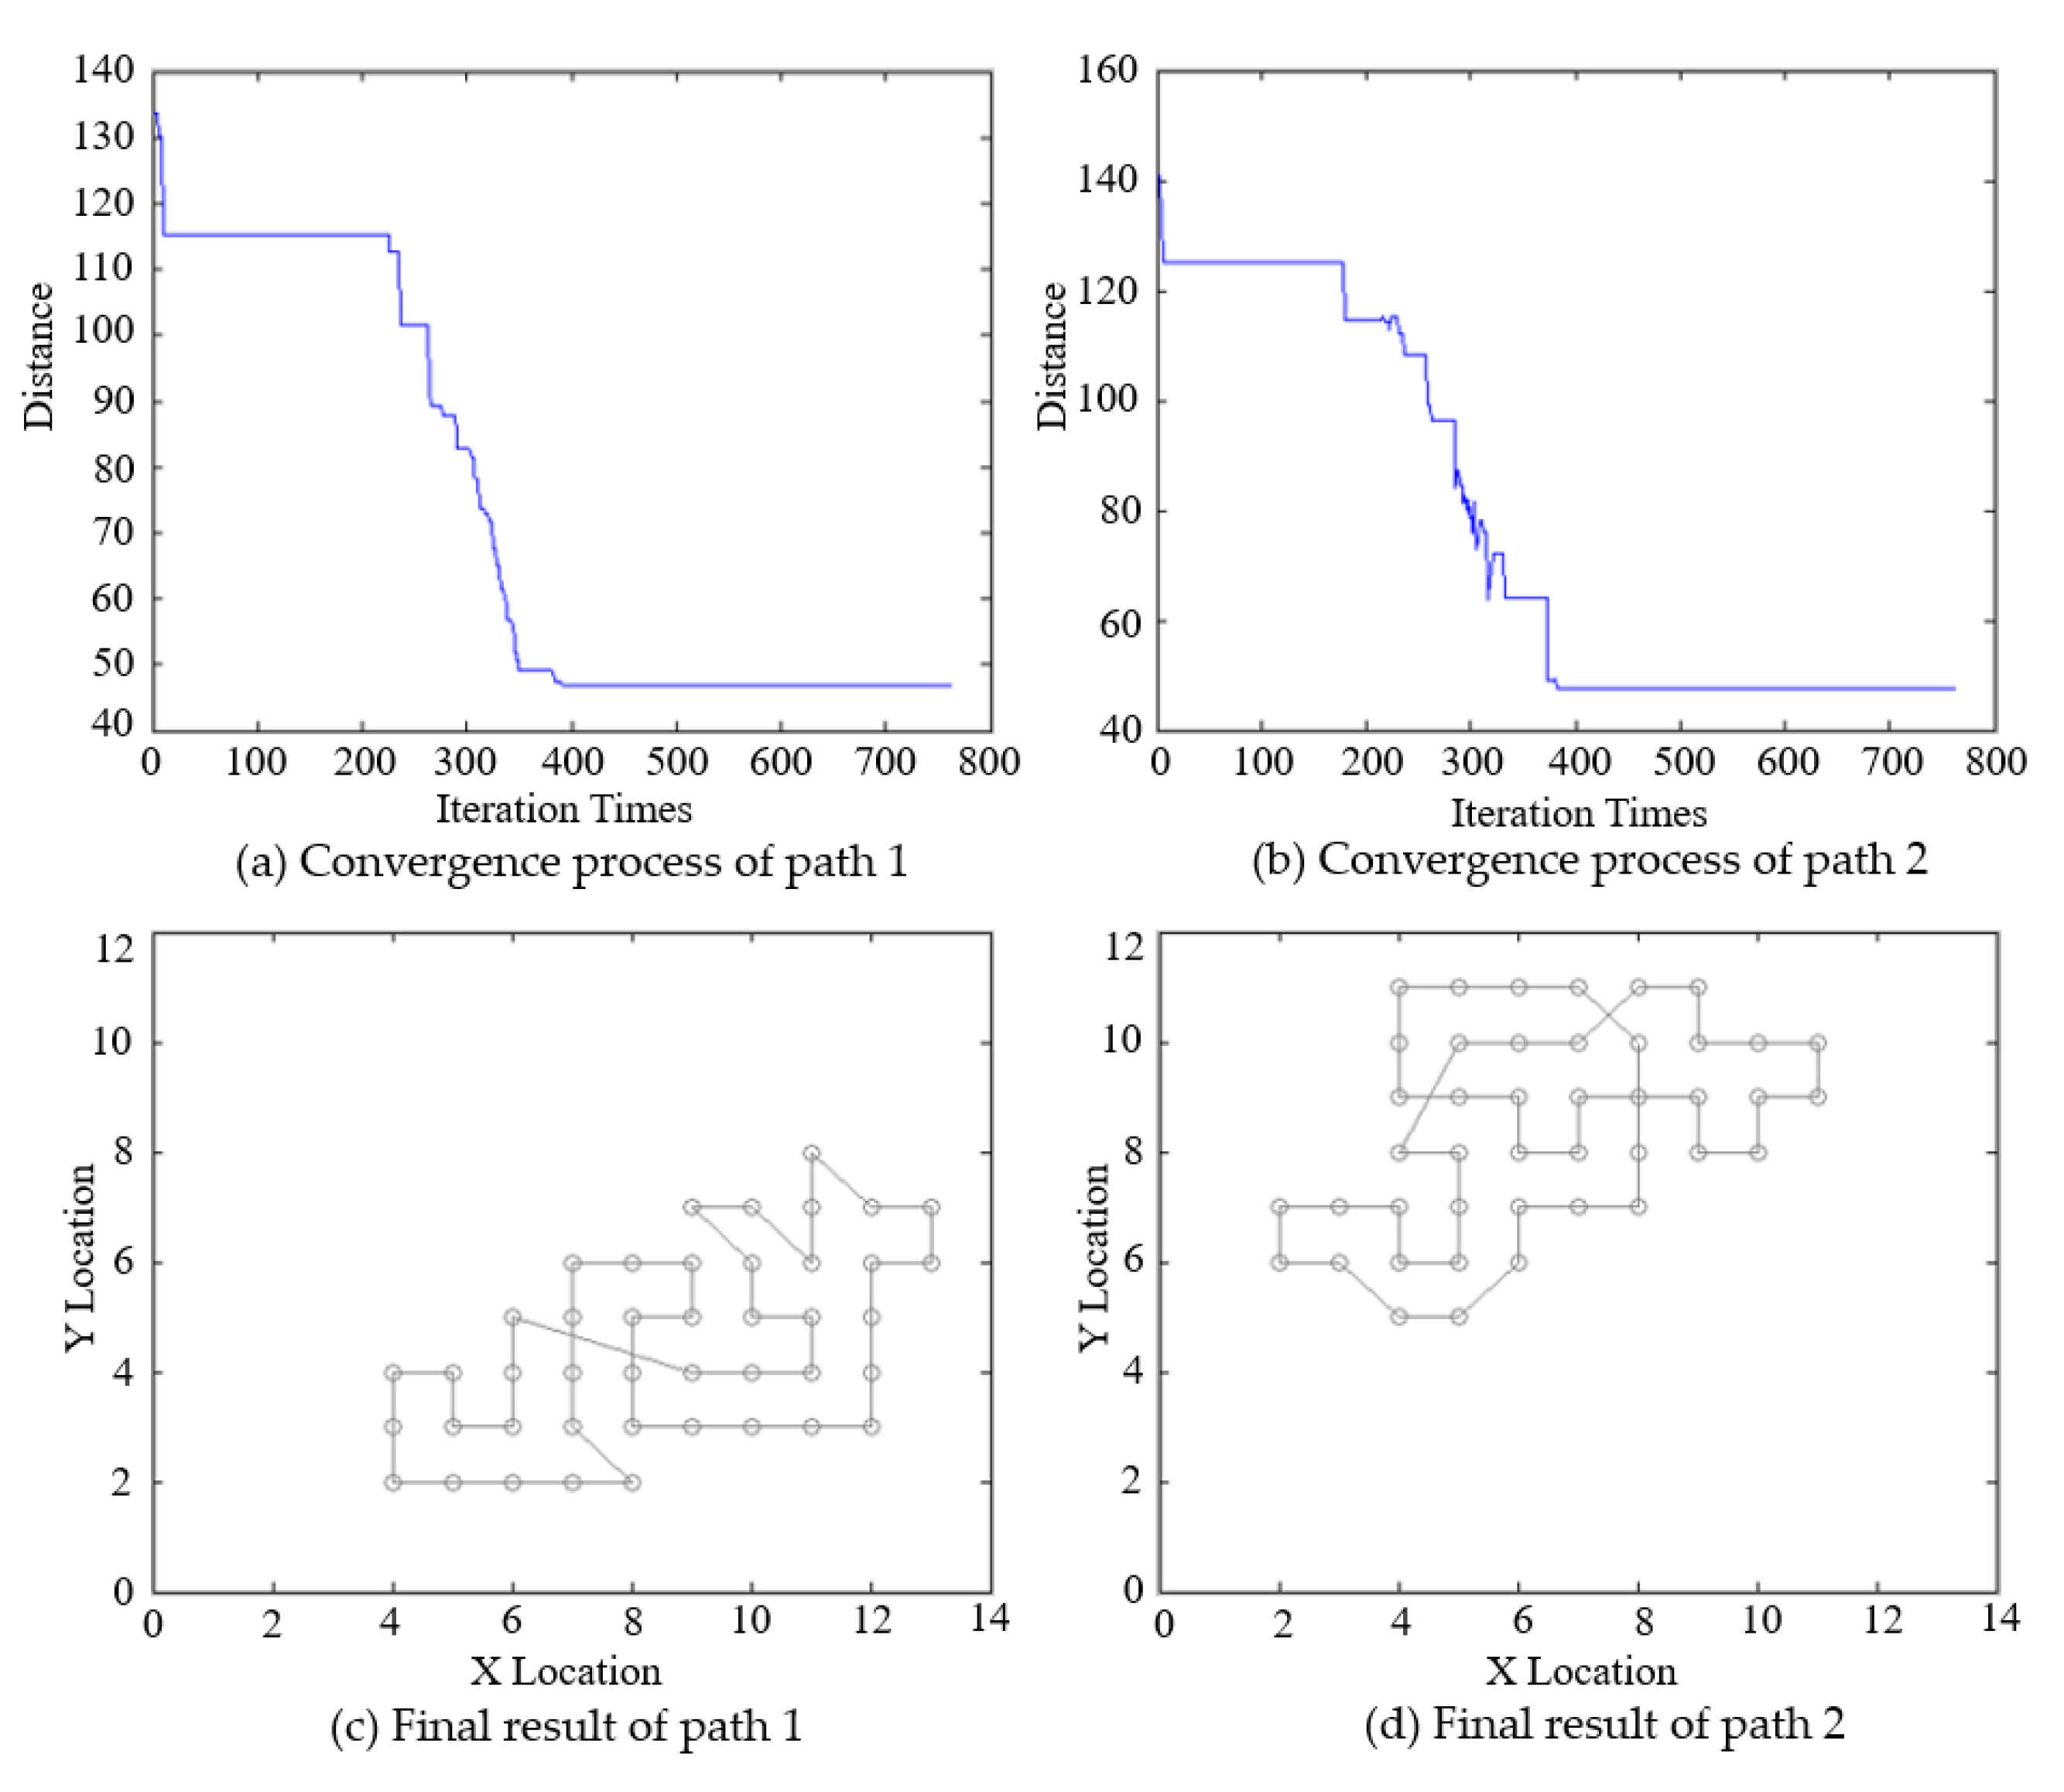
2.3.2. Near-Optimized Path Calculation

Since the TSP is a NP-hard problem in combinatorial optimization [22], we utilize a metaheuristic method—the SAA—to find near-optimized paths. In this algorithm, the probability of making a transition from the old solution s o l d to a potential new solution s n e w is decided by an acceptance probability function, which is also called the Metropolis criterion:
p = 1 ,   i f   E x n e w E x o l d . exp E x n e w E x o l d T ,   i f   E x n e w > E x o l d .
Here, p is the transition probability, and E is the energy state of a solution. Each specific solution can be represented by a cell list S = c 1 , c 2   , c 3   , , c N , c i represents cell i and the distance between a pair of cells d k can be obtained as follows:
d k = d c k c k + 1 ,
where 1 k < N , especially, we have:
d N = d c N c 1 .
Then, the energy state of the solution E can be obtained by:
E =   k = 1 N d k .
In the iteration process, a new solution x n e w is generated through randomly exchanging the orders of two cells, and the transition will occur when E x n e w E x o l d , which means that the path length of the new solution is shorter than that of the old solution. If E x n e w > E x o l d , the transition could still occur with a probability of p . In the Metropolis criterion, T is the temperature, which controls the iteration process of the whole algorithm. The temperature will decay from an initial temperature T i to a final temperature T f . At each iterating process, the value of T decays at a speed of:
T = q × T ,
where q is the decay rate, which determines the reduction in T in iterations.

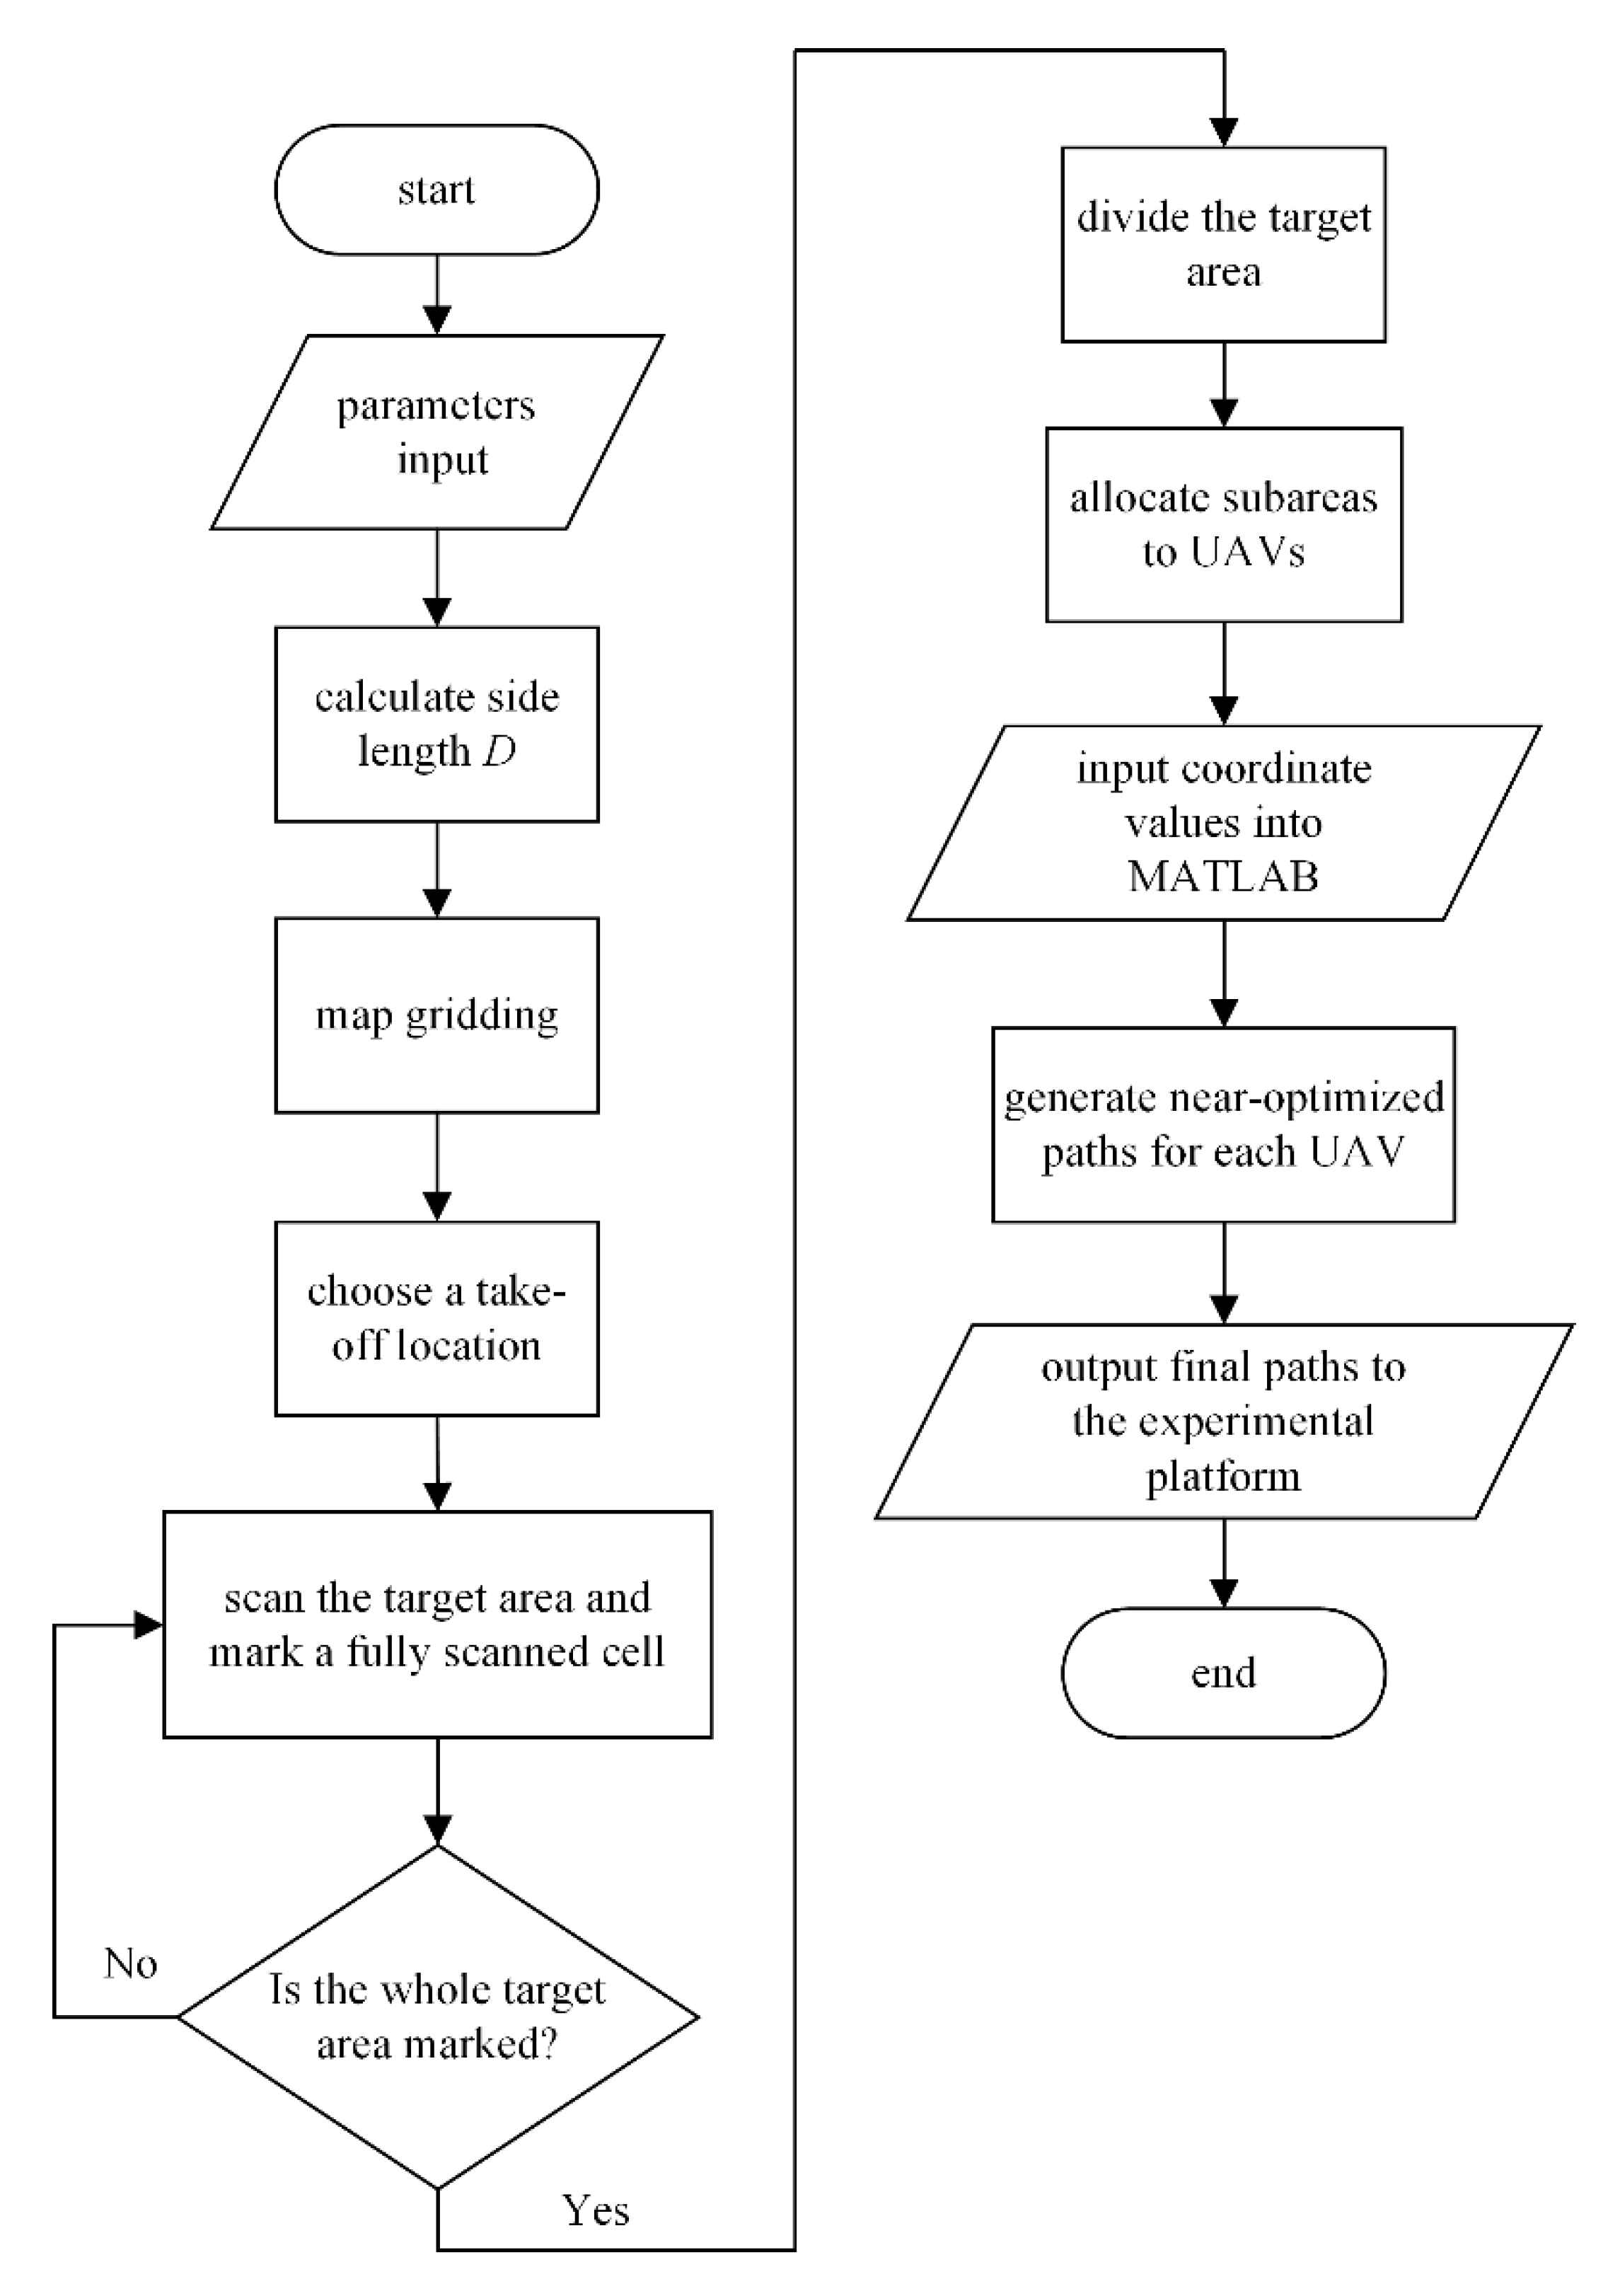
2.4. Workflow of the System

Figure 5 shows the flowchart of the whole system. First, some works should be done manually, such as parameter input and calculation, map gridding and take-off location selection. Second, the target area scan and segmentation need to be done on a computer. Different subareas for different UAVs are determined in this step. Third, the coordinate value of the cells is then input into MATLAB to generate near-optimized paths. In the end, paths are converted into waypoints information to guide the flight of the UAVs.

3. Site Experiment

In this part, a site experiment was conducted in a campus environment to validate the proposed method. A zigzag path was tested as the contrast experiment to compare with the SAA path. In this section, our experimental platform is introduced first, and then the parameters and results of the experiment follow.

3.1. Experimental Platform

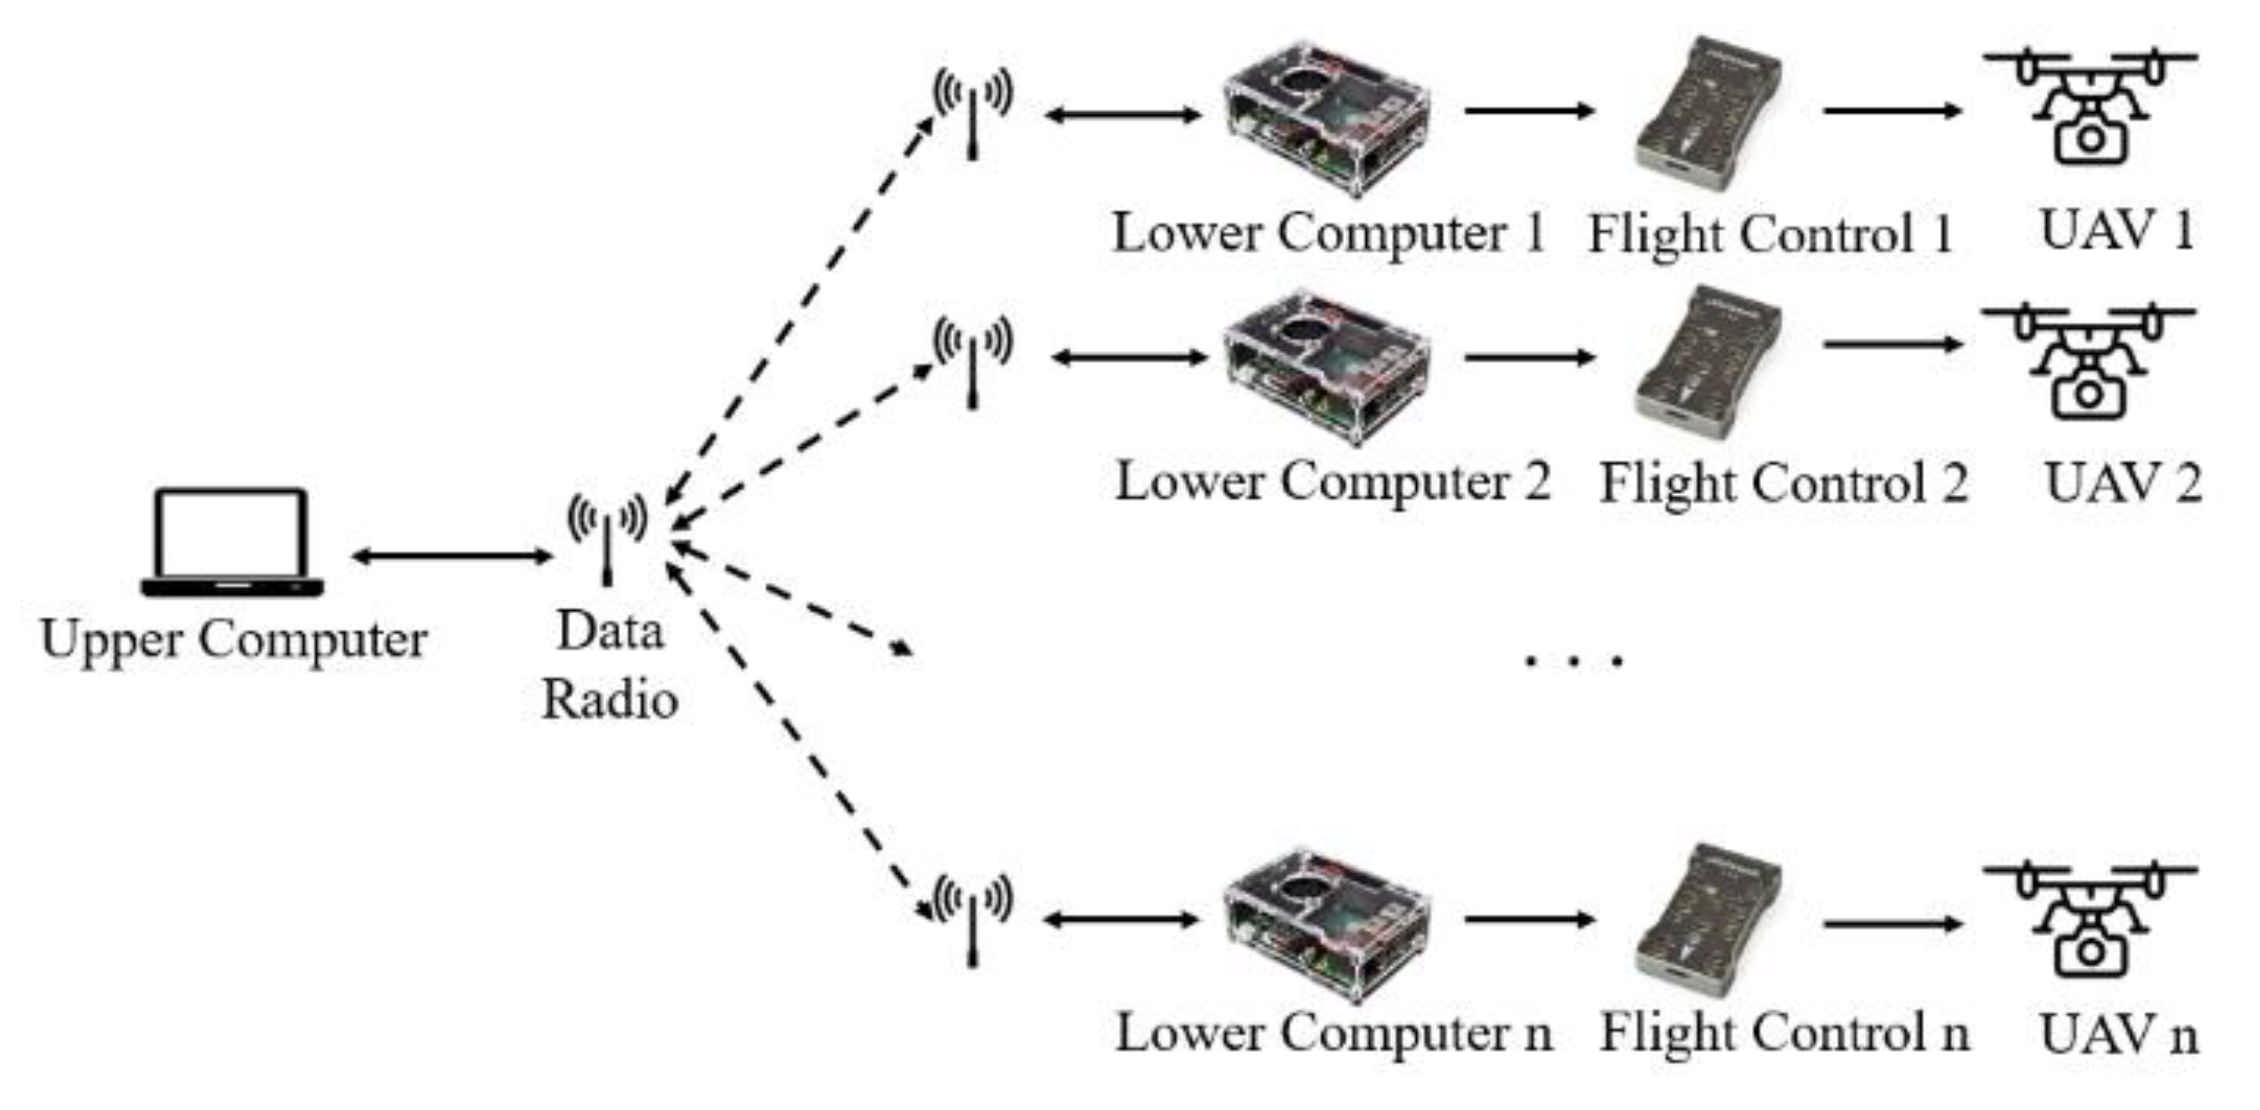
3.1.1. Formation Control System
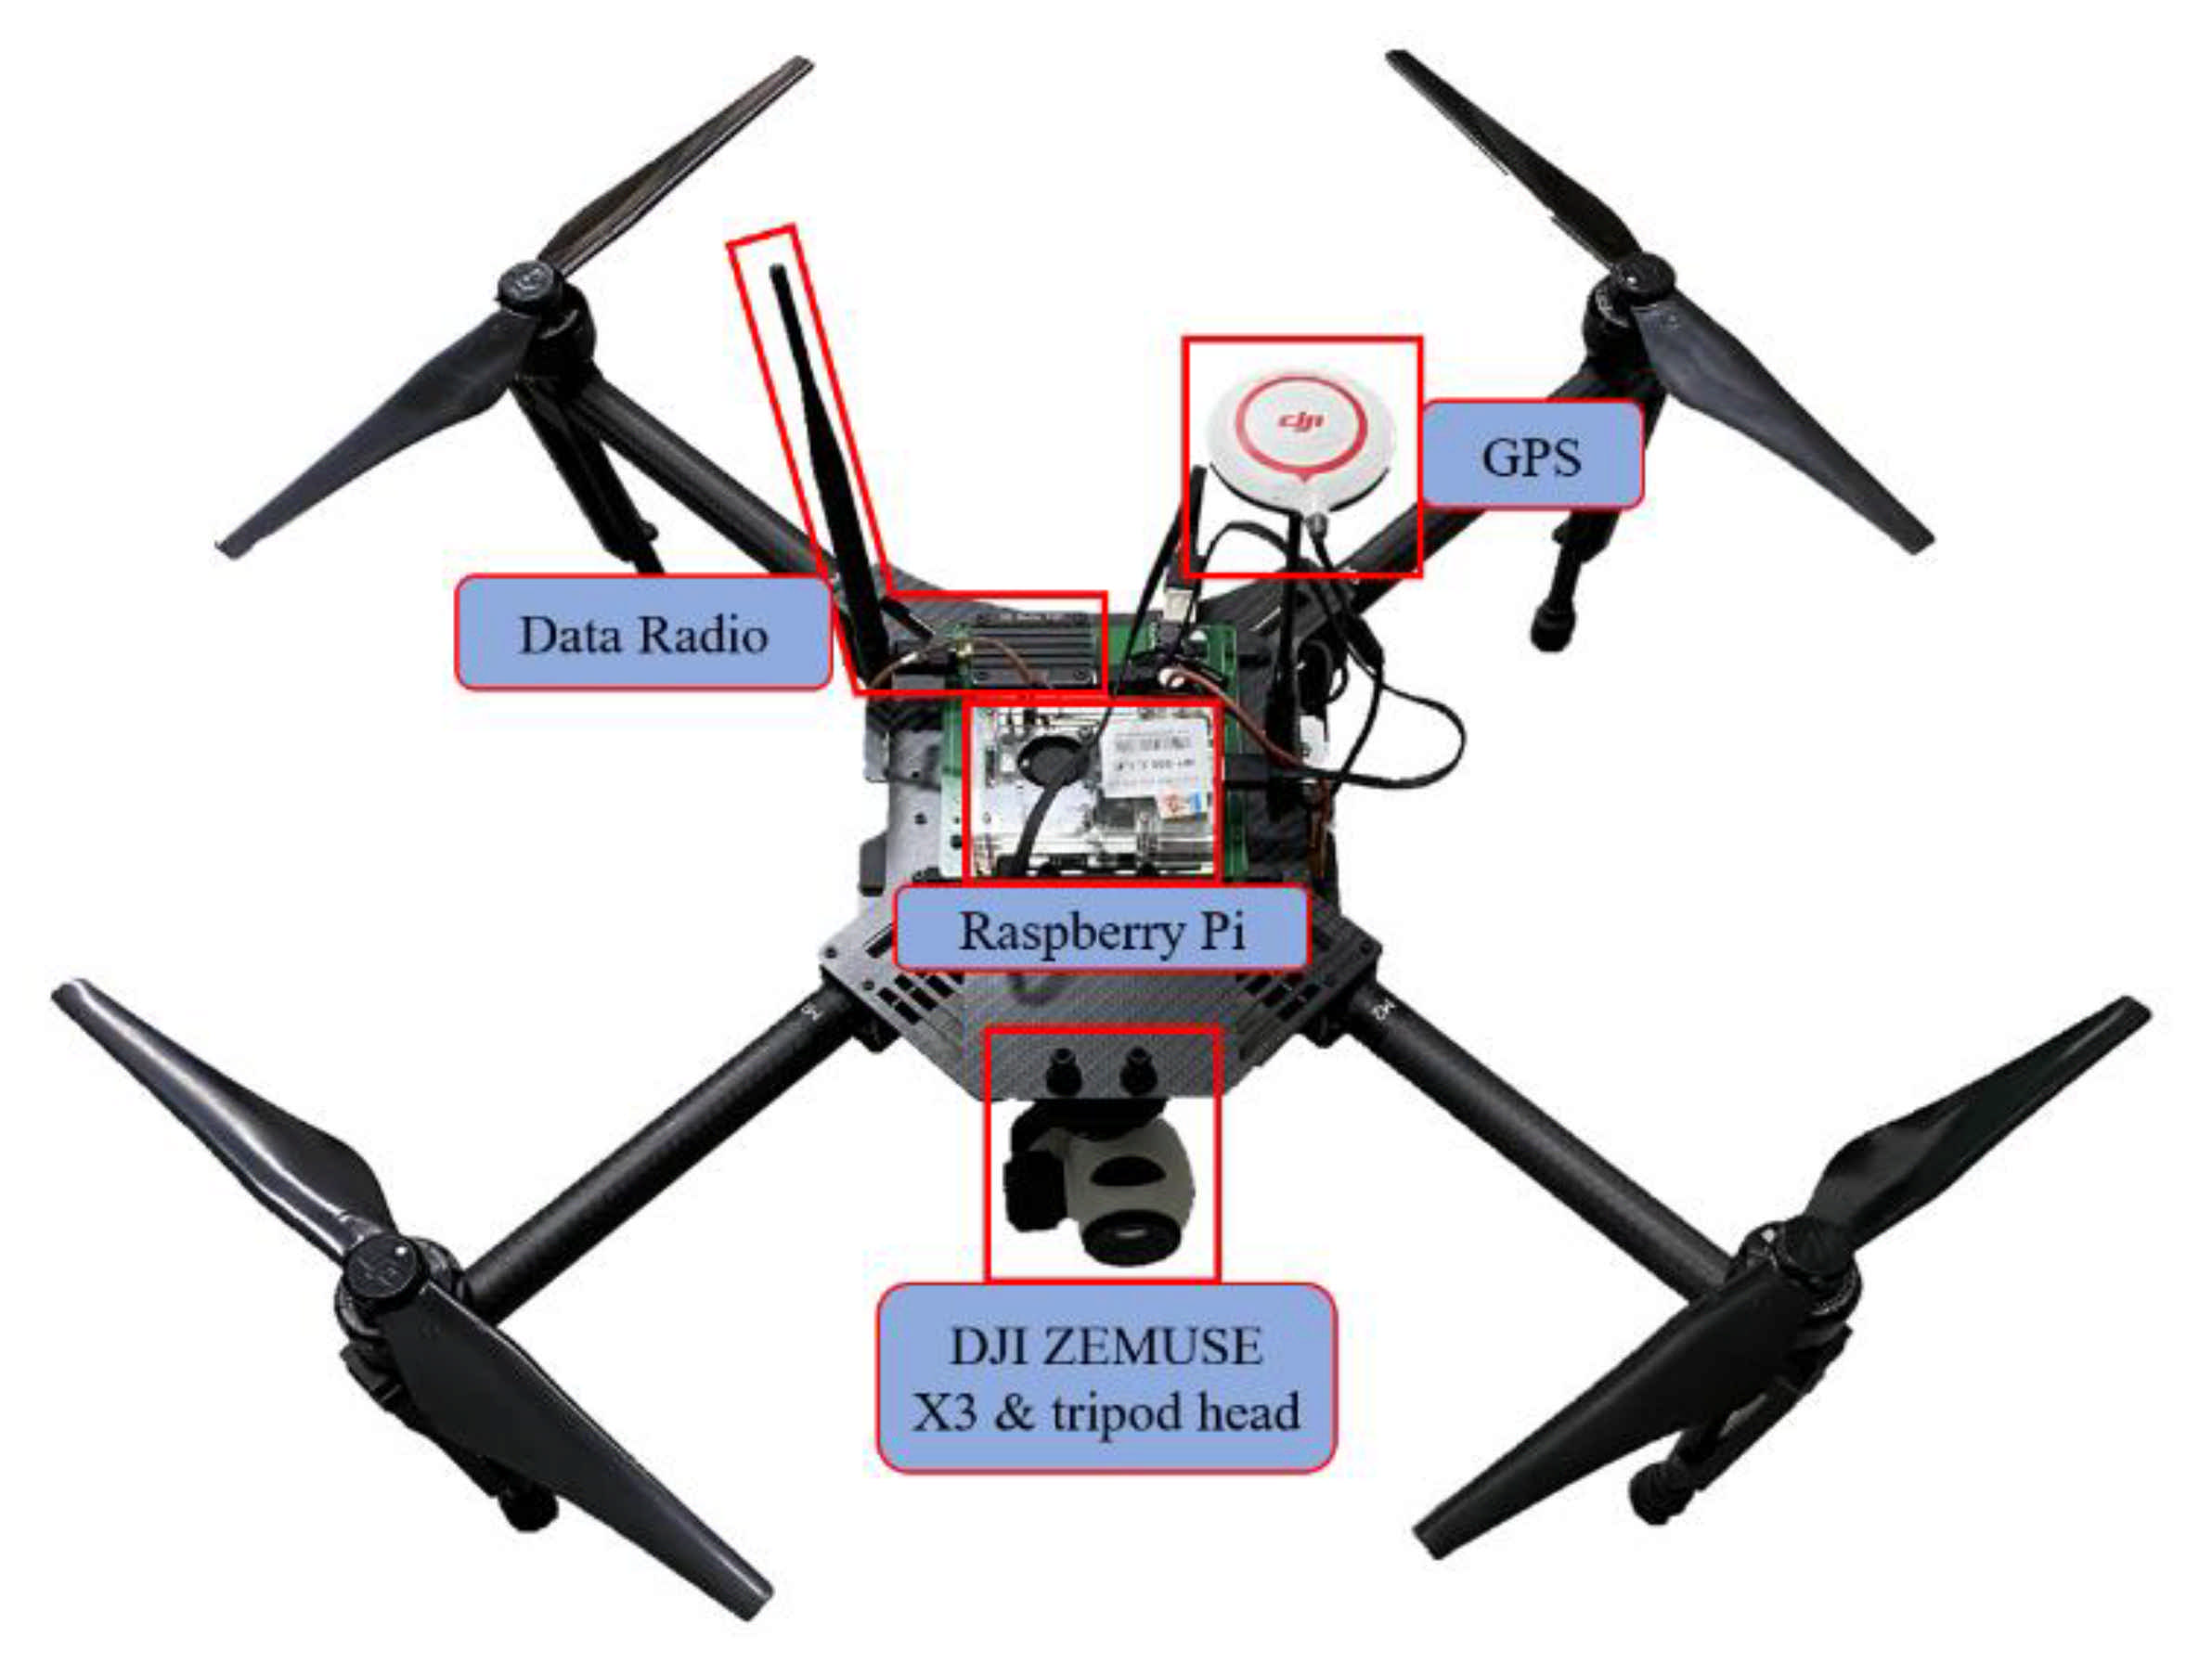
To realize cluster formation communication control and high-precision guidance, a self-developed system is utilized in this study. An upper computer, lower computers, data radios, and flight control systems are employed in this system. Figure 6 shows the whole framework of the formation control system, where the solid line represents wired communication and the dotted line represents wireless communication. The upper computer is a personal computer, and the lower computers are onboard microcomputers. Raspberry Pi is selected as the lower computer in this system because of its low power consumption and efficient computational power.

3.1.2. UAV Platform

The UAV platform DJI Matrice 100 (see Figure 7) is utilized in the site experiment. Each UAV is equipped with a DJI Zenmuse X3 monocular camera, a tripod head, a lower computer (Raspberry Pi), a data radio, a flight control, and GPS. In this paper, programs running on both the upper computer and lower computers are self-developed.

3.2. Experimental Results

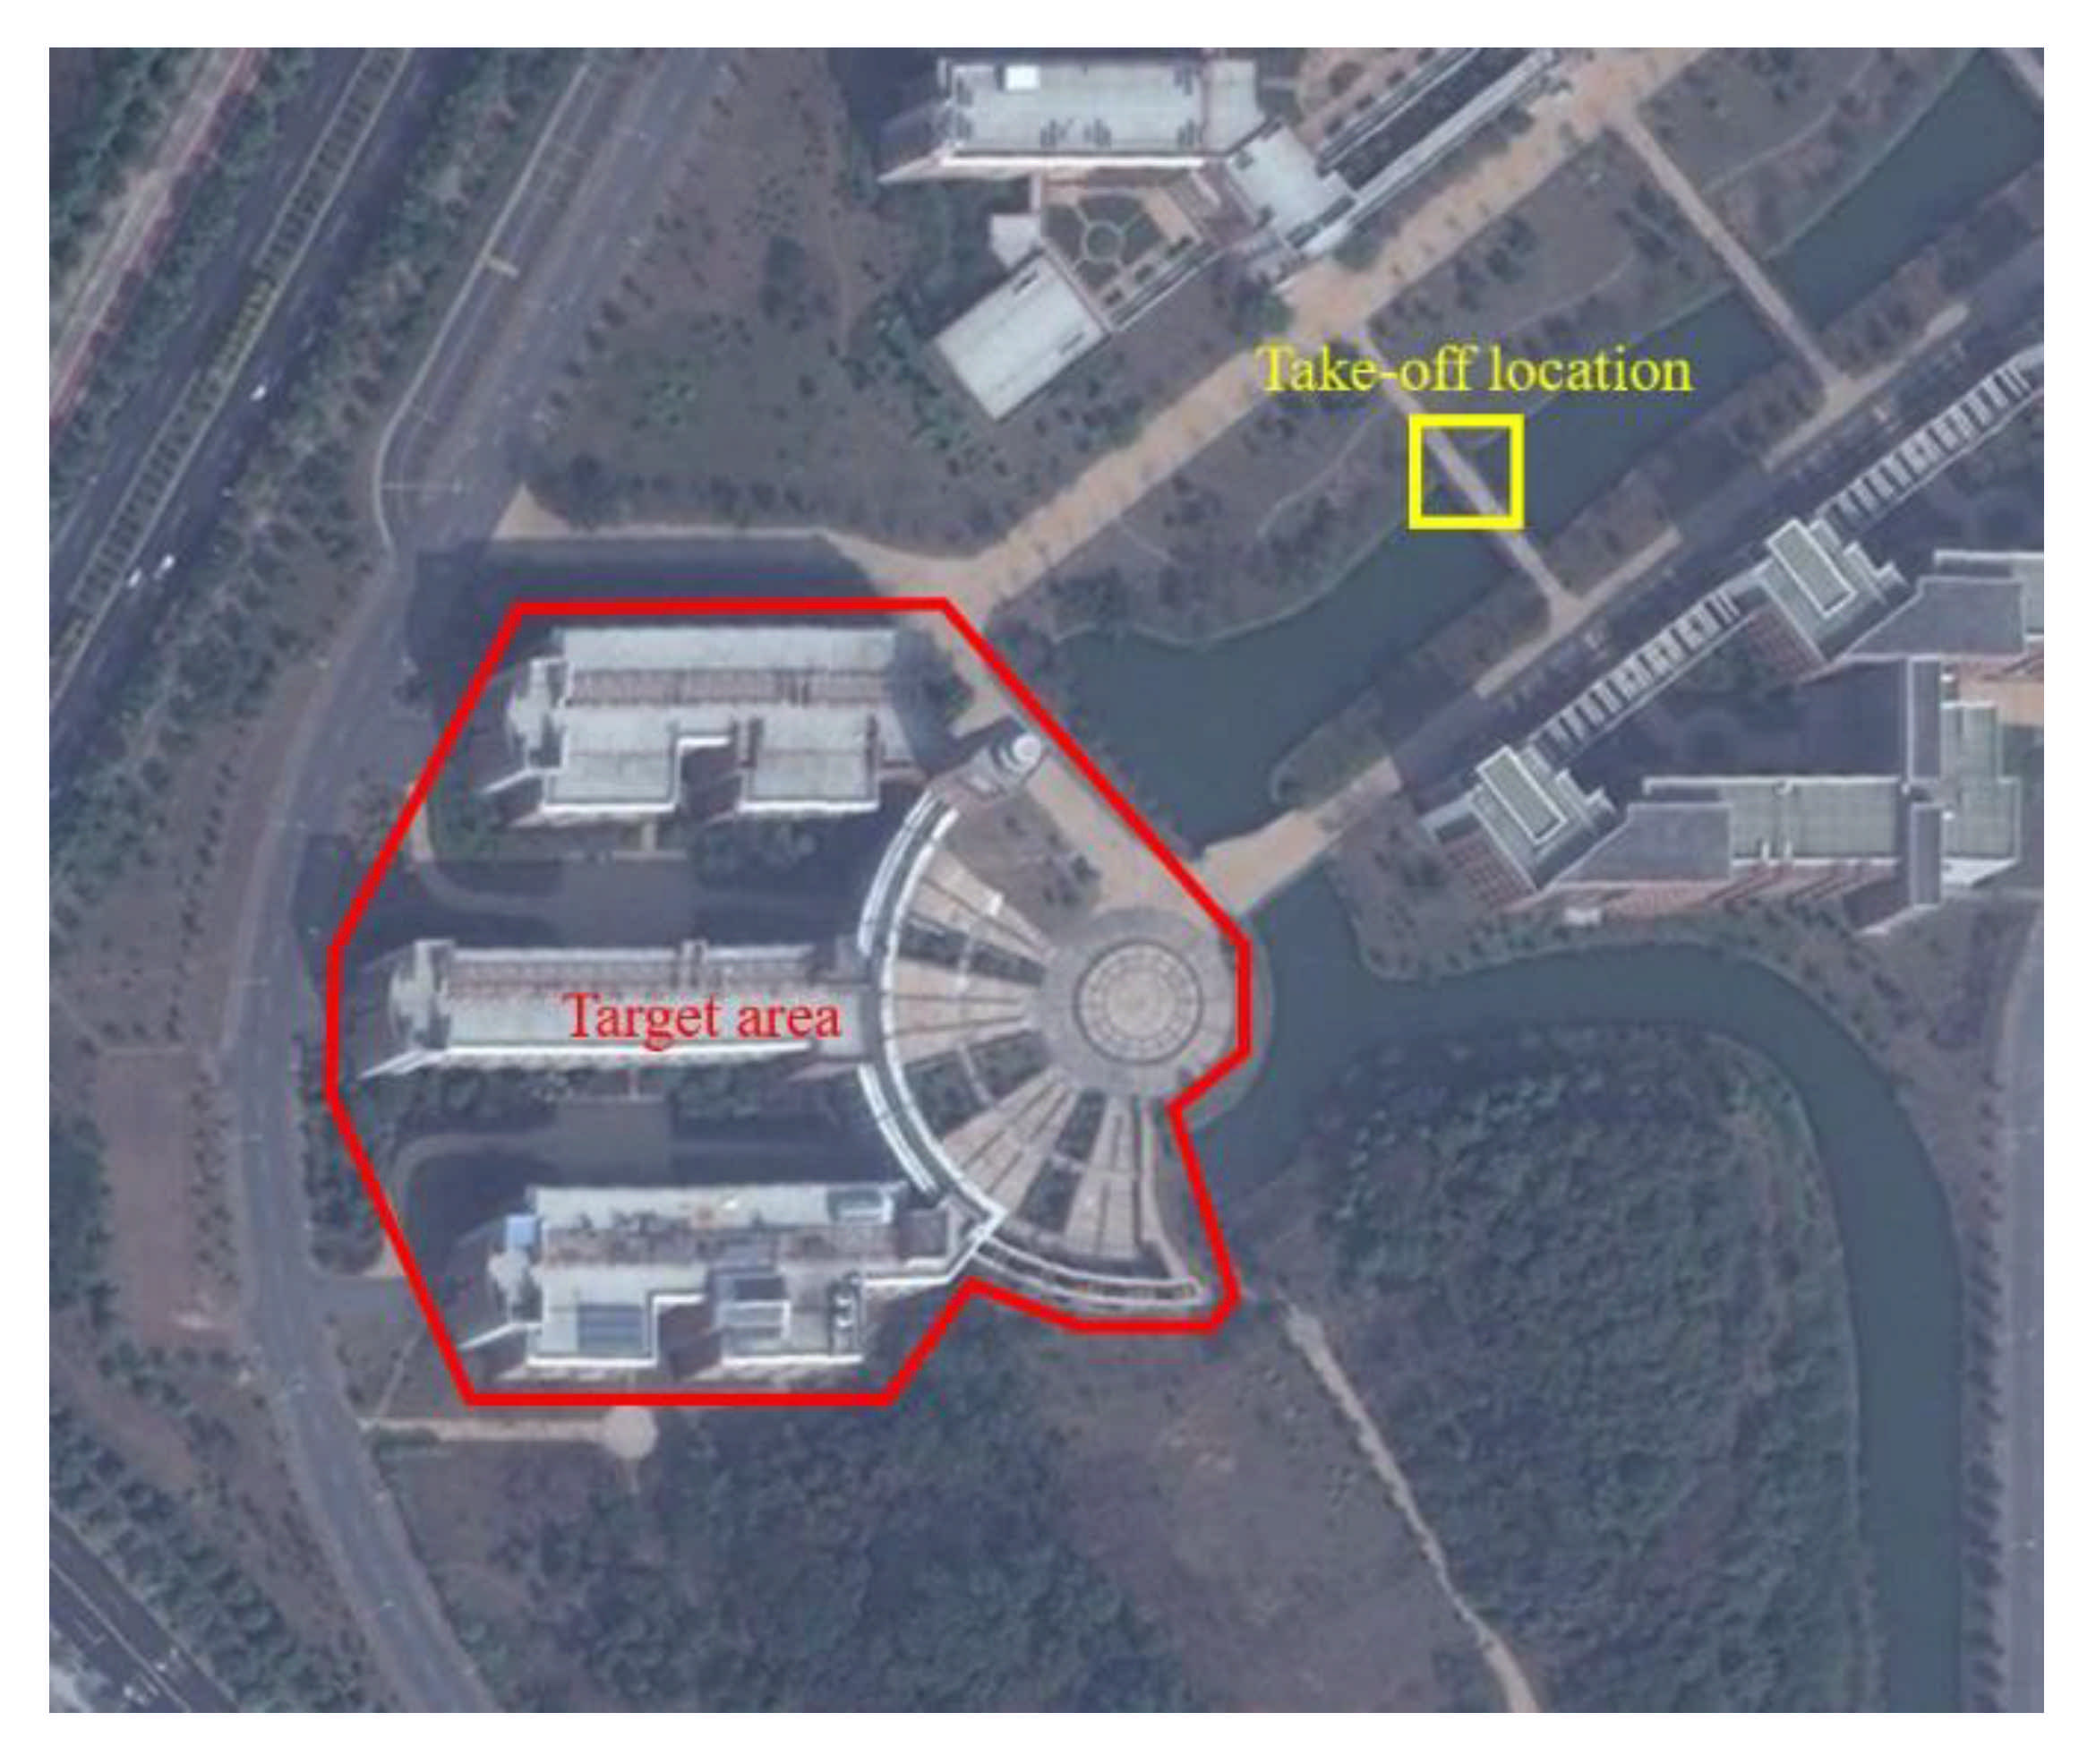
3.2.1. Experimental Subject and Parameters

A building located at Sun Yat-sen University, Guangzhou, China, was chosen as the target for reconstruction (Figure 8).
Two UAVs were employed to take photos in this experiment. The head direction of the UAVs is locked to the initial direction since they would consume extra energy when turning. Under this operation mode, UAVs can change their directions by adjusting the speed of different motors and save much energy. A bridge near the target area was selected as the take-off location based on safety considerations (shown in yellow in Figure 8). We adopted the same hardware and experimental conditions when comparing the proposed method and a zigzag path planning method. The relevant parameters of the experiments are listed in Table 1. These parameters are the same in both the SAA path experiment and zigzag path experiment.
We selected two UAVs in this experiment because they were enough for the data collection of the target area. Meanwhile, we set 70m as the flight height to allow UAVs to navigate safely and take the clearest photos possible. The angle of inclination is 90°, which means that the head direction of the camera is perpendicular to the ground surface. In total, 80% of the overlap ratio was determined based on the experience of 3D reconstruction. The values of the initial temperature and the final temperature were set to guarantee that the SAA can always get a convergent result.

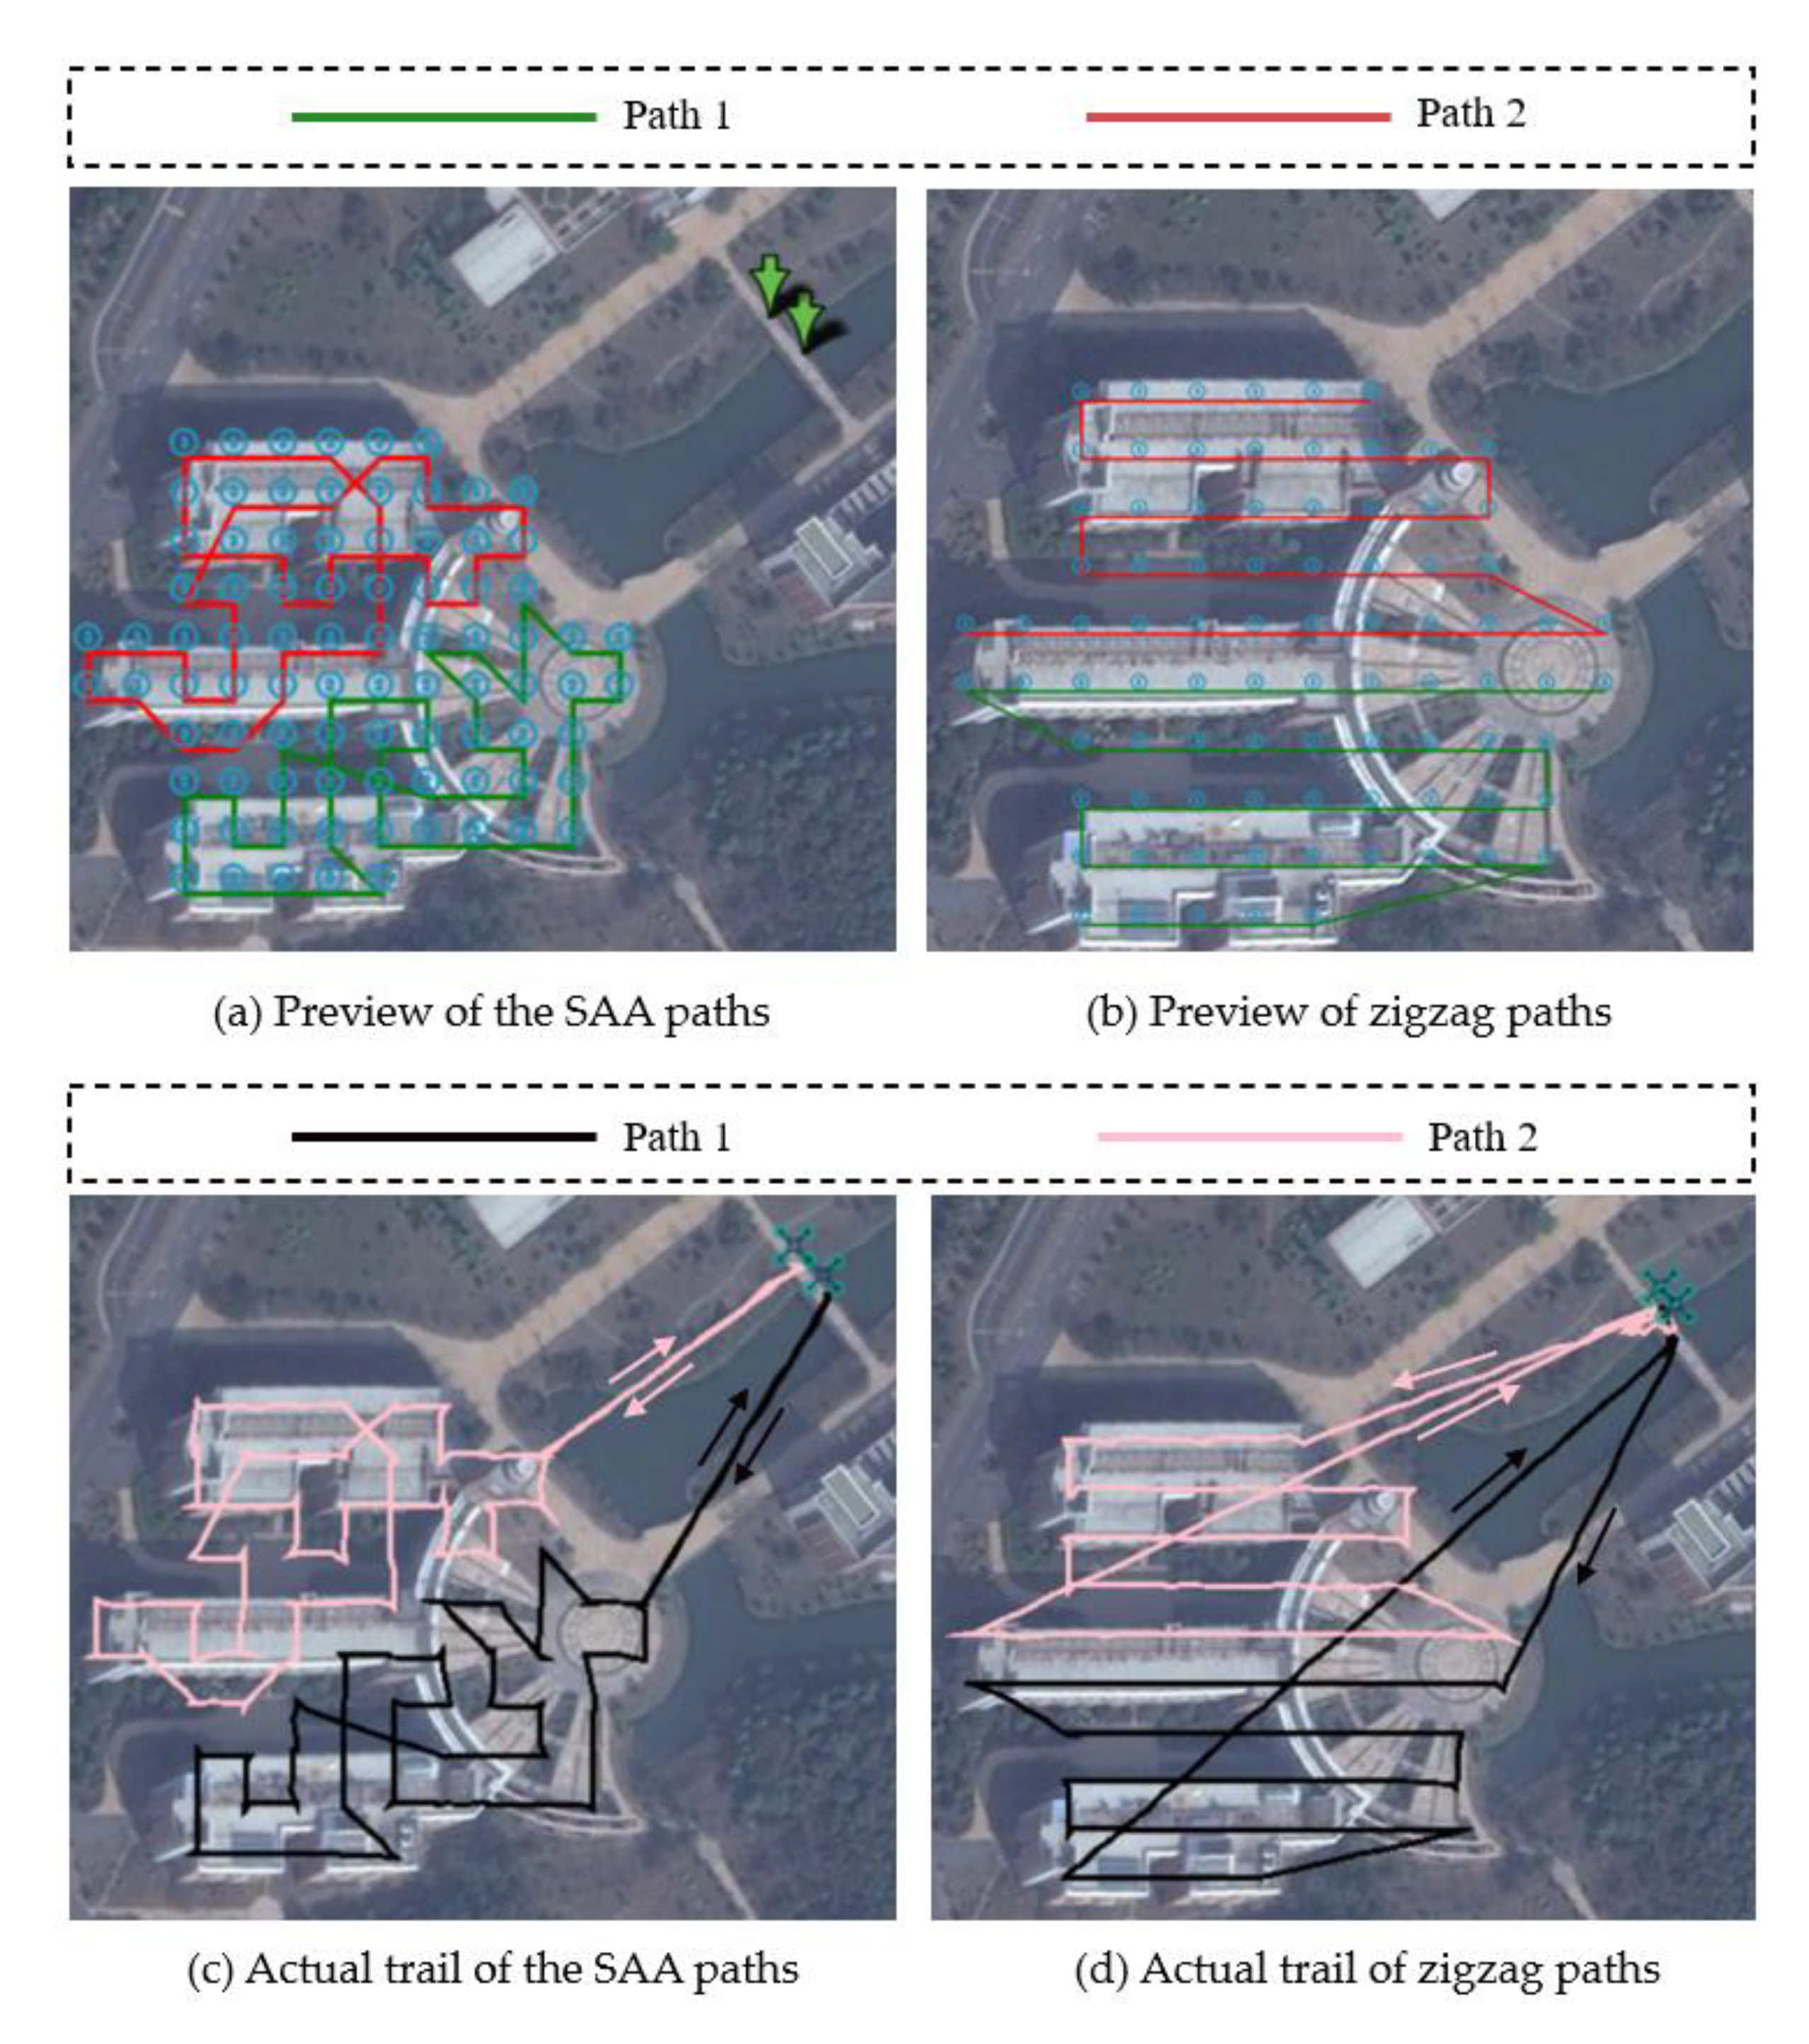
3.2.2. Experimental Paths

The initial solutions for the SAA paths were first generated by a built-in random function in MATLAB (version 8.3.0.532, R2014a), and then new solutions were calculated during the iteration process. Figure 9 shows the convergence processes and final results of the SAA paths. As zigzag paths are more easily deployed, the paths of the contrast experiment are designed based on a grid map and horizontal area division.
The previews and actual trails for the two different paths are shown in Figure 10. There is a little difference between ideal paths and actual paths due to the inertia of the UAVs and the location error of the GPS system. This difference is acceptable because some image redundancy has been reserved in the image overlapping.
The path lengths and flight time of the two experiments are listed in Table 2. Both paths and the flight time of the SAA method are shorter than those of the zigzag method. The total length is reduced by 12.6% and the total time is reduced by 8.6%. Beyond that, the path length difference of the SAA method is much shorter than that of the zigzag method, indicating that a more balanced energy consumption is achieved by the proposed method. This result is the combined effect of the SAA method and the proposed scan-based area division.
To understand why the SAA method performs better than the zigzag method, the paths are divided into three parts to analyze (i.e., forward path, inner path, and backward path). They record the distance between the take-off location and the origin of the target area, the path length that UAVs fly through in the target area, and the distance between the destination of the target area and the take-off location, respectively. Lengths of different parts of the experiment are listed in Table 3.
It can be obtained from Figure 10 and Table 3, though the target area segmentation is different in these two methods, that both subareas have almost same number of cells, which makes them comparable. Obviously, the SAA method does not achieve much length reduction in the inner path part and the length of inner path 2 of the zigzag method is even shorter than that of the SAA method. However, a distinct length reduction is achieved by the SAA method in both forward path and backward path. As a result of the TSP, the SAA method aims to find a closed curve for the inner path, and this makes the origin and the destination of the target area share the same cell. In this way, UAVs do not have to cross long distances before entering and after leaving the target area. As a result, the SAA method performs better than the zigzag method.

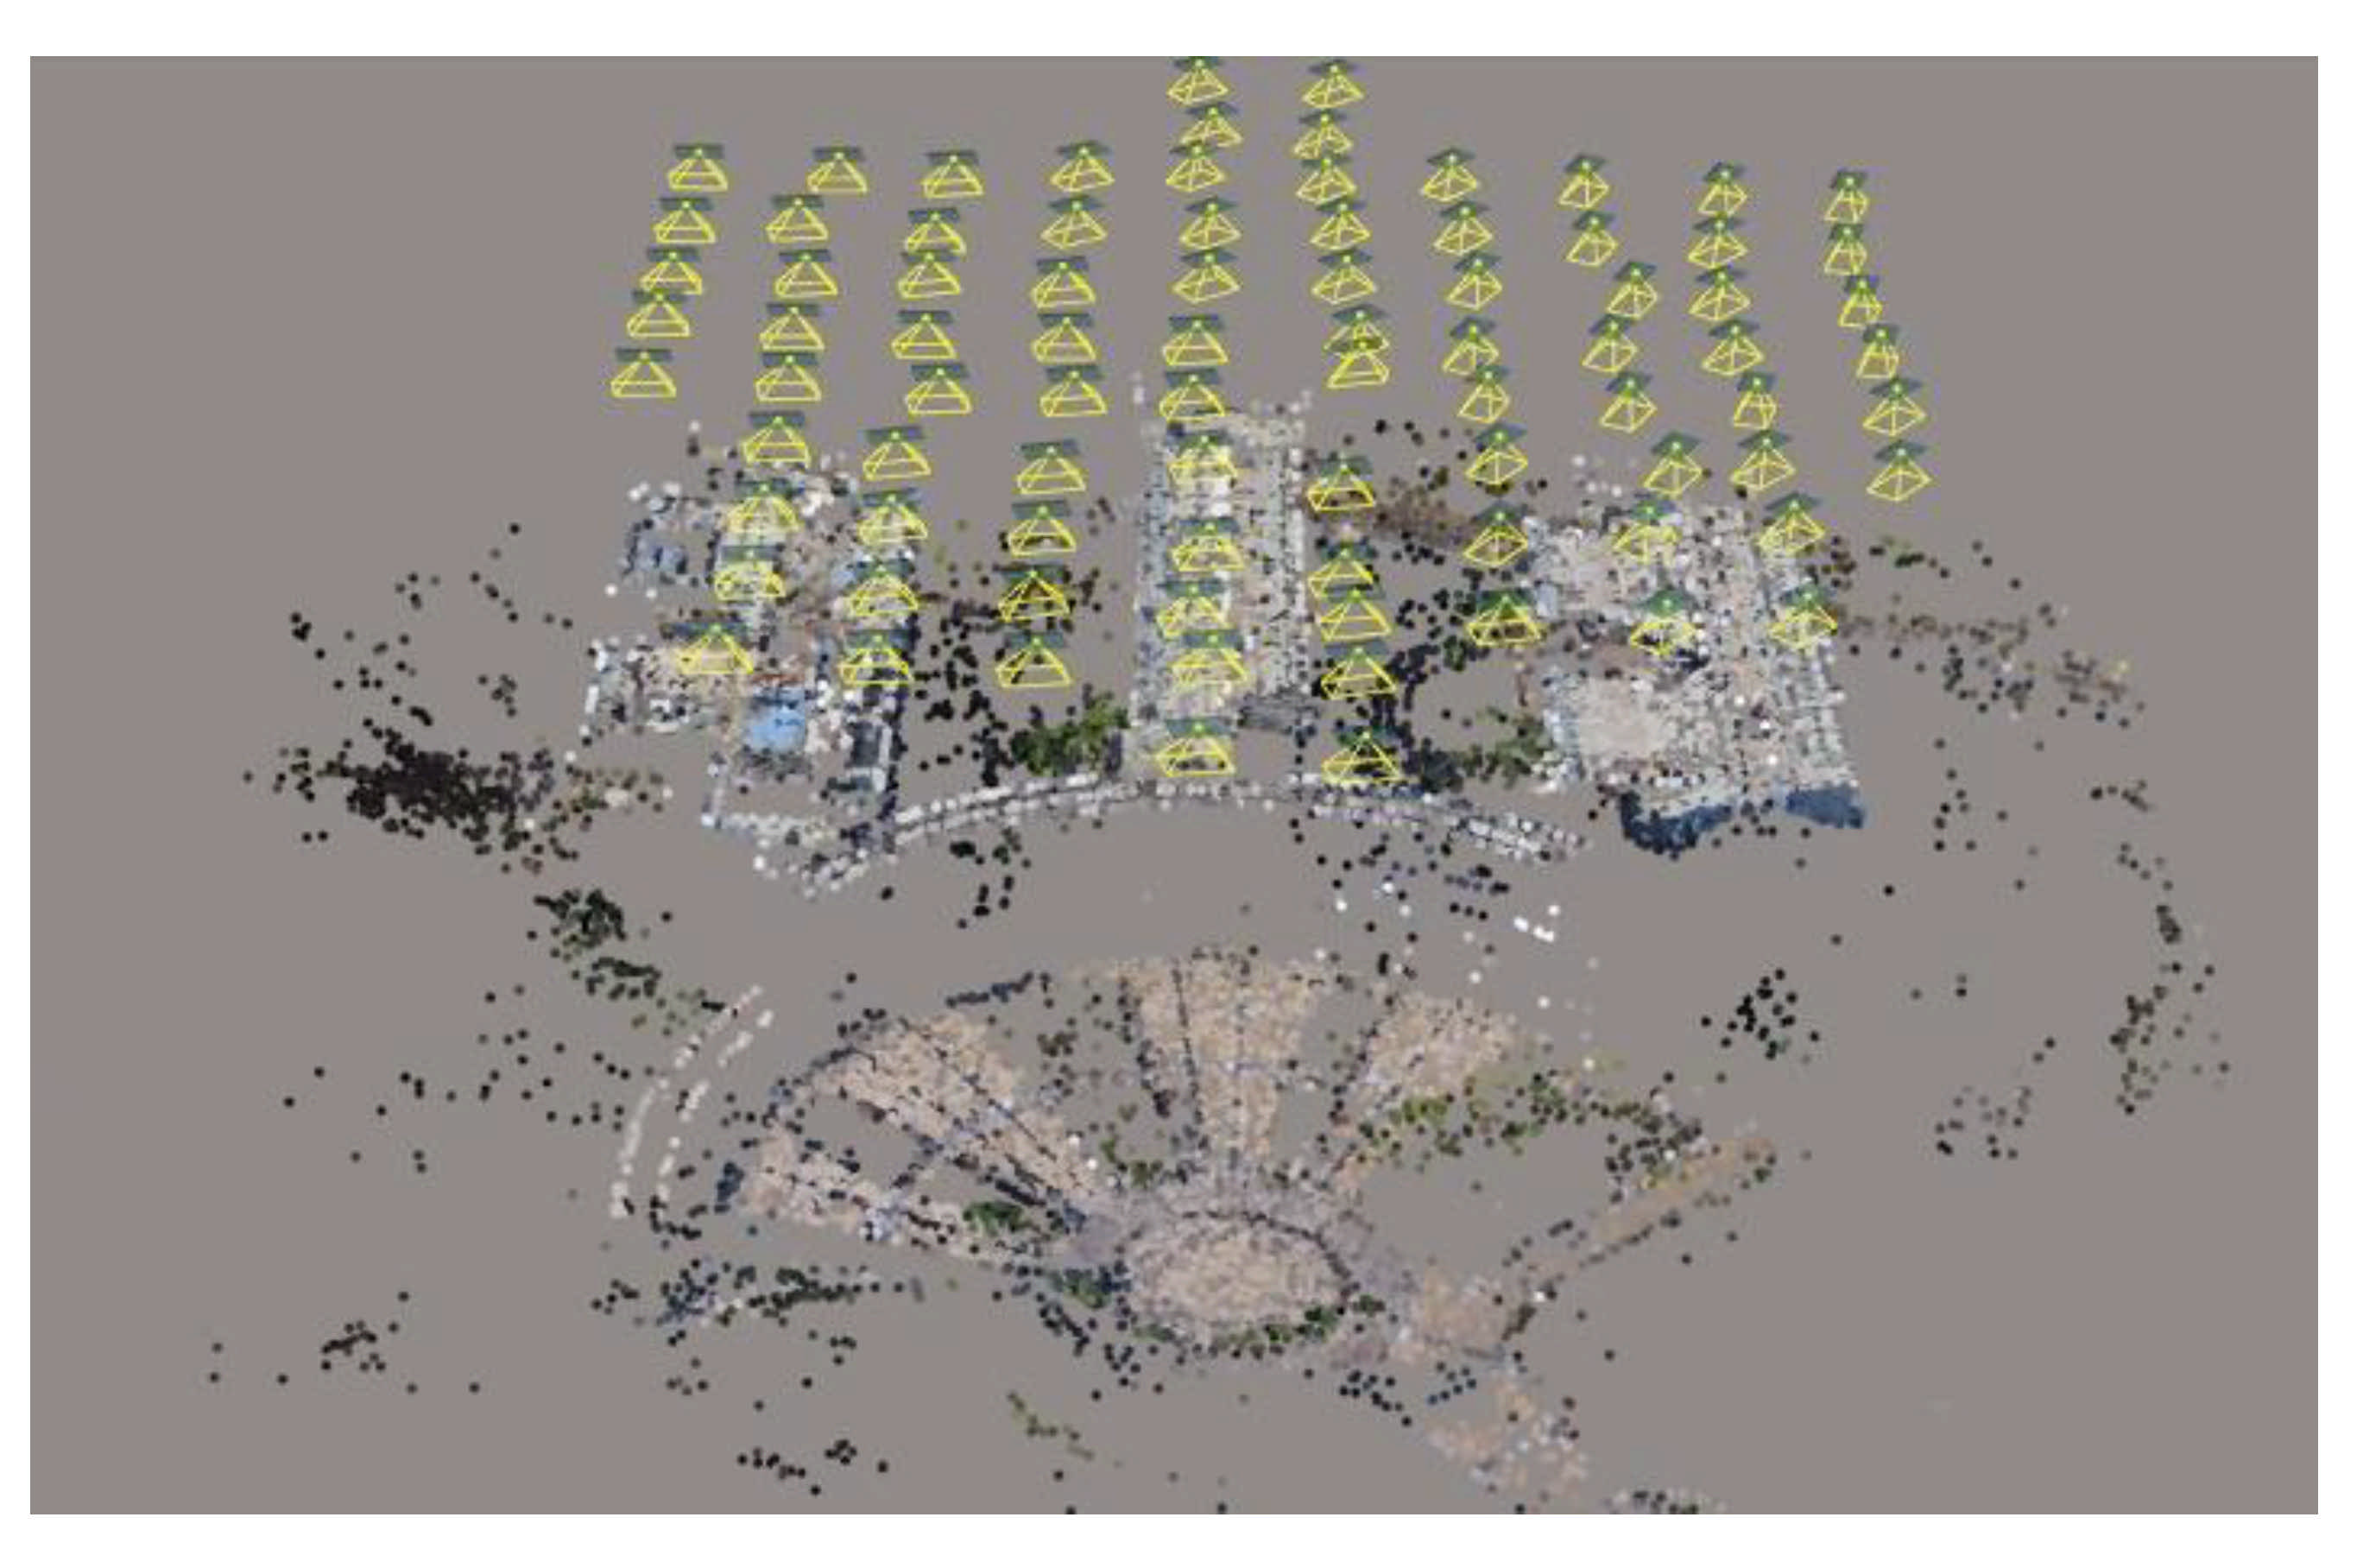
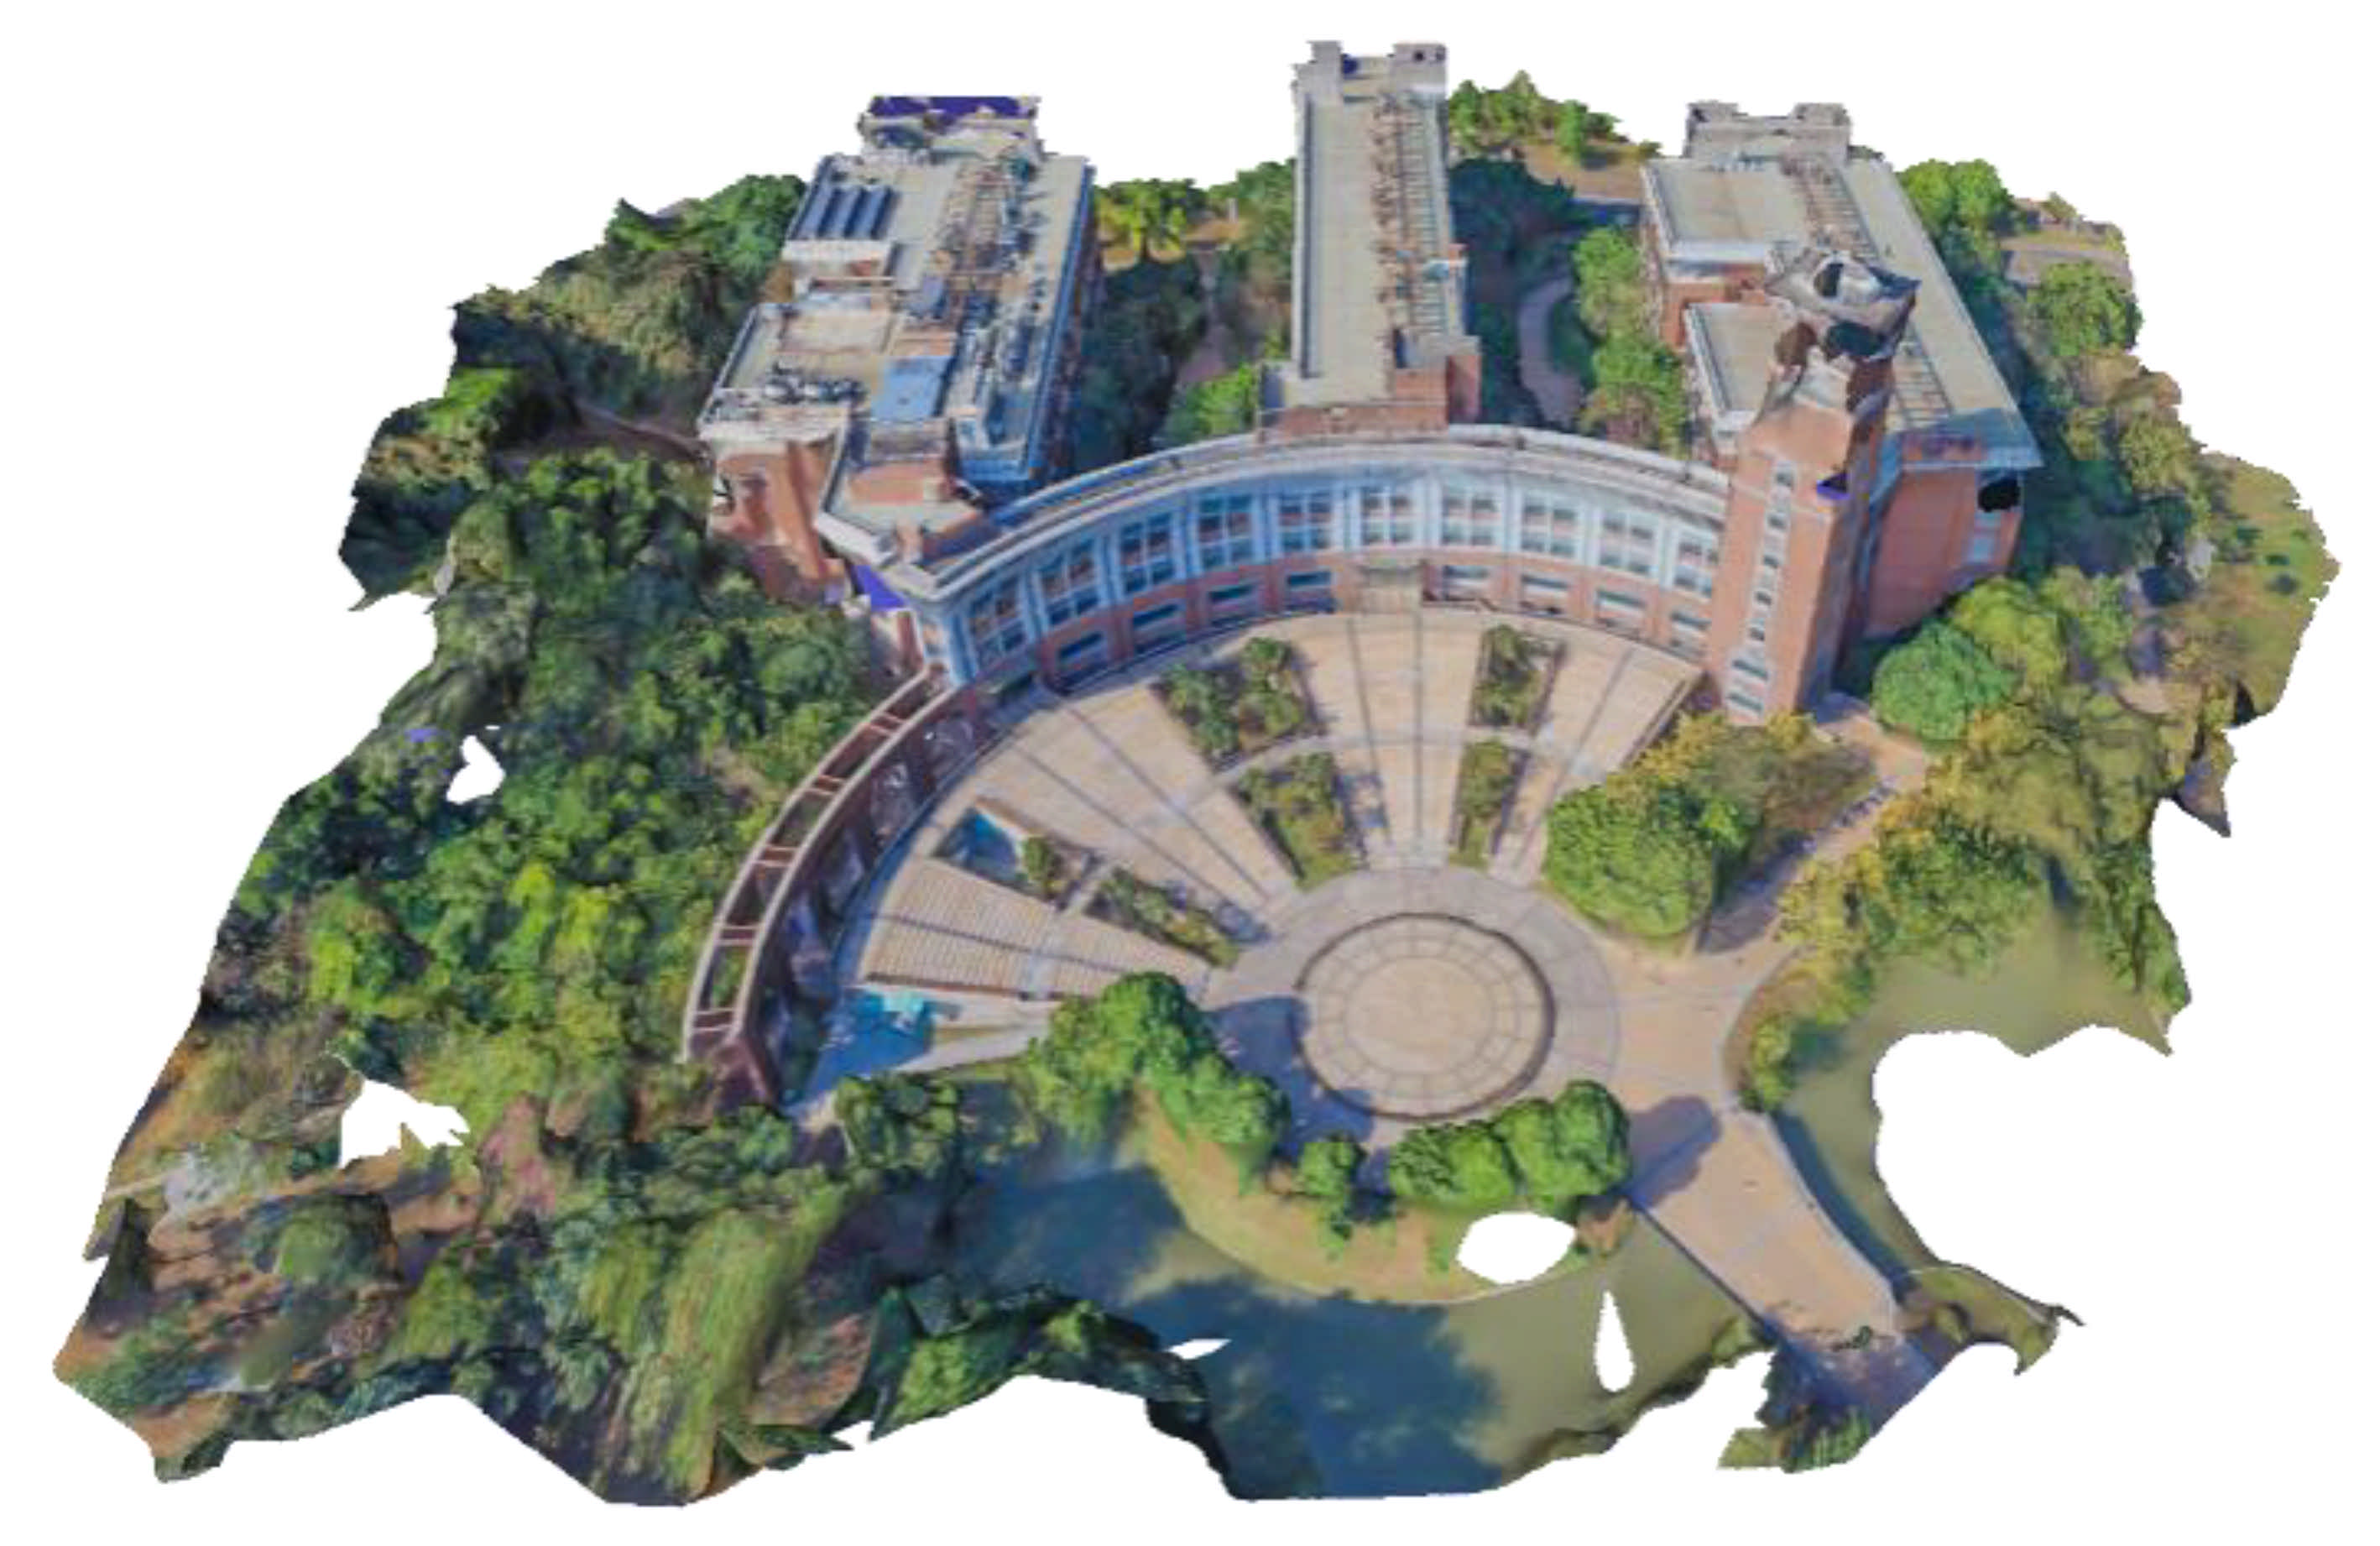
3.2.3. Reconstructed Model

The collected images were imported into Context Capture to generate the 3D model. The key points of the 3D reconstruction and locations where the photos were taken are shown in Figure 11. Although two image sets were separately obtained by two UAVs, they were inputted into the software together to generate an integrated model, which was acceptable because all the parameters and configurations of the UAVs and cameras were the same.
The final result of the reconstruction is illustrated in Figure 12. The majority part of the target area was successfully reconstructed, showing that the proposed system is useful for 3D terrain and building reconstruction. Several parts of the final result were broken because these parts are not contained in the target area, and they were reconstructed via boundary redundancies of the collected images. Therefore, these blank holes will not affect the final reconstructed result.

4. Conclusions and Future Work

In this research, a UAV CPP method for 3D reconstruction was developed. Several factors were considered, including the image overlap ratio, task allocation, near-optimized paths, and energy consumption. A map decomposition method was applied to ensure that the image sets can always meet the image overlap requirement, and an area division method was utilized to perform approximate task allocation. Subsequently, a probability-based algorithm SAA was used to find the near-optimized paths in different subareas. Finally, a site experiment was conducted to validate the proposed method. The experimental results show that our method can effectively shorten the path lengths of the image collection process without affecting the results of model reconstruction, which is of high practicability in outdoor environments where energy supplies are not available.
However, it is difficult for our system to outperform tasks in rugged terrain with many differences in slope and altitude at present. To expand the application scenarios of our method, altitude changes of different waypoints should be further considered. It is possible for this method to be applied in undulating territories if the image overlap ratio requirement is still met after leading into vertical changes. Our future work will incorporate vertical movement into the proposed method to explore complicated environments and terrains. Meanwhile, some realistic factors such as wind disturbance, communication loss will also be considered to enhance the system robustness.

Author Contributions

Conceptualization, S.X. and X.T.; methodology, S.X.; software, X.T.; validation, S.X. and J.W.; writing—original draft preparation, S.X.; writing—review and editing, J.W.; supervision, X.T. All authors have read and agreed to the published version of the manuscript.

Funding

This work was supported by the Key-Area Research and Development Program of Guangdong Province under Grant 2020B090921003 and Southern Marine Science and Engineering Guangdong Laboratory (Zhuhai) under Grant SML2020SP011.

Informed Consent Statement

Informed consent was obtained from all subjects involved in the study.

Conflicts of Interest

The authors declare no conflict of interest regarding the publication of this manuscript.

References

  1. Zhou, X.; Yi, Z.; Liu, Y.; Huang, K.; Huang, H. Survey on path and view planning for UAVs. Virtual Real. Intell. Hardw. 2020, 2, 56–69. [Google Scholar] [CrossRef]
  2. Gerke, M.; Kerle, N. Automatic Structural Seismic Damage Assessment with Airborne Oblique Pictometry© Imagery. Photogramm. Eng. Remote. Sens. 2011, 77, 885–898. [Google Scholar] [CrossRef]
  3. Carvajal-Ramírez, F.; Navarro-Ortega, A.D.; Aguera-Vega, F.; Martínez-Carricondo, P.; Mancini, F. Virtual reconstruc-tion of damaged archaeological sites based on unmanned aerial vehicle photogrammetry and 3d modelling. study case of a southeastern Iberia production area in the bronze age. Measurement 2019, 136, 225–236. [Google Scholar] [CrossRef]
  4. Gupta, L.; Jain, R.; Vaszkun, G. Survey of Important Issues in UAV Communication Networks. IEEE Commun. Surv. Tutor. 2016, 18, 1123–1152. [Google Scholar] [CrossRef] [Green Version]
  5. Galceran, E.; Carreras, M. A survey on coverage path planning for robotics. Robot. Auton. Syst. 2013, 61, 1258–1276. [Google Scholar] [CrossRef] [Green Version]
  6. Hayat, S.; Yanmaz, E.; Muzaffar, R. Survey on Unmanned Aerial Vehicle Networks for Civil Applications: A Communications Viewpoint. IEEE Commun. Surv. Tutor. 2016, 18, 2624–2661. [Google Scholar] [CrossRef]
  7. Bianco, S.; Ciocca, G.; Marelli, D. Evaluating the Performance of Structure from Motion Pipelines. J. Imaging 2018, 4, 98. [Google Scholar] [CrossRef] [Green Version]
  8. Huang, W. Optimal line-sweep-based decompositions for coverage algorithms. In Proceedings of the 2007 IEEE International Conference on Robotics and Automation, Seoul, Korea, 21–26 May 2001; pp. 27–32. [Google Scholar]
  9. Torres, M.; Pelta, D.A.; Verdegay, J.L.; Torres, J.C. Coverage path planning with unmanned aerial vehicles for 3D terrain reconstruction. Expert Syst. Appl. 2016, 55, 441–451. [Google Scholar] [CrossRef]
  10. Xie, J.; Carrillo, L.R.G.; Jin, L. Path Planning for UAV to Cover Multiple Separated Convex Polygonal Regions. IEEE Access 2020, 8, 51770–51785. [Google Scholar] [CrossRef]
  11. Khanam, Z.; Saha, S.; Ehsan, S.; Stolkin, R.; McDonald-Maier, K. Coverage Path Planning Techniques for Inspection of Disjoint Regions With Precedence Provision. IEEE Access 2021, 9, 5412–5427. [Google Scholar] [CrossRef]
  12. Guastella, D.C.; Cantelli, L.; Giammello, G.; Melita, C.D.; Spatino, G.; Muscato, G. Complete coverage path planning for aerial vehicle flocks deployed in outdoor environments. Comput. Electr. Eng. 2019, 75, 189–201. [Google Scholar] [CrossRef]
  13. Barrientos, A.; Colorado, J.; Del Cerro, J.; Martinez, A.; Rossi, C.; Sanz, D.; Valente, J. Aerial remote sensing in agriculture: A practical approach to area coverage and path planning for fleets of mini aerial robots. J. Field Robot. 2011, 28, 667–689. [Google Scholar] [CrossRef] [Green Version]
  14. Zheng, X.; Wang, F.; Xia, J.; Gong, X. The methodology of UAV route planning for efficient 3D reconstruction of building model. In Proceedings of the 2017 25th International Conference on Geoinformatics, Buffalo, NY, USA, 2–4 August 2017; pp. 1–4. [Google Scholar]
  15. Zheng, X.; Wang, F.; Li, Z. A multi-UAV cooperative route planning methodology for 3D fine-resolution building model reconstruction. ISPRS J. Photogramm. Remote. Sens. 2018, 146, 483–494. [Google Scholar] [CrossRef]
  16. Mansouri, S.S.; Kanellakis, C.; Fresk, E.; Kominiak, D.; Nikolakopoulos, G. Cooperative coverage path planning for visual inspection. Control. Eng. Pr. 2018, 74, 118–131. [Google Scholar] [CrossRef]
  17. Wang, H.; Li, H.; Zhang, C.; He, S.; Liu, J. A 3D coverage path planning approach for flying cameras in nature environment under photogrammetric constraints. In Proceedings of the 2017 36th Chinese Control Conference (CCC), Dailan, China, 26–28 July 2017; pp. 6761–6766. [Google Scholar]
  18. Lin, L.; Goodrich, M.A. Hierarchical Heuristic Search Using a Gaussian Mixture Model for UAV Coverage Planning. IEEE Trans. Cybern. 2014, 44, 2532–2544. [Google Scholar] [CrossRef] [PubMed]
  19. Huang, X.; Sun, M.; Zhou, H.; Liu, S. A Multi-Robot Coverage Path Planning Algorithm for the Environment With Multiple Land Cover Types. IEEE Access 2020, 8, 198101–198117. [Google Scholar] [CrossRef]
  20. Lienard, J.; Vogs, A.; Gatziolis, D.; Strigul, N. Embedded, real-time UAV control for improved, image-based 3d scene reconstruction. Measurement 2016, 81, 264–269. [Google Scholar] [CrossRef]
  21. Yang, C.-H.; Tsai, M.-H.; Kang, S.-C.; Hung, C.-Y. UAV path planning method for digital terrain model reconstruction—A debris fan example. Autom. Constr. 2018, 93, 214–230. [Google Scholar] [CrossRef]
  22. Samaniego, F.; Sanchis, J.; García-Nieto, S.; Simarro, R. Recursive Rewarding Modified Adaptive Cell Decomposition (RR-MACD): A Dynamic Path Planning Algorithm for UAVs. Electronics 2019, 8, 306. [Google Scholar] [CrossRef] [Green Version]
Figure 1. Grid map and target area.
Electronics 10 00853 g001
Figure 2. Two adjacent photography sites for a UAV (unmanned aerial vehicle).
Electronics 10 00853 g002
Figure 3. Scanning process of the target area. The red cell represents the take-off location.
Electronics 10 00853 g003
Figure 4. Results of scan-based area division and vertical area division.
Electronics 10 00853 g004
Figure 5. Flowchart of the proposed system.
Electronics 10 00853 g005
Figure 6. Formation control system.
Electronics 10 00853 g006
Figure 7. DJI Matrice 100 UAV platform.
Electronics 10 00853 g007
Figure 8. GPS map of the target area and the take-off location.
Electronics 10 00853 g008
Figure 9. Convergence processes and final results of the SAA paths.
Electronics 10 00853 g009
Figure 10. Previews and actual trails of the two paths.
Electronics 10 00853 g010
Figure 11. Key points and photography sites.
Electronics 10 00853 g011
Figure 12. Reconstructed result of the target area.
Electronics 10 00853 g012
Table 1. Parameters of the experiments.
ParametersValue
Number of UAVs2
Flight height (m)70
Field of view angle (°)98.7
Angle of inclination (°)90
Image overlap ratio80%
Cell side length (m)14
Initial temperature of the SAA (℃)500
Final temperature of the SAA (℃)10−4
Iteration times764
UAVs: unmanned aerial vehicles; SAA: simulated annealing algorithm.
Table 2. Path lengths of the experiments.
Path Planning MethodSAA MethodZigzag Method
Length of path 1 (m)857.31014.3
Length of path 2 (m)844.3932.9
Path length difference (m)13.081.4
Flight time of path 1 (s)311348
Flight time of path 2 (s)303324
Path 1 length reduction15.4%
Path 2 length reduction9.5%
Total length reduction12.6%
Time reduction of path 110.6%
Time reduction of path 26.5%
Total time reduction8.6%
Table 3. Path lengths of different parts.
Path Planning MethodSAA Method (m)Zigzag Method (m)
Length of forward path 1100.9112.9
Length of forward path 293.9115.4
Length of inner path 1655.5663.0
Length of inner path 2656.5591.3
Length of backward path 1100.9238.4
Length of backward path 293.9226.2
Publisher’s Note: MDPI stays neutral with regard to jurisdictional claims in published maps and institutional affiliations.

