
Semi-Automatic Guidance vs. Manual Guidance in Agriculture: A Comparison of Work Performance in Wheat Sowing

 ,
, 

 , and
, and
Abstract
1. Introduction
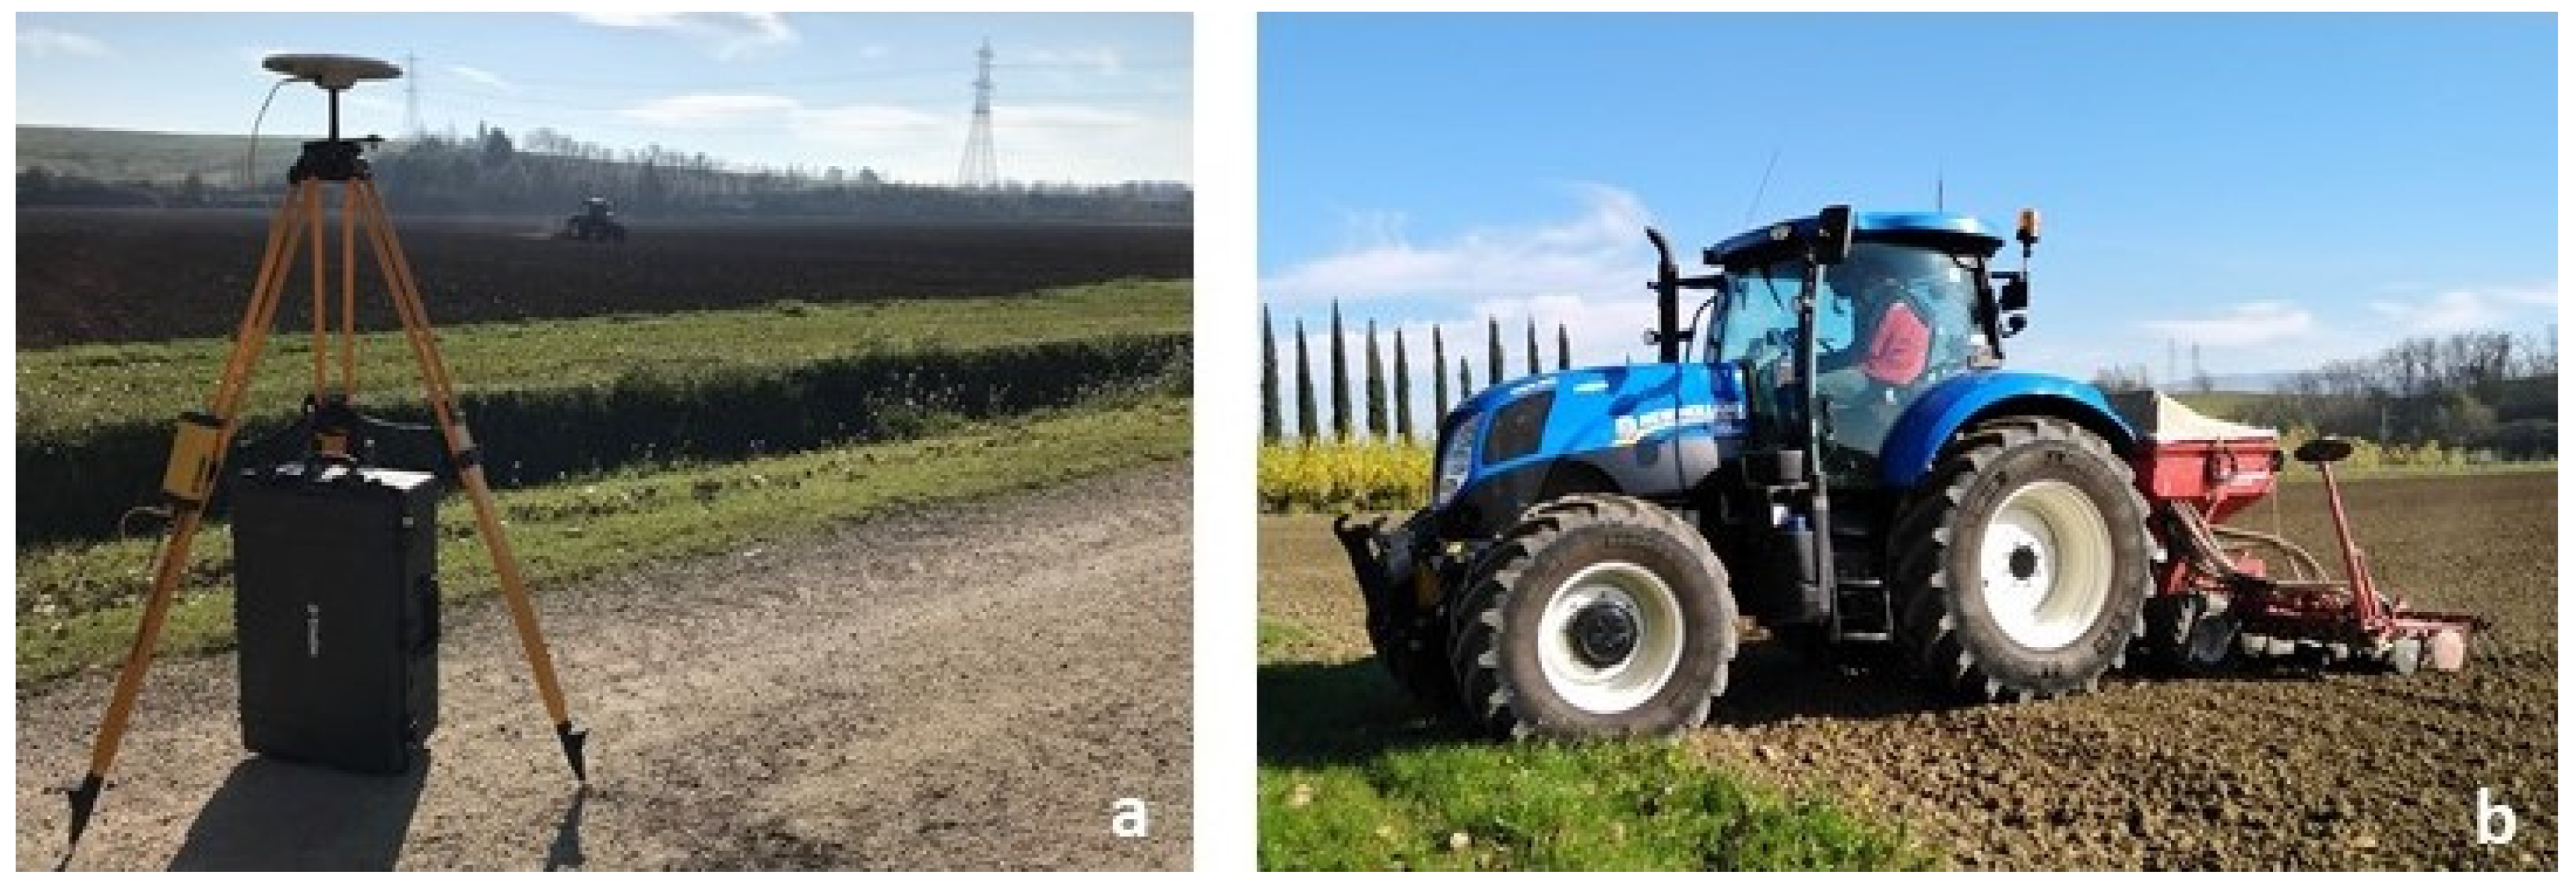
2. Materials and Methods
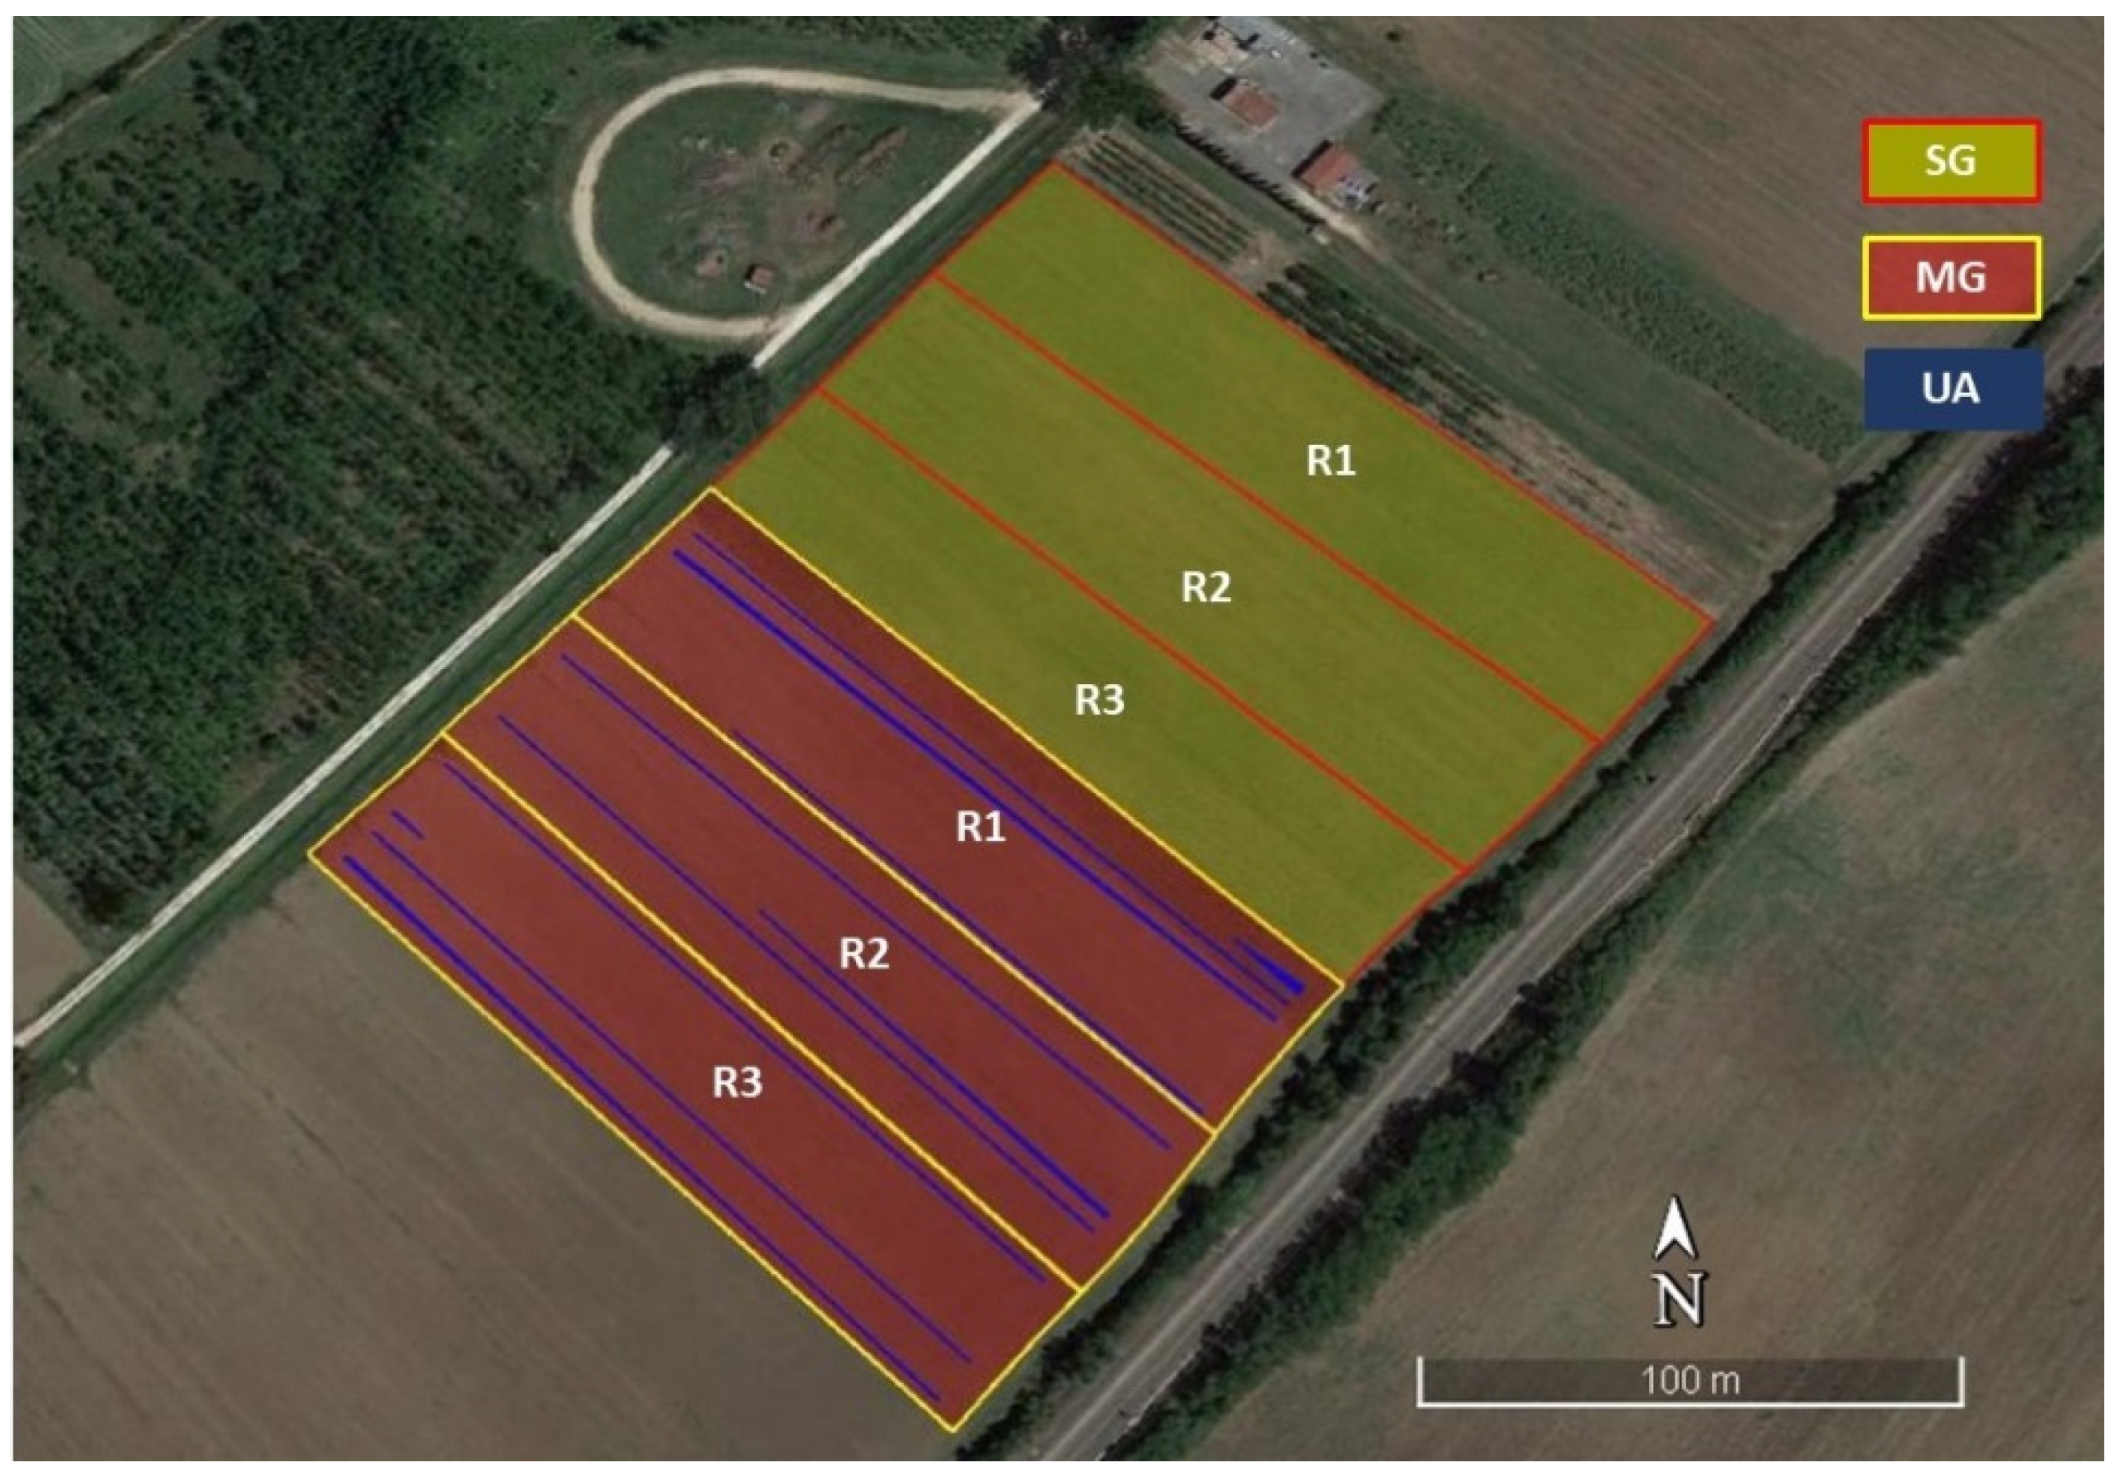
2.1. Experimental Design
2.2. Machine Setting
2.3. Evaluation of the Seed Utilized
2.4. Machine Performance
- -
- TFC: Working speed x working width;
- -
- EFC: Sown surface/overall working times
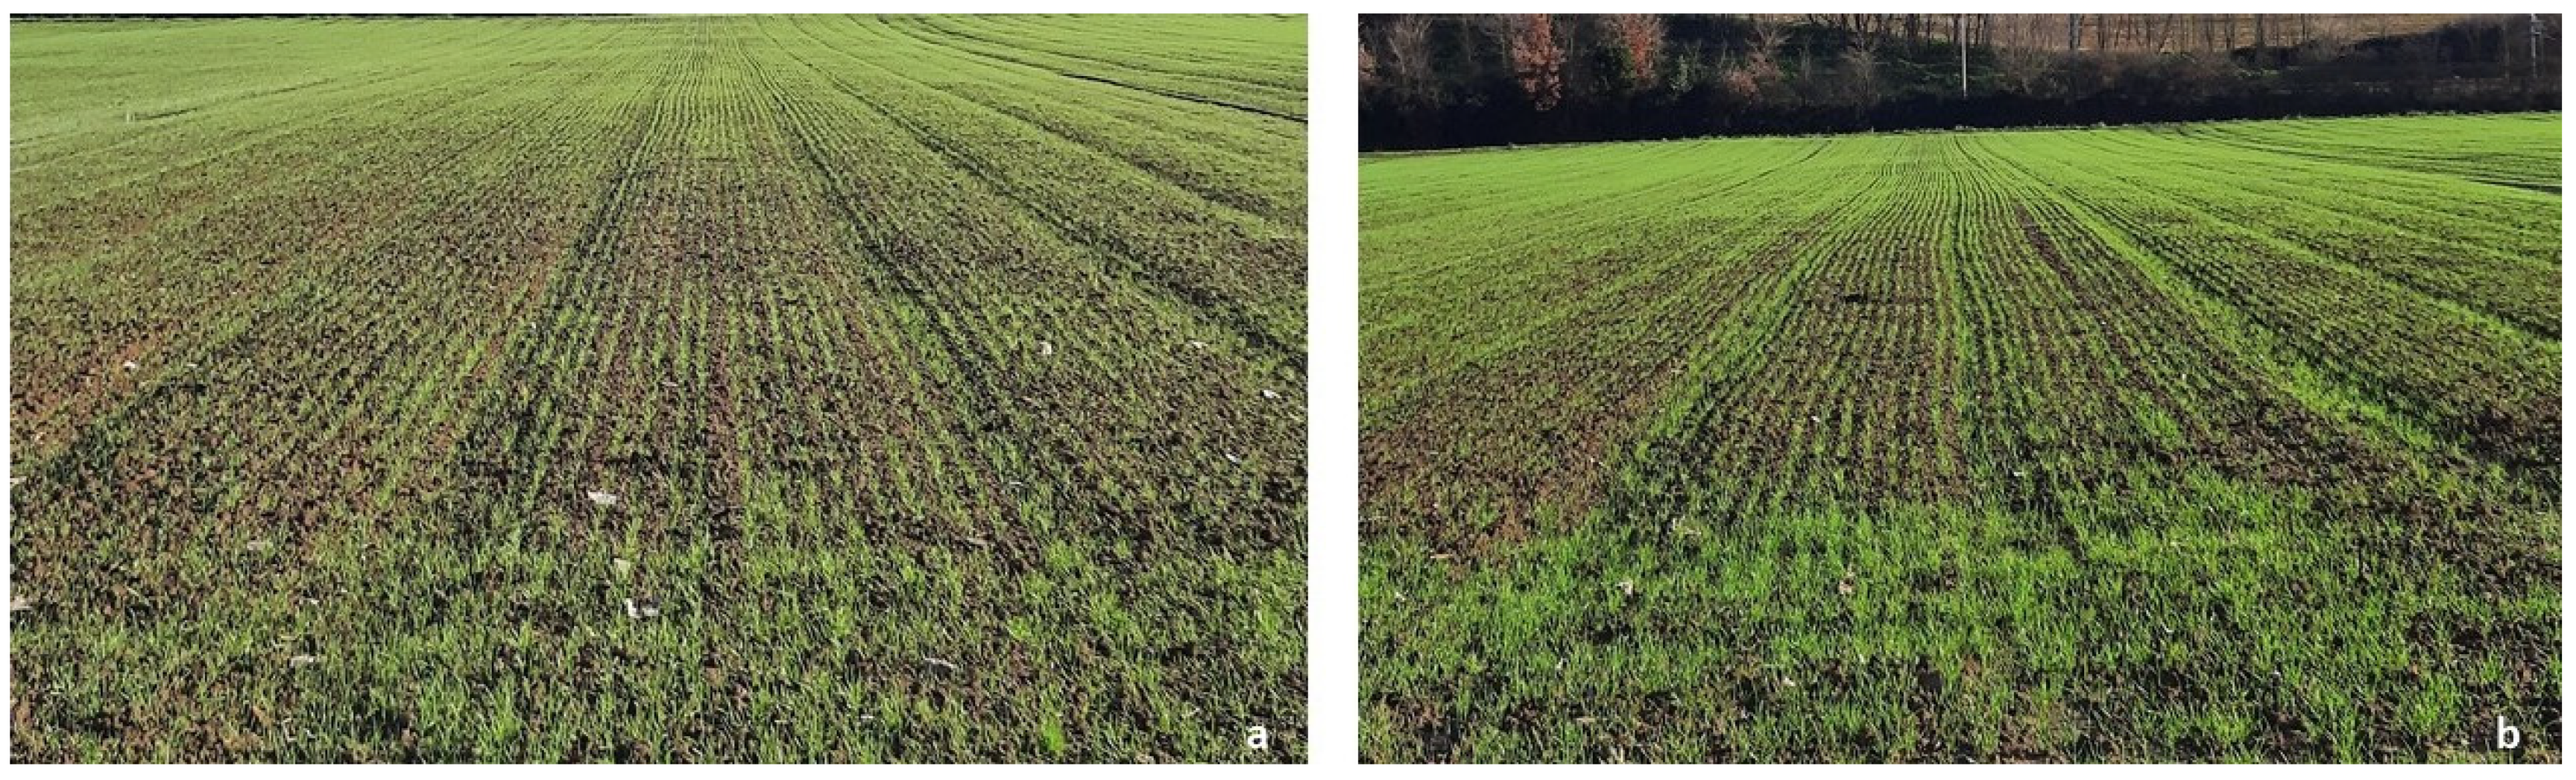
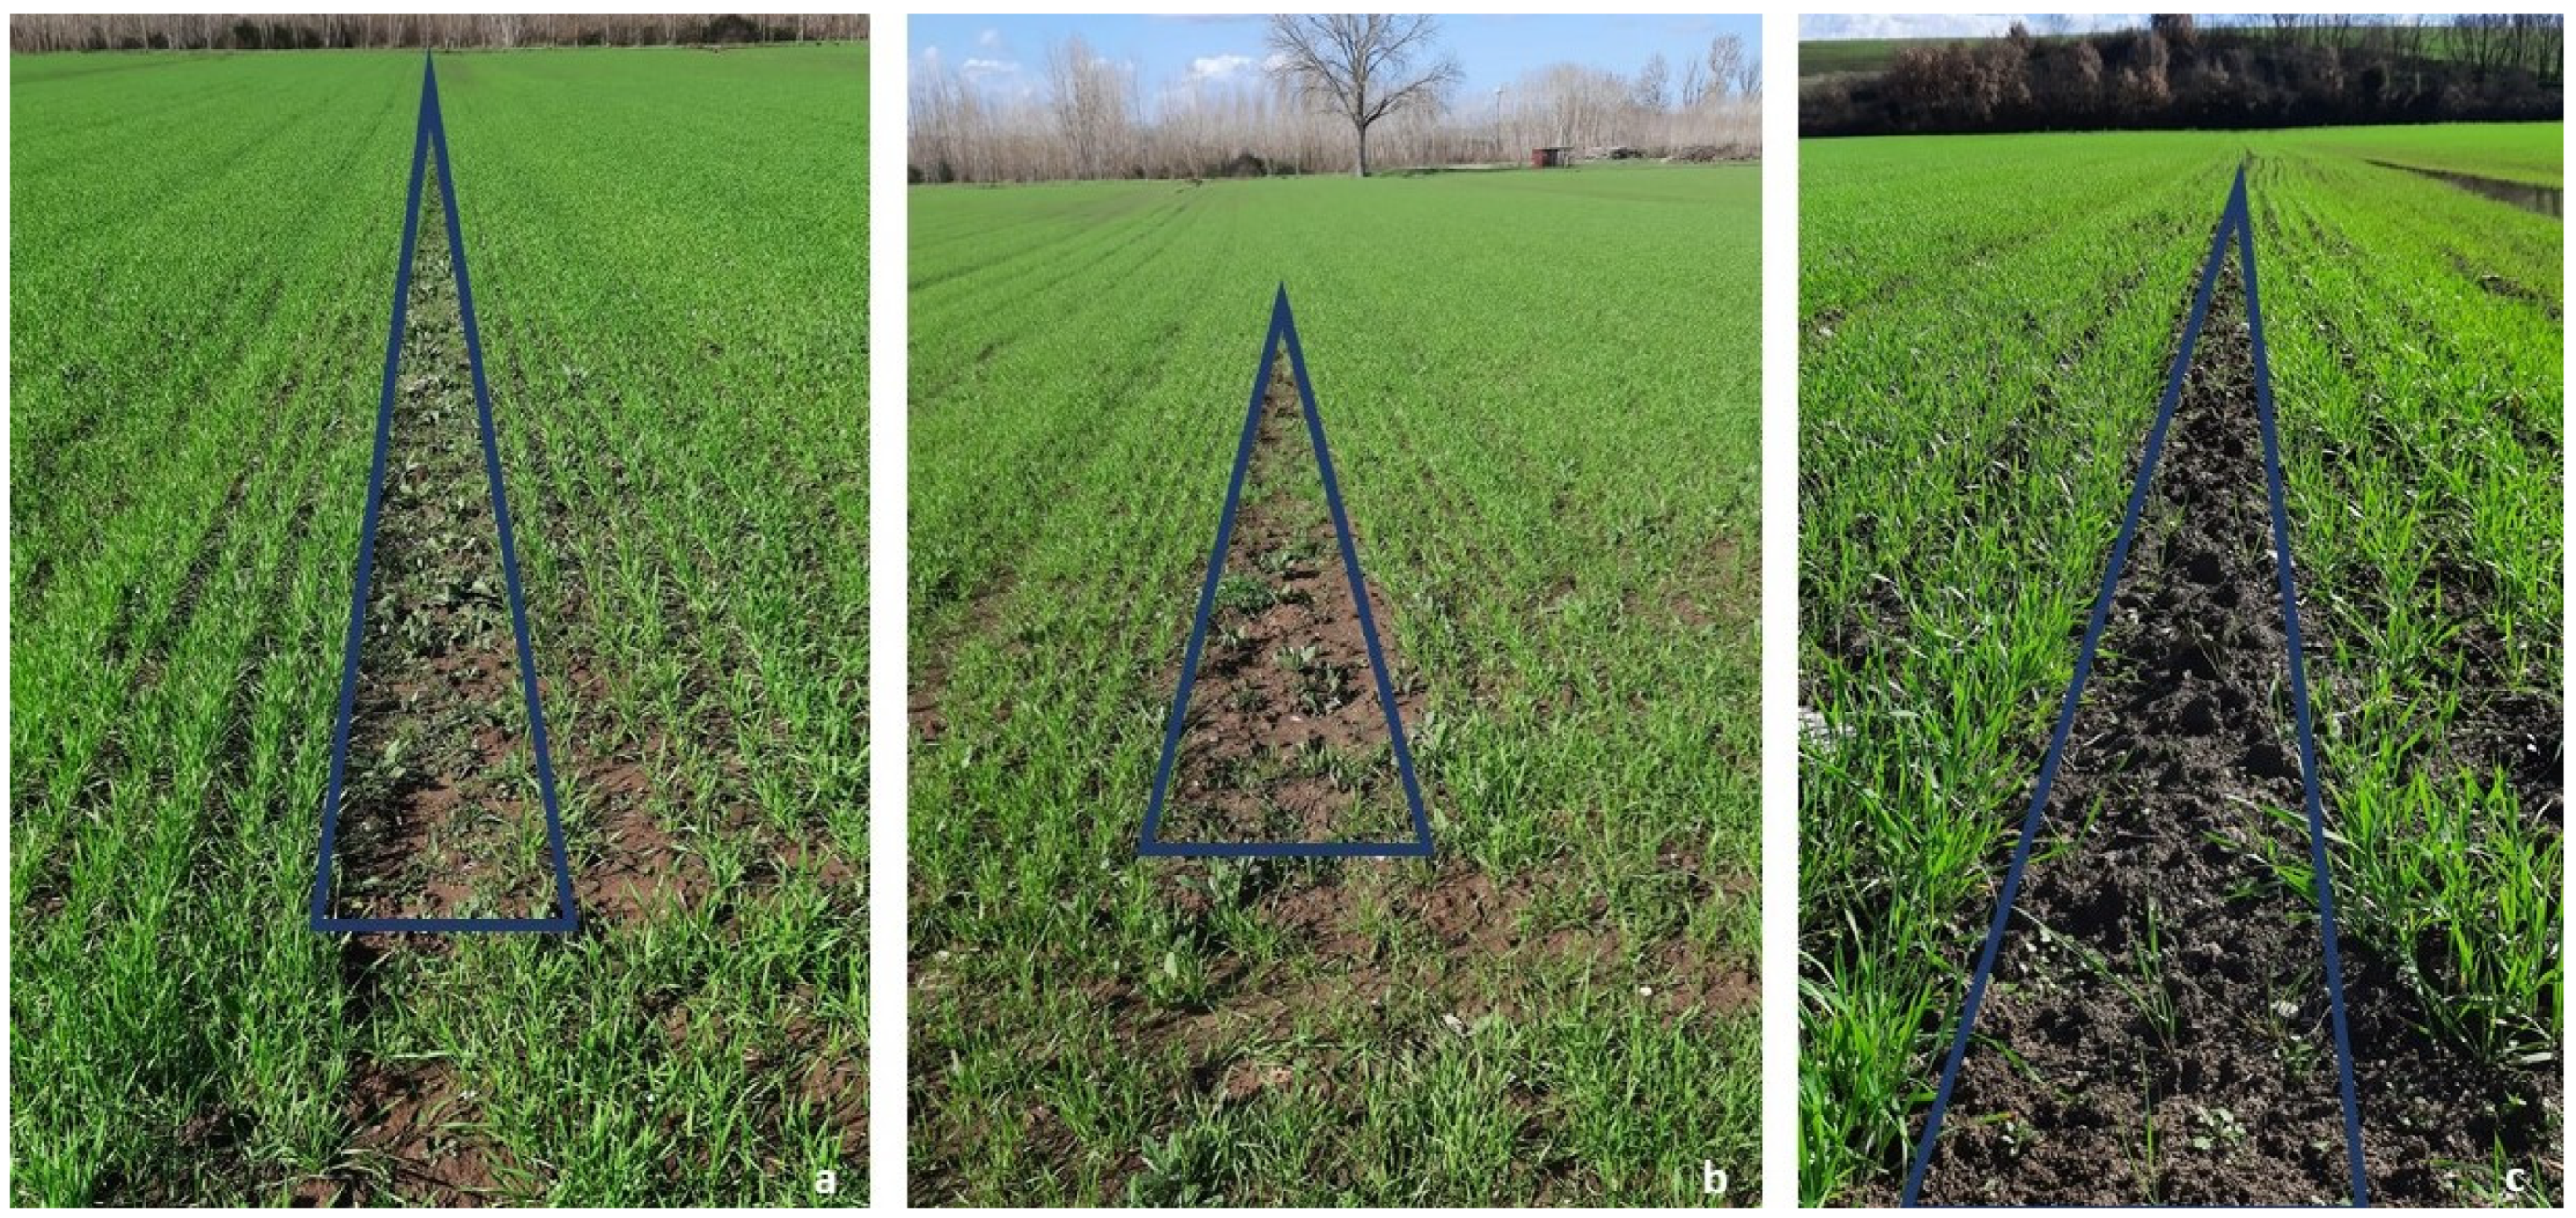
2.5. Work Quality
2.6. Economic Analysis
2.7. Statistical Analysis
3. Results
4. Discussion
5. Conclusions
Author Contributions
Funding
Conflicts of Interest
Appendix A

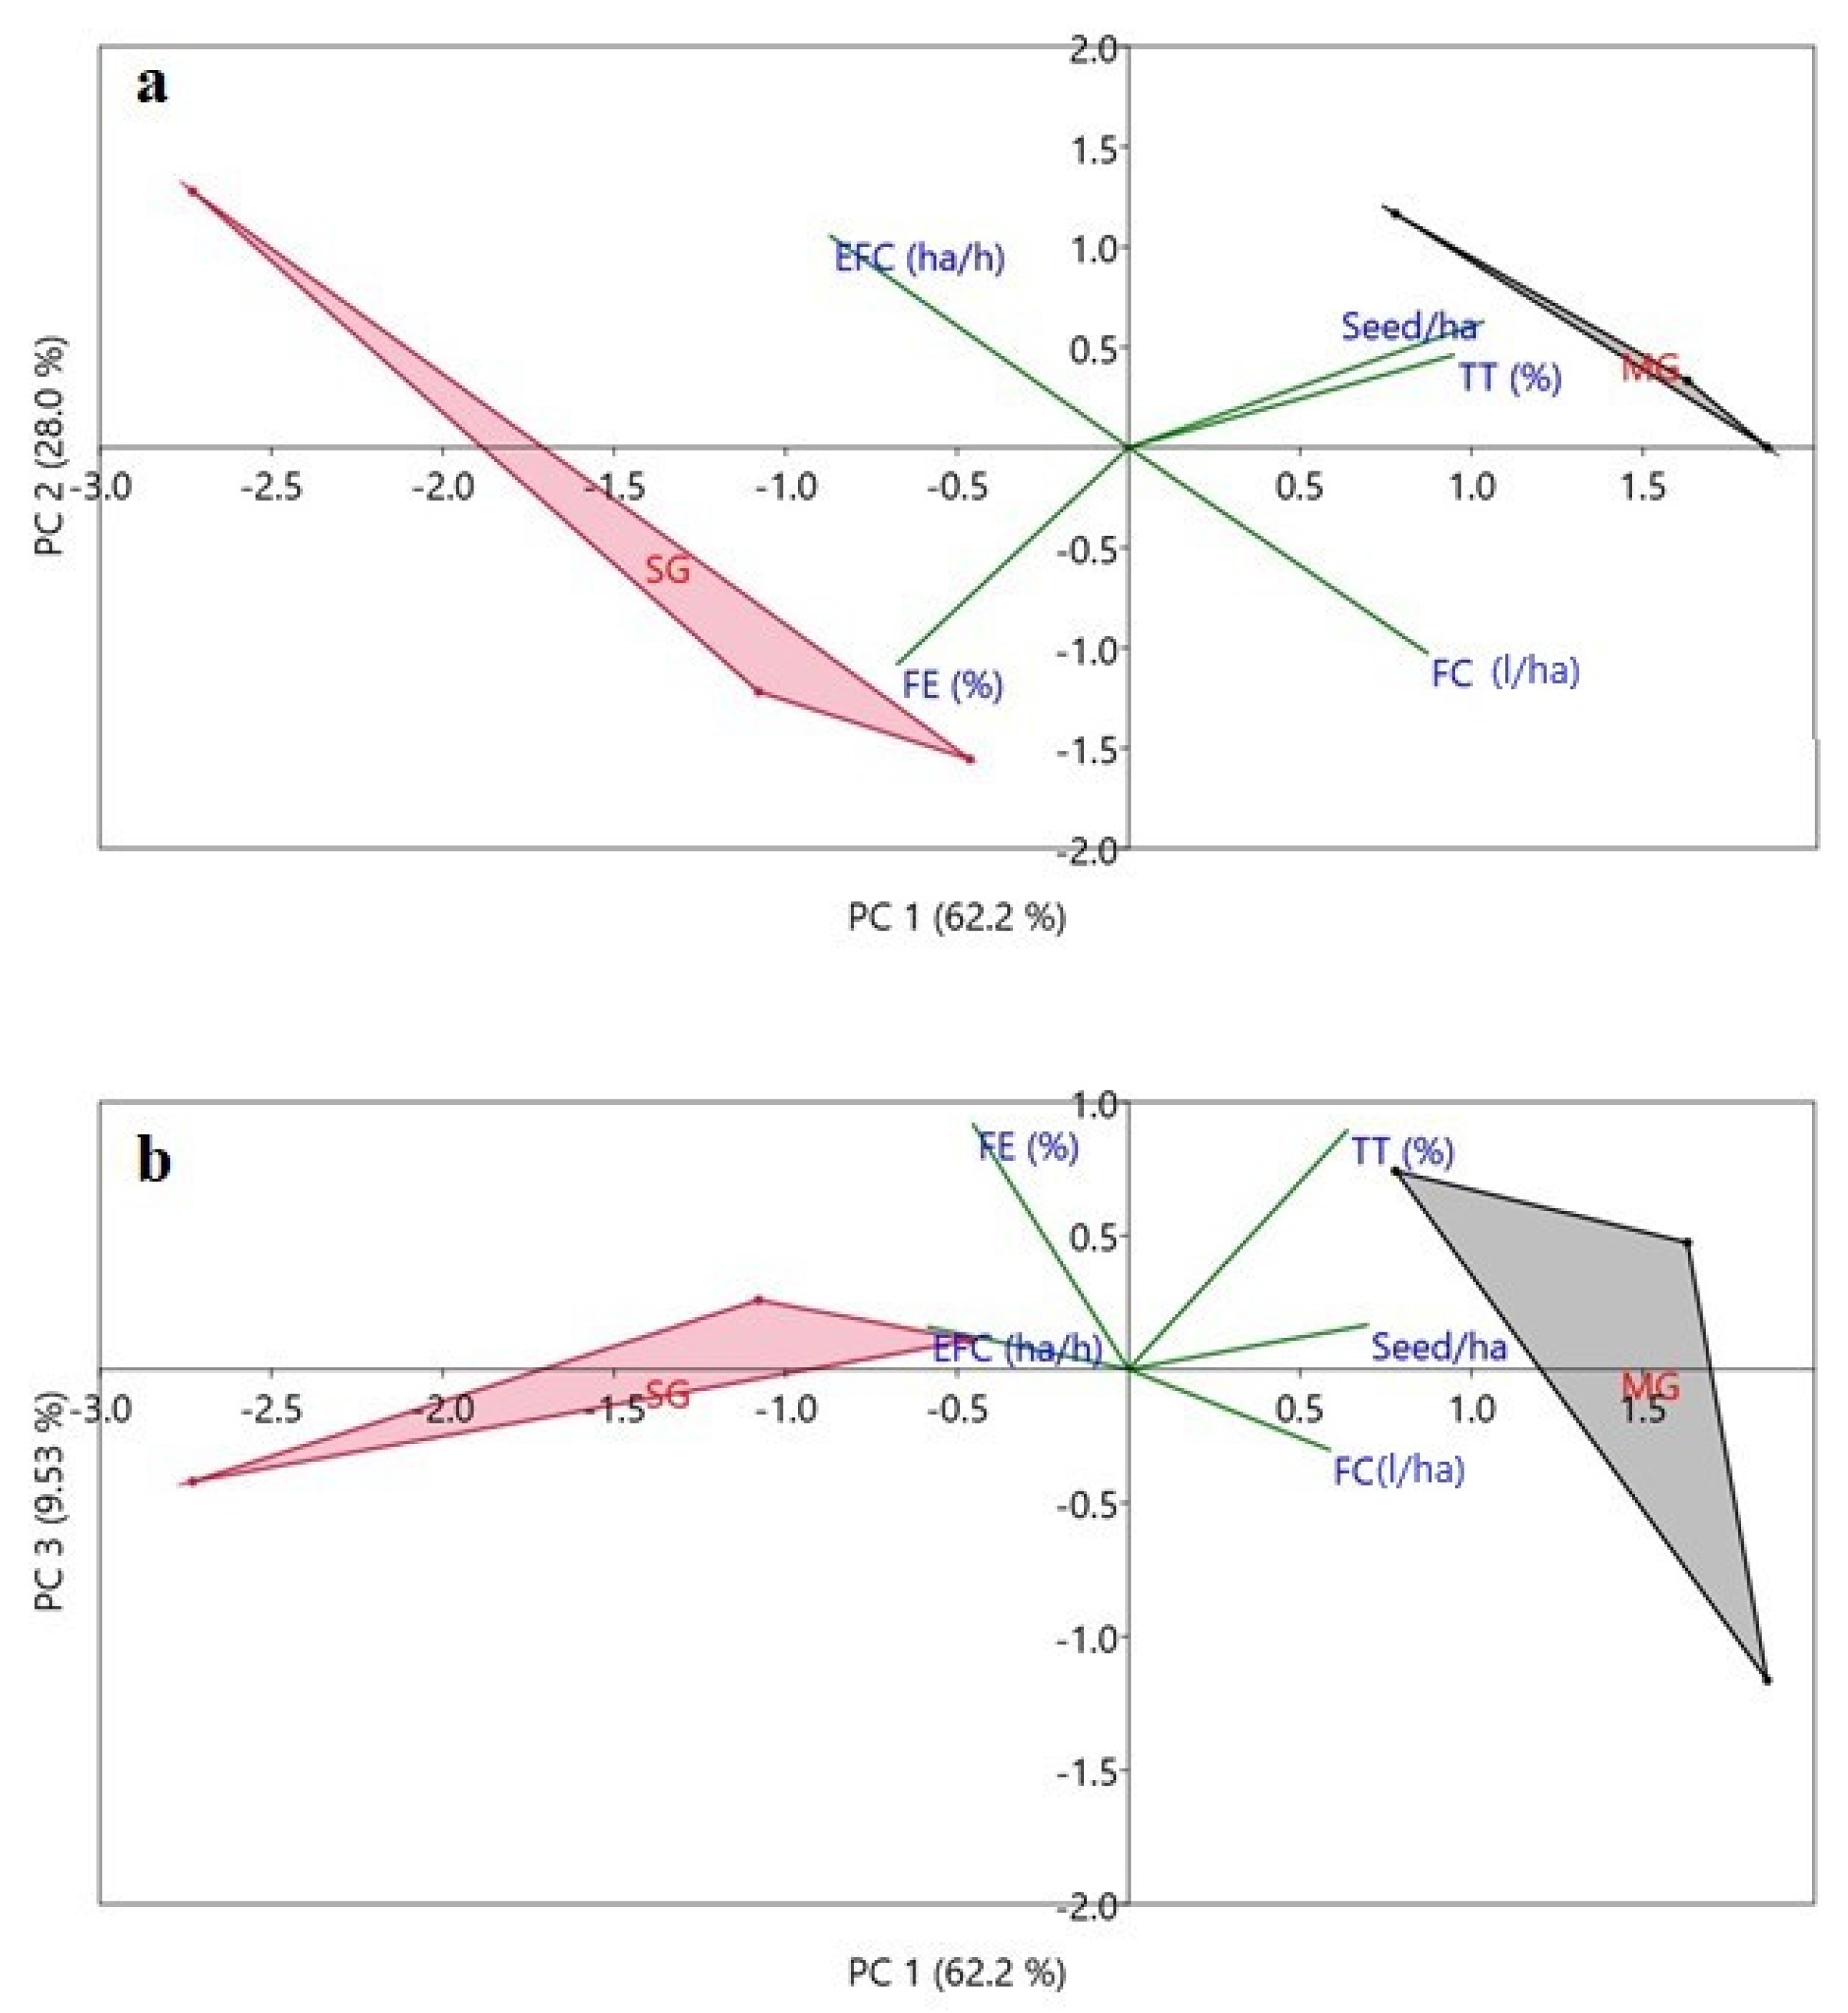
| PC 1 | PC 2 | PC 3 | PC 4 | PC 5 | |
|---|---|---|---|---|---|
| Seed ha−1 | 0.521 | 0.3160 | 0.1243 | 0.7661 | −0.1609 |
| FE (%) | −0.3400 | −0.5444 | 0.6868 | 0.3411 | −0.0152 |
| EFC (ha/h) | −0.4382 | 0.5313 | 0.1185 | 0.2038 | 0.6856 |
| TT (%) | 0.4772 | 0.2315 | 0.6693 | −0.4959 | 0.1573 |
| FC (L/ha) | 0.4393 | −0.5175 | −0.2255 | 0.09635 | 0.6921 |
References
- Balafoutis, A.; Beck, B.; Fountas, S.; Vangeyte, J.; Van der Wal, T.; Soto, I.; Gómez-Barbero, M.; Barnes, A.; Eory, V. Precision agriculture technologies positively contributing to GHG emissions mitigation, farm productivity and economics. Sustainability 2017, 9, 1339. [Google Scholar] [CrossRef]
- Kosior, K. Digital transformation in the agri-food sector–opportunities and challenges. Rocz 2018, 1230, 98–104. [Google Scholar] [CrossRef]
- Pérez, S.S.; López, J.M.G.; Jimenez Betancourt, R.O.; Villalvazo Laureano, E.; Solís, J.E.M.; Sánchez Cervantes, M.G.; Ochoa Guzmán, V.J. A Low-Cost Platform for Modeling and Controlling the Yaw Dynamics of an Agricultural Tractor to Gain Autonomy. Electronics 2020, 9, 1826. [Google Scholar] [CrossRef]
- Zarco-Tejada, P.J.; Hubbard, N.; Loudjani, P. Precision Agriculture: An Opportunity for EU Farmers—Potential Support with the CAP 2014–2020. 2014. Available online: https://www.europarl.europa.eu/RegData/etudes/note/join/2014/529049/IPOL-AGRI_NT%282014%29529049_EN (accessed on 14 March 2014).
- Le Campion, A.; Oury, F.-X.; Heumez, E.; Rolland, B. Conventional versus organic farming systems: Dissecting comparisons to improve cereal organic breeding strategies. Org. Agric. 2020, 10, 63–74. [Google Scholar] [CrossRef]
- Khan, A.; Ilyas, T.; Umraiz, M.; Mannan, Z.I.; Kim, H. Ced-net: Crops and weeds segmentation for smart farming using a small cascaded encoder-decoder architecture. Electronics 2020, 9, 1602. [Google Scholar] [CrossRef]
- Zhang, N.; Wang, M.; Wang, N. Precision agriculture—A worldwide overview. Comput. Electron. Agric. 2002, 36, 113–132. [Google Scholar] [CrossRef]
- Karimi, H.R. Offshore Mechatronics Systems Engineering; Group, T.F., Ed.; CRC Press: Boca Raton, FL, USA, 2018; ISBN 1351733923. [Google Scholar]
- Chen, J.-W.; Lin, W.-J.; Cheng, H.-J.; Hung, C.-L.; Lin, C.-Y.; Chen, S.-P. A Smartphone-Based Application for Scale Pest Detection Using Multiple-Object Detection Methods. Electronics 2021, 10, 372. [Google Scholar] [CrossRef]
- Khanna, M.; Epouhe, O.F.; Hornbaker, R. Site-specific crop management: Adoption patterns and incentives. Appl. Econ. Perspect. Policy 1999, 21, 455–472. [Google Scholar] [CrossRef]
- Griffin, T.W.; Lambert, D.M.; Lowenberg-DeBoer, J.M. Testing appropriate on-farm trial designs and statistical methods for precision farming: A simulation approach. In Proceedings of the 7th International Conference on Precision Agriculture and Other Precision Resources Management, Minneapolis, MN, USA, 25–28 July 2004; pp. 1733–1748. [Google Scholar]
- Reichardt, M.; Jürgens, C. Adoption and future perspective of precision farming in Germany: Results of several surveys among different agricultural target groups. Precis. Agric. 2009, 10, 73–94. [Google Scholar] [CrossRef]
- Robertson, M.J.; Llewellyn, R.S.; Mandel, R.; Lawes, R.; Bramley, R.G.V.; Swift, L.; Metz, N.; O’Callaghan, C. Adoption of variable rate fertiliser application in the Australian grains industry: Status, issues and prospects. Precis. Agric. 2012, 13, 181–199. [Google Scholar] [CrossRef]
- Picchio, R.; Latterini, F.; Mederski, P.S.; Venanzi, R.; Karaszewski, Z.; Bembenek, M.; Croce, M. Comparing Accuracy of Three Methods Based on the GIS Environment for Determining Winching Areas. Electronics 2019, 8, 53. [Google Scholar] [CrossRef]
- Picchio, R.; Proto, A.R.; Civitarese, V.; Di Marzio, N.; Latterini, F. Recent Contributions of Some Fields of the Electronics in Development of Forest Operations Technologies. Electronics 2019, 8, 1465. [Google Scholar] [CrossRef]
- Shockley, J.; Dillon, C.R.; Stombaugh, T.; Shearer, S. Whole farm analysis of automatic section control for agricultural machinery. Precis. Agric. 2012, 13, 411–420. [Google Scholar] [CrossRef]
- EUROSTAT. Agriculture, Forestry and Fishery Statistics. Publications Office of the European Union. 2016. Available online: https://ec.europa.eu/eurostat/documents/3217494/7777899/KS-FK-16-001-EN-N.pdf/cae3c56f-53e2-404a-9e9e-fb5f57ab49e3 (accessed on 20 November 2020).
- Lowenberg-DeBoer, J.; Erickson, B. Setting the record straight on precision agriculture adoption. Agron. J. 2019, 111, 1552–1569. [Google Scholar] [CrossRef]
- Prasetyo, Y.; Apriliyadi, E.; Hidajat, E.; Novianti, F. Resistance to innovation: Case of appropriate technology implementation in rural agriculture communities. Available SSRN 2101656 2009. [Google Scholar] [CrossRef]
- Griepentrog, H.W. Eine neue Erfolgsformel? Smart Farming soll die nächste Generation von Precision Farming warden. DLG-Mitteilungen 2011, 126, 12–16. [Google Scholar]
- Kharel, T.P.; Ashworth, A.J.; Shew, A.; Popp, M.P.; Owens, P.R. Tractor guidance improves production efficiency by reducing overlaps and gaps. Agric. Environ. Lett. 2020, 5, e20012. [Google Scholar] [CrossRef]
- Kirtan, J.; Aalap, D.; Poojan, P.; Manan, S. A comprehensive review on automation in agriculture using artificial intelligence. Artif. Int. Agric. 2019, 2, 1–12. [Google Scholar] [CrossRef]
- Keicher, R.; Seufert, H. Automatic guidance for agricultural vehicles in Europe. Comput. Electron. Agric. 2000, 25, 169–194. [Google Scholar] [CrossRef]
- Alonso-Garcia, S.; Gil, J.G.; Arribas, J.I. Evaluation of the use of low-cost GPS receivers in the autonomous guidance of agricultural tractors. Spanish J. Agric. Res. 2011, 377–388. [Google Scholar] [CrossRef]
- Catania, P.; Comparetti, A.; Febo, P.; Morello, G.; Orlando, S.; Roma, E.; Vallone, M. Positioning accuracy comparison of GNSS receivers used for mapping and guidance of agricultural machines. Agronomy 2020, 10, 924. [Google Scholar] [CrossRef]
- Romano, E.; Bisaglia, C.; Calcante, A.; Oberti, R.; Zani, A.; Vinnikov, D.; Marconi, A.; Vitale, E.; Bracci, M.; Rapisarda, V. Assessment of comfort variation among different types of driving agricultural tractors: Traditional, satellite-assisted and semi-automatic. Int. J. Environ. Res. Public Health 2020, 17, 8836. [Google Scholar] [CrossRef]
- Karimi, D.; Henry, J.; Mann, D.D. Effect of using GPS autosteer guidance systems on the eye-glance behavior and posture of tractor operators. J. Agric. Saf. Health 2012, 18, 309–318. [Google Scholar] [CrossRef]
- Heege, H.J. Precision in Crop Farming: Site Specific Concepts and Sensing Methods: Applications and Results; Springer Science & Business Media: Dordrecht, The Netherlands, 2013; ISBN 9400767609. [Google Scholar]
- Ortiz, B.V.; Balkcom, K.B.; Duzy, L.; Van Santen, E.; Hartzog, D.L. Evaluation of agronomic and economic benefits of using RTK-GPS-based auto-steer guidance systems for peanut digging operations. Precis. Agric. 2013, 14, 357–375. [Google Scholar] [CrossRef]
- Knight, S.; Miller, P.; Orson, J. An up-to-date cost/benefit analysis of precision farming techniques to guide growers of cereals and oilseeds. HGCA Res. Rev. 2009, 71, 115. [Google Scholar]
- Stempfhuber, W.; Buchholz, M. A precise, low-cost RTK GNSS system for UAV applications. Proc. Unmanned Aer. Veh. Geomatics ISPRS 2011, XXXVIII-1, 289–293. [Google Scholar] [CrossRef]
- Reith, S.; Frisch, J.; Winkler, B. Revision of the working time classification to optimize work processes in modern agriculture. Chem. Eng. Trans. 2017, 58, 121–126. [Google Scholar] [CrossRef]
- Suardi, A.; Latterini, F.; Alfano, V.; Palmieri, N.; Bergonzoli, S.; Karampinis, E.; Kougioumtzis, M.A.; Grammelis, P.; Pari, L. Machine Performance and Hog Fuel Quality Evaluation in Olive Tree Pruning Harvesting Conducted Using a Towed Shredder on Flat and Hilly Fields. Energies 2020, 13, 1713. [Google Scholar] [CrossRef]
- Grisso, R.D.; Kocher, M.F.; Vaughan, D.H. Predicting tractor fuel consumption. Appl. Eng. Agric. 2004, 20, 553. [Google Scholar] [CrossRef]
- Stefanoni, W.; Latterini, F.; Ruiz, J.P.; Bergonzoli, S.; Palmieri, N.; Pari, L. Assessing the Camelina (Camelina sativa (L.) Crantz) Seed Harvesting Using a Combine Harvester: A Case-Study on the Assessment of Work Performance and Seed Loss. Sustainability 2021, 13, 195. [Google Scholar] [CrossRef]
- Assosementi – Associazione Italiana Sementi. 2020. Available online: http://www.sementi.it/seme-certificato-cereali (accessed on 20 November 2020).
- Hammer, Ø.; Harper, D.A.T.; Ryan, P.D. Paleontological statistics software package for education and data analysis. Paleontologia Electronica 2001, 4, 1–9. [Google Scholar]
- Radicioni, F.; Stoppini, A.; Brigante, R.; Brozzi, A.; Tosi, G. GNSS Network RTK for Automatic Guidance in Agriculture: Testing and Performance Evaluation. In Proceedings of the Computational Science and Its Applications (ICCSA 2020), Cagliari, Italy, 1–4 July 2020; pp. 19–35. [Google Scholar]
- Griffin, T.; Lambert, D.; Lowenberg-DeBoer, J. Economics of lightbar and auto-guidance GPS navigation technologies. Precis. Agric. 2005, 5, 581–587. [Google Scholar]
- Rodias, E.; Berruto, R.; Busato, P.; Bochtis, D.; Sørensen, C.G.; Zhou, K. Energy savings from optimised in-field route planning for agricultural machinery. Sustainability 2017, 9, 1956. [Google Scholar] [CrossRef]


| Seeder Kneverland Mod. DL | Tractor NH—T7 Autocommand with Satellite Guidance and RTK Base Station | Tractor NH—T7 Autocommand without Satellite Guidance | |||
|---|---|---|---|---|---|
| Financial costs | Investment | € | 15,200 | 130,000 | 92,000 |
| Service life | year | 10 | 10 | 10 | |
| Service life | h | 4800 | 10,000 | 10,000 | |
| inflation | 1.12 | 1.12 | 1.12 | ||
| Resale | % | 17.7 | 29.5 | 29.5 | |
| Resale | € | 2688.0 | 43,149.6 | 30,536.6 | |
| Depreciation | € | 12,512.0 | 86,850.4 | 61,463.4 | |
| Annual usage | h/year | 100 | 1000 | 1000 | |
| Interest rate | % | 3.0 | 3.0 | 3.0 | |
| Fixed costs | Ownership costs | €/year | 1251.2 | 6685 | 6146.3 |
| Interests | €/year | 268.3 | 2597.2 | 1838.0 | |
| Machine shelter | m2 | 12.0 | 12.72 | 12.72 | |
| Value of the shelter | €/m2 | 100.0 | 100.0 | 100.0 | |
| Value of the shelter | €/year | 24.00 | 25.44 | 25.44 | |
| Insurance | €/year | 38.0 | 325.0 | 230.0 | |
| miscellaneous expenses | €/year | 62 | 350 | 255 | |
| Variable costs | Repair factor | % | 40 | 80 | 80 |
| Repairs and maintenance | €/h | 0.26 | 10.4 | 7.36 | |
| Fuel unit cost | €/l | 0.57 | 0.574 | 0.57 | |
| Fuel consumption | l/h | 6.18 | 6.18 | ||
| Fuel cost | €/h | 0.00 | 3.55 | 3.55 | |
| Lubricant unit cost | €/l | 0.00 | 3.03 | 3.03 | |
| Lubricant consumption | l/h | 0.00 | 0.10 | 0.10 | |
| Lubricant cost | €/h | 0.00 | 0.31 | 0.31 | |
| Number of workers | n° | 1 | 1 | ||
| Salary for worker | €/h | 11.5 | 11.5 |
| Semi-Automatic Guidance | Manual Guidance | ||||||||||
|---|---|---|---|---|---|---|---|---|---|---|---|
| Replicate | Unit | R1 | R2 | R3 | Tot. | Mean ± St.dev. | R1 | R2 | R3 | Tot. | Mean ± St.dev. |
| Theoretical Worked surface | (ha) | 0.805 | 0.78 | 0.65 | 2.235 | 0.76 | 0.73 | 0.67 | 2.1653 | ||
| Unsown areas | (ha) | none | none | none | none | 0.009 | 0.012 | 0.008 | 0.029 | ||
| Effective worked surface | (ha) | 0.805 | 0.78 | 0.65 | 2.235 | 0.751 | 0.718 | 0.662 | 2.1363 | ||
| Seed used | (kg) | 184.1 | 177.2 | 147.7 | 509 | 175.5 | 168.5 | 154.8 | 498.8 | ||
| Seeds used per unit of surface | (kg ha−1) | 228.7 | 227.2 | 227.2 | 227.7 ± 0.7 | 233.7 | 234.7 | 233.8 | 234.1 ± 0.43 | ||
| Tractor with SG | Tractor with MG | |||||||||
|---|---|---|---|---|---|---|---|---|---|---|
| Working times | Unit | R1 | R2 | R3 | Mean ± st.dev | R1 | R2 | R3 | Mean ± st.dev | |
| Effective operating time | % | 66.48 | 66.39 | 62.81 | 65.22 ± 1.71 | 58.50 | 61.77 | 61.68 | 60.65 ± 1.52 | |
| Accessory time | % | 33.52 | 33.61 | 37.19 | 34.77 ± 1.71 | 41.50 | 38.23 | 38.32 | 39.35 ± 1.52 | |
| Time for turning | % | 33.52 | 33.61 | 31.50 | 32.8 ± 0.97 | 35.47 | 38.23 | 38.32 | 37.34 ± 1.32 | |
| Time for adjustments | % | - | - | 5.69 | 6.03 | - | - | |||
| Machine performance | Unit | R1 | R2 | R3 | Mean ± st.dev | R1 | R2 | R3 | Mean ± st.dev | |
| Field efficiency | % | 66.48 | 66.39 | 62.81 | 65.23 ± 1.71 | 58.50 | 61.77 | 61.68 | 60.65 ± 1.52 | |
| Theoretical field speed | m s−1 | 2.21 | 2.31 | 2.92 | 2.48 ± 0.31 | 2.43 | 2.43 | 2.62 | 2.49 ± 0.09 | |
| Effective field speed | m s−1 | 1.47 | 1.54 | 1.83 | 1.61 ± 0.16 | 1.42 | 1.50 | 1.62 | 1.51 ± 0.08 | |
| Theoretical field capacity | ha h−1 | 3.17 | 3.32 | 4.19 | 3.56 ± 0.45 | 3.47 | 3.47 | 3.75 | 3.56 ± 0.13 | |
| Effective field capacity | ha h−1 | 2.11 | 2.20 | 2.63 | 2.31 ± 0.23 | 2.03 | 2.14 | 2.31 | 2.16 ± 0.12 | |
| Fuel consumption | l ha−1 | 2.91 | 2.79 | 2.34 | 2.68 ± 0.24 | 3.03 | 2.88 | 2.66 | 2.86 ± 0.15 | |
| MG | SG | F | p | |
|---|---|---|---|---|
| Seed (kg ha−1) | 234.1 | 227.7 | 115.4 | *** |
| FE (%) | 60.6 | 65.2 | 8.03 | * |
| EFC (ha h−1) | 2.16 | 2.31 | 0.73 | ns |
| EFS (m s−1) | 1.51 | 1.61 | 0.64 | ns |
| TT (%) | 37.3 | 32.9 | 14.78 | * |
| FC (l ha−1) | 2.86 | 2.68 | 0.75 | ns |
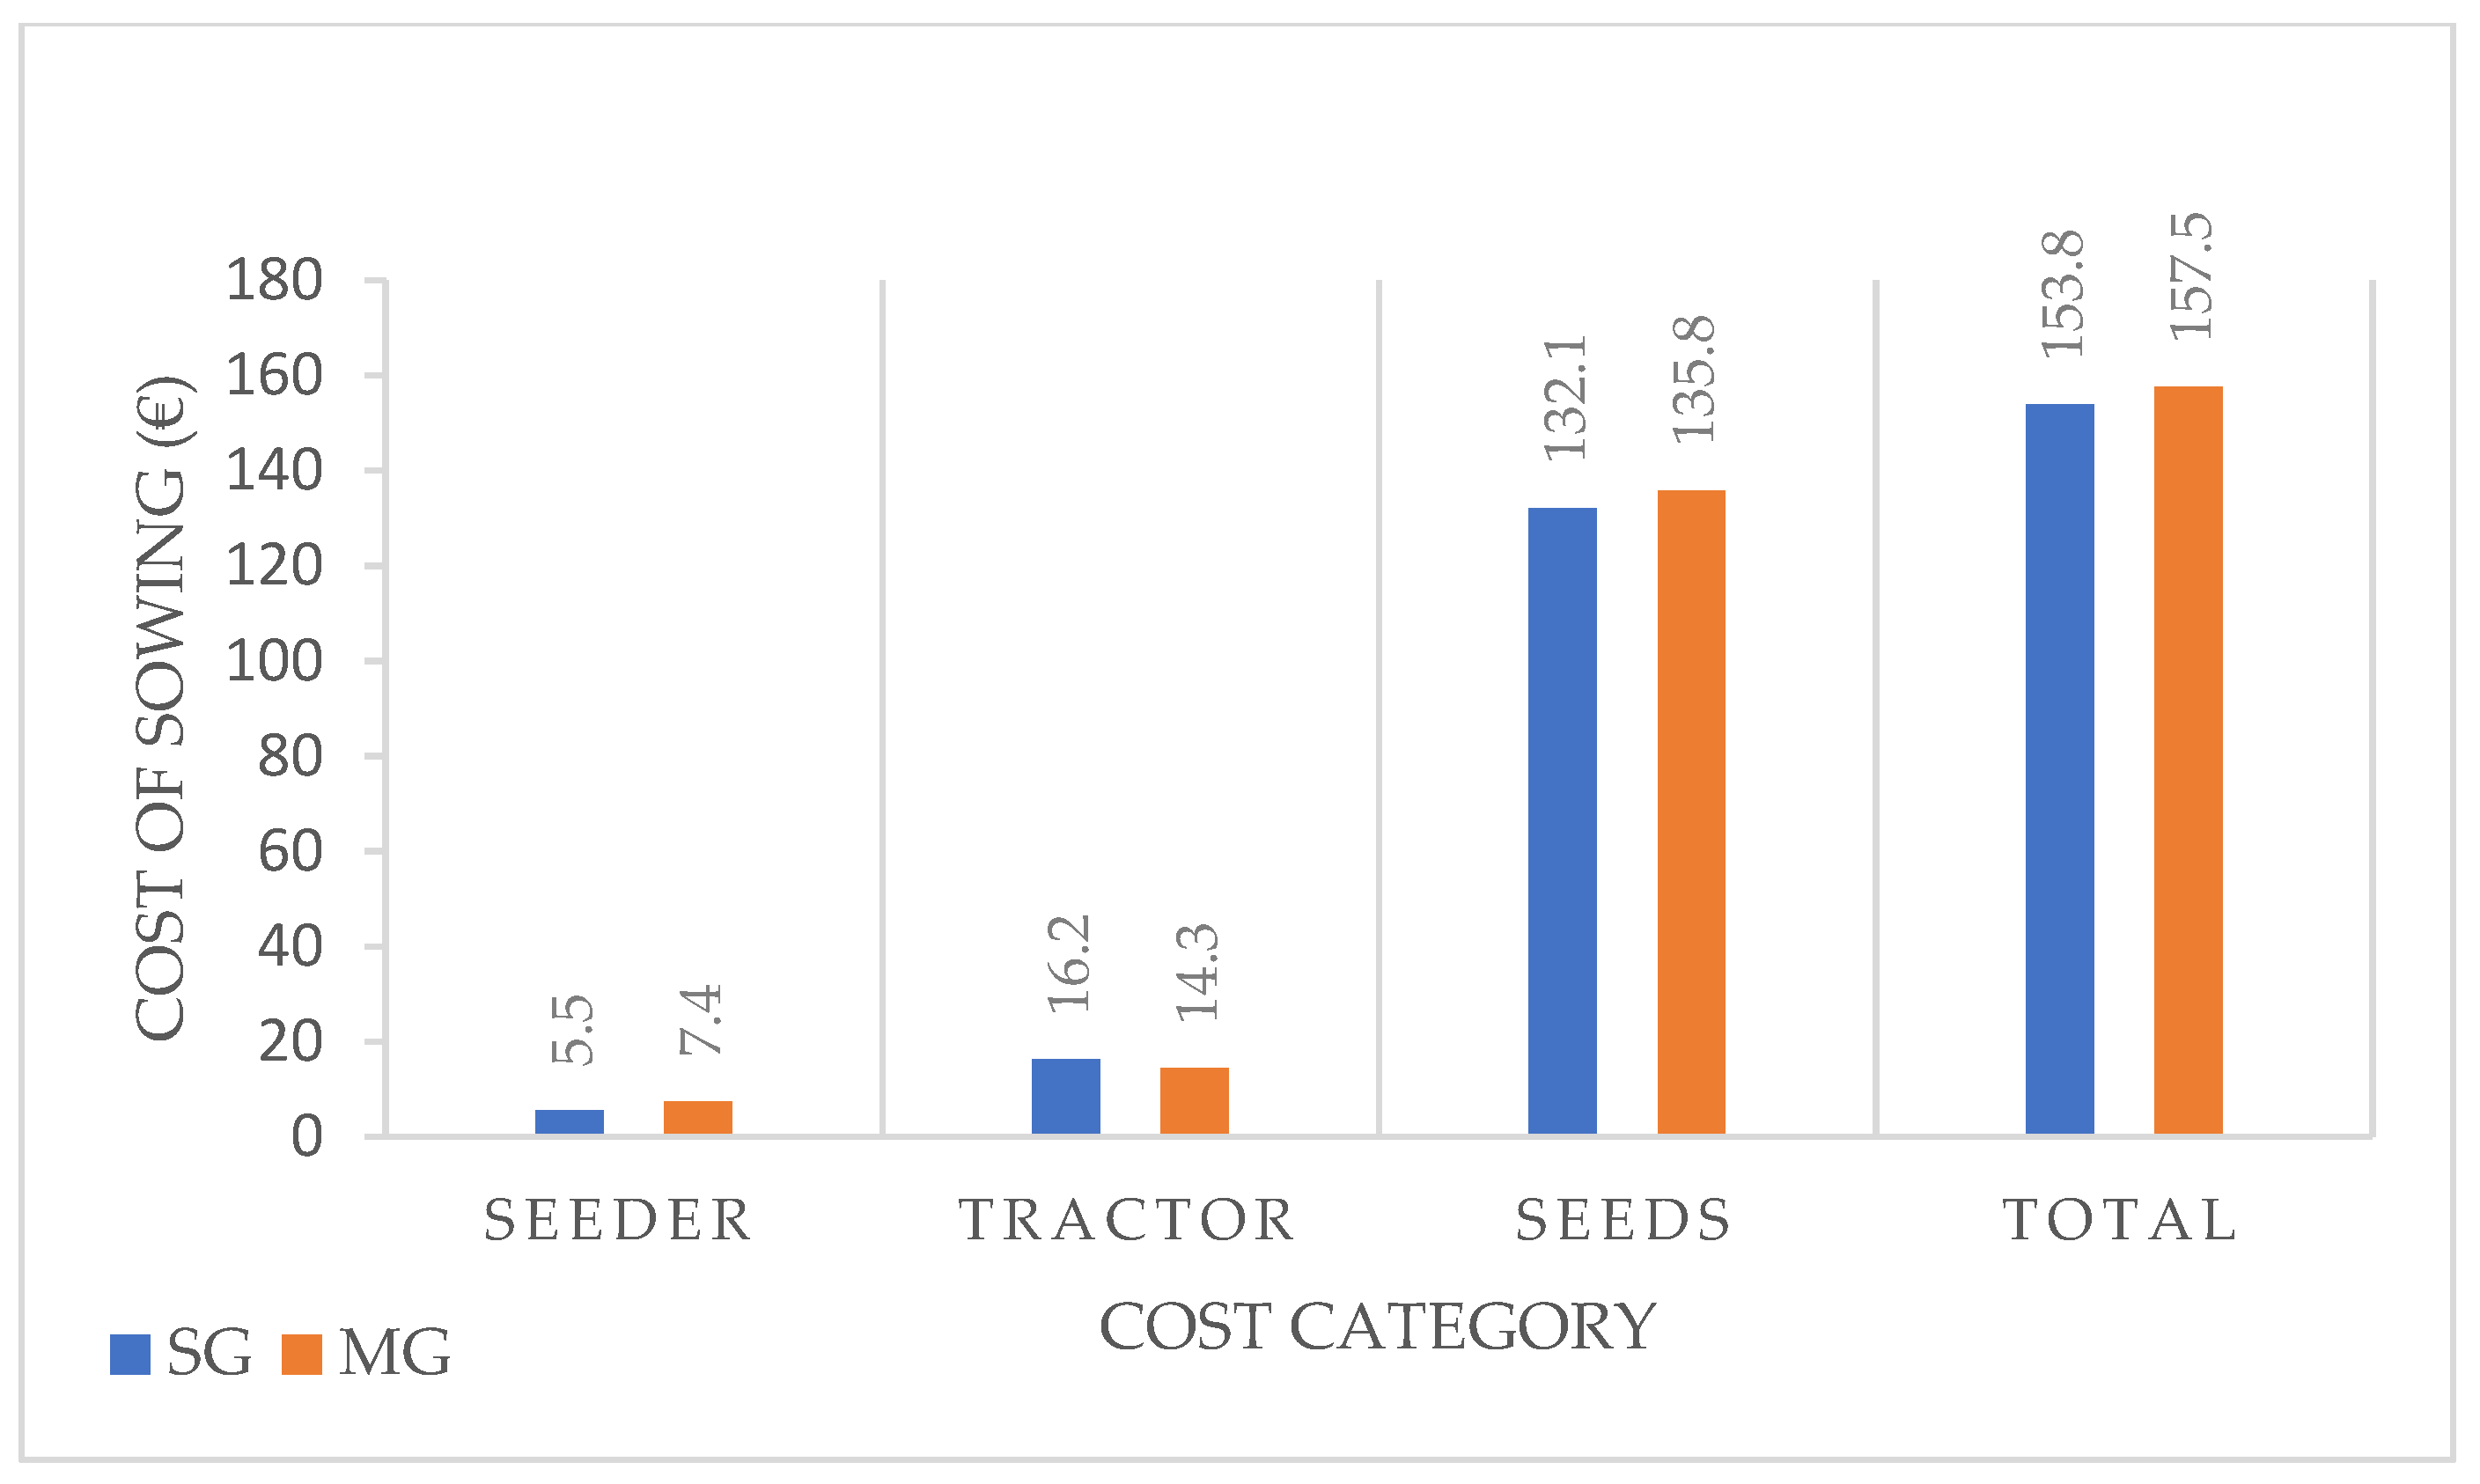
| Seeder (SG Scenario) | Tractor (SG Scenario) | Total | Seeder (MG Scenario) | Tractor (MG Scenario) | Total | ||
|---|---|---|---|---|---|---|---|
| Annual Cost | € year−1 | 1274.5 | 37,392 | 38,666.4 | 1607.9 | 30,959.1 | 32,567 |
| Hourly cost | € h−1 | 12.7 | 37.4 | 50.1 | 16.1 | 31 | 47 |
| Costs per unit of surface | € ha−1 | 5.5 | 16.2 | 21.7 | 7.4 | 14.3 | 21.78 |
Publisher’s Note: MDPI stays neutral with regard to jurisdictional claims in published maps and institutional affiliations. |
© 2021 by the authors. Licensee MDPI, Basel, Switzerland. This article is an open access article distributed under the terms and conditions of the Creative Commons Attribution (CC BY) license (https://creativecommons.org/licenses/by/4.0/).
Share and Cite
Scarfone, A.; Picchio, R.; del Giudice, A.; Latterini, F.; Mattei, P.; Santangelo, E.; Assirelli, A. Semi-Automatic Guidance vs. Manual Guidance in Agriculture: A Comparison of Work Performance in Wheat Sowing. Electronics 2021, 10, 825. https://doi.org/10.3390/electronics10070825
Scarfone A, Picchio R, del Giudice A, Latterini F, Mattei P, Santangelo E, Assirelli A. Semi-Automatic Guidance vs. Manual Guidance in Agriculture: A Comparison of Work Performance in Wheat Sowing. Electronics. 2021; 10(7):825. https://doi.org/10.3390/electronics10070825
Chicago/Turabian StyleScarfone, Antonio, Rodolfo Picchio, Angelo del Giudice, Francesco Latterini, Paolo Mattei, Enrico Santangelo, and Alberto Assirelli. 2021. "Semi-Automatic Guidance vs. Manual Guidance in Agriculture: A Comparison of Work Performance in Wheat Sowing" Electronics 10, no. 7: 825. https://doi.org/10.3390/electronics10070825
APA StyleScarfone, A., Picchio, R., del Giudice, A., Latterini, F., Mattei, P., Santangelo, E., & Assirelli, A. (2021). Semi-Automatic Guidance vs. Manual Guidance in Agriculture: A Comparison of Work Performance in Wheat Sowing. Electronics, 10(7), 825. https://doi.org/10.3390/electronics10070825