Article

Shaped-Beam Reflectarray Design by Means of Social Network Optimization (SNO)

1
Department of Electronics and Telecommunications (DET), Politecnico di Torino, 10129 Turin, Italy
2
Department of Energy, Politecnico di Milano, Via La Masa 34, 20156 Milano, Italy
*
Author to whom correspondence should be addressed.
Electronics 2021, 10(6), 744; https://doi.org/10.3390/electronics10060744
Submission received: 31 January 2021 / Revised: 12 March 2021 / Accepted: 16 March 2021 / Published: 21 March 2021
(This article belongs to the Special Issue New Trends in Reflectarray and Transmitarray Antennas)

Abstract

:
In this work, an innovative approach for the design of a shaped-beam reflectarray (RA) is presented. It is based on the use of a novel evolutionary algorithm (EA), named Social Network Optimization (SNO), that presents good capabilities in terms of convergence and reliability, and therefore it is suitable for optimizing a complex problem such as the one of interest. The full-wave analysis of a small–medium configuration designed with the proposed approach and the experimental characterization of a prototype proved the effectiveness of the adopted method.

1. Introduction

In recent years, the increasing complexity of many engineering problems, involving a huge number of degrees of freedom, and the enlarging of the available computational capabilities, increased the use of pseudo-stochastic optimization algorithms: in fact, they are able to manage a high number of independent parameters and to find an optimal solution in most cases, but at the cost of high computational effort, which is strictly related to the complexity of the mathematical model used to properly describe the problem to be solved.
Among the pseudo-stochastic approaches, evolutionary algorithms (EAs) have been applied successfully to different families of problems: they are derivative-free, global optimization algorithms inspired by biological interaction and evolution [1]. In view of their good features, they have also been applied to several antenna design problems (see, e.g., [2,3], where examples of the application to electromagnetic problems of the Genetic Algorithm (GA) or Particle Swarm Optimization (PSO), eventually hybridized with other approaches [4], are collected): they are generally complex problems and therefore they require the use of an efficient algorithm, properly tailored for their solution.
Since their introduction at the end of 70s [5], the importance of reflectarrays (RAs) [6,7] has been growing in different fields of applications [8]; depending on the type of utilization, RAs must provide wide-band behavior [9,10], beam steering [11] and reconfigurability [12], or must radiate a shaped beam. In most of these cases, they represent a good alternative to conventional reflector antennas, since they are less bulky and do not require the use of a mold for their manufacturing, providing a consequent reduction of production costs.
The design of a reflectarray can be effectively carried out with evolutionary strategies that can be adopted with two different aims: the optimization of the single unit-cell or that of the whole planar reflecting surface. In [13,14], two different approaches, based on the use of PSO and GA respectively, were used for the design of arbitrarily shaped dual-band re-radiating elements, whereas in [15] the GA was adopted for enhancing the bandwidth of the proposed RA unit-cell. The optimization of the entire RA represents a challenging problem, since it involves thousands of degrees of freedom, and therefore the optimization’s computational effort can increase dramatically if a suitable approach is not used; moreover, it is also important that the algorithm does not destroy the quasi-periodic distribution of the re-radiating elements, to guarantee the correct behavior of the antenna. In [16], simulation results of the application of the multi-objective Brainstorm Algorithm to the optimization of the aperture phase of a multi-focal RA are summarized; in [17] GA was adopted for the optimization of a multi-beam double RA, and in [18] it was applied to the design of a reconfigurable liquid-crystal reflectarray working at 108 GHz. PSO was the method selected in [19] to optimize a folded reflectarray, and in [20] some preliminary results of the application of the M Q C 10 -Biogeography-Based Optimization (M Q C 10 -BBO), an enhanced version of the Biogeography-Based Optimization (BBO) [21], to the design of a multi-beam RA are presented. Except for [19], where the outcomes of the experimental characterization of a pencil-beam prototype are shown, in all the other cited cases, only the preliminary results of the numerical analysis of the optimized configurations are presented.
For what concerns shaped-beam RAs, a first solution to obtain a cosecant squared radiation pattern was introduced in [22], and in [23] Pozar presented the results relative to the design of a configuration providing the coverage of Europe. In [24], the beam was shaped for having China-wide coverage. In [25] an efficient single-layer unit cell was introduced to enhance the bandwidth of a shaped-beam RA; in [26] it was used in conjunction with a typical machine learning method, support vector regression analysis, to design the reflectarray. Another approach for the design of shaped-beam RAs was introduced in [27], according to which the antenna synthesis was formulated as an inverse scattering problem, and the non-radiating currents were used as additional degrees of freedom for design.
In this paper, the design of a shaped-beam RA with a cosecant squared radiation pattern is based on the use of an efficient EA, the Social Network Optimization (SNO) [28], which mimics the behavior of the people interacting through a social network [29]. This algorithm has been previously applied to different antenna optimization problems, ranging from the sparse array optimization [30] to the design of a pencil-beam reflectarray [31], and of a transmitarray [32]: in all the cases it showed good convergence and reliability. Moreover, in [33], some very preliminary numerical results on its application to the design of a center-fed shaped-beam RA are summarized: in view of them, here a more complex, offset-fed configuration is considered, and the design procedure is also validated through the experimental characterization of a prototype.
The paper is structured as follows: in Section 2 the SNO features are summarized; in Section 3 the shaped-beam design process is described; in Section 4, the performance of the SNO is first compared with that of other optimization algorithms applied to the same problem, and then it is validated through the full-wave analysis of an optimized configuration and with the measurements of a prototype. Finally, in Section 5 some conclusions are drawn.

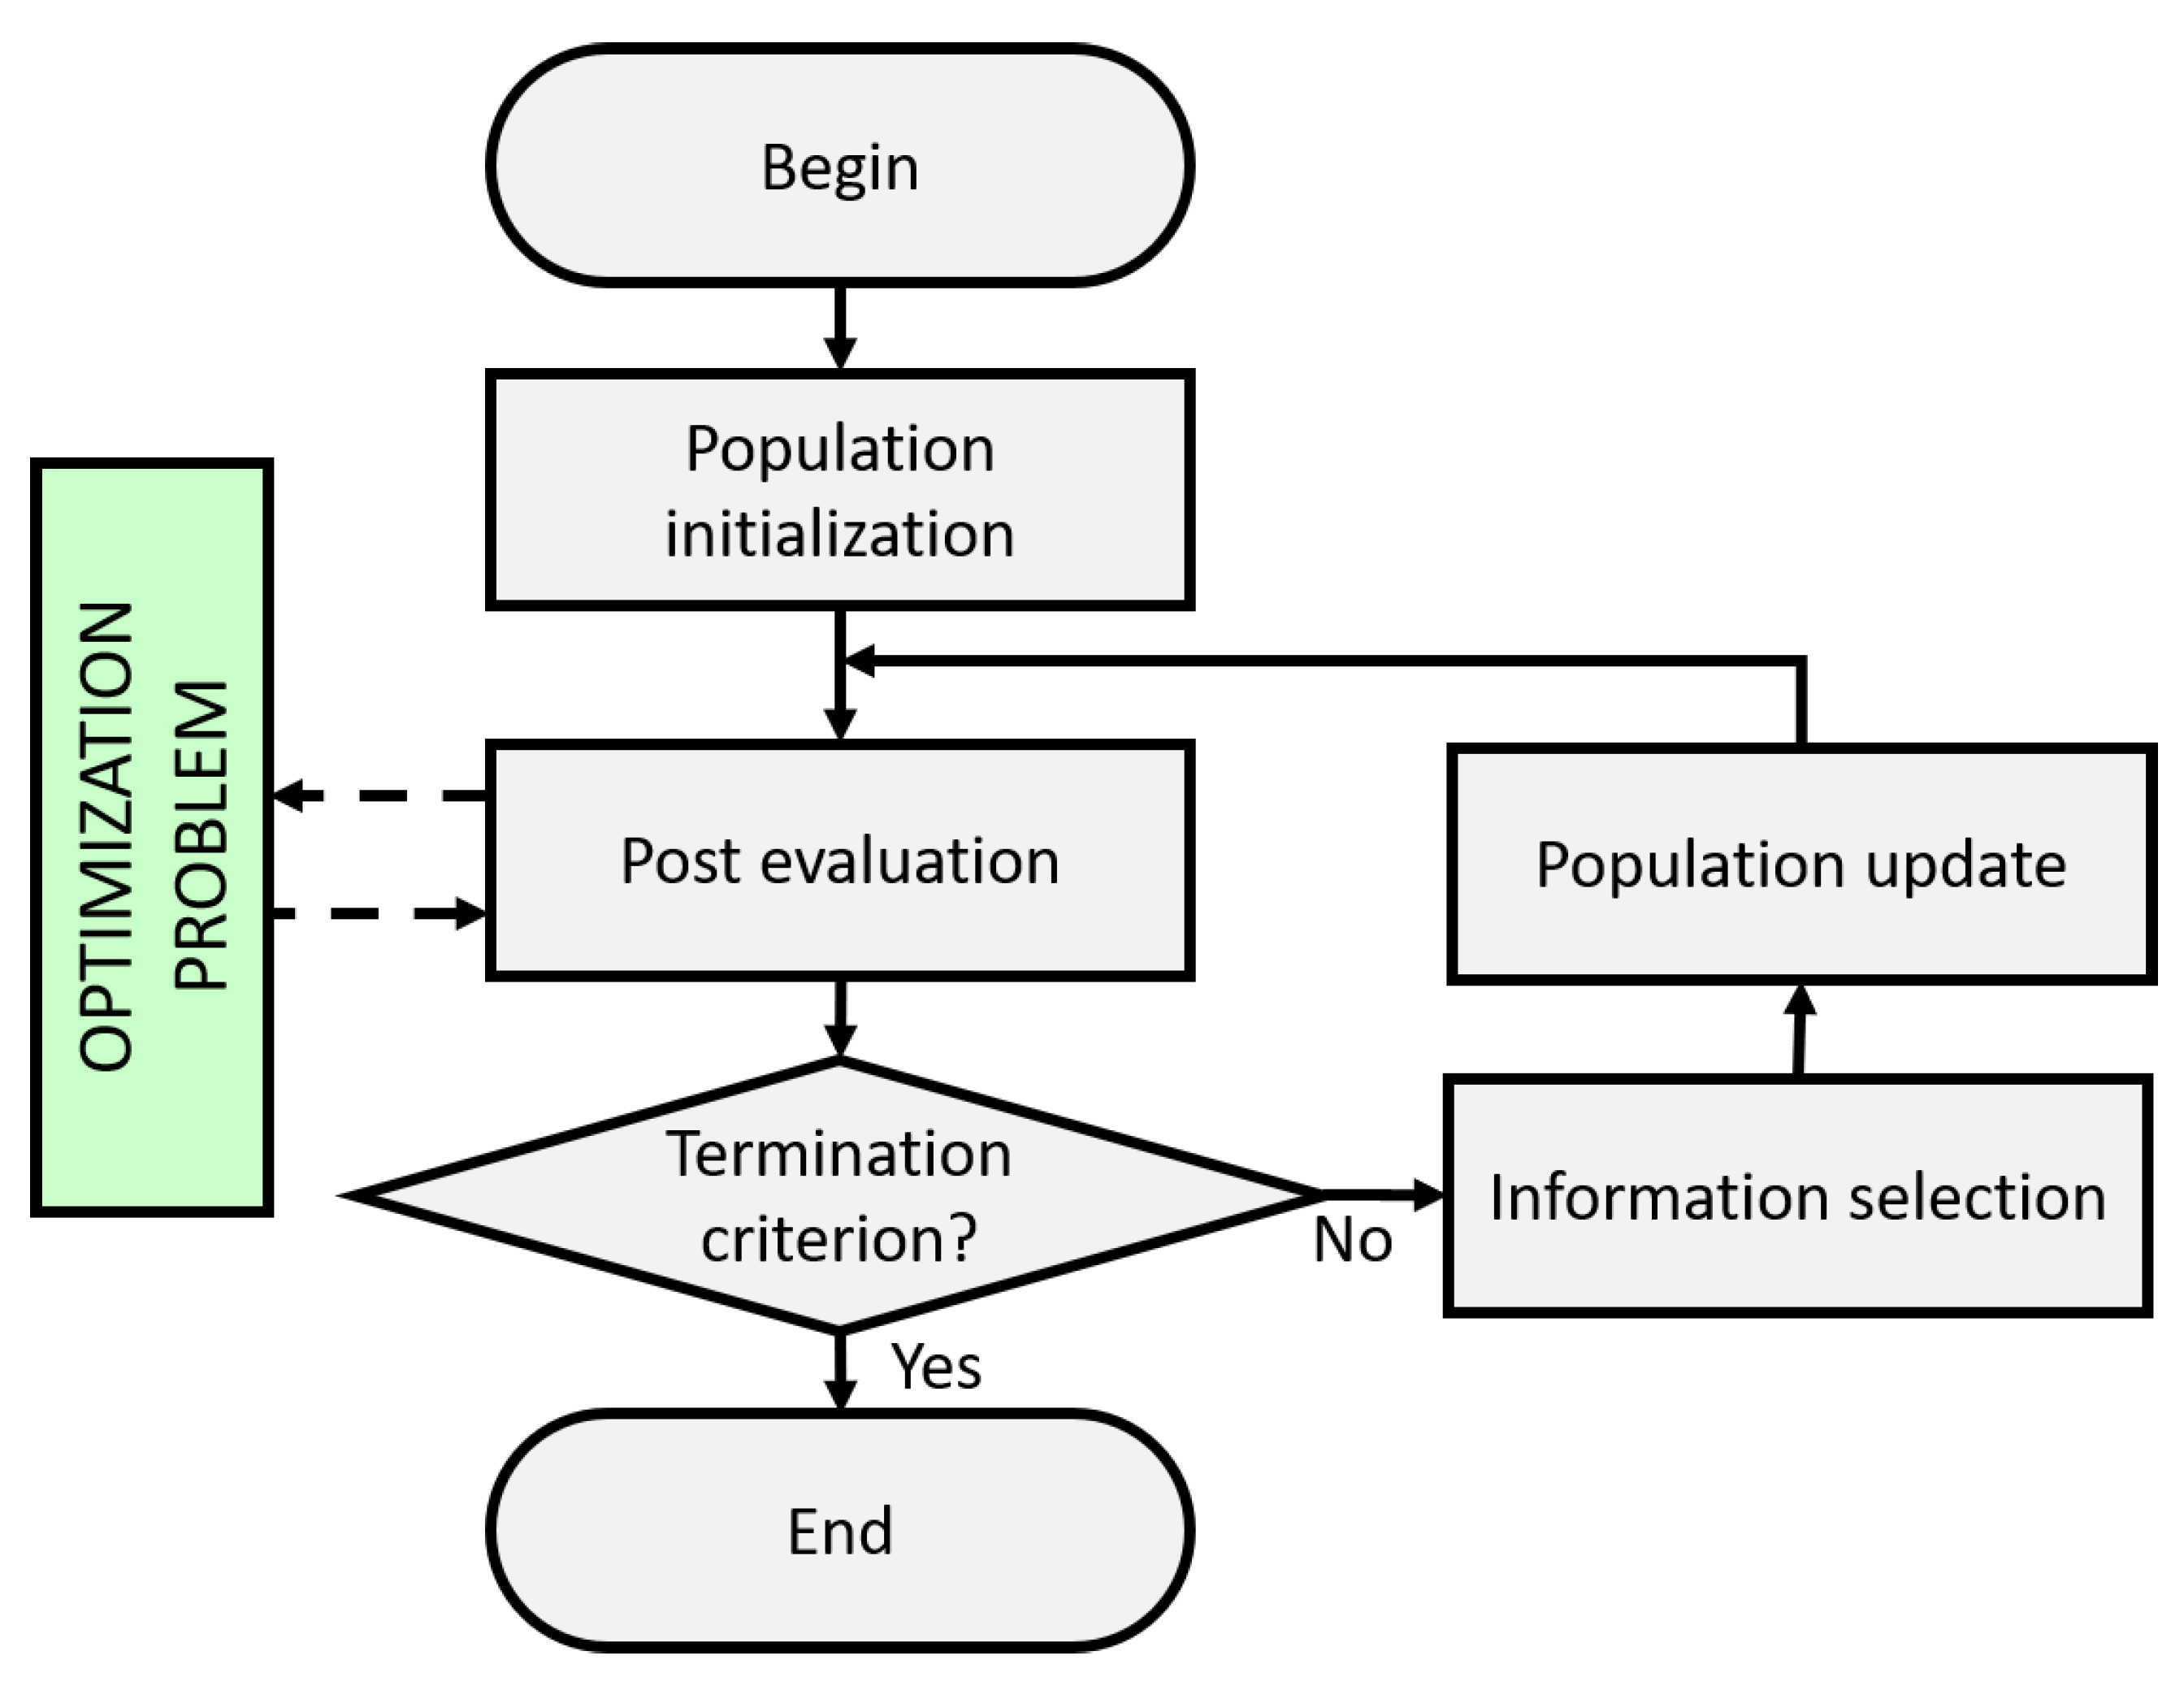
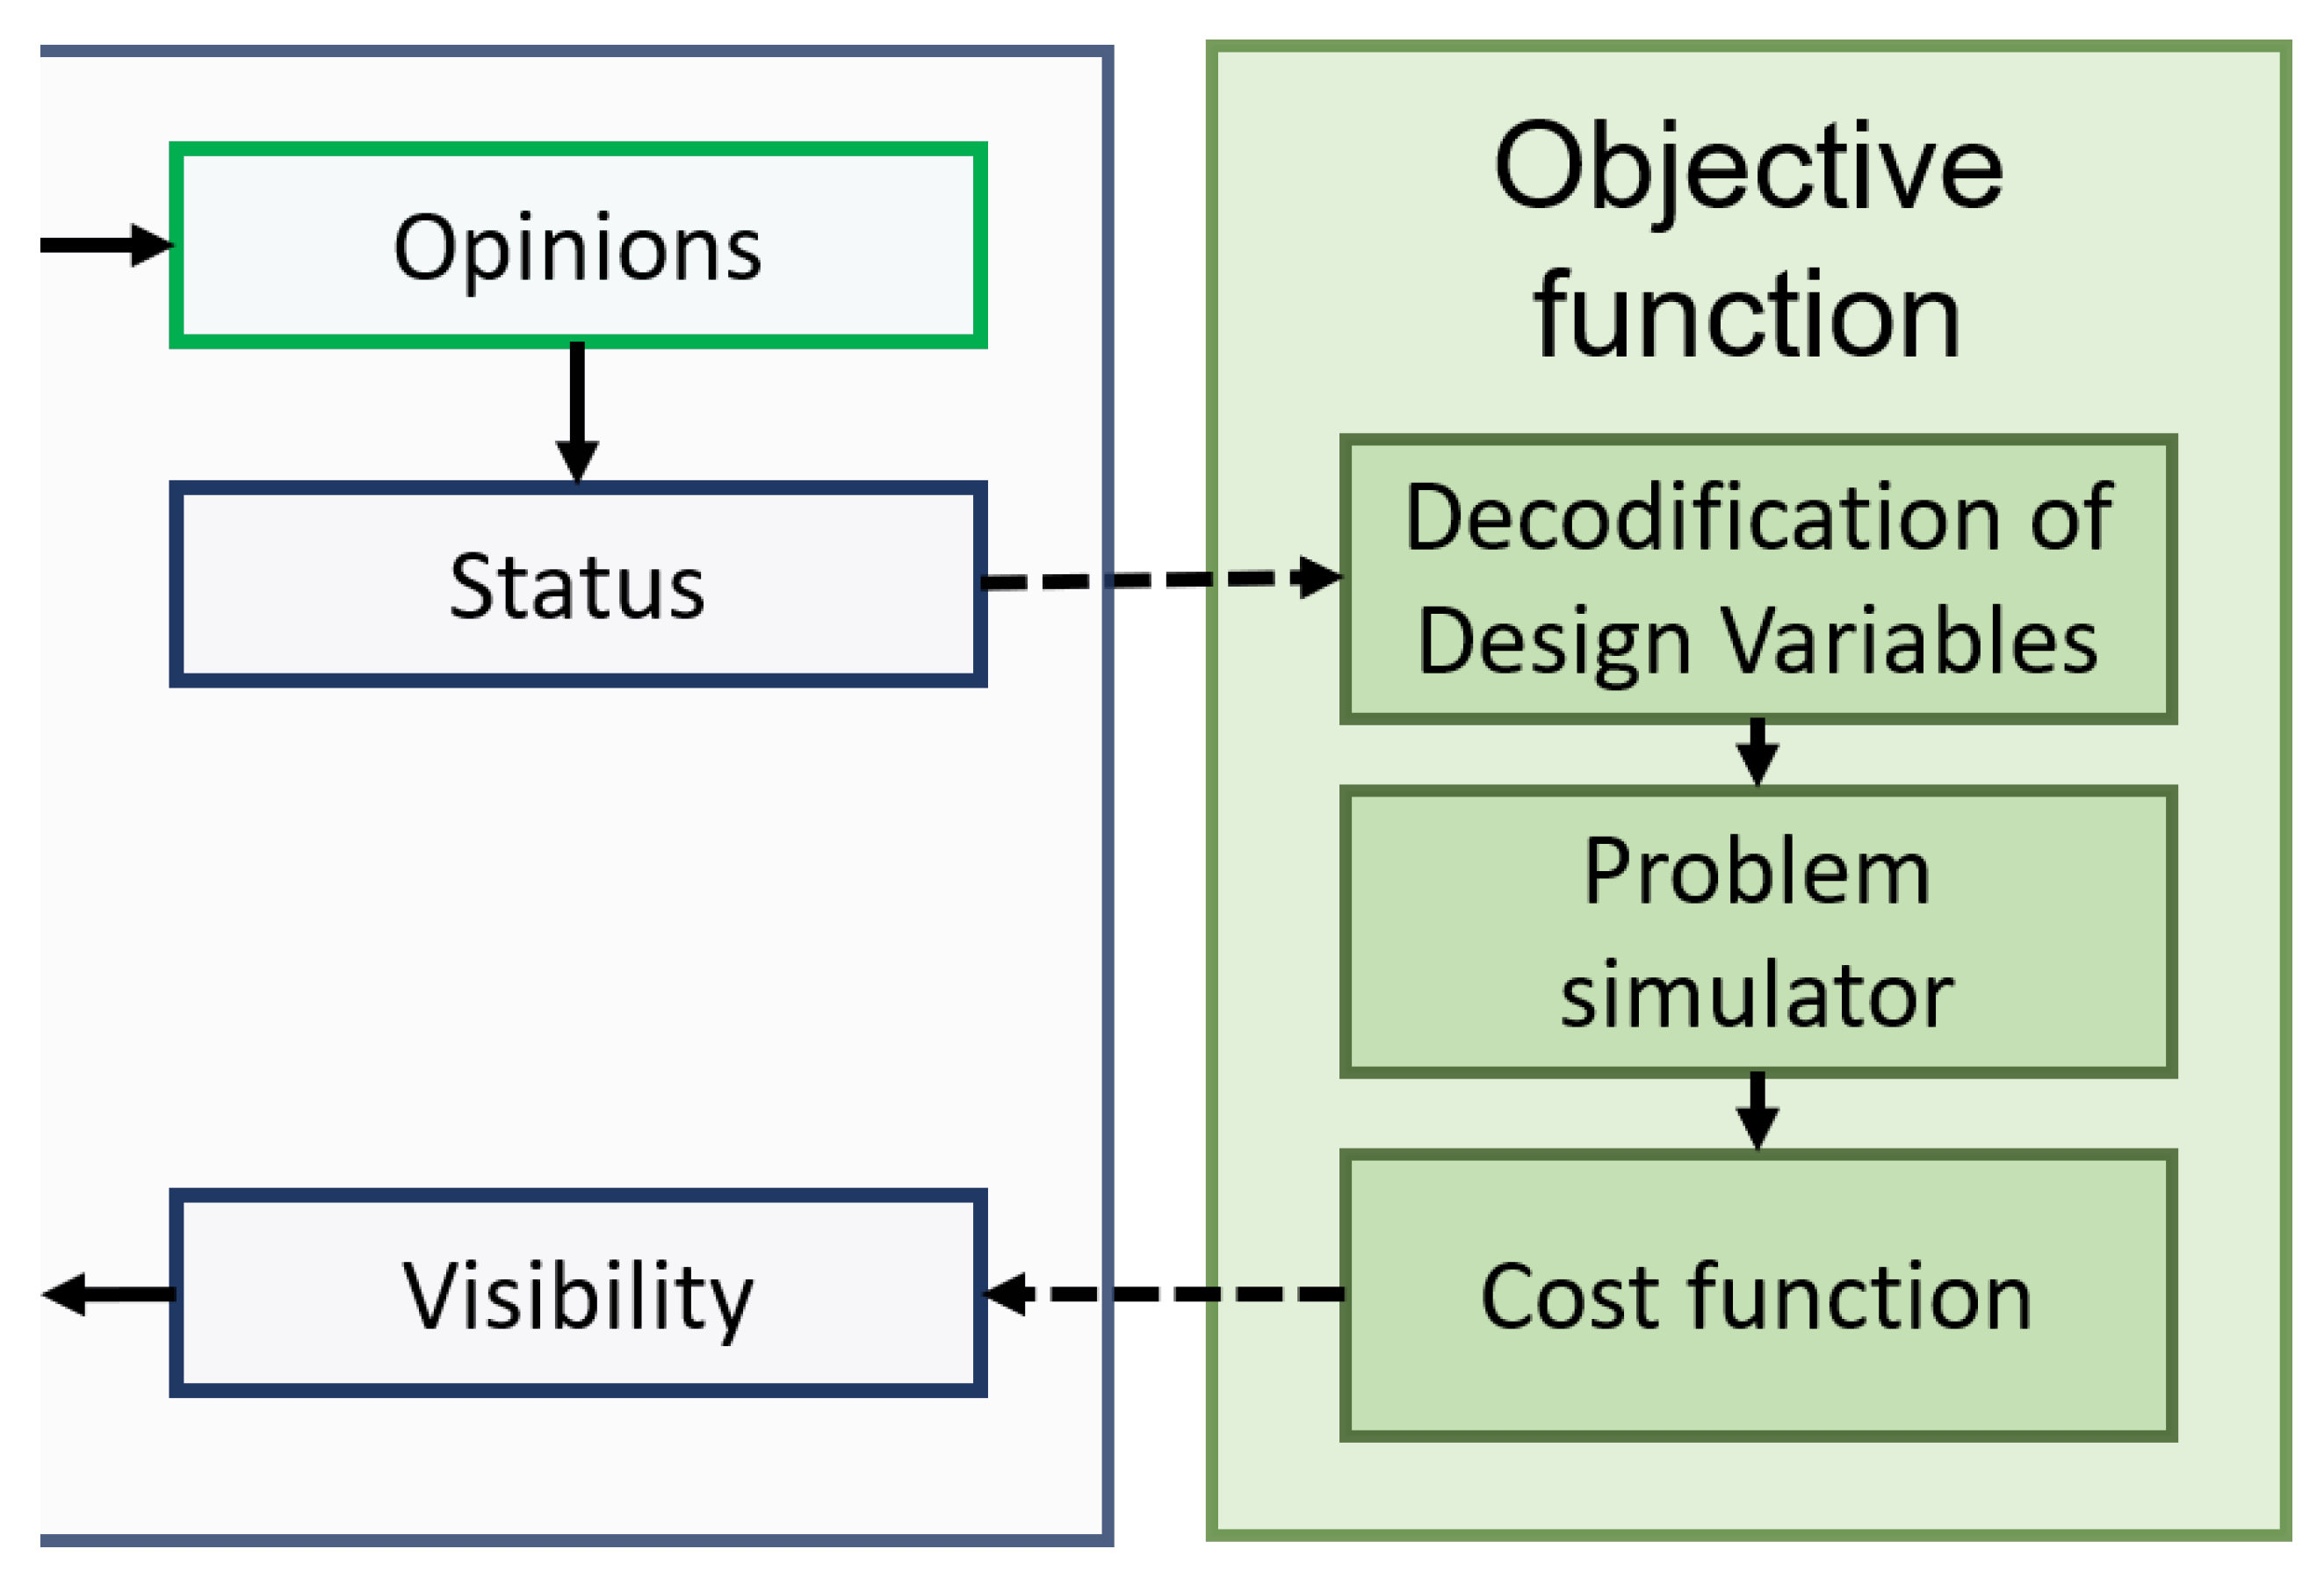
2. Social Network Optimization

Social Network Optimization is a population-based evolutionary optimization algorithm inspired by the online social network information sharing mechanism.
Like most of the other EAs, SNO is based on a population of candidate solutions that evolves during the optimization process. The general algorithm procedure (shown in Figure 1) consists of three different phases: the candidate solutions’ evaluations, the information selection and the creation of a new population of candidate solutions.
Each user of the Social Network is characterized by an opinion that is shared with the other users by means of posts. The process of of creating a post starting from an opinion is called linguistic transposition and it is implemented in SNO by means of a suitably defined Gaussian mutation. The posts, out of metaphor, represent the candidate solutions of the problem to be optimized, and their effectivity may be measured in terms of their visibility value that maps the cost value associated with each candidate solution (Figure 2).
The information sharing and selection process requires one to update his opinion, and therefore the post population, at each iteration; this is performed through the action of two different groups of influencers that are active for the users: the friends, who evolve working on proximity rules, on the basis of the opinions; and the trusted, who are selected according to the visibility values of their posts. Once these two groups are updated, each user of the social network selects the information that concurs to his new opinion’s definition. These new opinions, which may differ at every single run, are then combined for creating an appealing idea.
The appealing ideas are the basic elements for the third algorithm step, i.e., the creation of the new population. The interaction operator implemented in SNO is based on the assumption of a [34]:
o t + 1 = o t + α [ o t o t 1 ] + β [ a t o t ]
where o t + 1 , o t and o t 1 are the user’s opinions respectively at time t + 1 , t and t 1 ; a t is the user’s appealing idea; and α and β are two algorithm parameters, whose value highly affects the algorithm behavior: when α is predominant
o t + 1 ( 1 + α ) o t α o t 1
i.e., the past history of the user strongly affects its evolution and the algorithm behaves similarly to the PSO. Otherwise, when α 0
o t + 1 ( 1 + β ) o t β o t
and the influence of the appealing ideas is predominant over the user past history. The effects of α and β and the selection of their best value have been discussed in detail in [35].
The SNO performance has already been assessed through its comparison with other EAs (such as GA and PSO) when applied to standard benchmarks and to different antenna problems [30,36]: the results summarized in these papers confirm that the SNO outperformed, in most of the analyzed cases, the other considered methods in terms of convergence rate, solution quality and reliability. These features make the SNO suitable for the solution of the problem considered here, characterized by a high number of variables and a computationally expensive cost function.

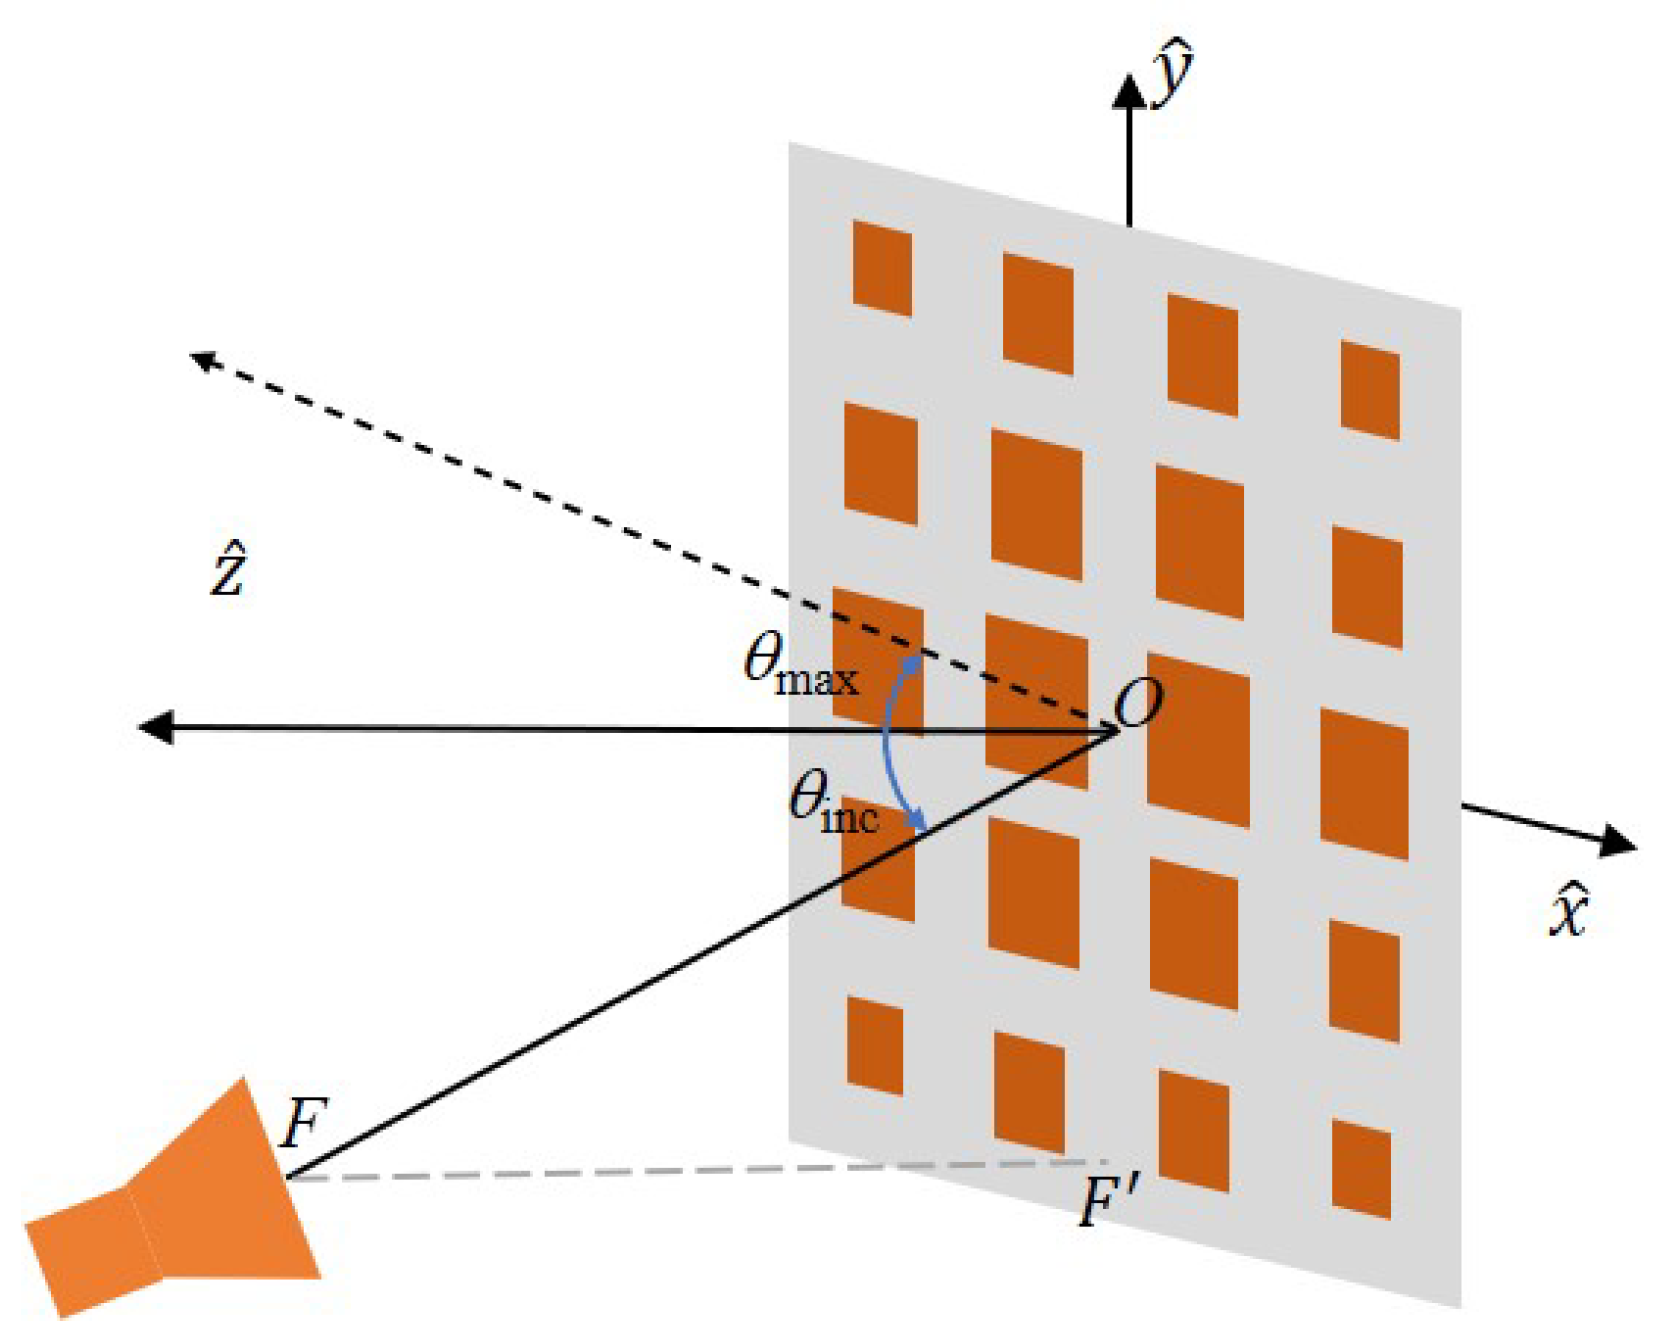
3. Shaped-Beam Reflectarray Design

The problem addressed here is the design of a reflectarray antenna, with a shaped-beam radiation pattern. From a practical point of view, it consists of determining the optimal phase distribution on the RA surface (and therefore its layout) to satisfy given constraints on the radiation pattern for a fixed type and position of the feed.
Assuming that the reflectarray surface is discretized with N c unit cells, the degrees of freedom of the problem are in general N d f = N c × N p , where N p is the number of variable geometrical parameters characterizing each unit cell. Without loosing in generality, in the examples considered here N p = 1 , and therefore N d f = N c ; moreover, if the configuration to design is symmetrical with respect to a plane (here the vertical one), the number of free variables reduces to N d f = N c / 2 . N d f represents the dimensions of the optimization problem: since even a medium size aperture is generally discretized with some hundreds of unit cells, it is evident that the problem size is quite large. Moreover, the variables can be defined on different ranges of variation (this occurs especially when N p 1 ) and therefore a normalized search space for the optimization algorithm is defined as [ 0 , 1 ] N d f : the encoded variables are mapped to the physical ones by means of a linear transformation that takes into account the lower and upper bounds of their range of variation.
The constraints on the radiation patterns are taken into account by proper masks. Differently to what was done in [33], where the radiation pattern had to satisfy two masks defined in the two principal planes, here 3D masks have been defined, to avoid the risk that the side lobe level (SLL) increases in the angular regions that are out of the control of the optimization process. The cut of the two masks in the principal planes is shown in Figure 3: on the left there are those in the E-plane, that corresponds to the yz plane in Figure 4, while the plot on the right refers to the H-plane (corresponding to to the xz plane in Figure 4). The upper mask serves to shape the radiation pattern in the E-plane: it is described by a csc 2 ( θ ) dependence with θ in the range [ 20 , 50 ] . For the other directions ( θ , ϕ ) out of the main beam the SLL limit below −15 dB has been imposed. The lower mask is mainly used to control the ripple of the shaped-beam. The cut of the two masks in the E-plane is shown on the left of Figure 3, while the cut in the H-plane (corresponding to the x z plane in Figure 4), where the radiation pattern is just characterized by a pencil beam and side lobes below −15 dB and therefore only the upper mask is used, is plotted on the right of Figure 3.
Once the masks have been introduced, a first cost value is defined as the sum of the errors between the masks themselves and the radiation pattern:
c m a s k s = θ , ϕ err U M ( θ , ϕ ) + γ θ , ϕ err L M ( θ , ϕ )
where err U M ( θ , ϕ ) and err L M ( θ , ϕ ) represent the error between the upper (or lower) mask and the radiation pattern, computed for a given direction ( θ , ϕ ) ; γ is a proper scaling factor used to drive the optimization process toward the desired target.
In addition to this error, a second cost component has been introduced to ensure the correct pointing direction of the shaped beam. Mathematically, this is expressed in the following way:
c s c a n = ( θ m a x θ d e s ) 2
where θ m a x is the actual direction of the maximum gain, evaluated at each iteration of the optimization procedure, and θ d e s is the desired pointing direction.
The cost value that the SNO minimizes at each iteration is therefore a linear combination of (4) and (5).
The choice to force the radiation pattern to satisfy 3D masks would increase the computational cost of the optimization procedure: to keep it under control, it is not possible to evaluate the radiation pattern at each step of the procedure with a full-wave approach, but it is instead necessary to use a sufficiently accurate but also less computationally expensive method; here, the Aperture Field Method (AFM) introduced in [6] is adopted.

4. Validation of the SNO-Based Procedure

The considered configuration consists of a medium-small aperture, discretized with 24 × 24 re-radiating elements. Each element is a simple square patch printed on a Diclad 527 substrate, with ϵ r = 2.57 , t a n δ = 0.0022 and thickness h = 0.8 mm. In order to avoid grating lobes, the cell size has been chosen as equal to λ 0 / 2 , where λ 0 is computed at the design frequency f 0 = 30 GHz. The phase and the amplitude of the reflection coefficient provided by each unit cell as a function of the side W of the patch, were computed with the software CST Microwave Studio, considering each element embedded in an infinite periodic lattice. The analysis, performed considering the case of orthogonal incidence, proves that the amplitude of Γ is almost 0 dB everywhere, with a negligible decrease in correspondence of the patch resonant size, while the phase shows a total variation of 300 [33].
The planar RA is illuminated by the field radiated by a smooth-wall horn designed to work in a frequency range centered at 30 GHz [37] and located in offset position, as shown in the sketch in Figure 4: the focal distance f = 0.87 D D being the size of the RA and f = F F ¯ in Figure 4—was chosen to obtain a tapering of –10 dB at the edges of the reflective surface, while the angle θ i n c between the direction of arrival of the field radiated by the feed and the axis z ^ , orthogonal to the RA, is specular to the direction of maximum radiation θ m a x of the entire antenna, i.e. θ i n c = θ m a x = 15 .
Since the RA configuration has a symmetry with respect to the vertical plane, the N d f = 24 × 24 = 576 degrees of freedom reduce to N d f = 288 . The optimization has been carried on at f 0 .

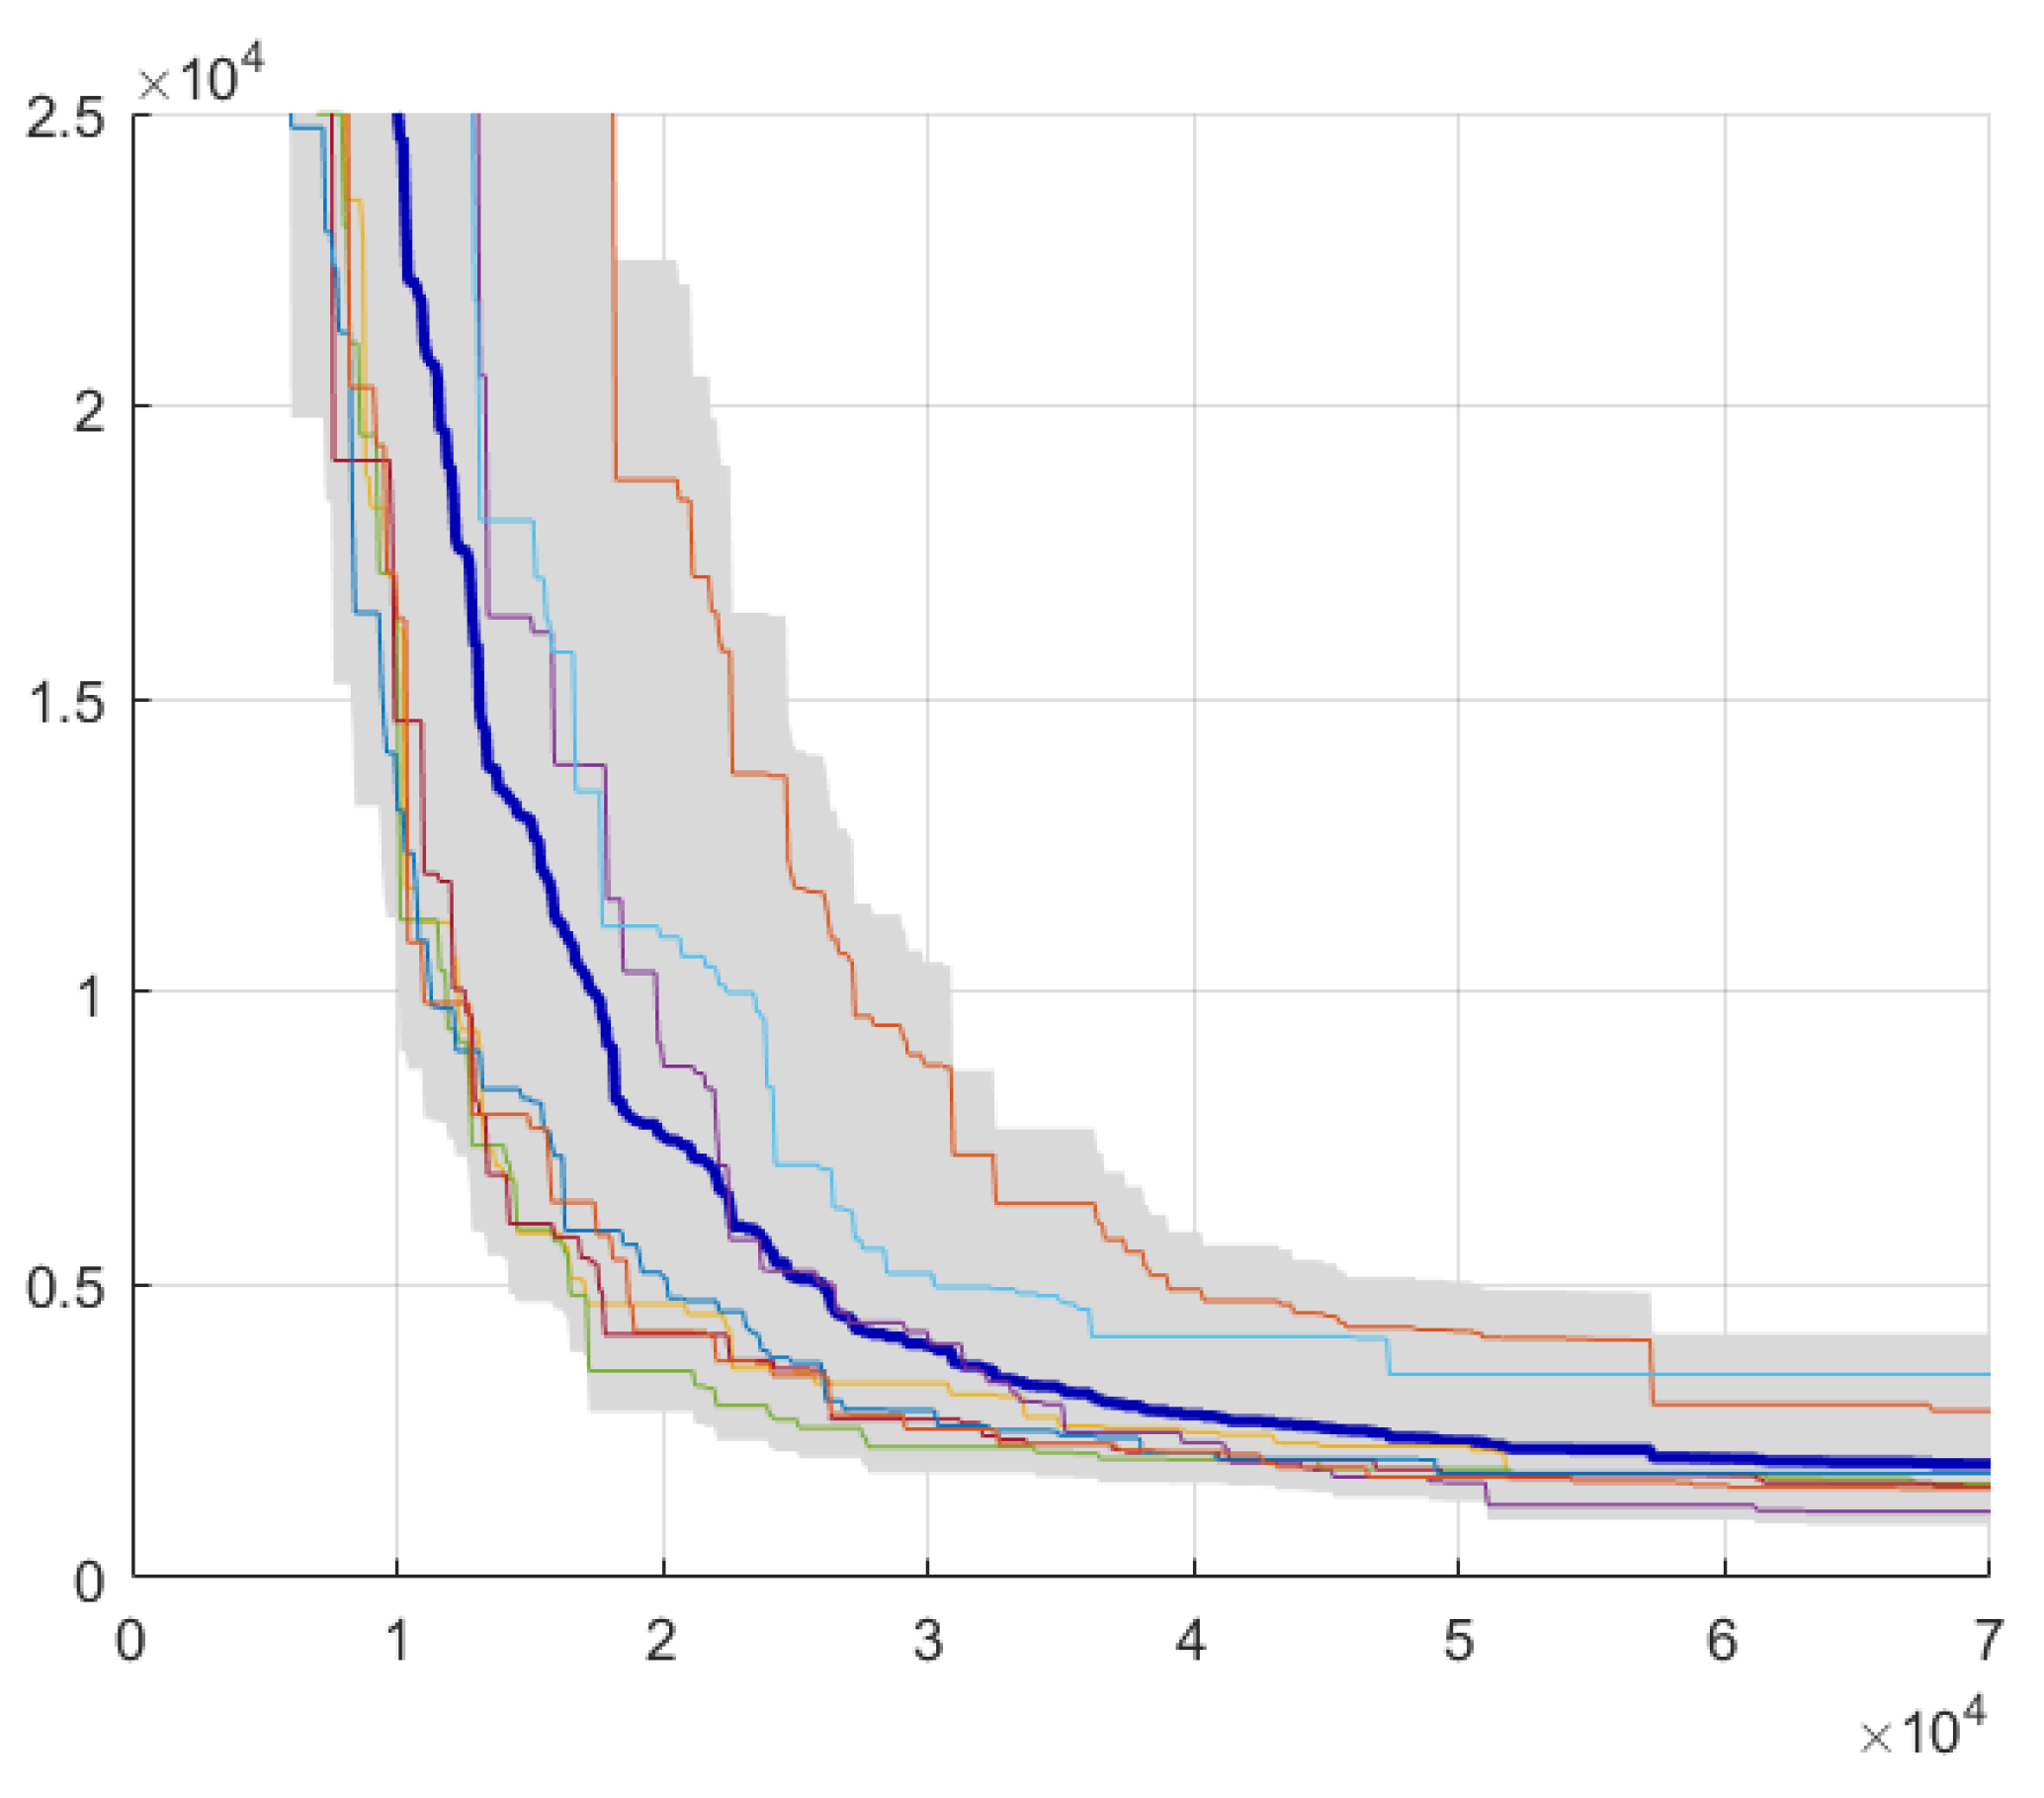
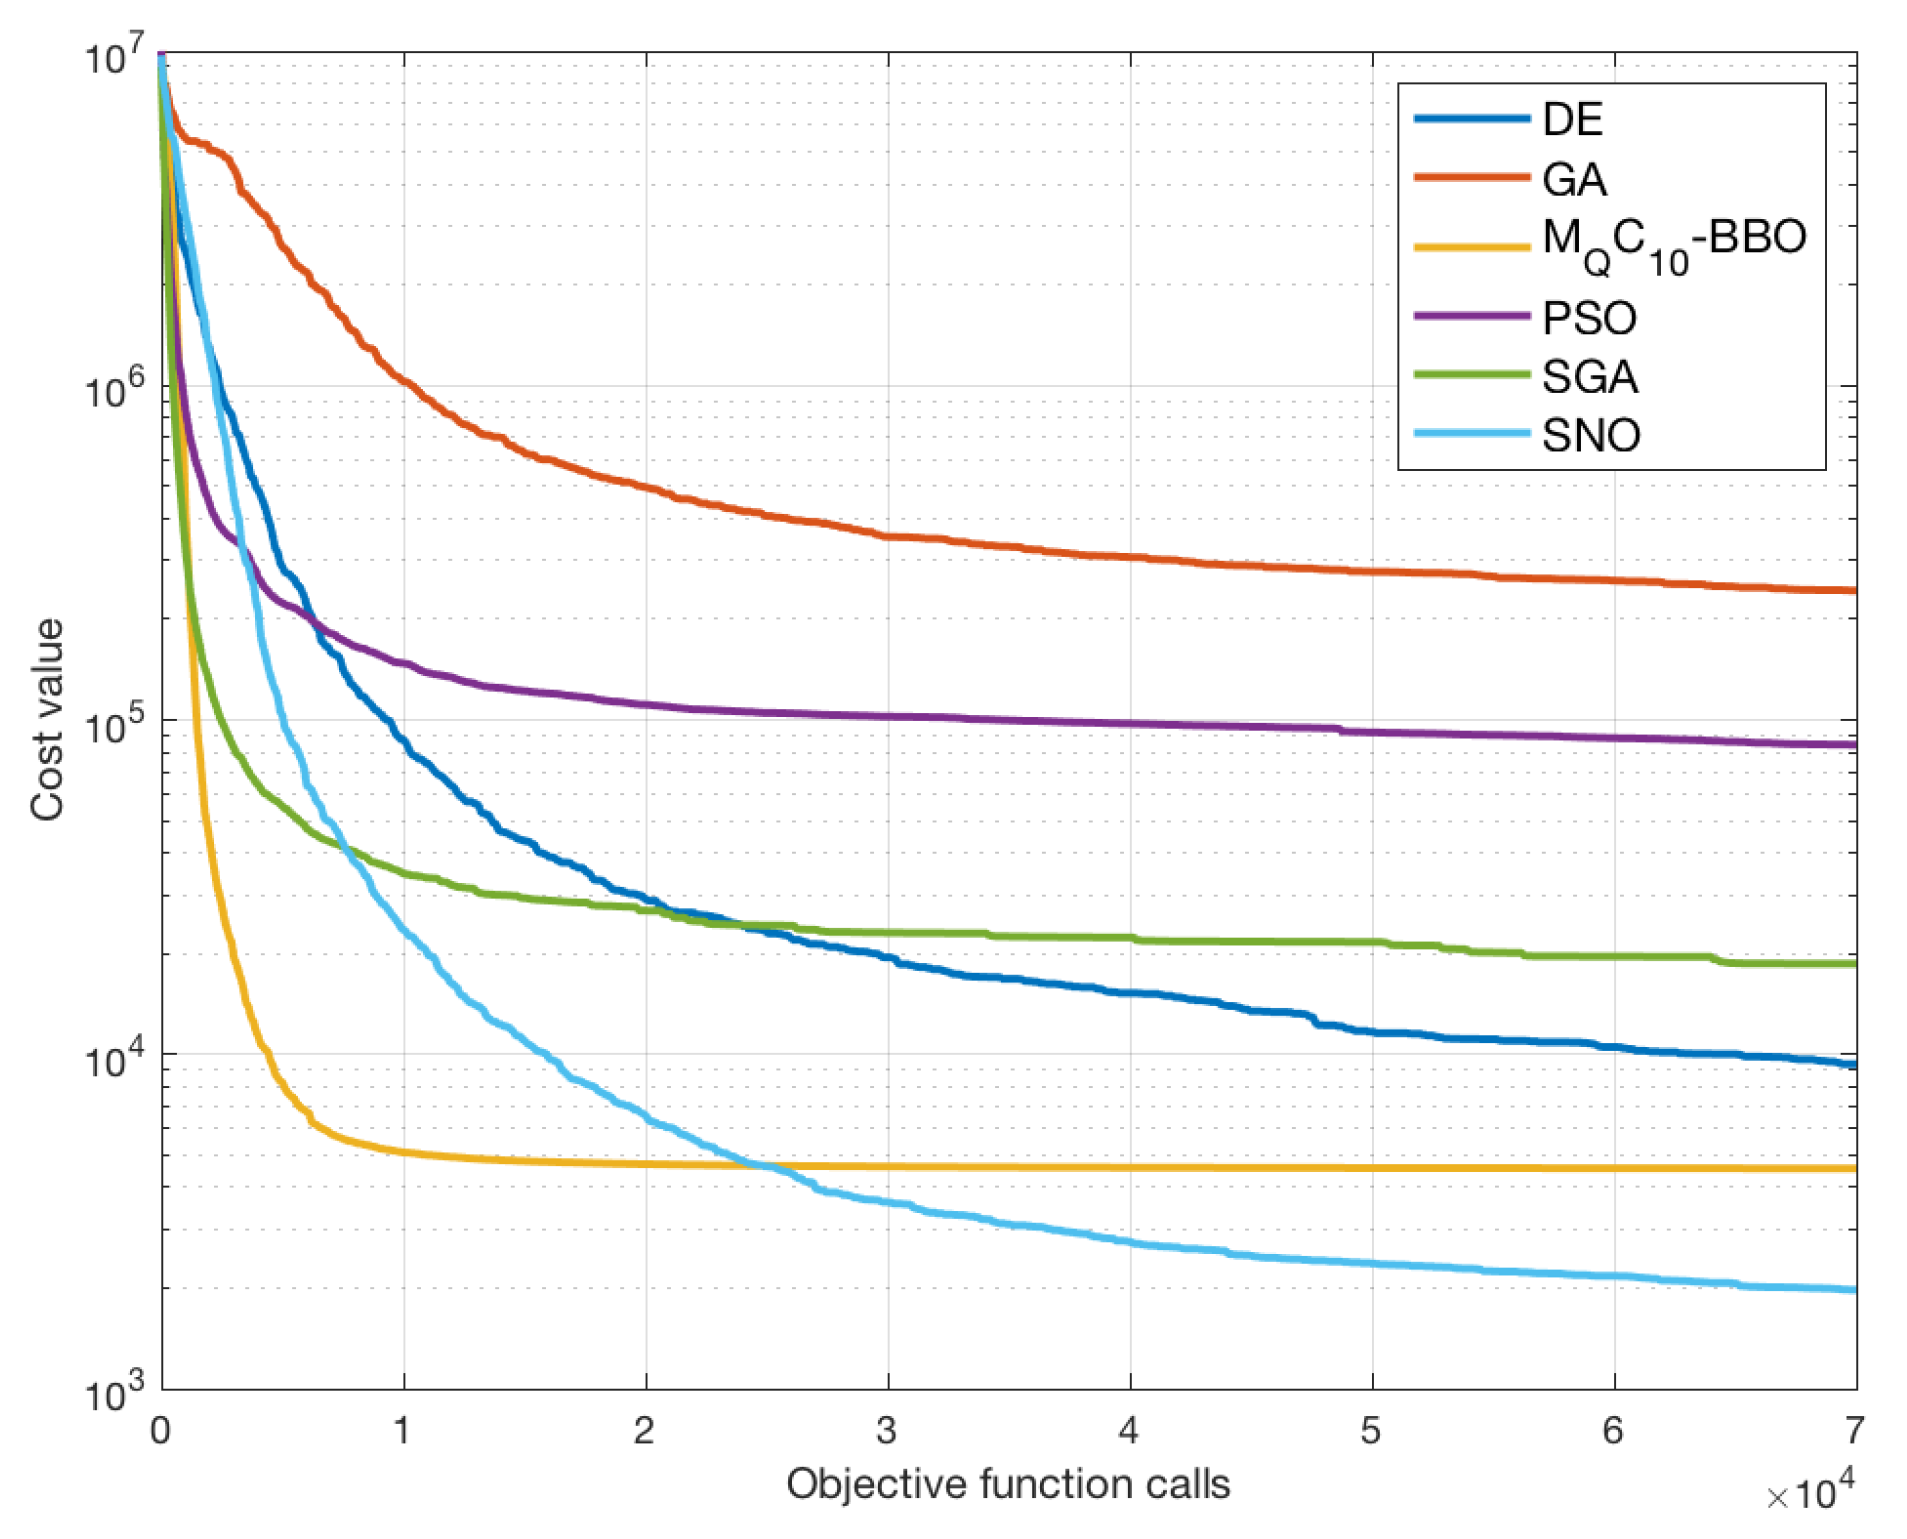
4.1. Comparison with Other EAs

To check the effectiveness of the described optimization process, first the algorithm’s convergence capability and reliability have been tested. Several separate trials have been run, assuming as the termination criterion for each of them 70,000 objective function calls, corresponding to a population of 100 individuals and 700 iterations. This termination criterion has been adopted since 70,000 objective function calls allow most of the trials to reach convergence; from preliminary tests, it resulted that a further increment of the number of objective function calls would increase linearly the computational time, without a significant performance improvement. In Figure 5, eight randomly selected curves of convergence are plotted, together with their average values, represented by the blue thicker line. The computed 95% confidence interval of the stochastic process of convergence is also highlighted by the gray area. These results show good convergence and high reliability for the SNO, proved by the closeness of the curves relative to the different trials, which are all in the considered confidence interval.
As a second step, the performance of SNO has been compared with that of other EAs. In particular, more often assessed schemes as the GA, the PSO and Differential Evolution [38], and more innovative methods such as Stud-GA (SGA) [39], which has better exploitation and exploration capabilities than the GA, and the M Q C 10 -BBO, were considered. The termination criterion for all these approaches was again set to 70,000 objective function calls, since it guarantees the reaching of convergence for all the considered methods and a total computational time difference among them of lower than 3.5%. Figure 6 shows the curves of convergence for the considered algorithms: even if from this plot it seems that SNO did not reach convergence, from the curves reported in Figure 5 it appears that all the considered trials reached it with the adopted number of objective function calls. The curves relative to SGA and particularly M Q C 10 -BBO showed faster initial convergence, but when the number of iterations increased they tended to stagnate, while the curve relative to SNO continues to decreased, confirming its convergence capability.
Table 1 shows a comparison between the algorithms in terms of mean cost value and standard deviation. Here it is possible to see also the very high reliability of SNO that has the lower standard deviation.
Since the M Q C 10 -BBO reached a sub-optimal solution with a smaller number of iterations and then it stagnated there (see Figure 6 ), it is worth comparing that solution with the SNO one. In Figure 7 the radiation patterns of the two solutions in the E (left) and H (right) planes are plotted; in both planes the side lobes of the M Q C 10 -BBO configuration are higher, but in any case they fulfill the mask. On the contrary, the M Q C 10 -BBO results show a misalignment of the direction of maximum radiation, due to the inability of the algorithm to fulfill the constrain expressed by the cost function (5), with a consequent reduction of the maximum gain in the H-plane. These drawbacks, added to the lower reliability of the M Q C 10 -BBO already discussed, confirm its lower effectiveness with respect to SNO in solving the considered optimization problem.

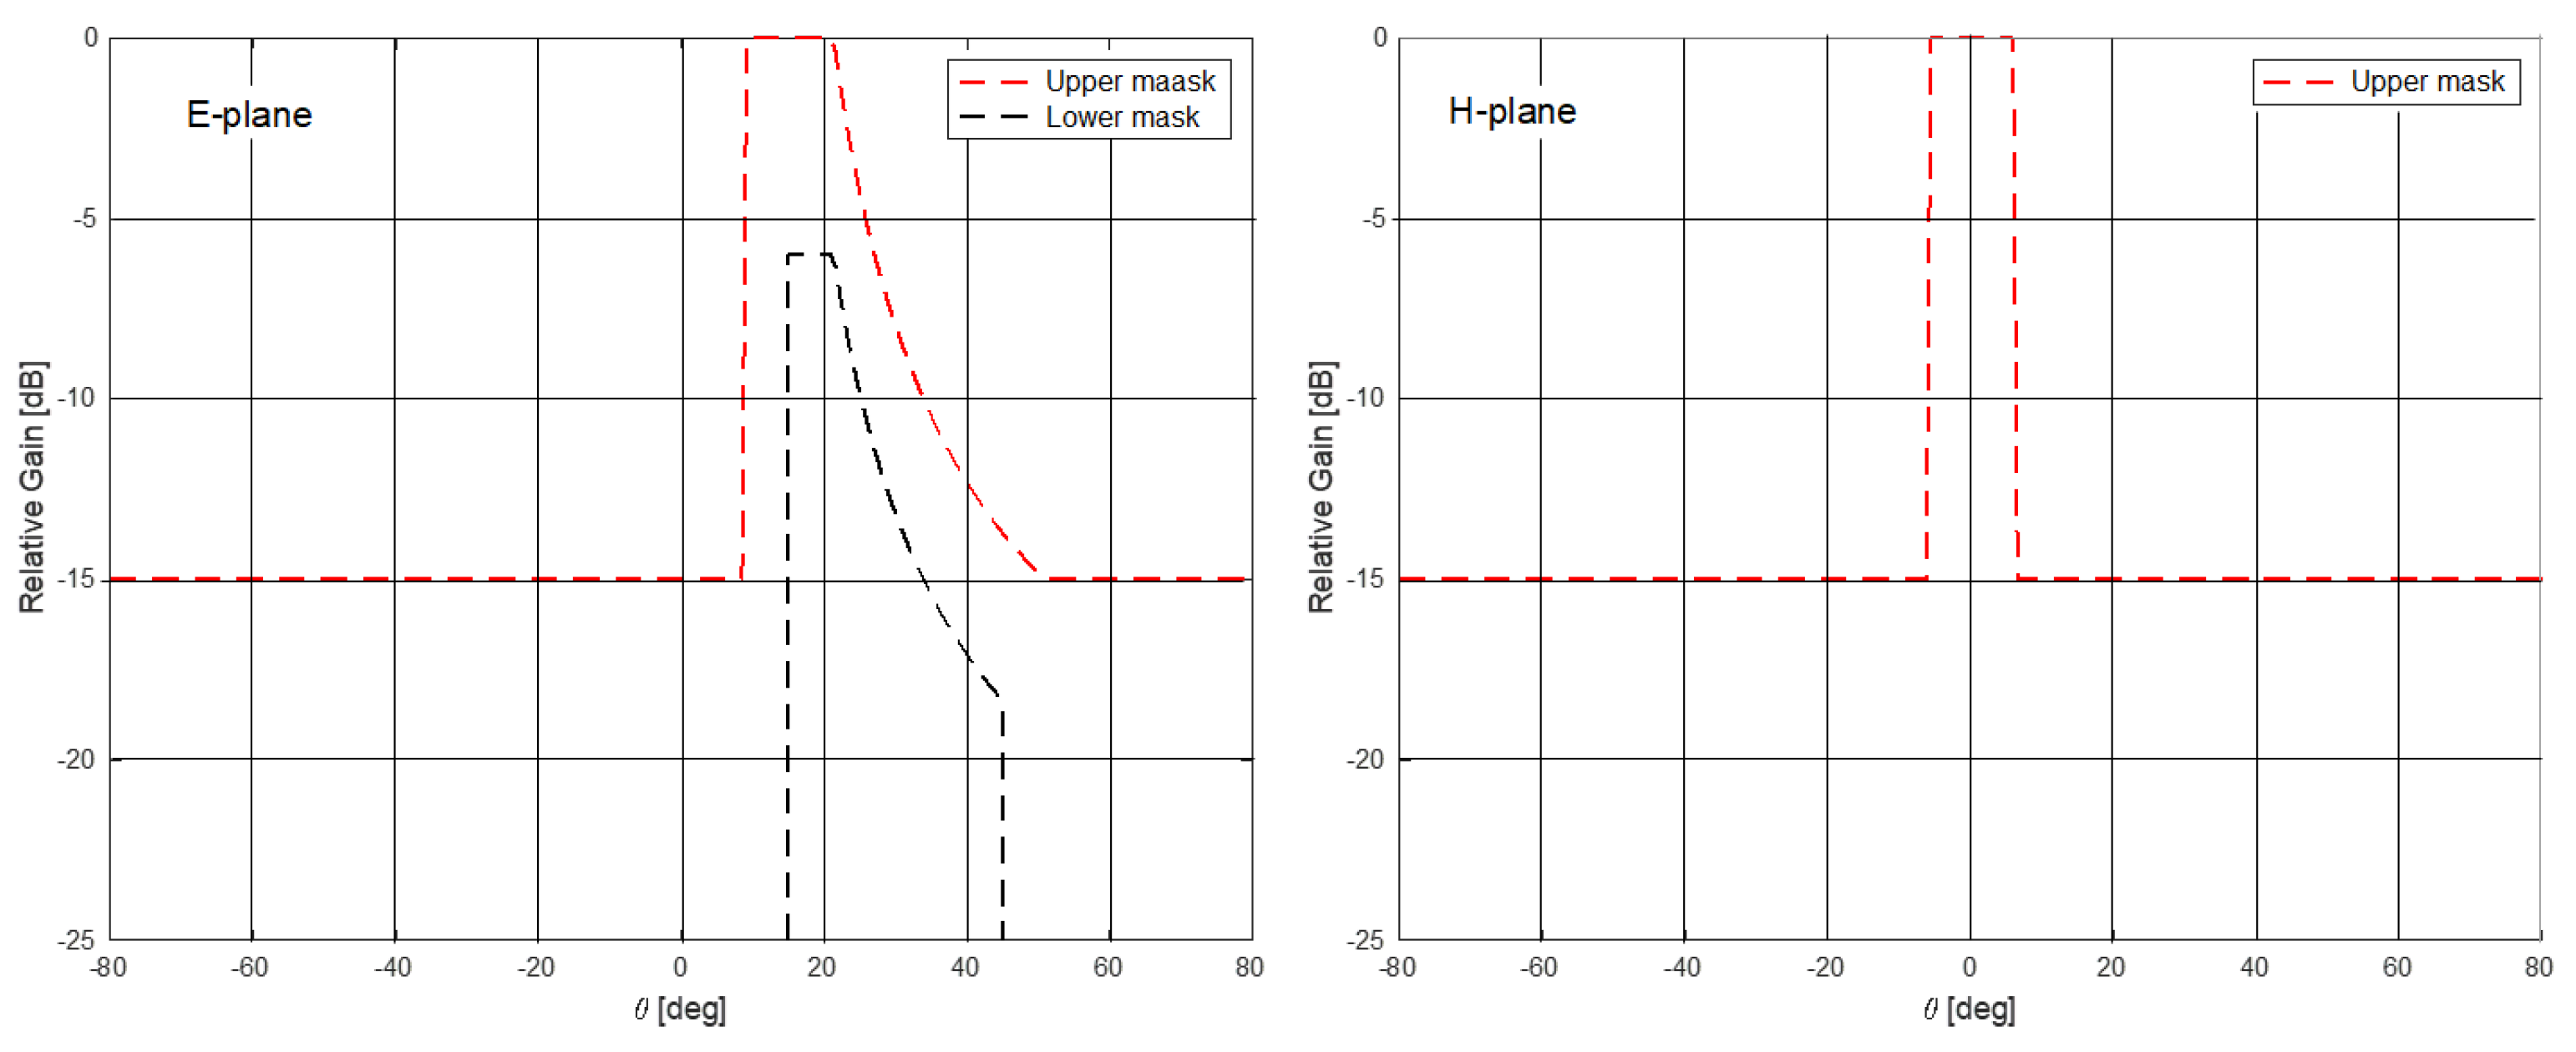
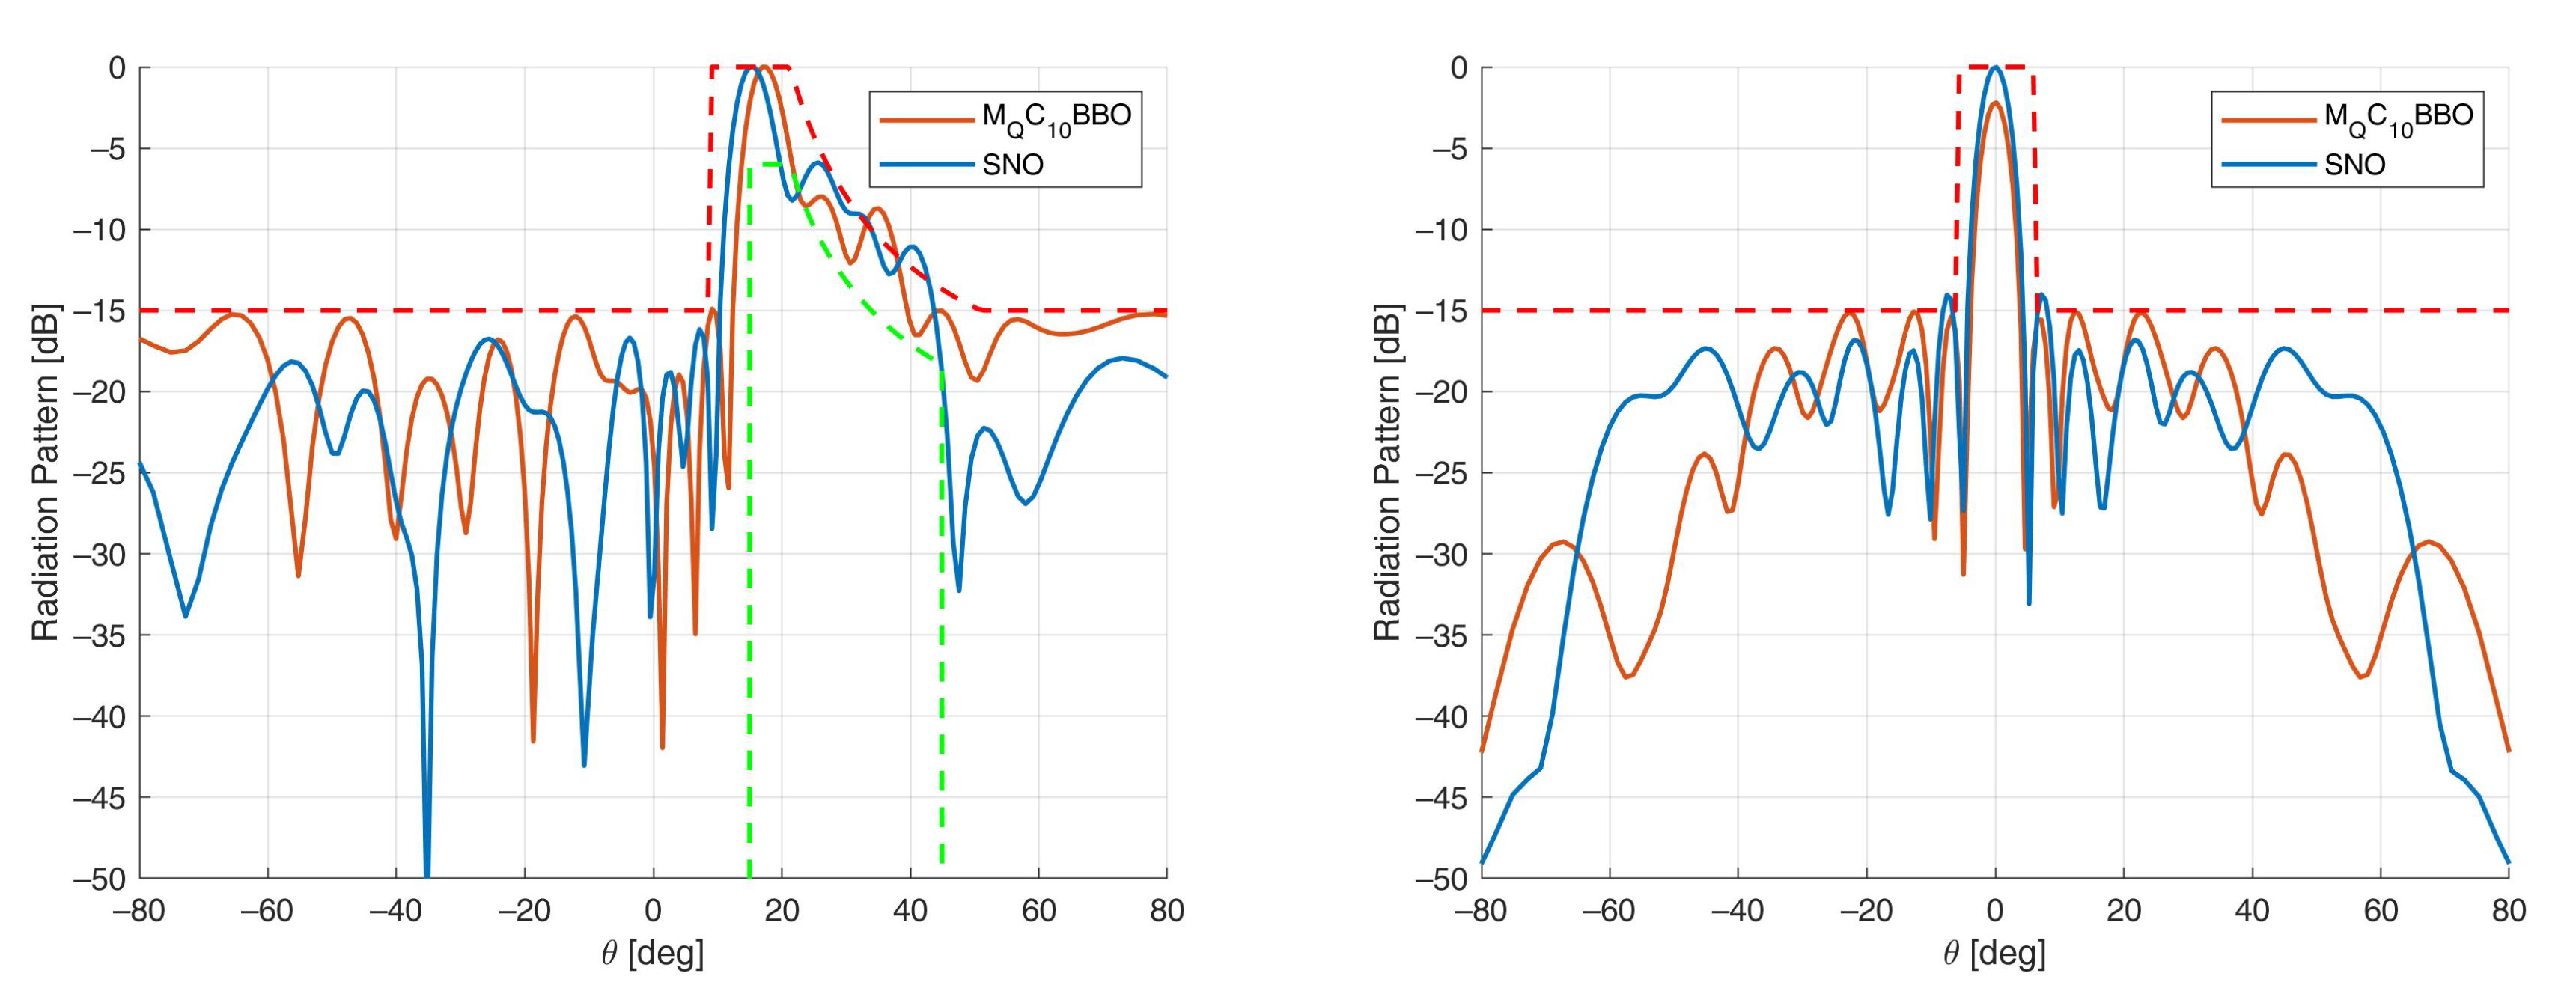
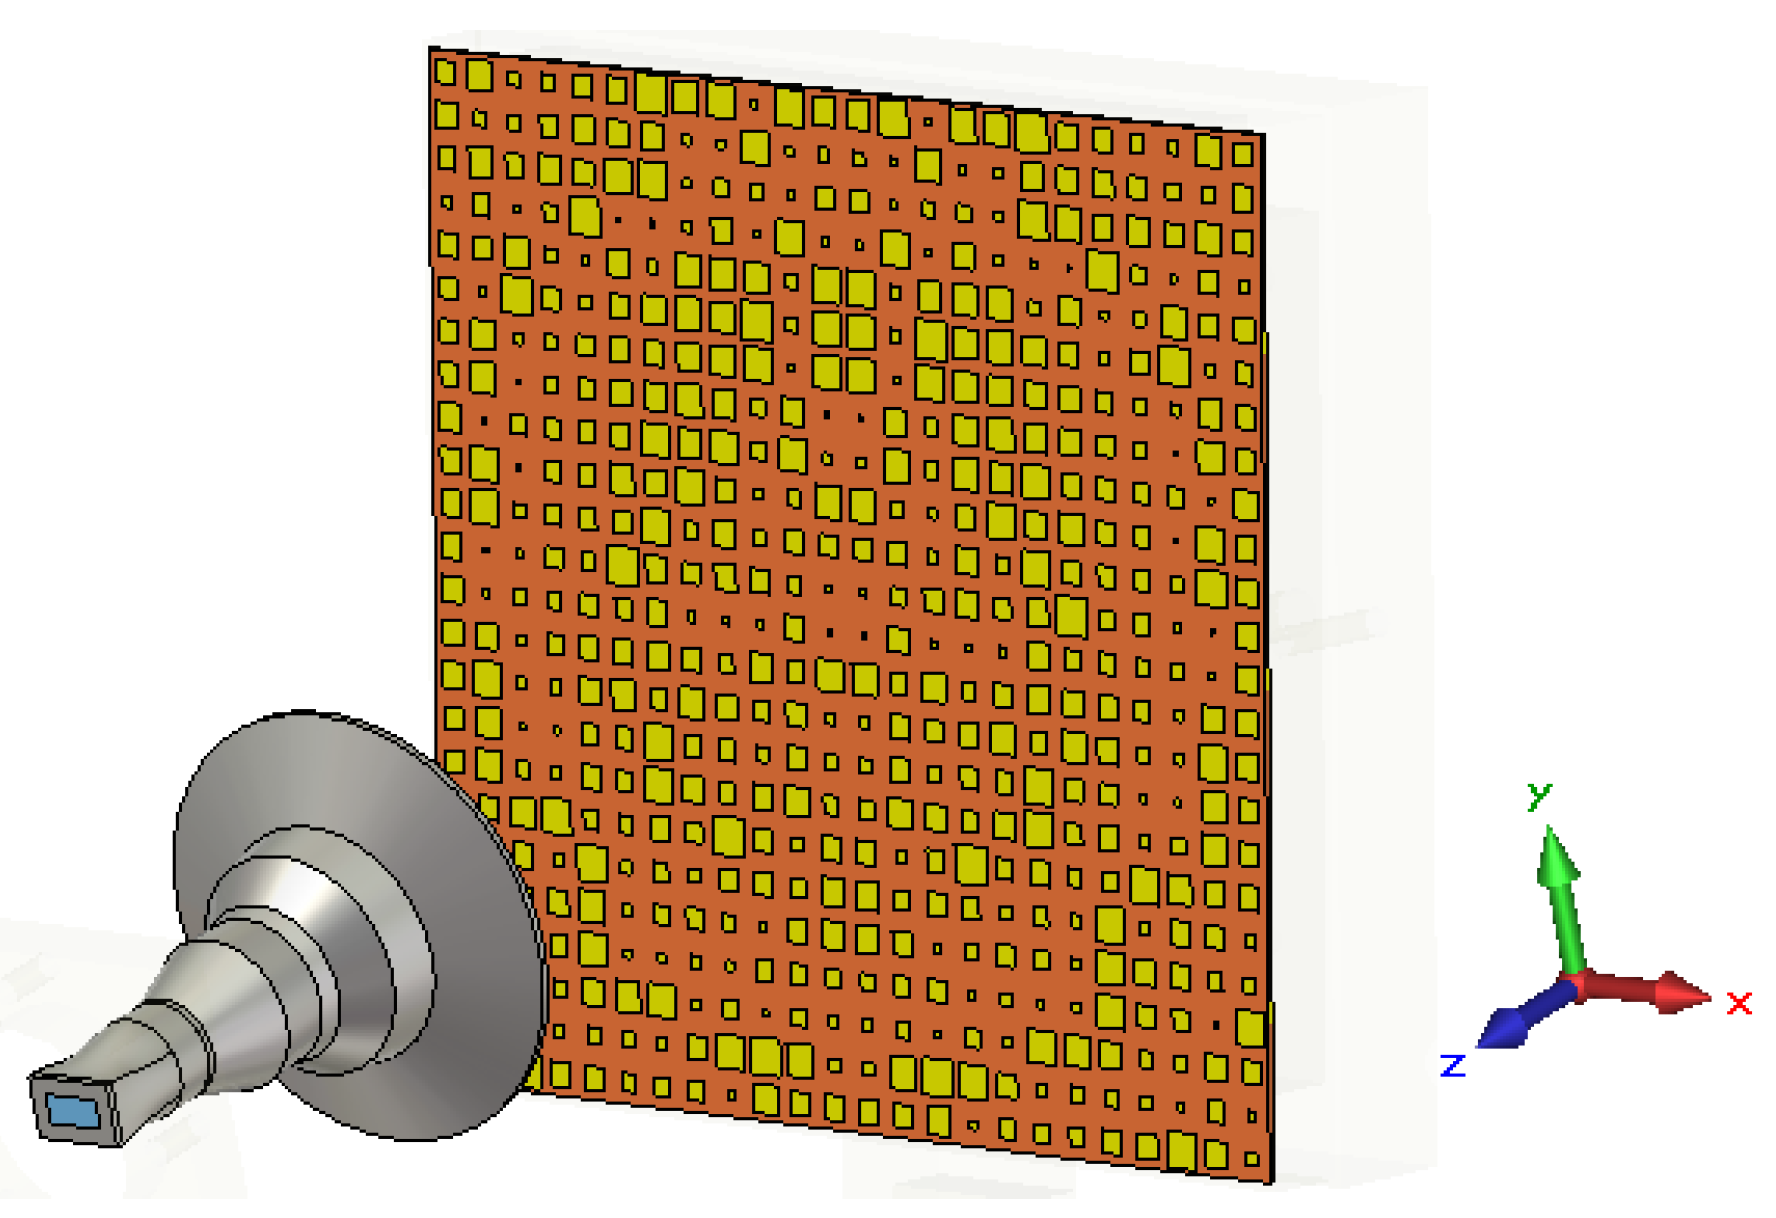
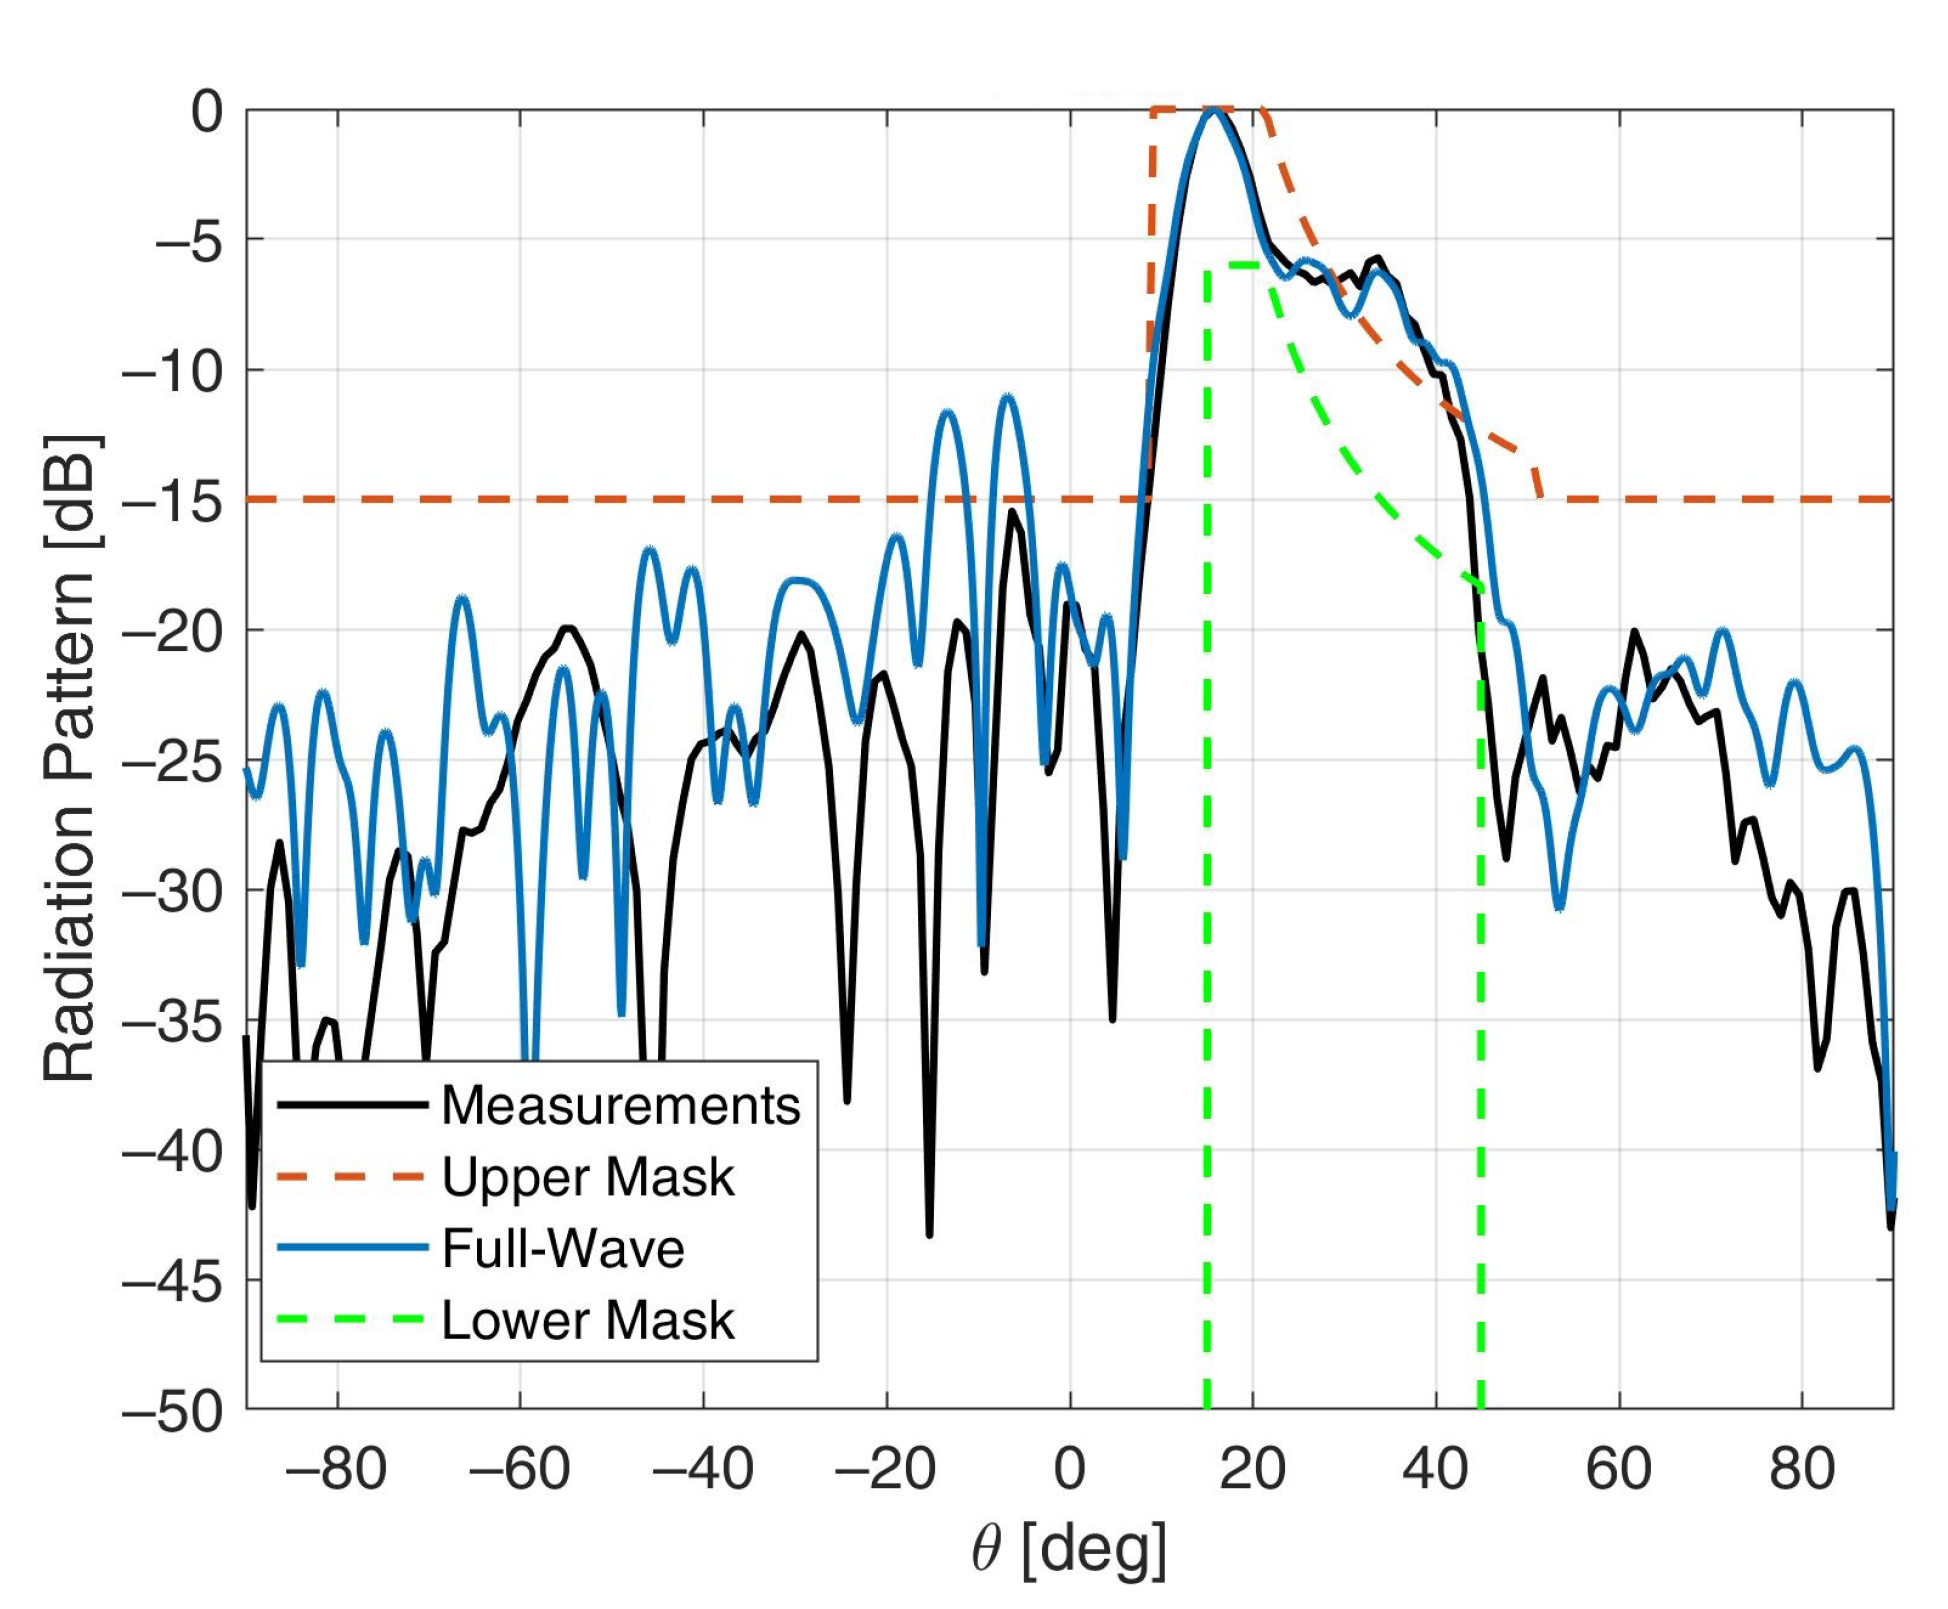
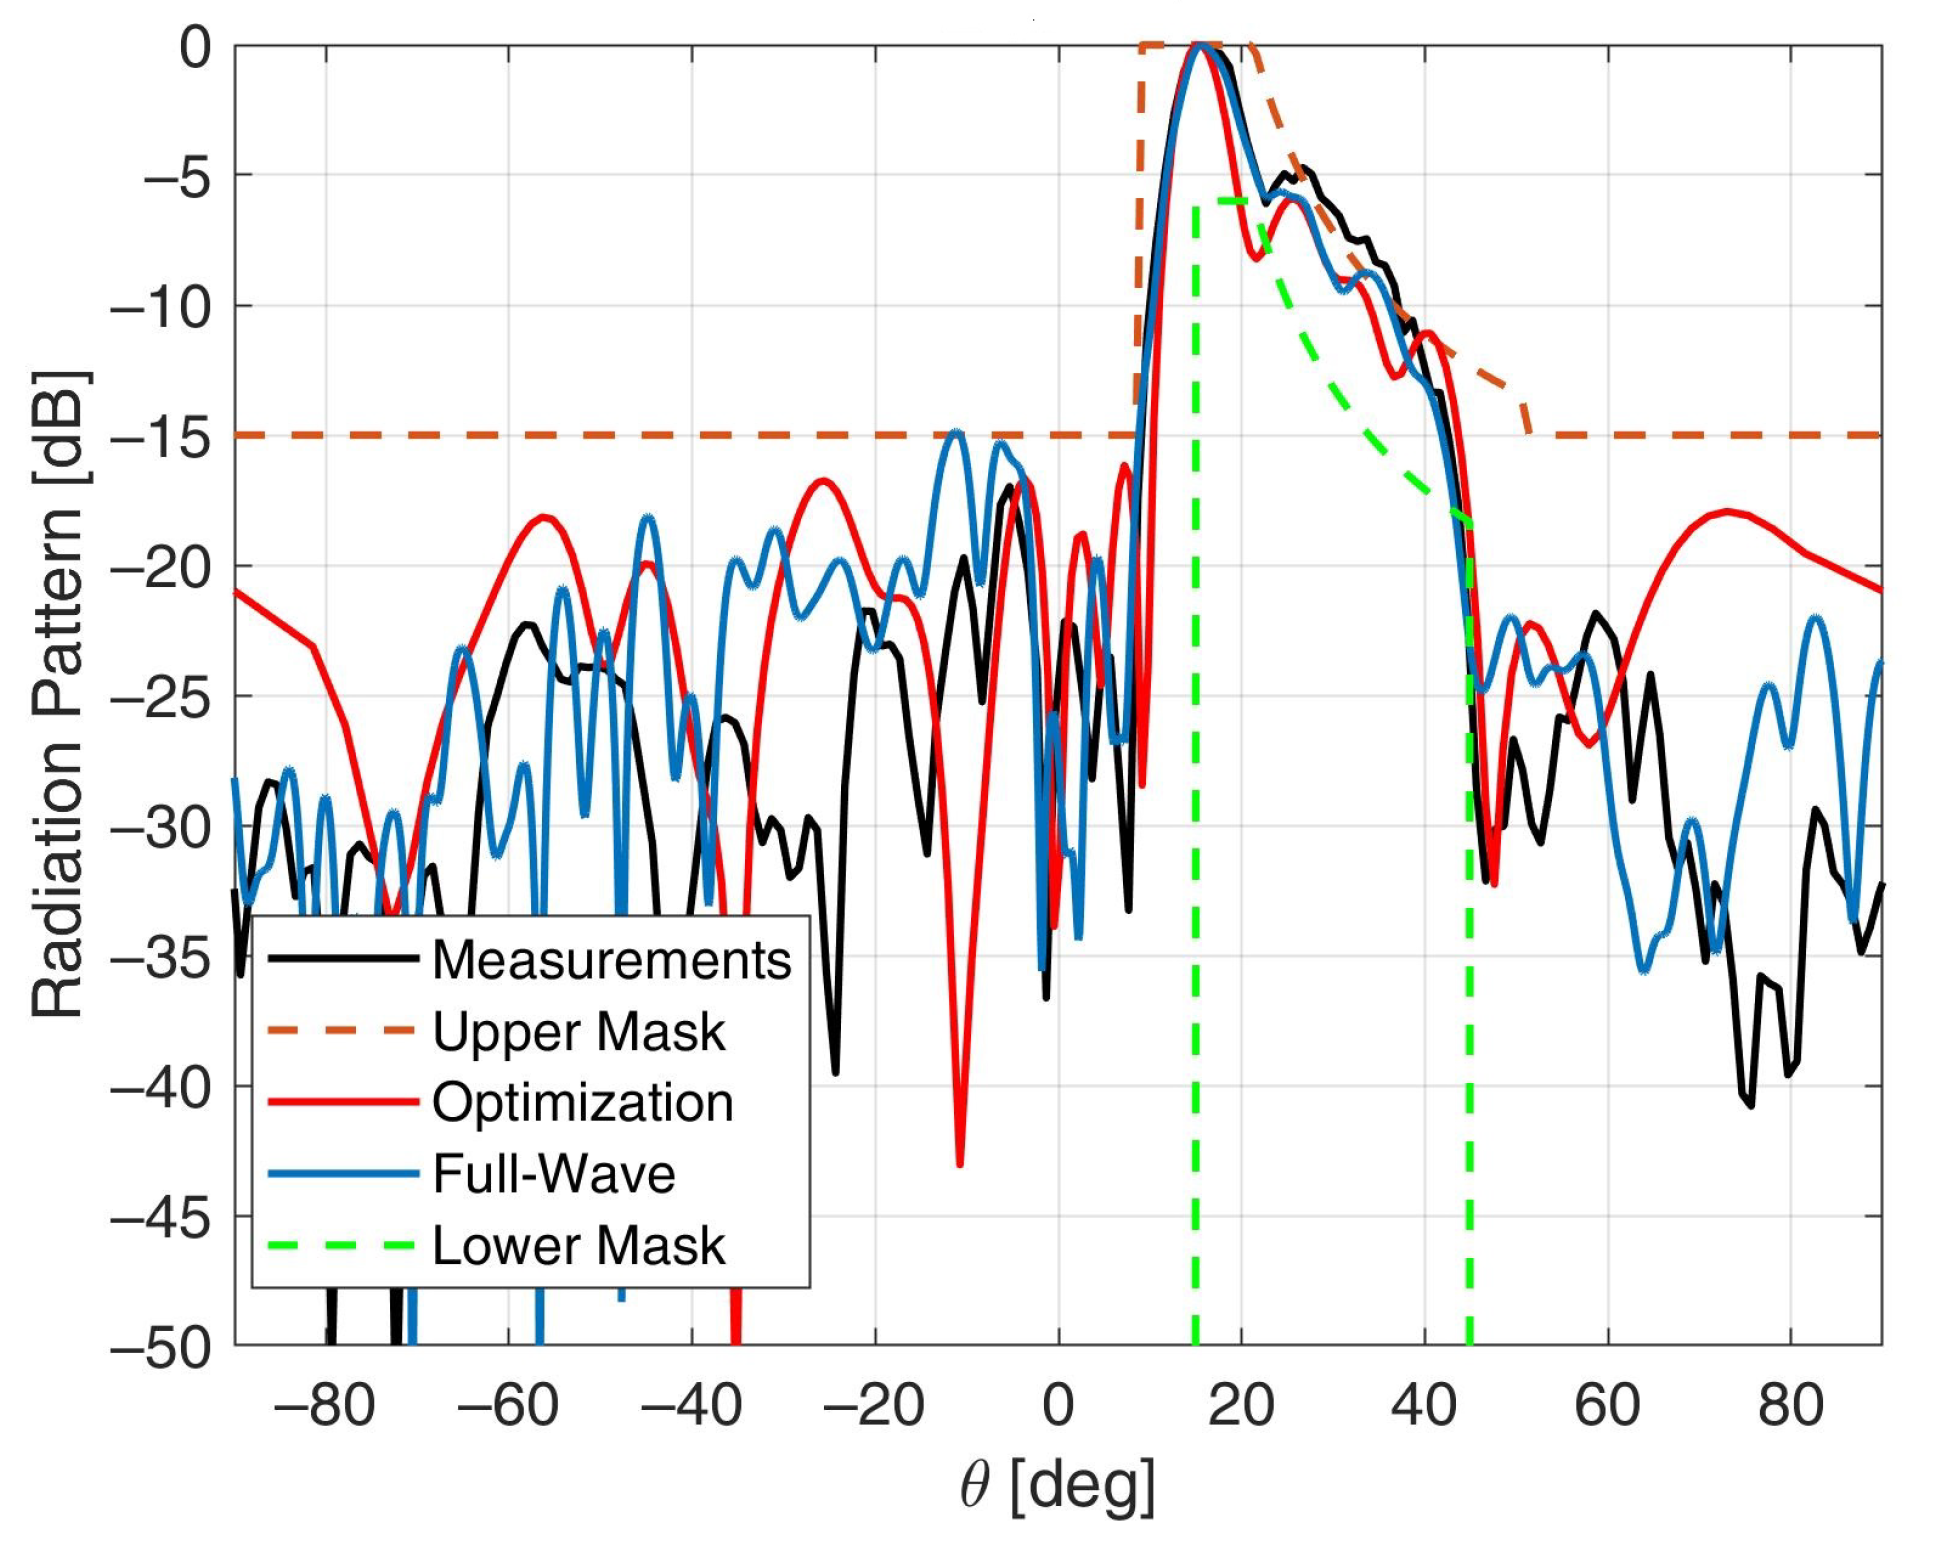
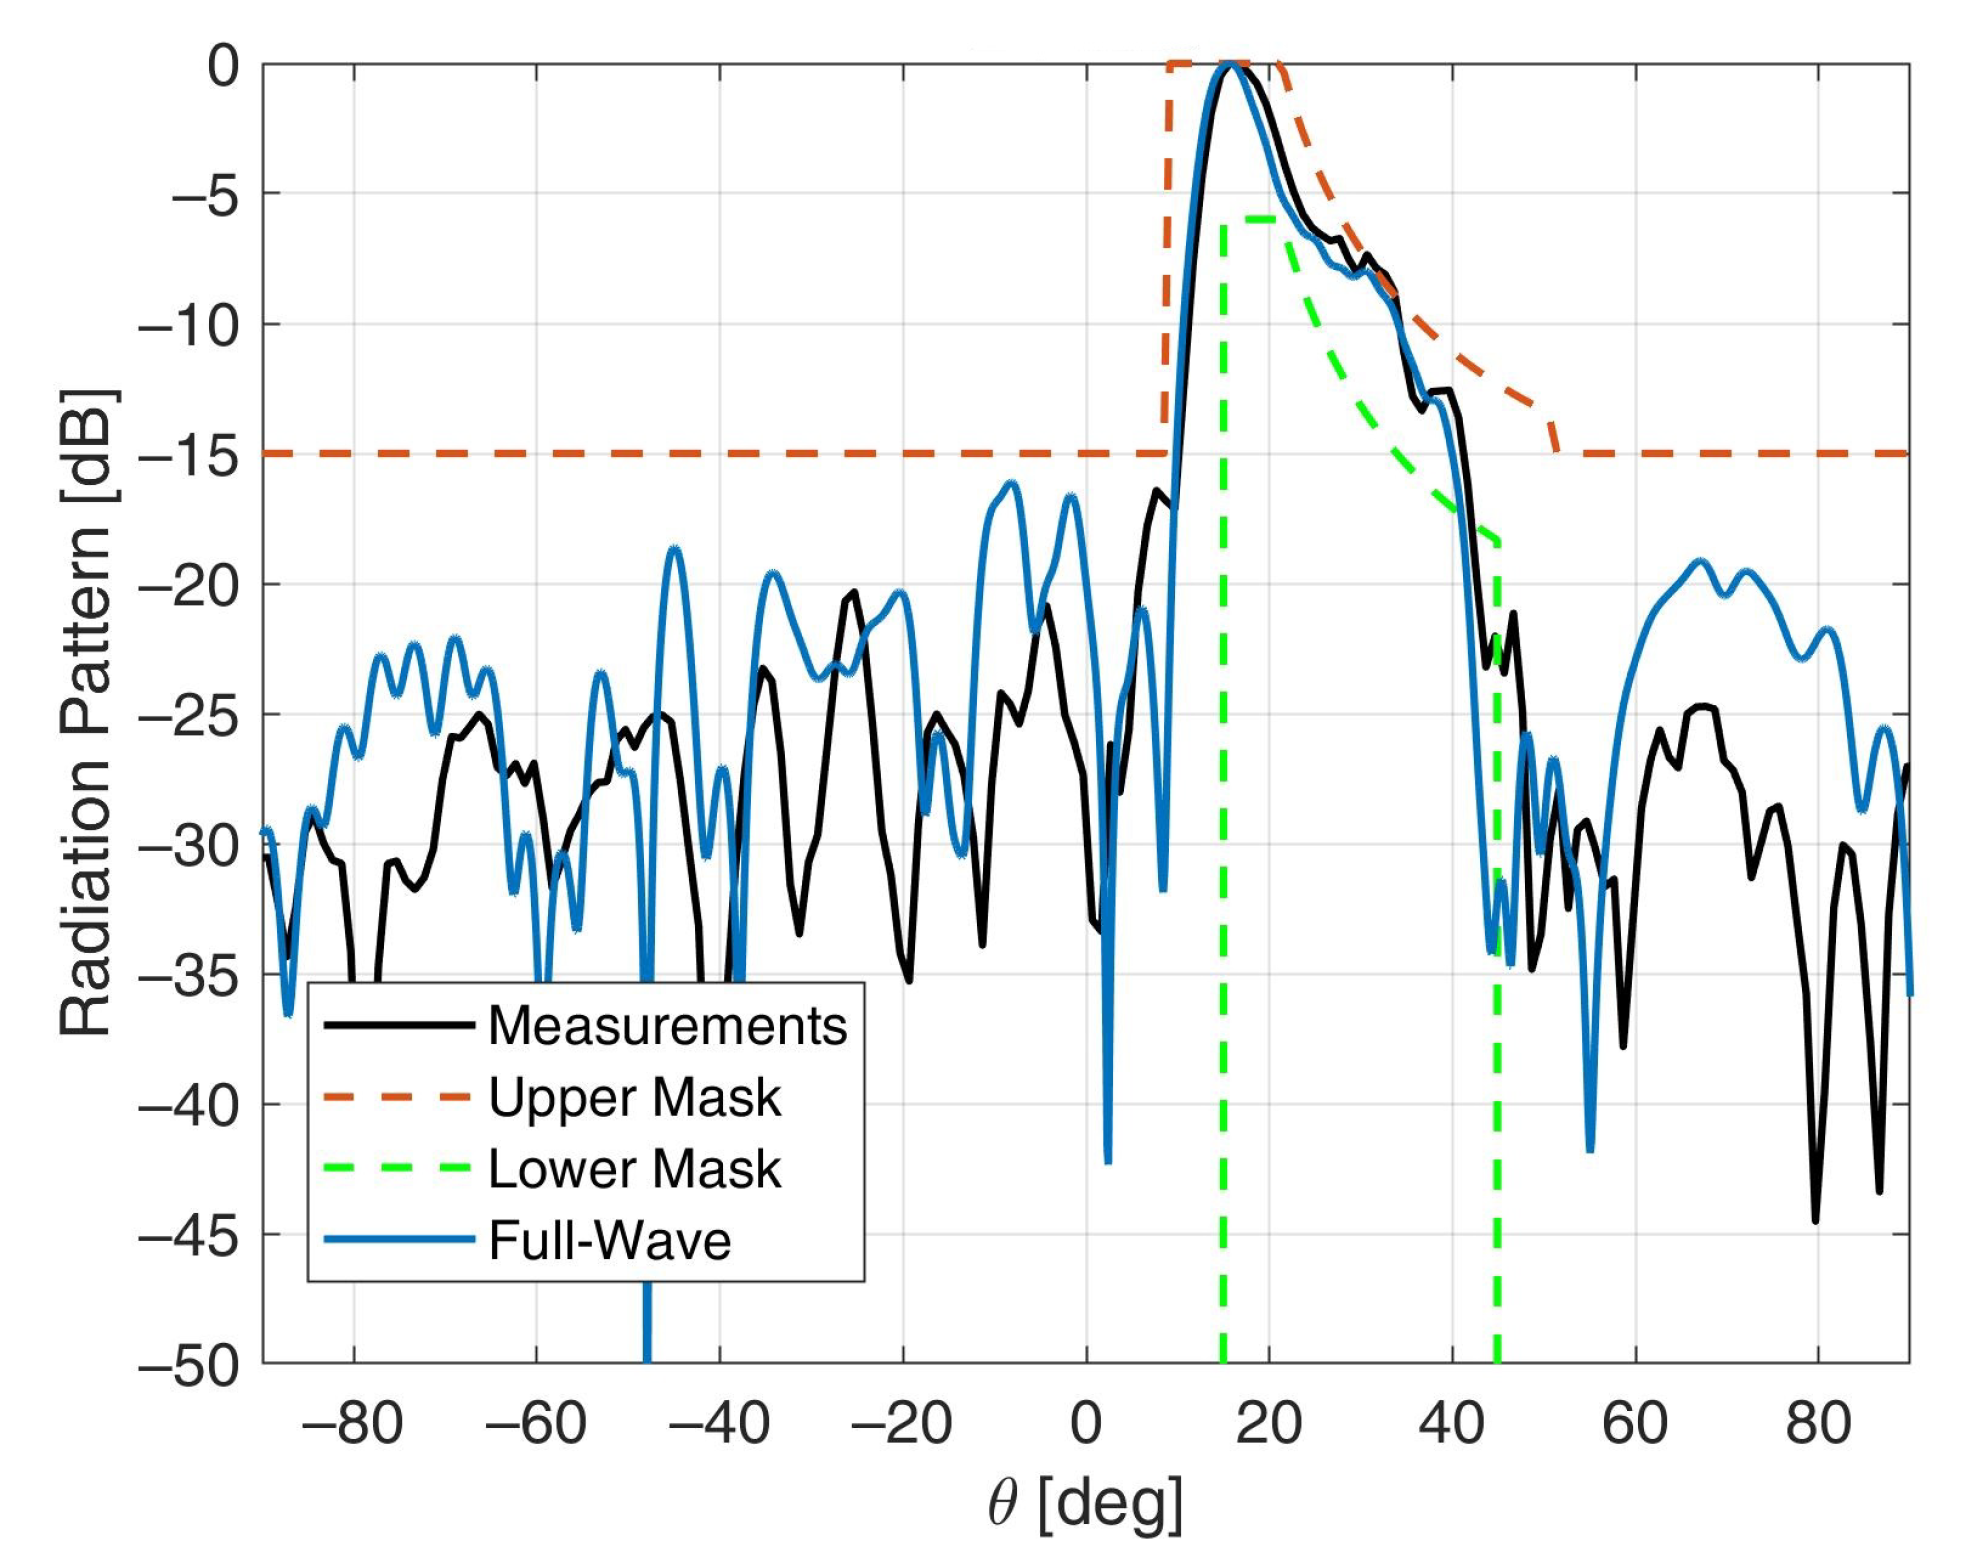
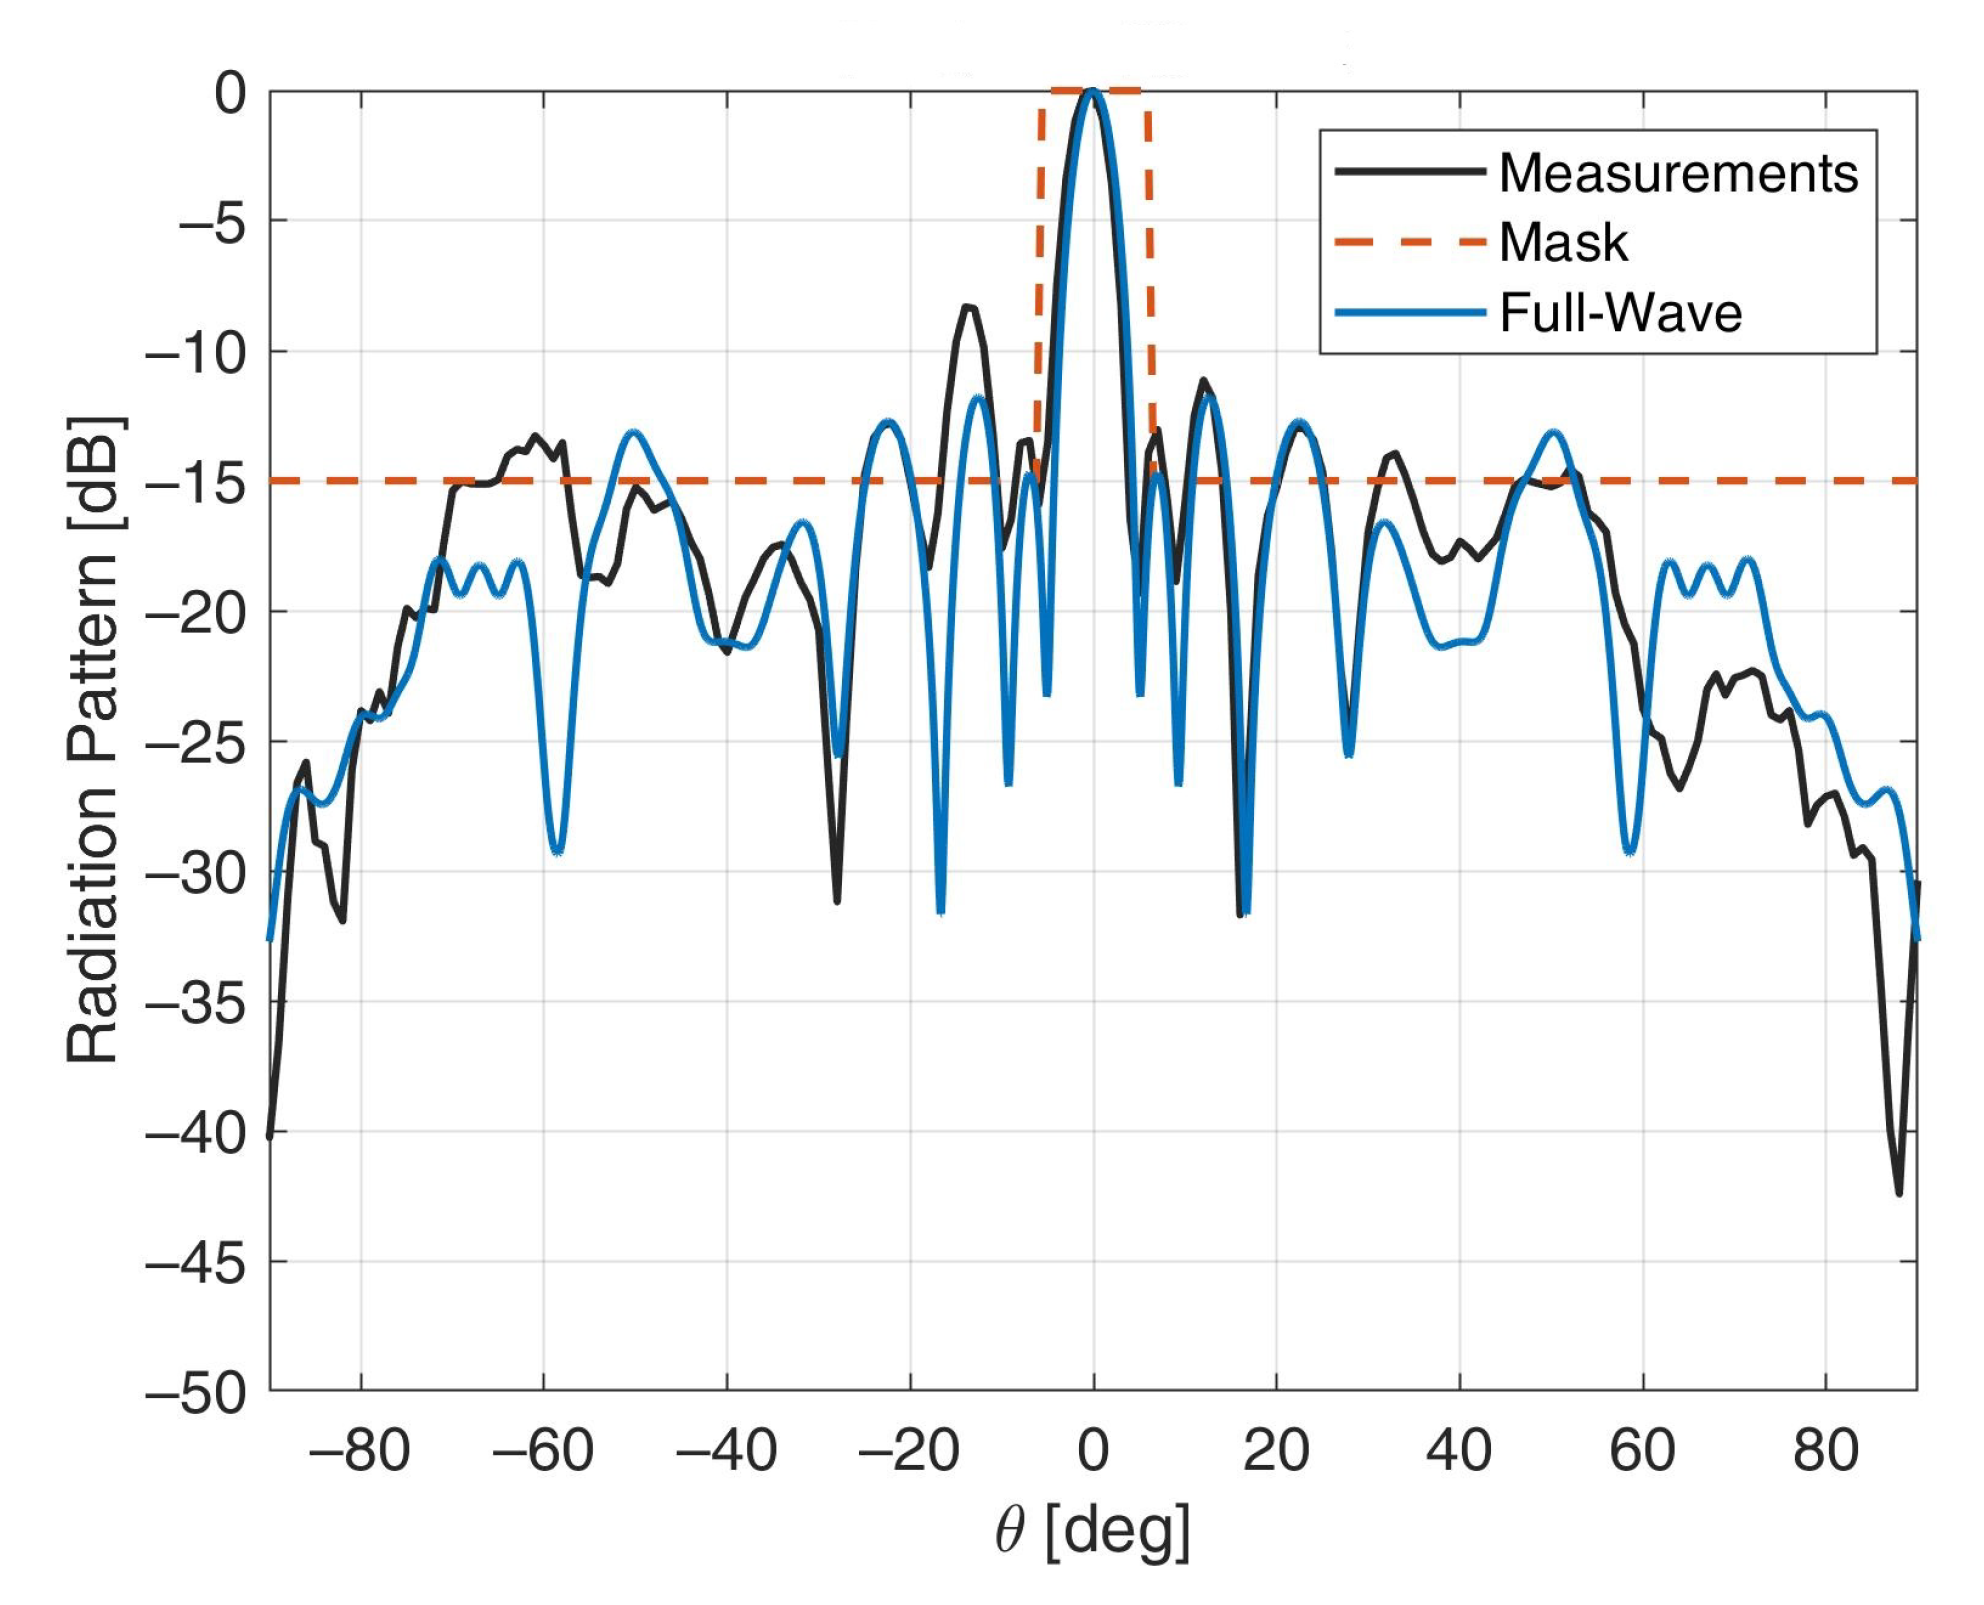
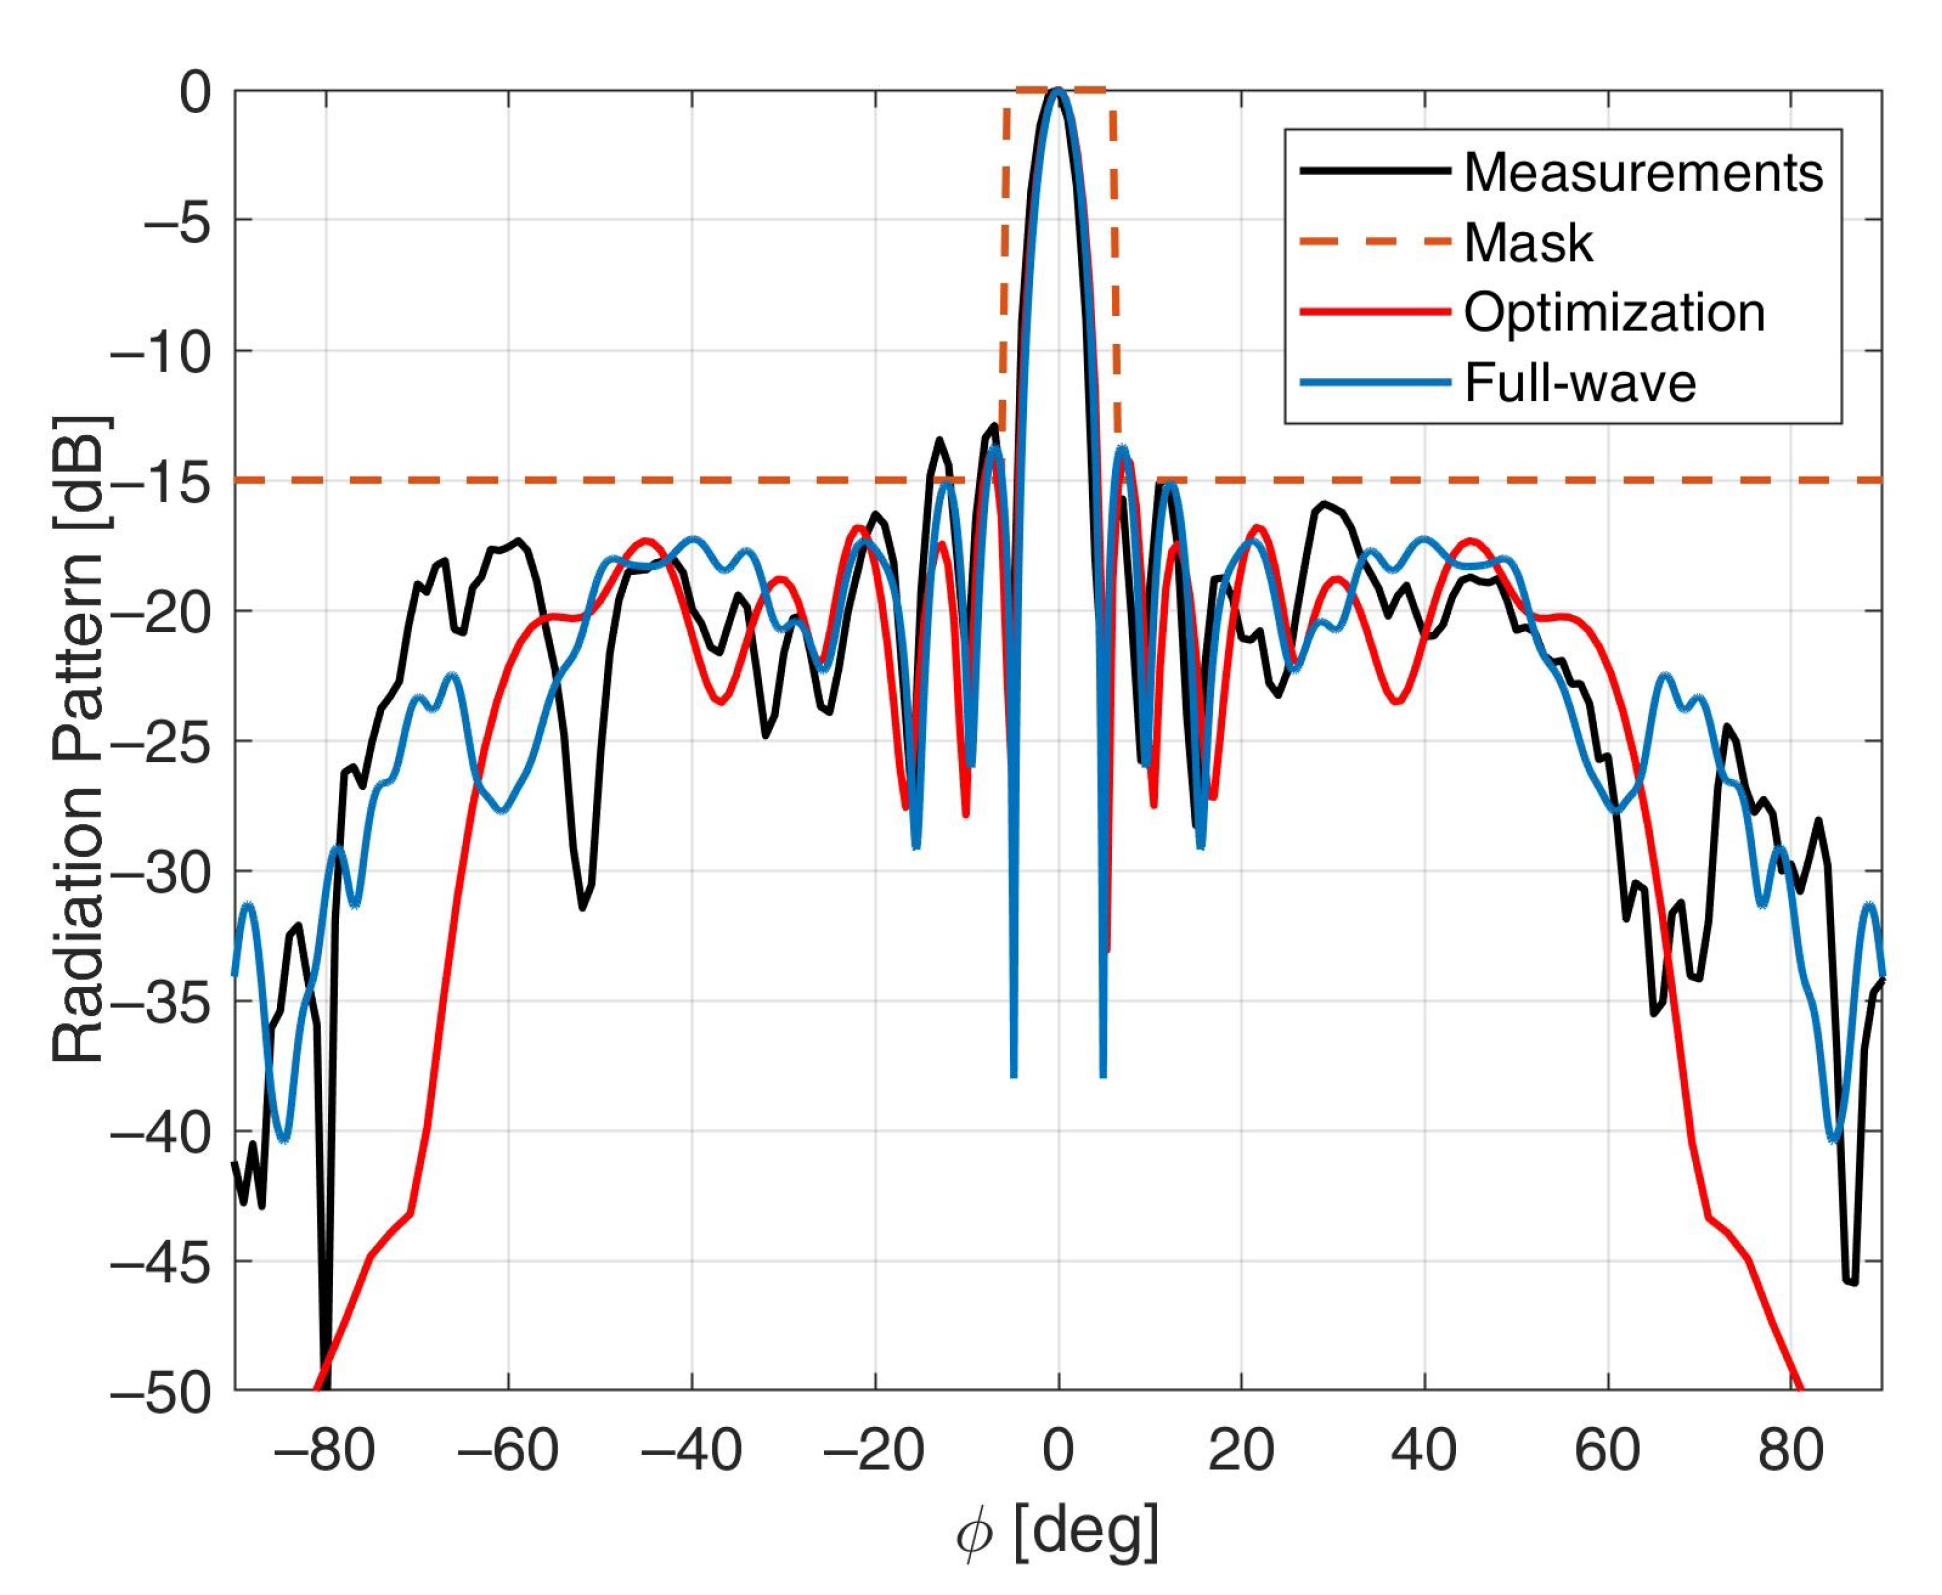
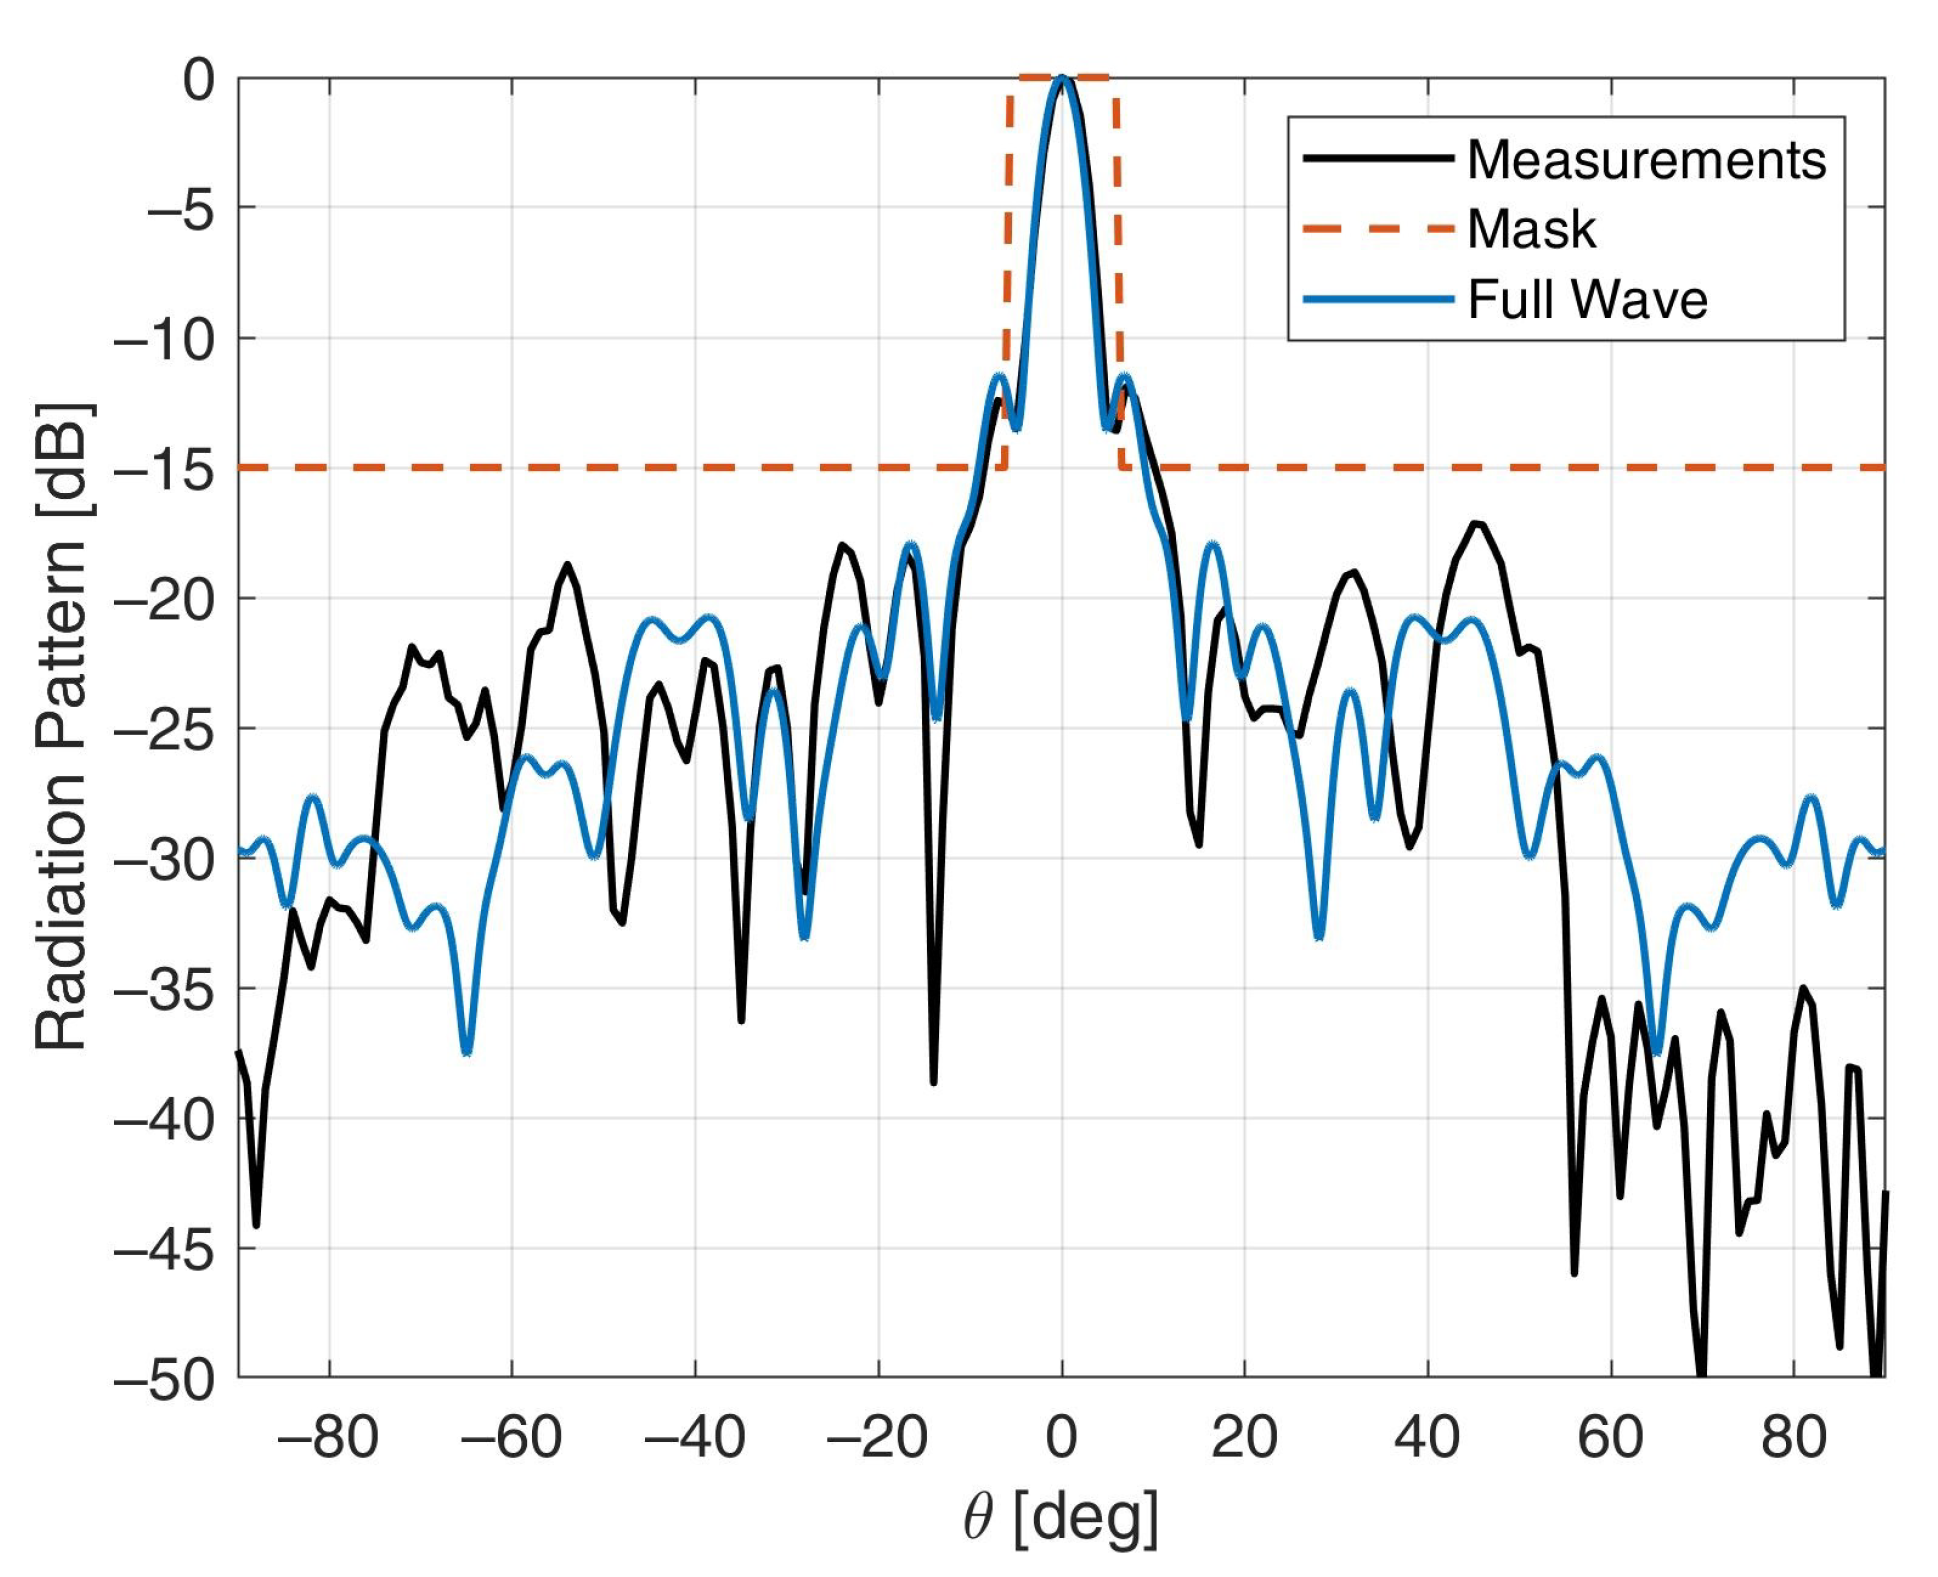
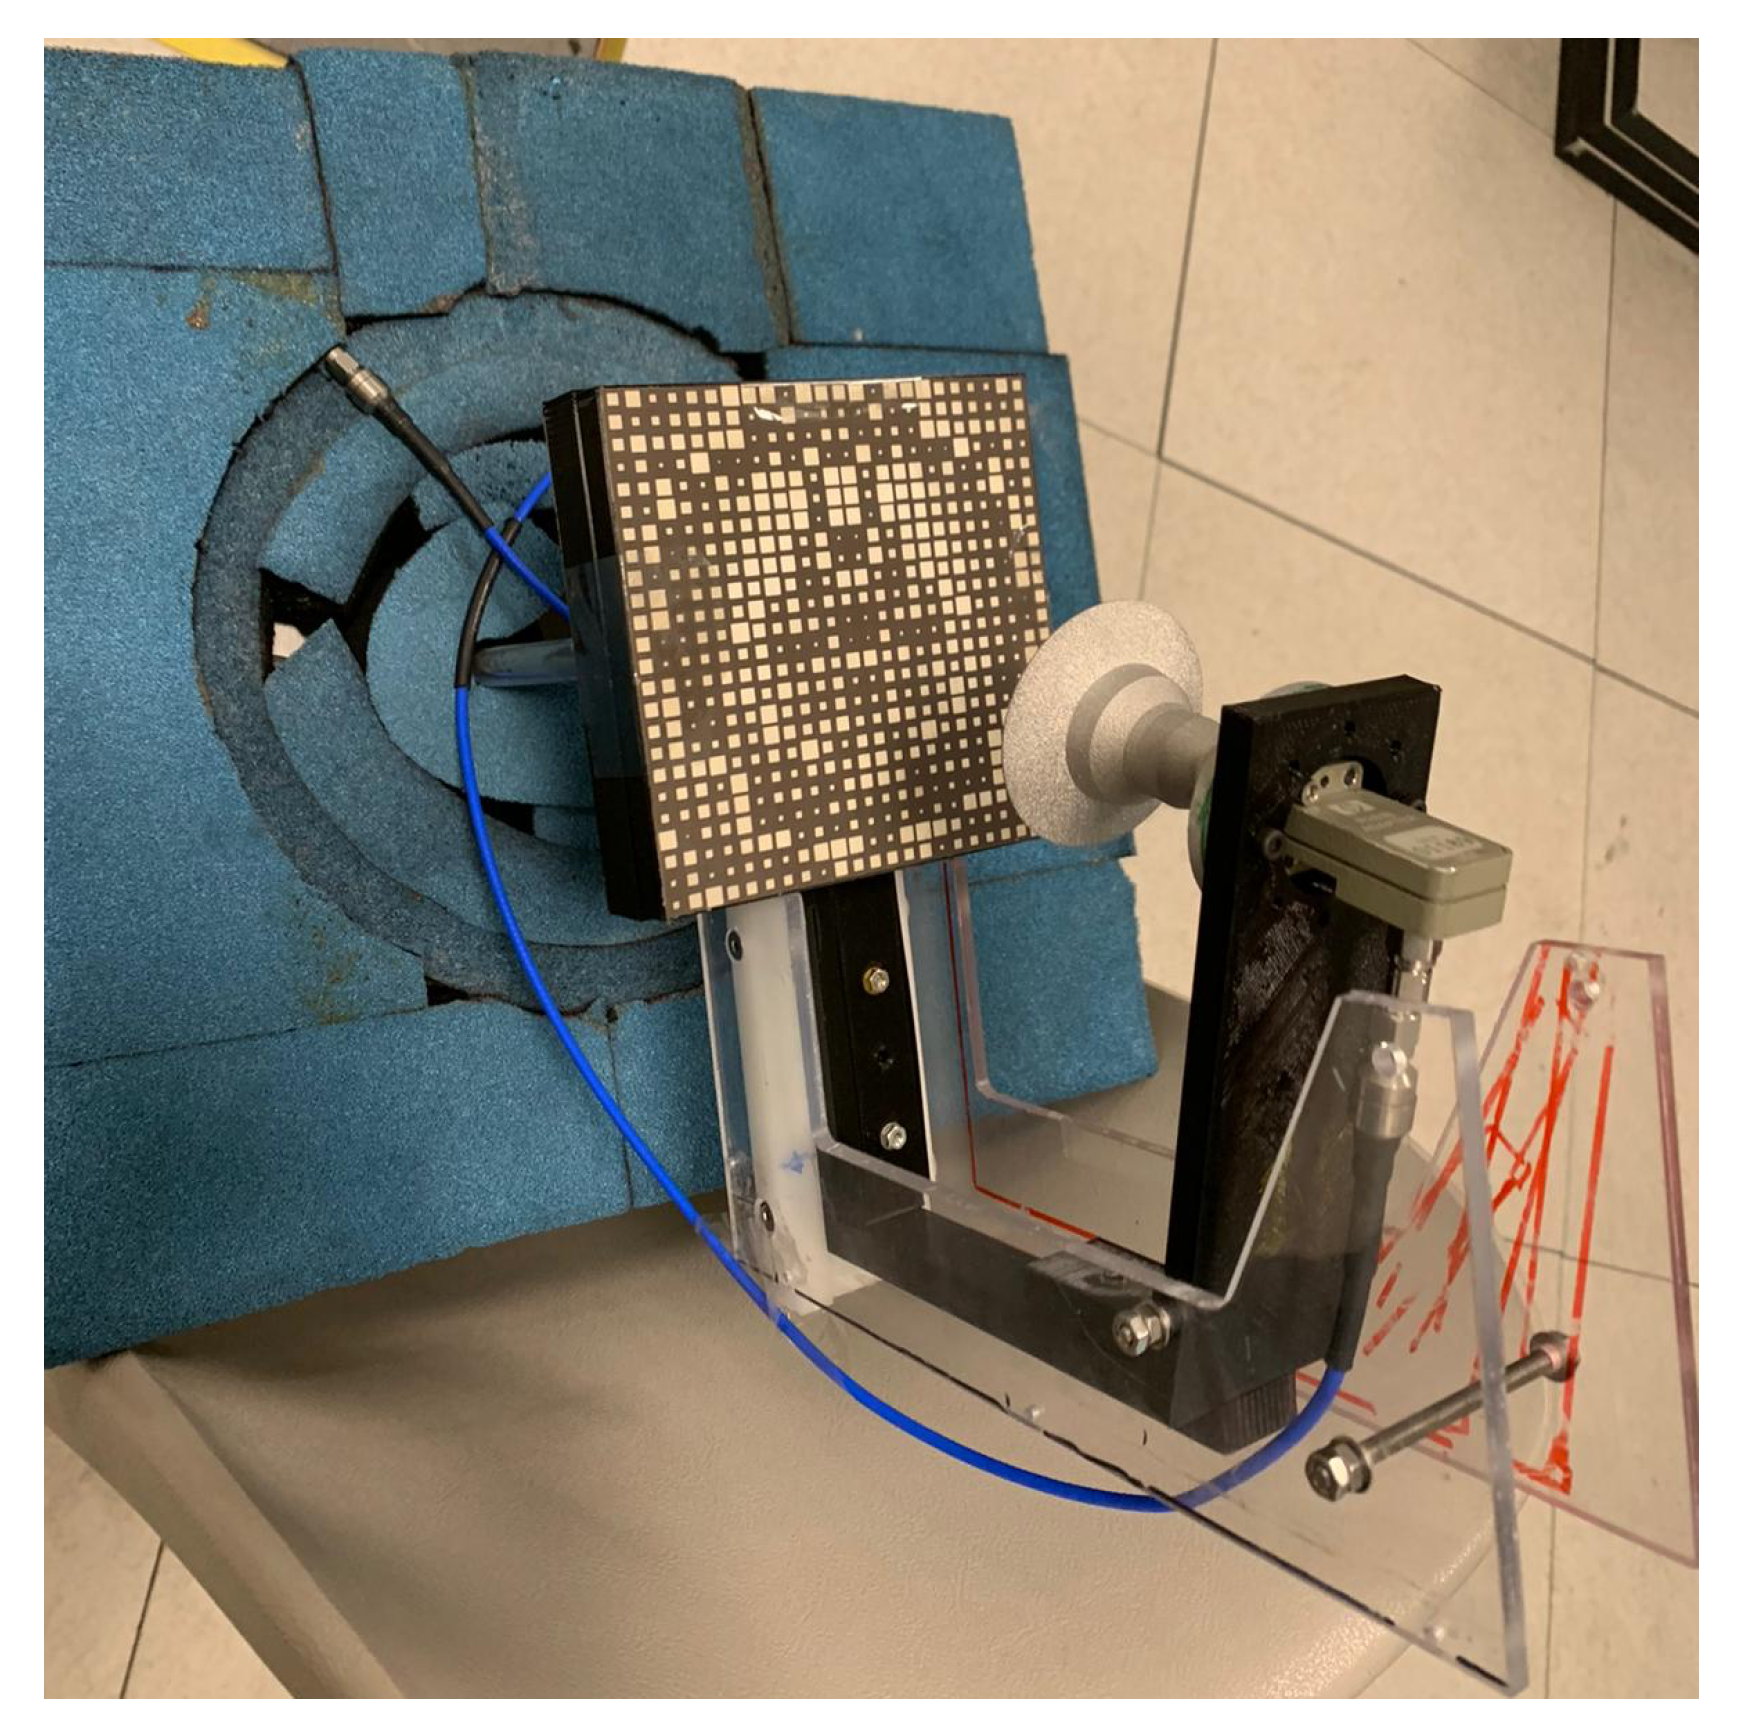
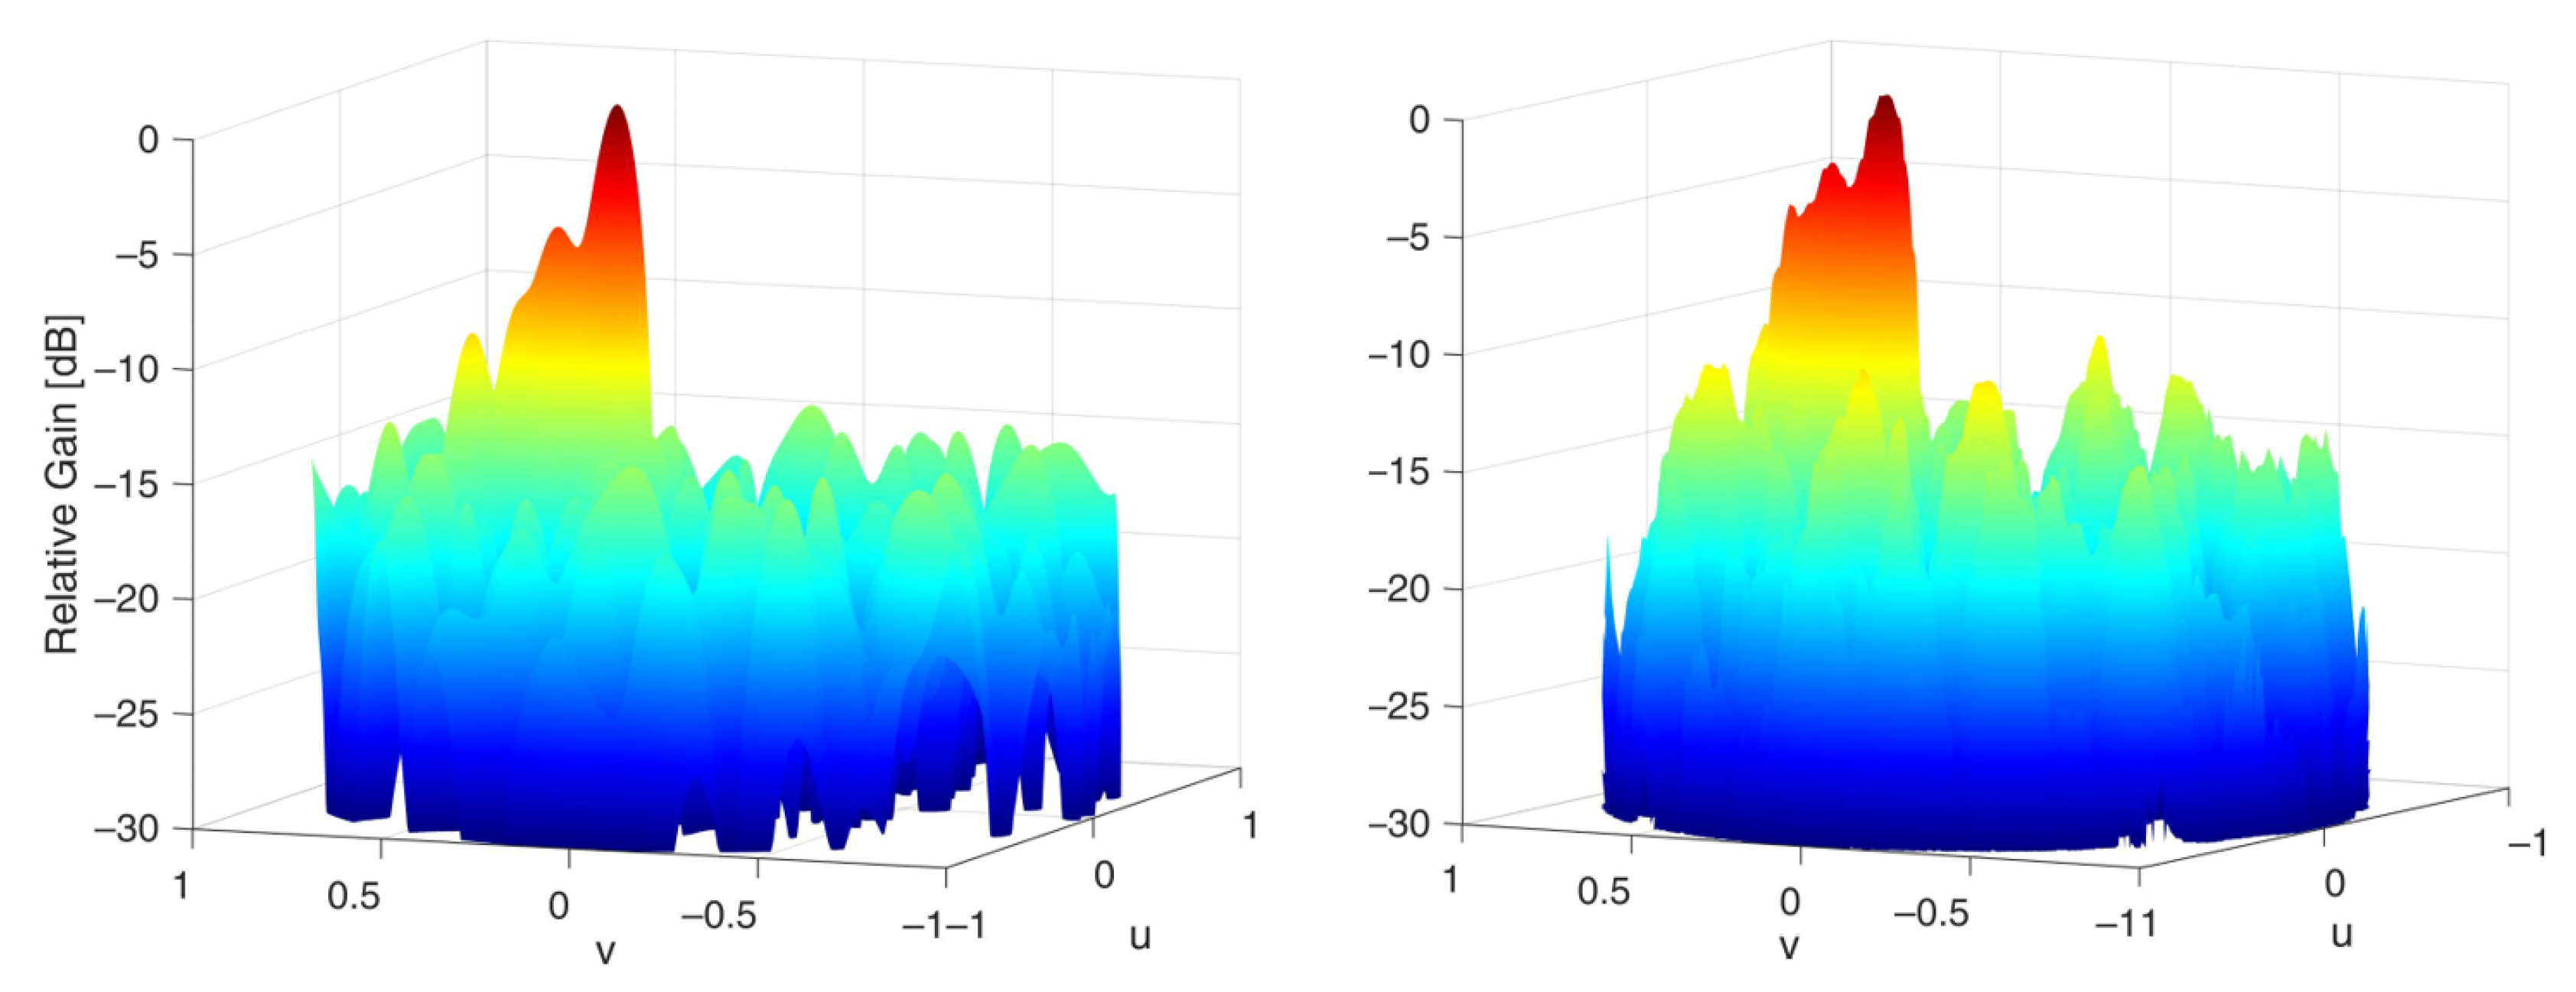
4.2. Numerical and Experimental Results

The RA layout obtained through the optimization process is shown in Figure 8. The antenna was then analyzed with the full-wave approach implemented by the commercial software CST Microwave Studio. The radiation patterns in the two principal planes computed at f 0 and at the two further frequencies of 29 and 31 GHz are plotted in Figure 9, Figure 10, Figure 11, Figure 12, Figure 13 and Figure 14, together with the masks. Since the optimization was carried out at 30 GHz, in the two Figure 10 and Figure 13 the patterns obtained at the end of the optimization are also shown. The results of the full-wave analysis satisfy almost everywhere the masks in the E plane, while the first SLLs do not respect the mask in the H plane, at 29 GHz. This happened due to the fact that the optimization was carried out only at 30 GHz: in fact, it is out of the aim of the present work to take into account the effect of the frequency, even if in RAs adopting a simple re-radiating element, as the square patch used here, is not negligible.
In view of the good results of the antenna full-wave simulation, a prototype, shown in Figure 15, has been manufactured. The boom has been realized using a 3D printed technique, just to reduce the cost of the supporting structure and the weight of the entire antenna. The antenna was tested in the spherical near field test range in the anechoic chamber of Politecnico di Torino [40]; with an angular sampling of 1 in both azimuth and elevation. Actually, the size of the sphere (about 2 m radius) was such that the far field conditions were already fulfilled, so that the transformed patterns were equal to those obtained from raw measurements, without any spherical transform.
In Figure 9, Figure 10, Figure 11, Figure 12, Figure 13 and Figure 14 the measured radiation patterns in the two planes and for the selected frequencies are also plotted. At f 0 they respect the masks almost everywhere in both planes, and the small discrepancies with the numerical results can be ascribed to the fact that in the simulations, the effect of the boom, which is not so negligible with a compact structure like this, was not considered. Additionally, at the other frequencies there was very good agreement between the full-wave analysis and the measurements, even if at 29 GHz some SLLs exceeded the mask, the reason for which has already been pointed out when discussing the results of the full-wave simulation.
Finally, in Figure 16 the 3D radiation patterns at 30 GHz obtained at the end of the optimization process and through the prototype experimental characterization are shown: they confirm the effectiveness of the adopted procedure, and in particular of the choice to control the radiation pattern in the whole θ ϕ -plane, which allows one to avoid the increasing of side lobes out of the principal planes.

5. Conclusions

In conclusion, it is possible to state that Social Network Optimization can be successfully applied to the design of a shaped-beam reflectarray with a cosecant squared pattern; the results presented in this paper show fast convergence of the solution and very good radiation features. The antenna’s performance has been validated by its full-wave analysis and by the experimental characterization of a prototype. In view of all that, the method introduced here will be applied to more complex RA configurations. It will also be used for the antenna frequency behavior, and for the possibility of radiating multi-beams. These extensions will be developed in future works.

Author Contributions

Conceptualization, M.B., A.N., R.E.Z. and P.P.; methodology, M.B., A.N., R.E.Z. and P.P.; software, M.B., A.N.; validation, M.B., A.N., R.E.Z. and P.P.; formal analysis, M.B., A.N., R.E.Z. and P.P.; investigation, M.B., A.N., R.E.Z. and P.P.; resources, P.P.; data curation, M.B., A.N., R.E.Z. and P.P.; writing—original draft preparation, M.B., A.N., R.E.Z. and P.P.; writing—review and editing, M.B., A.N., R.E.Z. and P.P.; visualization, M.B., A.N., R.E.Z. and P.P.; supervision, P.P., R.E.Z..All authors have read and agreed to the published version of the manuscript.

Funding

This research received no external funding.

Acknowledgments

The authors would like to thank Gianluca Dassano from the Politecnico di Torino for his valuable help in the experimental characterization of the antenna prototype.

Conflicts of Interest

The authors declare no conflict of interest.

References

  1. Simon, D. Evolutionary Optimization Algorithms; John Wiley & Sons: Hoboken, NJ, USA, 2013. [Google Scholar]
  2. Johnson, J.M.; Rahmat-Samii, V. Genetic algorithms in engineering electromagnetics. IEEE Antennas Propag. Mag. 1997, 39, 7–21. [Google Scholar] [CrossRef] [Green Version]
  3. Robinson, J.; Rahmat-Samii, Y. Particle swarm optimization in electromagnetics. IEEE Trans. Antennas Propag. 2004, 52, 397–407. [Google Scholar] [CrossRef]
  4. Jia, X.; Lu, G. Hybrid Taguchi Binary Particle Swarm Optimization for Antenna Designs. IEEE Trans. Antennas Propag. 2003, 7, 1662–1664. [Google Scholar] [CrossRef]
  5. Montgomery, J. Scattering by an Infinite Periodic Array of Microstrip Elements. IEEE Trans. Antennas Propag. 1978, 26, 850–854. [Google Scholar] [CrossRef]
  6. Huang, J.; Encinar, J.A. Reflectarray Antennas; John Wiley & Sons: Hoboken, NJ, USA, 2013. [Google Scholar]
  7. Nayeri, P.; Yang, F.; Elsherbeni, A.Z. Reflectarray Antennas: Theory, Designs and Applications; Wiley Online Library: Hoboken, NJ, USA, 2018. [Google Scholar]
  8. Robinson, J.; Rahmat-Samii, Y. X/Ku Dual-Band Single-Layer Reflectarray Antenna. IEEE Antennas Wirel. Propag. Lett. 2019, 18, 338–342. [Google Scholar]
  9. Encinar, J.A.; Zornoza, J.A. Broadband Design of Three-Layer Printed Reflectarrays. IEEE Trans. Antennas Propag. 2003, 7, 1662–1664. [Google Scholar] [CrossRef]
  10. Vita, P.D.; Freni, A.; Dassano, G.; Pirinoli, P.; Zich, R. Broadband Element for High-Gain Single-Layer Printed Reflectarray Antenna. Electron. Lett. 2007, 43, 1247–1249. [Google Scholar] [CrossRef] [Green Version]
  11. Artiga, X. Row-Column Beam Steering Control of Reflectarray Antennas: Benefits and Drawbacks. IEEE Antennas Wirel. Propag. Lett. 2017, 17, 271–274. [Google Scholar] [CrossRef] [Green Version]
  12. Yang, H.; Yang, F.; Xu, S.; Li, M.; Cao, X.; Gao, J.; Zheng, Y. A Study of Phase Quantization Effects for Reconfigurable Reflectarray Antennas. IEEE Antennas Wirel. Propag. Lett. 2016, 16, 302–305. [Google Scholar] [CrossRef]
  13. Ohsawa, T.; Maruyama, T.; Omiya, M.; Suematsu, N. Design of Dual-frequency Reflectarray Using Particle Swam Optimization. In Proceedings of the 2018 International Symposium on Antennas and Propagation (ISAP), Busan, Korea, 23–26 October 2018; pp. 1–2. [Google Scholar]
  14. Sakagawa, K.; Inoue, H.; Higashi, D.; Deguchi, H.; Tsuji, M. Design of a Dual-Band Single Layer Reflectarray with Arbitrarily-Shaped Elements. In Proceedings of the 2020 IEEE International Symposium on Antennas and Propagation and North American Radio Science Meeting, Montreal, QC, Canada, 5–10 July 2020; pp. 93–94. [Google Scholar]
  15. Li, C.; Xu, S.; Yang, F.; Li, M. Design and Optimization of a Mechanically Reconfigurable Reflectarray Antenna with Pixel Patch Elements Using Genetic Algorithm. In Proceedings of the 2019 IEEE MTT-S International Wireless Symposium (IWS), Guangzhou, China, 19–22 May 2019; pp. 1–3. [Google Scholar]
  16. Sheikh, S.; Kishk, A. Multifocal Reflectarray with Optimized Aperture Phase. In Proceedings of the 2020 IEEE International Symposium on Antennas and Propagation and North American Radio Science Meeting, Montreal, QC, Canada, 5–10 July 2020; pp. 137–138. [Google Scholar]
  17. Geaney, C.; Sun, J.; Hum, S.V.; Rogers, E.S.; Martinez-de-Rioja, E.; Encinar, J.A. Synthesis of a multi-beam dual reflectarray antenna using genetic algorithms. In Proceedings of the 2017 IEEE International Symposium on Antennas and Propagation & USNC/URSI National Radio Science Meeting, San Diego, CA, USA, 9–14 July 2017; pp. 1179–1180. [Google Scholar]
  18. Meng, X.; Nekovee, M.; Wu, D. Reconfigurable liquid crystal reflectarray metasurface for THz communications. In Proceedings of the Antennas and Propagation Conference 2019 (APC-2019), Birmingham, UK, 11–12 November 2019; pp. 1–6. [Google Scholar]
  19. Dieter, S.; Fischer, C.; Menzel, W. Design of a folded reflectarray antenna using Particle Swarm Optimization. In Proceedings of the 40th European Microwave Conference, Paris, France, 28–30 September 2010; pp. 731–734. [Google Scholar]
  20. Pirinoli, P.; Beccaria, M.; Massaccesi, A. MQC10-BBO Optimization Applied to Multi-beam Antenna Design. In Proceedings of the 2019 13th European Conference on Antennas and Propagation (EuCAP), Krakow, Poland, 31 March–5 April 2019; pp. 1–3. [Google Scholar]
  21. Simon, D. Biogeography-Based Optimization. IEEE Trans. Evol. Comp. 2009, 12, 702–713. [Google Scholar] [CrossRef] [Green Version]
  22. Chang, D.; Huang, M. Feasibility Study of Erecting Cosecant Pattern by Planar Microstrip Reflectarray Antenna. Proc. AMPC 1993, 2, 19–20. [Google Scholar]
  23. Pozar, D.; Targonski, S.; Pokuls, R. A Shaped-Beam Microstrip Patch Reflectarray. IEEE Trans. Antennas Propag. 1999, 47, 1167–1173. [Google Scholar] [CrossRef]
  24. Zhao, G.; Jiao, Y.C.; Chen, G.T. Optimal Design of a Large Dual-Polarization Microstrip Reflectarray with China-Coverage Patterns for Satellite Communications. Front. Inf. Technol. Electron. Eng. 2020, 21, 159–173. [Google Scholar] [CrossRef]
  25. Carrasco, E.; Barba, M.; Encinar, J.A.; Arrebola, M.; Rossi, F.; Freni, A. Design, Manufacture and Test of a Low-Cost Shaped-Beam Reflectarray using a Single Layer of Varying-Sized Printed Dipoles. IEEE Trans. Antennas Propag. 2013, 61, 3077–3085. [Google Scholar] [CrossRef]
  26. Prado, D.R.; Lopez-Fernandez, J.A.; Arrebola, M.; Pino, M.R.; Goussetis, G. Wideband Shaped-Beam Reflectarray Design Using Support Vector Regression Analysis. IEEE Antennas Wirel. Propag. Lett. 2019, 18, 2287–2291. [Google Scholar] [CrossRef]
  27. Salucci, M.; Gelmini, A.; Oliveri, G.; Anselmi, N.; Massa, A. Synthesis of Shaped Beam Reflectarrays with Constrained Geometry by exploiting Nonradiating Surface Currents. IEEE Trans. Antennas Propag. 2018, 66, 5805–5817. [Google Scholar] [CrossRef]
  28. Grimaccia, F.; Gruosso, G.; Mussetta, M.; Niccolai, A.; Zich, R.E. Design of Tubular Permanent Magnet Generators for Vehicle Energy Harvesting by Means of Social Network Optimization. IEEE Trans. Ind. Electron. 2017, 65, 1884–1892. [Google Scholar] [CrossRef]
  29. Grimaccia, F.; Mussetta, M.; Niccolai, A.; Pirinoli, P.; Zich, R.E. Recently Developed Social-Based Algorithms for Antennas Optimization. In Proceedings of the 2014 International Conference on Numerical Electromagnetic Modeling and Optimization for RF, Microwave, and Terahertz Applications (NEMO), Pavia, Italy, 14–16 May 2014; pp. 1–4. [Google Scholar]
  30. Niccolai, A.; Gonano, C.A.; Grimaccia, F.; Mussetta, M.; Zich, R.; Pirinoli, P. Sparse Array Design by Means of Social Network Optimization. In Proceedings of the 2015 IEEE International Symposium on Antennas and Propagation & USNC/URSI National Radio Science Meeting, Vancouver, BC, Canada, 19–24 July 2015; pp. 1336–1337. [Google Scholar]
  31. Niccolai, A.; Grimaccia, F.; Mussetta, M.; Zich, R.E. Reflectarray optimization by means of SNO and PSO. In Proceedings of the 2016 IEEE International Symposium on Antennas and Propagation (APSURSI), Fajardo, PR, USA, 26 June–1 July 2016; pp. 781–782. [Google Scholar]
  32. Beccaria, M.; Pirinoli, P.; Niccolai, A.; Zich, R. Application of Social Network Optimization to shaped beam Transmitarray Antennas. In Proceedings of the 2018 IEEE International Symposium on Antennas and Propagation & USNC/URSI National Radio Science Meeting, Boston, MA, USA, 8–13 July 2018; pp. 2203–2204. [Google Scholar]
  33. Niccolai, A.; Zich, R.; Beccaria, M.; Pirinoli, P. SNO Based Optimization for Shaped Beam Reflectarray Antennas. In Proceedings of the 2019 13th European Conference on Antennas and Propagation (EuCAP), Krakow, Poland, 31 March–5 April 2019; pp. 1–4. [Google Scholar]
  34. Simon, D. Complex Contagions: A Decade in Review. In Complex Spreading Phenomena in Social Systems; Springer: Berlin/Heidelberg, Germany, 2018; pp. 3–25. [Google Scholar]
  35. Niccolai, A.; Grimaccia, F.; Mussetta, M.; Zich, R. Modelling of Interaction in Swarm Intelligence Focused on Particle Swarm Optimization and Social Networks Optimization. In Swarm Intelligence—Volume 1: Principles, Current Algorithms and Methods; IET Digital Library: London, UK, 2018. [Google Scholar]
  36. Grimaccia, F.; Mussetta, M.; Niccolai, A.; Zich, R.E. Optimal Computational Distribution of Social Network Optimization in Wireless Sensor Networks. In Proceedings of the 2018 IEEE Congress on Evolutionary Computation (CEC), Rio de Janeiro, Brazil, 8–13 July 2018; pp. 1–7. [Google Scholar]
  37. Beccaria, M.; Addamo, G.; Pirinoli, P.; Orefice, M.; Peverini, O.A.; Virone, G.; Manfredi, D.; Calignano, F. Feed system Optimization for Convex Conformal Reflectarray Antennas. In Proceedings of the 2017 IEEE International Symposium on Antennas and Propagation & USNC/URSI National Radio Science Meeting, San Diego, CA, USA, 9–14 July 2017; pp. 1187–1188. [Google Scholar]
  38. Storn, R.; Price, K. Differential evolution—A simple and efficient heuristic for global optimization over continuous spaces. J. Glob. Optim. 1997, 11, 341–359. [Google Scholar] [CrossRef]
  39. Khatib, W.; Fleming, P.J. The Stud-GA: A mini revolution? In Proceedings of the International Conference on Parallel Problem Solving from Nature, Amsterdam, The Netherlands, 27–30 September 1998; Springer: Berlin/Heidelberg, Germany, 1998; pp. 683–691. [Google Scholar]
  40. Available online: http://www.polito.it/lace/ (accessed on 21 March 2021).
Figure 1. General flow chart of Social Network Optimization (SNO).
Electronics 10 00744 g001
Figure 2. Details of the post-evaluation process.
Electronics 10 00744 g002
Figure 3. Masks implementing the constraints on the radiation pattern. (left): cut in the E-plane; (right): cut in the H-plane.
Electronics 10 00744 g003
Figure 4. Sketch of the considered reflectarray (RA) configuration.
Electronics 10 00744 g004
Figure 5. Convergence curves for the optimization process: the blue thick line is the average convergence, and the gray region identifies the 95% confidence interval of the population convergence.
Electronics 10 00744 g005
Figure 6. Comparison between the curves of convergence resulting by the application of different algorithms to the problem considered here.
Electronics 10 00744 g006
Figure 7. Comparison between the radiation patterns obtained with SNO and M Q C 10 -BBO in the E-plane (left) and H-plane (right).
Electronics 10 00744 g007
Figure 8. Layout of the optimized RA.
Electronics 10 00744 g008
Figure 9. Radiation patterns in the E-plane at 29 GHz.
Electronics 10 00744 g009
Figure 10. Radiation patterns in the E-plane at 30 GHz.
Electronics 10 00744 g010
Figure 11. Radiation patterns in the E-plane at 31 GHz.
Electronics 10 00744 g011
Figure 12. Radiation patterns in the H-plane at 29 GHz.
Electronics 10 00744 g012
Figure 13. Radiation patterns in the H-plane at 30 GHz.
Electronics 10 00744 g013
Figure 14. Radiation patterns in the H-plane at 31 GHz.
Electronics 10 00744 g014
Figure 15. Prototype of the RA with the support structure.
Electronics 10 00744 g015
Figure 16. 3D radiation patterns at 30 GHz, obtained at the end of the optimization process (left) and through the prototype measurement (right).
Electronics 10 00744 g016
Table 1. Comparison between the mean values and the standard deviations.
AlgorithmMean ValueStandard Deviation
DE9354.385369.04
GA243,774.73485,623.66
M Q C 10 -BBO4554.724776.57
PSO84,245.54119,090.16
SGA18,653.2515,363.33
SNO1974.42956.48
Publisher’s Note: MDPI stays neutral with regard to jurisdictional claims in published maps and institutional affiliations.

