Article

Performance Evaluation of LoRa 920 MHz Frequency Band in a Hilly Forested Area

1
Extreme Energy-Density Research Institute, Nagaoka University of Technology, 1603-1 Kamitomioka, Nagaoka, Niigata 940-2188, Japan
2
Wireless Network Research Center, Wireless Systems Laboratory, National Institute of Information and Communications Technology, Yokosuka-shi, Kanagawa 239-0847, Japan
3
Global Strategy Bureau, Ministry of International Affairs and Communication, 1-2 Kasumigaseki 2-chome, Chiyoda-ku, Tokyo 100-8926, Japan
4
Central Research Institute of Electronic Power Industry, 2-11-1, Iwato-Kita, Komae-shi, Tokyo 201, Japan
5
Graduate School of Business, Mongolian University of Science and Technology, Sukhbaatar District, Ulaanbaatar 14191, Mongolia
*
Author to whom correspondence should be addressed.
Electronics 2021, 10(4), 502; https://doi.org/10.3390/electronics10040502
Submission received: 24 December 2020 / Revised: 9 February 2021 / Accepted: 11 February 2021 / Published: 20 February 2021

Abstract

:
Long-range (LoRa) wireless communication technology has been widely used in many Internet-of-Things (IoT) applications in industry and academia. Radio wave propagation characteristics in forested areas are important to ensure communication quality in forest IoT applications. In this study, 920 MHz band propagation characteristics in forested areas and tree canopy openness were investigated in the Takakuma experimental forest in Kagoshima, Japan. The aim was to evaluate the performance of the LoRa 920 MHz band with spreading factor (SF12) in a forested hilly area. The received signal strength indicator (RSSI) was measured as a function of the distance between the transmitter antenna and ground station (GS). To illustrate the effect of canopy openness on radio wave propagation, sky view factor (SVF) and a forest canopy height model were considered at each location of a successfully received RSSI. A positive correlation was found between the RSSI and SVF. It was found that between the GS and transmitter antenna, if the canopy height is above 23 m, the signal diffracted and RSSI fell to −120 to −127 dBm, so the presence of the obstacle height should be considered. Further research is needed to clarify the detailed tree density between the transmitter and ground station to propose an optimal propagation model for a forested environment.

1. Introduction

Long-range (LoRa) communication technology plays an essential role in many Internet-of-Things (IoT) applications in industry and academia. Currently, approximately 31 billion IoT devices exist, such as home appliances that are connected to the Internet, and approximately 75 billion IoT devices are forecast to be connected to the Internet by 2025 [1]. The main characteristics of the LoRa technology fulfill the IoT requirements for using better wireless communication over long distances, low data rates, and low power consumption for batteries [2]. The LoRa technology operates in the unlicensed industrial, scientific, and medical (ISM) radio band, which allows for a much faster uptake of technology worldwide. The ISM band is different depending on the region; the 920 MHz frequency band is used for LoRa applications in Japan [3].
It is essential to understand the accurate LoRa technology performance characteristics in complex environments to develop models and simulations and to plan high-performance communication networks. Mountains, hills, and trees are well known natural obstacles that interrupt radio wave propagation across almost the entire frequency range in a complex propagation environment. This is because the irregular structure of leaves, twigs, branches, and tree trunks of the forest environment can cause signal attenuation, scattering and diffraction as well as absorption of the propagated waves [4]. Many simulations and experimental studies have been conducted to evaluate the performance characteristics of forests. The most common evaluation method is the measured received signal strength indicator (RSSI) values compared with the well-known path loss models such as the Weissberger-modified exponential decay model [5], International Telecommunication Union Sector recommendation (ITU-R) model [6], and COST235 model [7].
Studies of LoRa technology performance and coverage evaluation in forested areas have employed various measurements for field testing [8,9,10,11,12,13]. Lova et al. [8] performed experiments in mountain and urban environments using the European ISM band (868 MHz). It has been reported that the signal decreased because of temperature variation and the existence of hills and vegetation. Khairol et al. [9] carried out experiments using a Malaysian ISM band (433 MHz) in a tropical environment. The results evaluated the RSSI value measurement and comparison of the spreading factor (SF) of 7 and 12 MHz. It was shown that path loss in tropical foliage is unstable owing to the parameter configuration and vegetation. Pablo et al. [10] carried out experiments using an American ISM band (915 MHz) of SF (from 7 to 10 MHz) in a riparian forest. The results were evaluated using the measured RSSI and signal noise ratio (SNR). Based on the RSSI and SNR, a fitting curve was proposed. Mariana et al. [11] conducted a field experiment in a forest and a dense urban environment using a Brazilian ISM band (915 MHz) and a European ISM band (868 MHz) of LoRa SF12. The experimental results were evaluated by measuring the RSSI with distance. In the forest environment, the established communication link reached a distance of 800 m in Portugal and 230 m in Brazil. Ana et al. [12] performed experiments in urban, suburban, and forest environments using a 915 MHz frequency band. The results obtained varied greatly depending on the environment. LoRa SF12 was evaluated based on RSSI, packet delivery ratio (PDR), and SNR in a forest environment. The average RSSI was −100 dBm in the forested area, and the maximum communication range was 250 m. It has been reported that the presence of vegetation affects communication performance and that the experimental communication range is shorter than the theoretical range. Malevich et al. [13] performed measurements in the 10 GHz frequency band with an antenna located in front of, and within, a mixed forest. The receiver’s antenna-height-dependent signal was attenuated. If the receiving antenna was in front of the forest, the signal level increased at some points. The authors noted that the signal level changed because of gaps in the branches and leaves between the transmitter and the receiver antenna.
This paper covers the interdisciplinary field of remote sensing and wireless communication. The main motivation of this work is to characterize LoRa SF12 modulation technology features to design a high-performance communication network in a hilly forested area. As a first step, a theoretical propagation characteristic model over distance was compared to real experimental data. In the second step, canopy openness was calculated from 360° panoramic image data. To better understand the experimental propagation environment, the image data were captured from the beginning until the end of the experiment. In the third step, the global forest canopy height model 2019 was examined to determine the obstacle height between the transmitter and the receiver.
The main contributions of this work are as follows: an experiment into the communication ability of a LoRa SF12 configuration in a hilly forest area is presented. The effect of canopy openness on radio wave propagation is explored. The obstacles (tree height and terrain elevation) are discussed.
However, to the best of our knowledge this is the first study to present the effect of canopy openness on LoRa communication technology in a hilly forest environment.

2. Materials and Methods

2.1. Principle of LoRa Technology

The LoRa technology is generally divided into two different layers: the physical layer, which uses the chirp spread spectrum (CSS) and is called the LoRa modulation technique, and the medium access control (MAC) layer, which is called the long-range wide-area network (LoRaWAN) protocol. The LoRa physical layer modulation patent is owned by the Semtech Corporation [14]. For the LoRa modulation, three parameters can be customized depending on the device and purpose: bandwidth (BW), spreading factor (SF), and coder rate (CR). The basic principle of LoRa technology is based on a spread-spectrum modulation techniques that use CSS. A chirp is a signal with a frequency that moves up or down at different speeds. The speed of the chirp is determined by the spreading factor. The chirp rate depends only on the bandwidth: one chirp per second per Hertz of bandwidth. This means that an increase in one of the spreading factors will divide the frequency span of a chirp by two because two SF chirps covering the entire bandwidth will multiply the duration by two [15]. This is why the spreading factor (SF) is an important parameter in CSS modulation. The higher the SF modulation, the wider is the wireless communication range. The SF value ranged from SF7 to SF12. The LoRa wireless communication distance can be extended to more than 30 km [16].

2.2. Theoretical Data

The free-space path loss model gives the theoretical data that predicts radio wave propagation path loss in free space without obstructing objects over distance. This model considers only the frequency and propagation distance. It does not consider radio wave propagation effects such as reflection, refraction, diffraction, or absorption. Path loss expresses the loss in signal strength as a function of distance. The link budget calculates the signal strength in the receiver, accounting for all gains and losses in a transmission system [17].
Free space path loss model equation:
L (dB) = 20log10 (4πd/λ).
Link budget equation:
Pr (dBm) = Pt + Gr + Gt − L,
where L is the free space path loss in dB, d is the distance between receiver and transmitter antenna in meters; λ is the frequency in MHz; Pr is the received power expressed in dBm; Pt is the transmitter power in dBm; Gr is the receiver antenna gain in dB; and Gt is the transmitter antenna gain in dB.

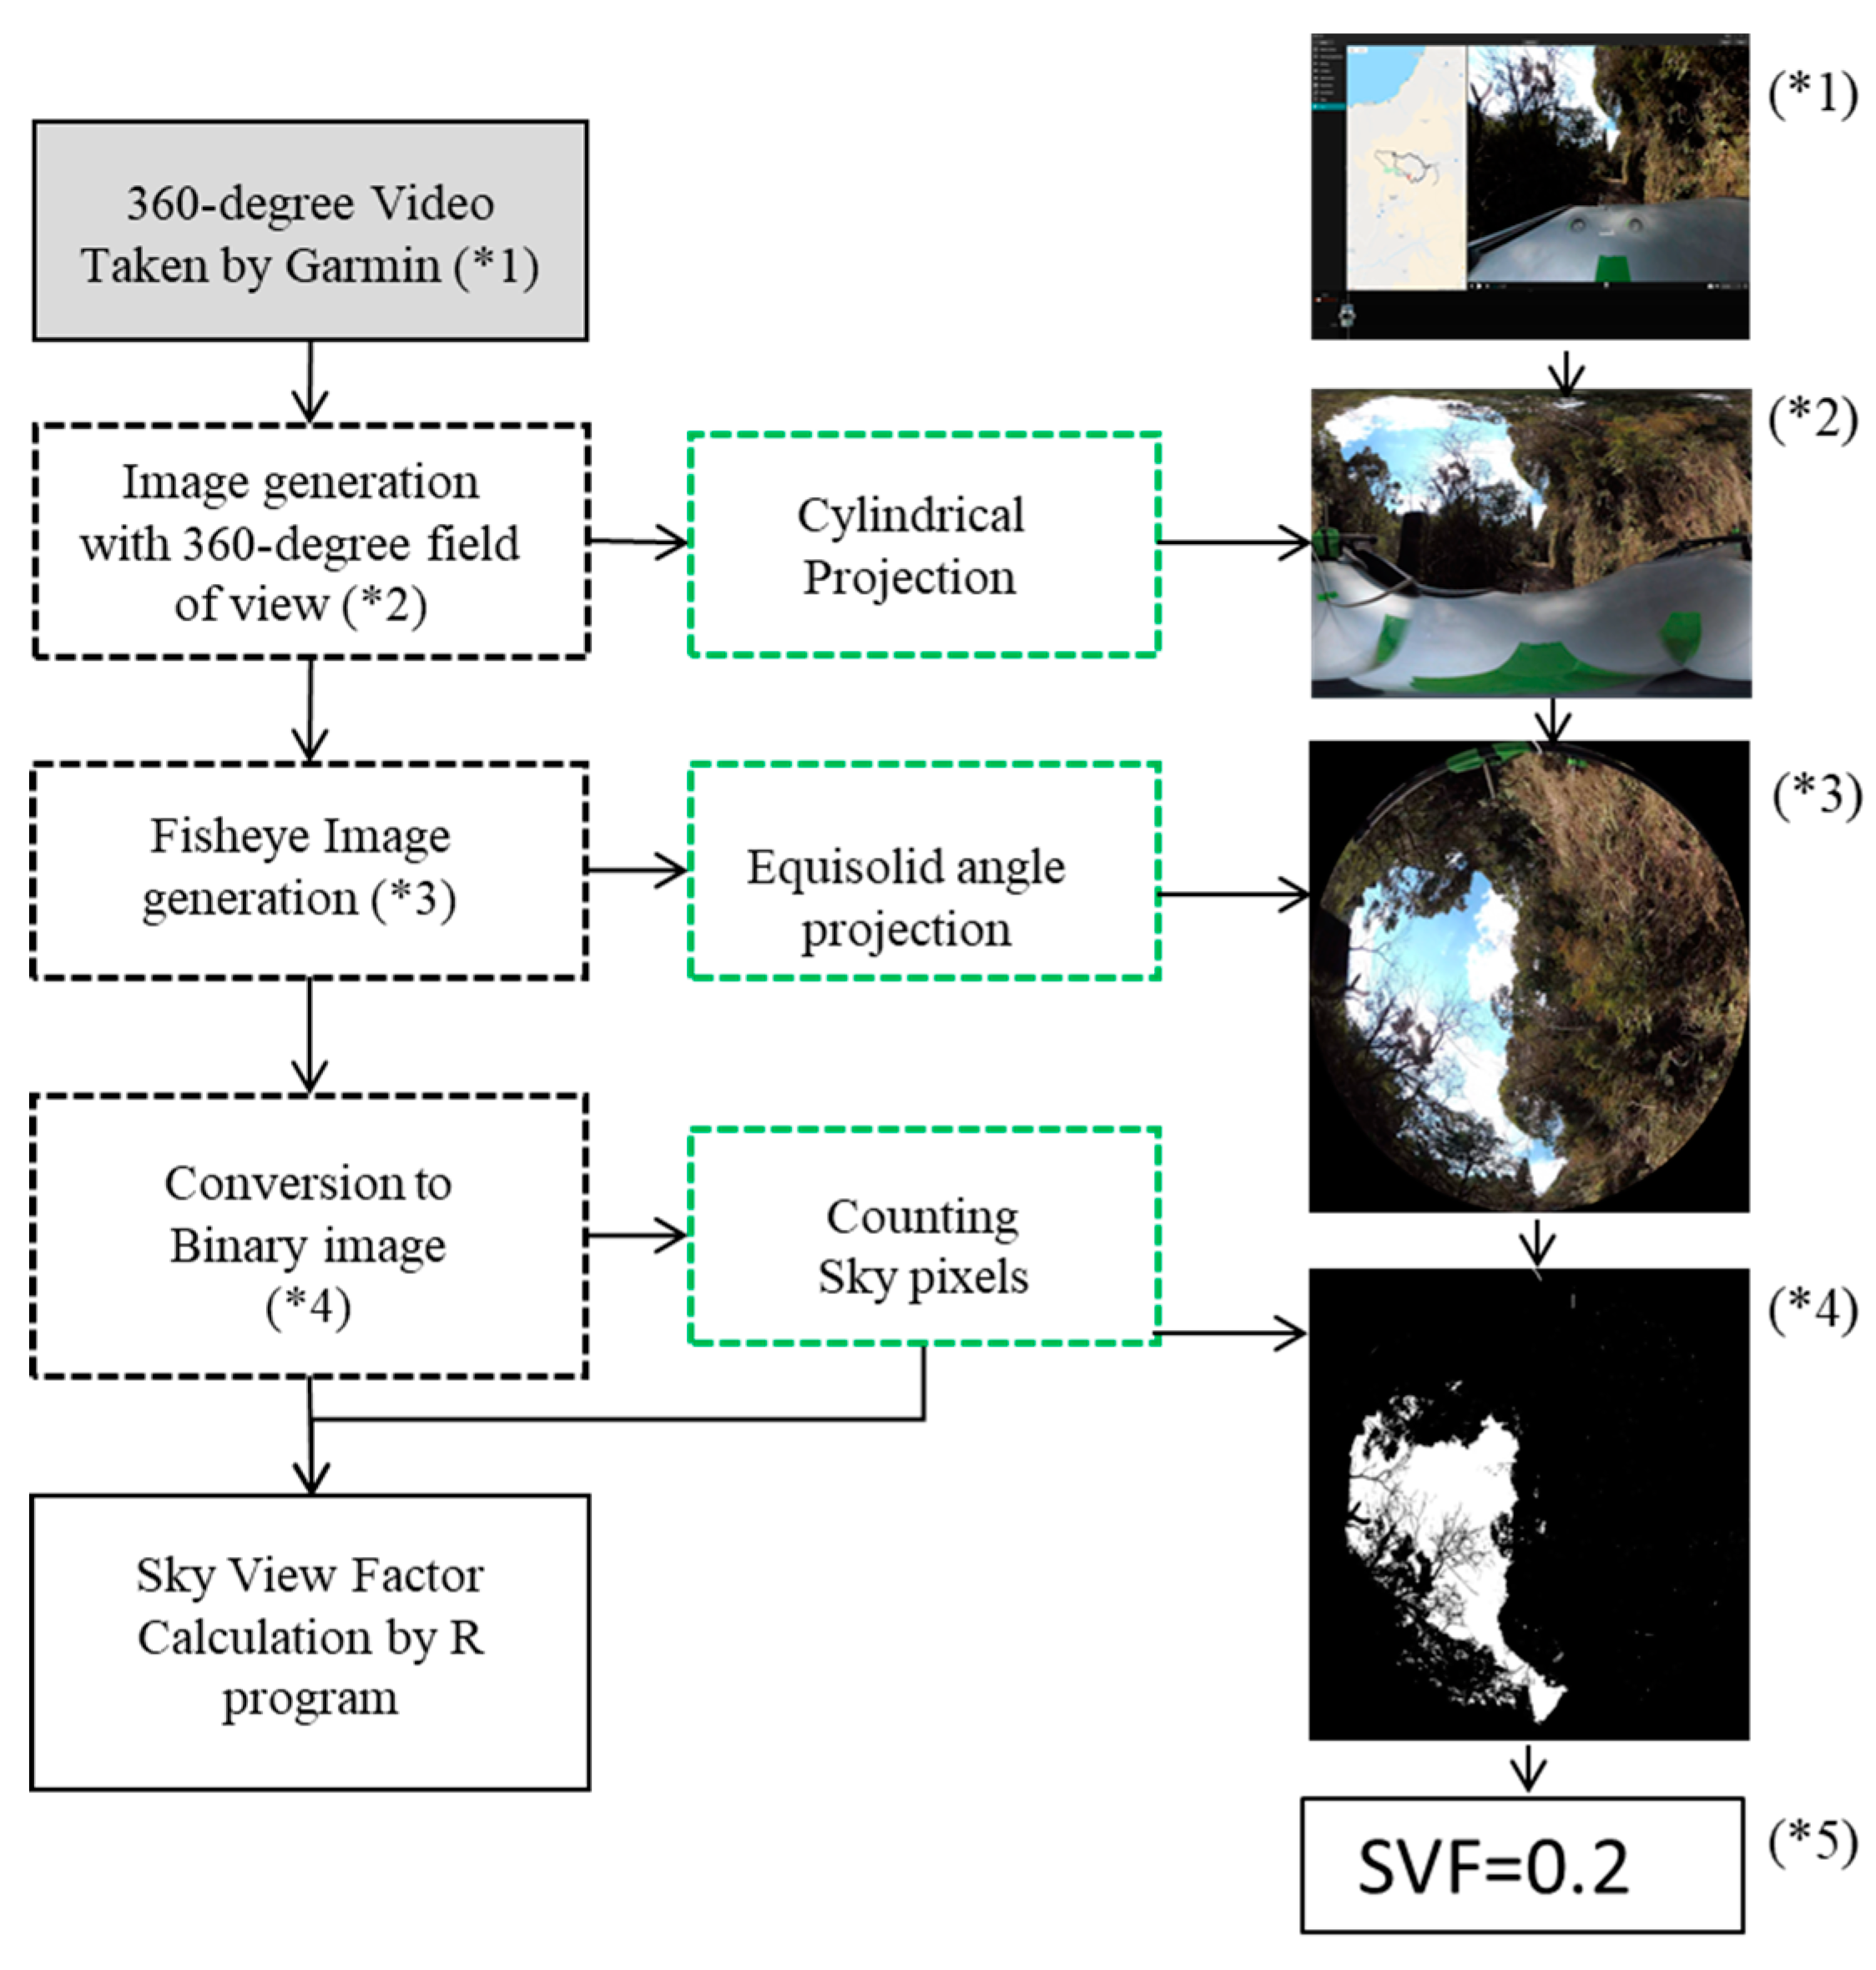
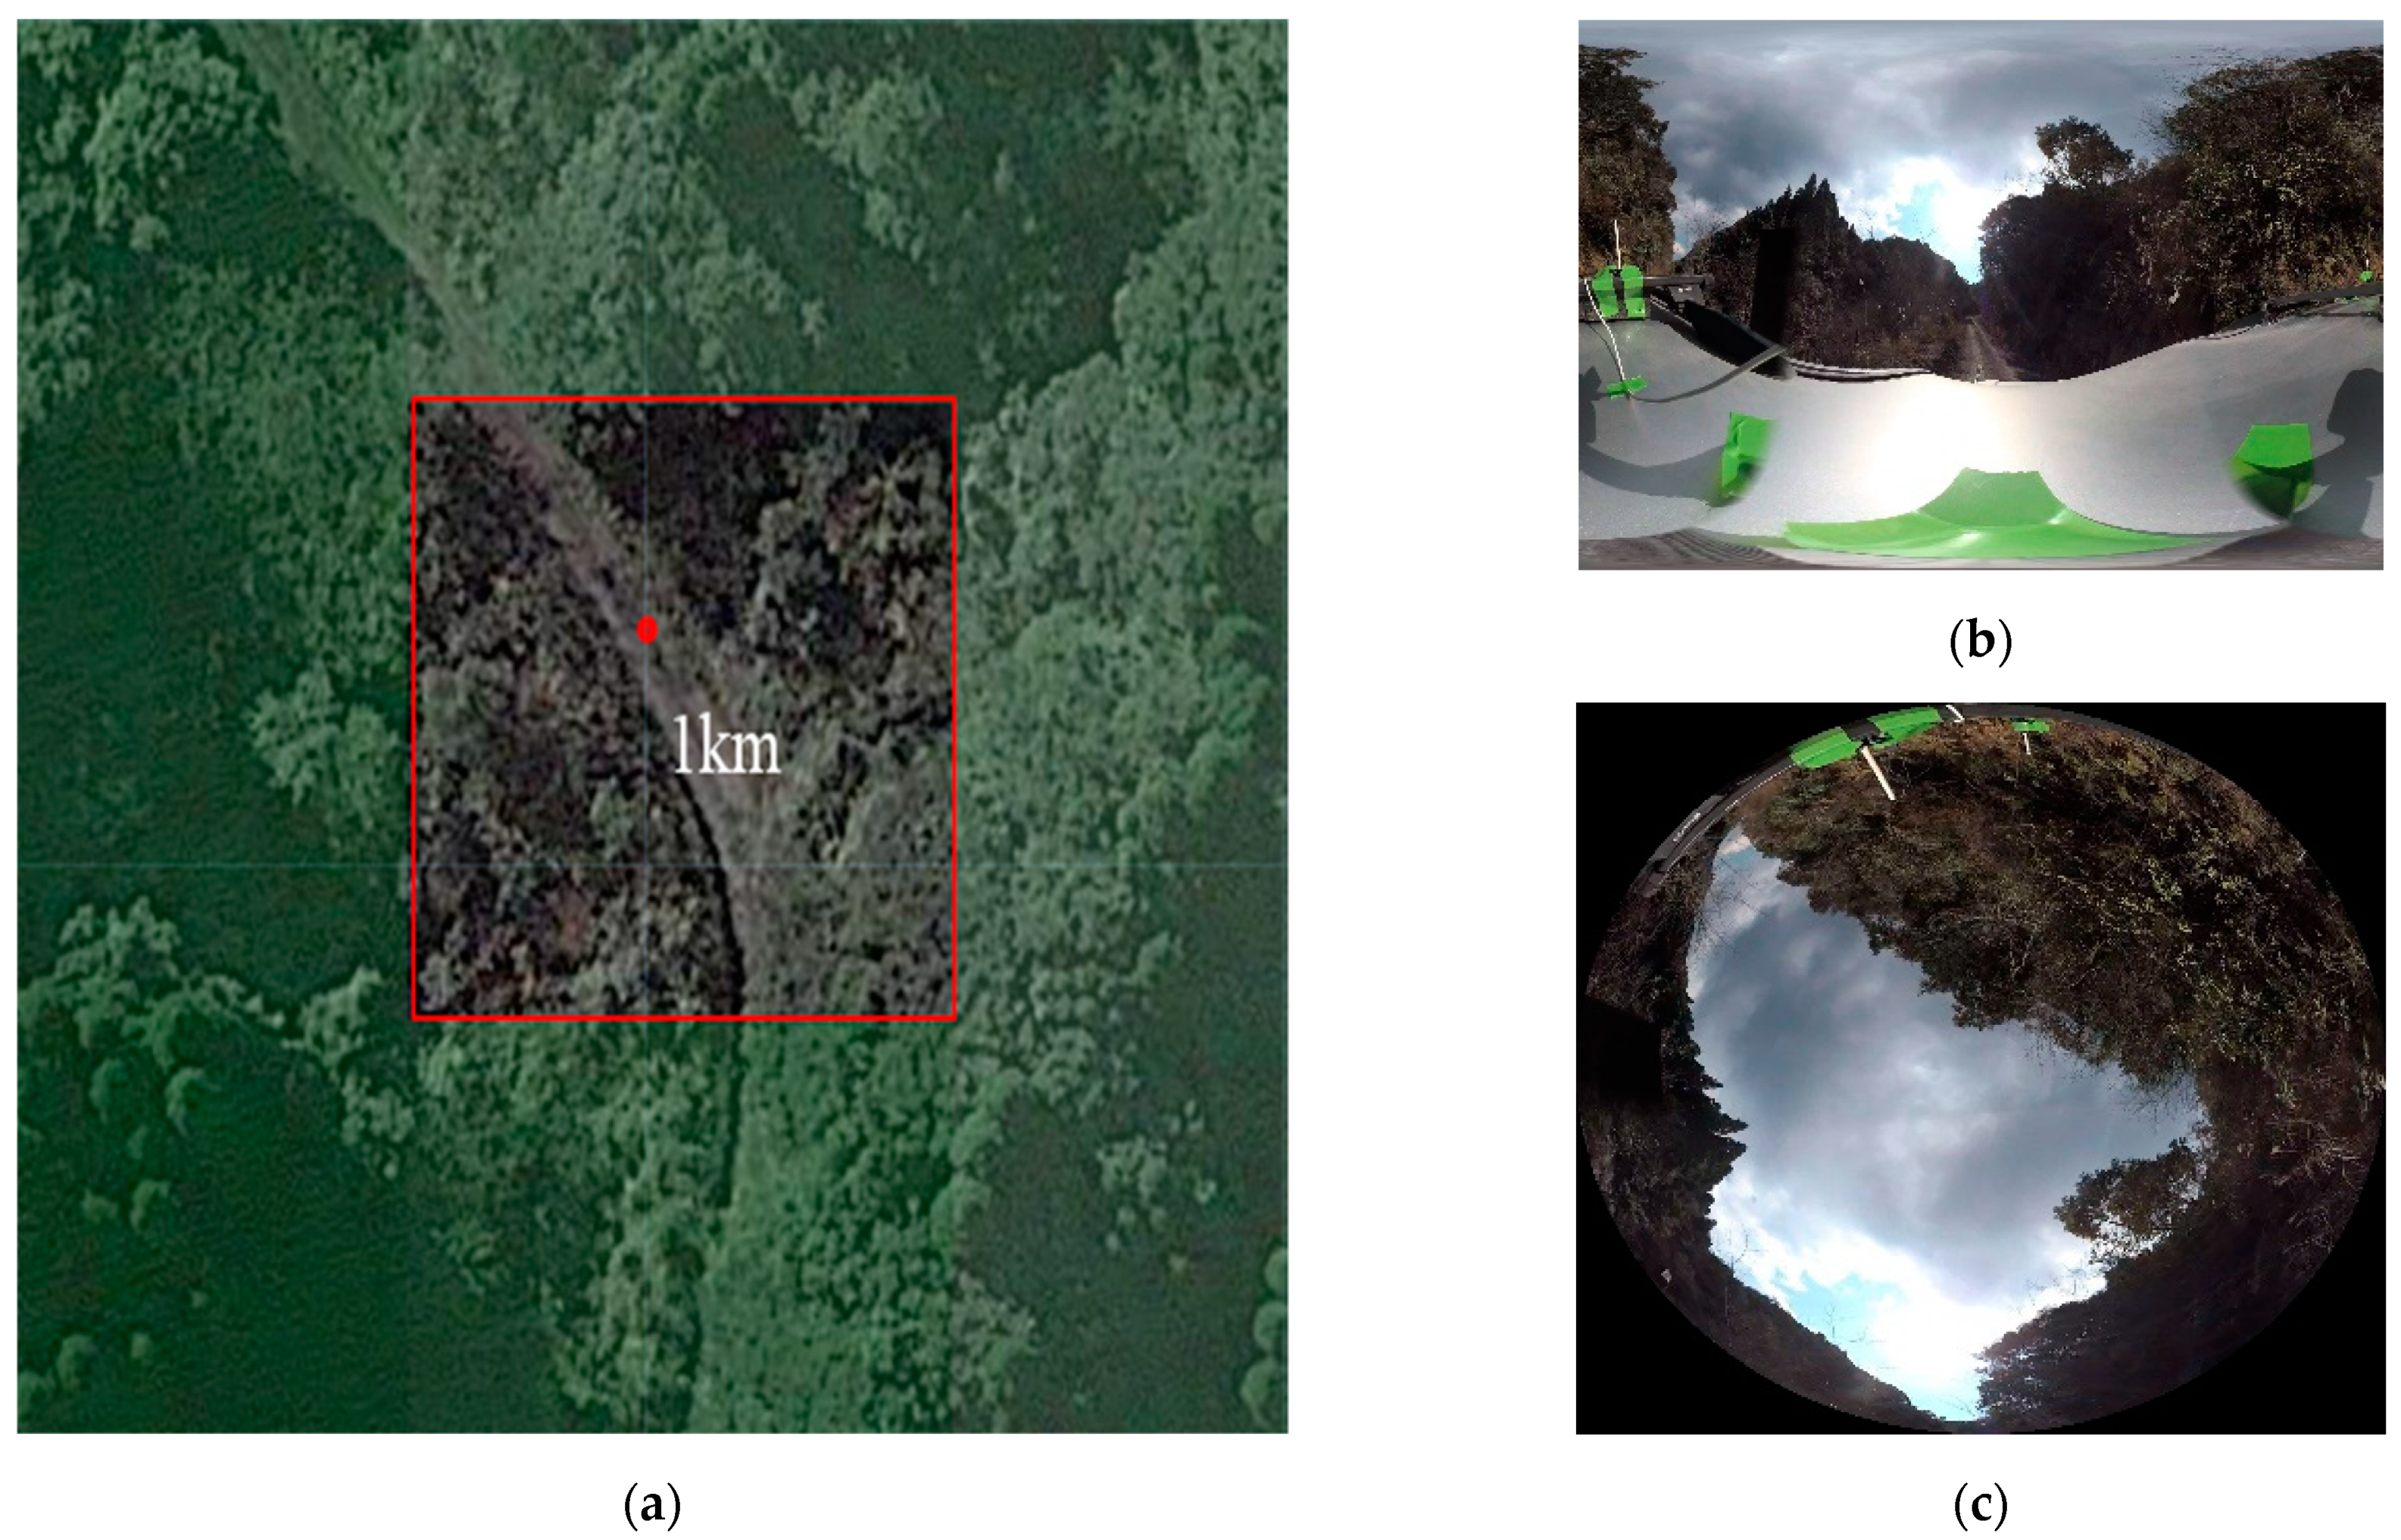
2.3. Sky View Factor Calculation (SVF)

The sky view factor (SVF) is the ratio of visible sky area to a hemisphere centered over a location. SVF is widely used as an important parameter in research fields like geography, geomorphology, cartography, hydrology, glaciology, forestry, and disaster management [18]. It can be used in engineering to calculate urban heat and predict the availability of Global Positioning System (GPS) signals in urban areas. Many methods have been developed to estimate an SVF [19], which ranges between 0 and 1:0 indicates no sky view from a given location and the maximum influence of the surroundings, whereas 1 indicates a clear sky view from a given location and no influence of the surroundings. If the SVF is low, the tree cover can cause a shadowing effect in the radio wave propagation path and RSSI is expected to be weak.
The degree to which canopy openness affects LoRa’s communication performance between the transmitter and receiver is yet to be answered. The experimental area of the video image was acquired using a Garmin VIRB-360 video camera, which was mounted on the roof of the transmitter vehicle. The following steps were completed to calculate the SVF. The captured video images were automatically corrected and extracted using Garmin VIRB 5.4.3.0 video editing software. The resolution of the video images was 3840 × 2160, with a frame rate of 30 fps. A flowchart of the SVF calculation is presented in Figure 1. The first step is from the extracted image to a 360° field-of-view image generated by cylindrical projection. The next step is from the generated 360° field-of-view image to fisheye image generation by equisolid angle projection. The third step is to convert the fisheye image into a binary image. The last step involves counting the sky pixels from a binary image. The R program of the SVF calculation procedures was developed by [20] and is shown in the following URL: (https://github.com/honjo7777/theta2svf, eqdist2eqsolid) (accessed on 15 June 2020).

2.4. Global Forest Canopy Height Map

NASA’s Global Ecosystem Dynamics Investigation (GEDI) generated the first high-resolution, laser-ranging observations of the 3D structure of the Earth that can reveal precise measurements of the vertical forest canopy height, surface elevation, major carbon and water cycling processes, biodiversity, and habitat [21]. GEDI was launched to the international space station (ISS) on December 5, 2018, and vegetation structure data collection has been conducted since April 2019. The GEDI instrument consists of three light detection and ranging (LIDAR) laser systems that produce eight parallel tracks of observations. Each laser fires 242 times per second and illuminates a 25 m spot (a footprint) on the surface, which includes the measurement of the 3D structure on the Earth. The global forest canopy height map 2019 was developed by integrating the LIDAR forest-structure measurements with the Landsat analysis-ready data time series [21]. The global forest canopy height model 2019 with 30 m resolution was downloaded from https://glad.umd.edu/dataset/gedi. It is important to illustrate the path loss for the height of the canopy between the GS and the transmitter car.

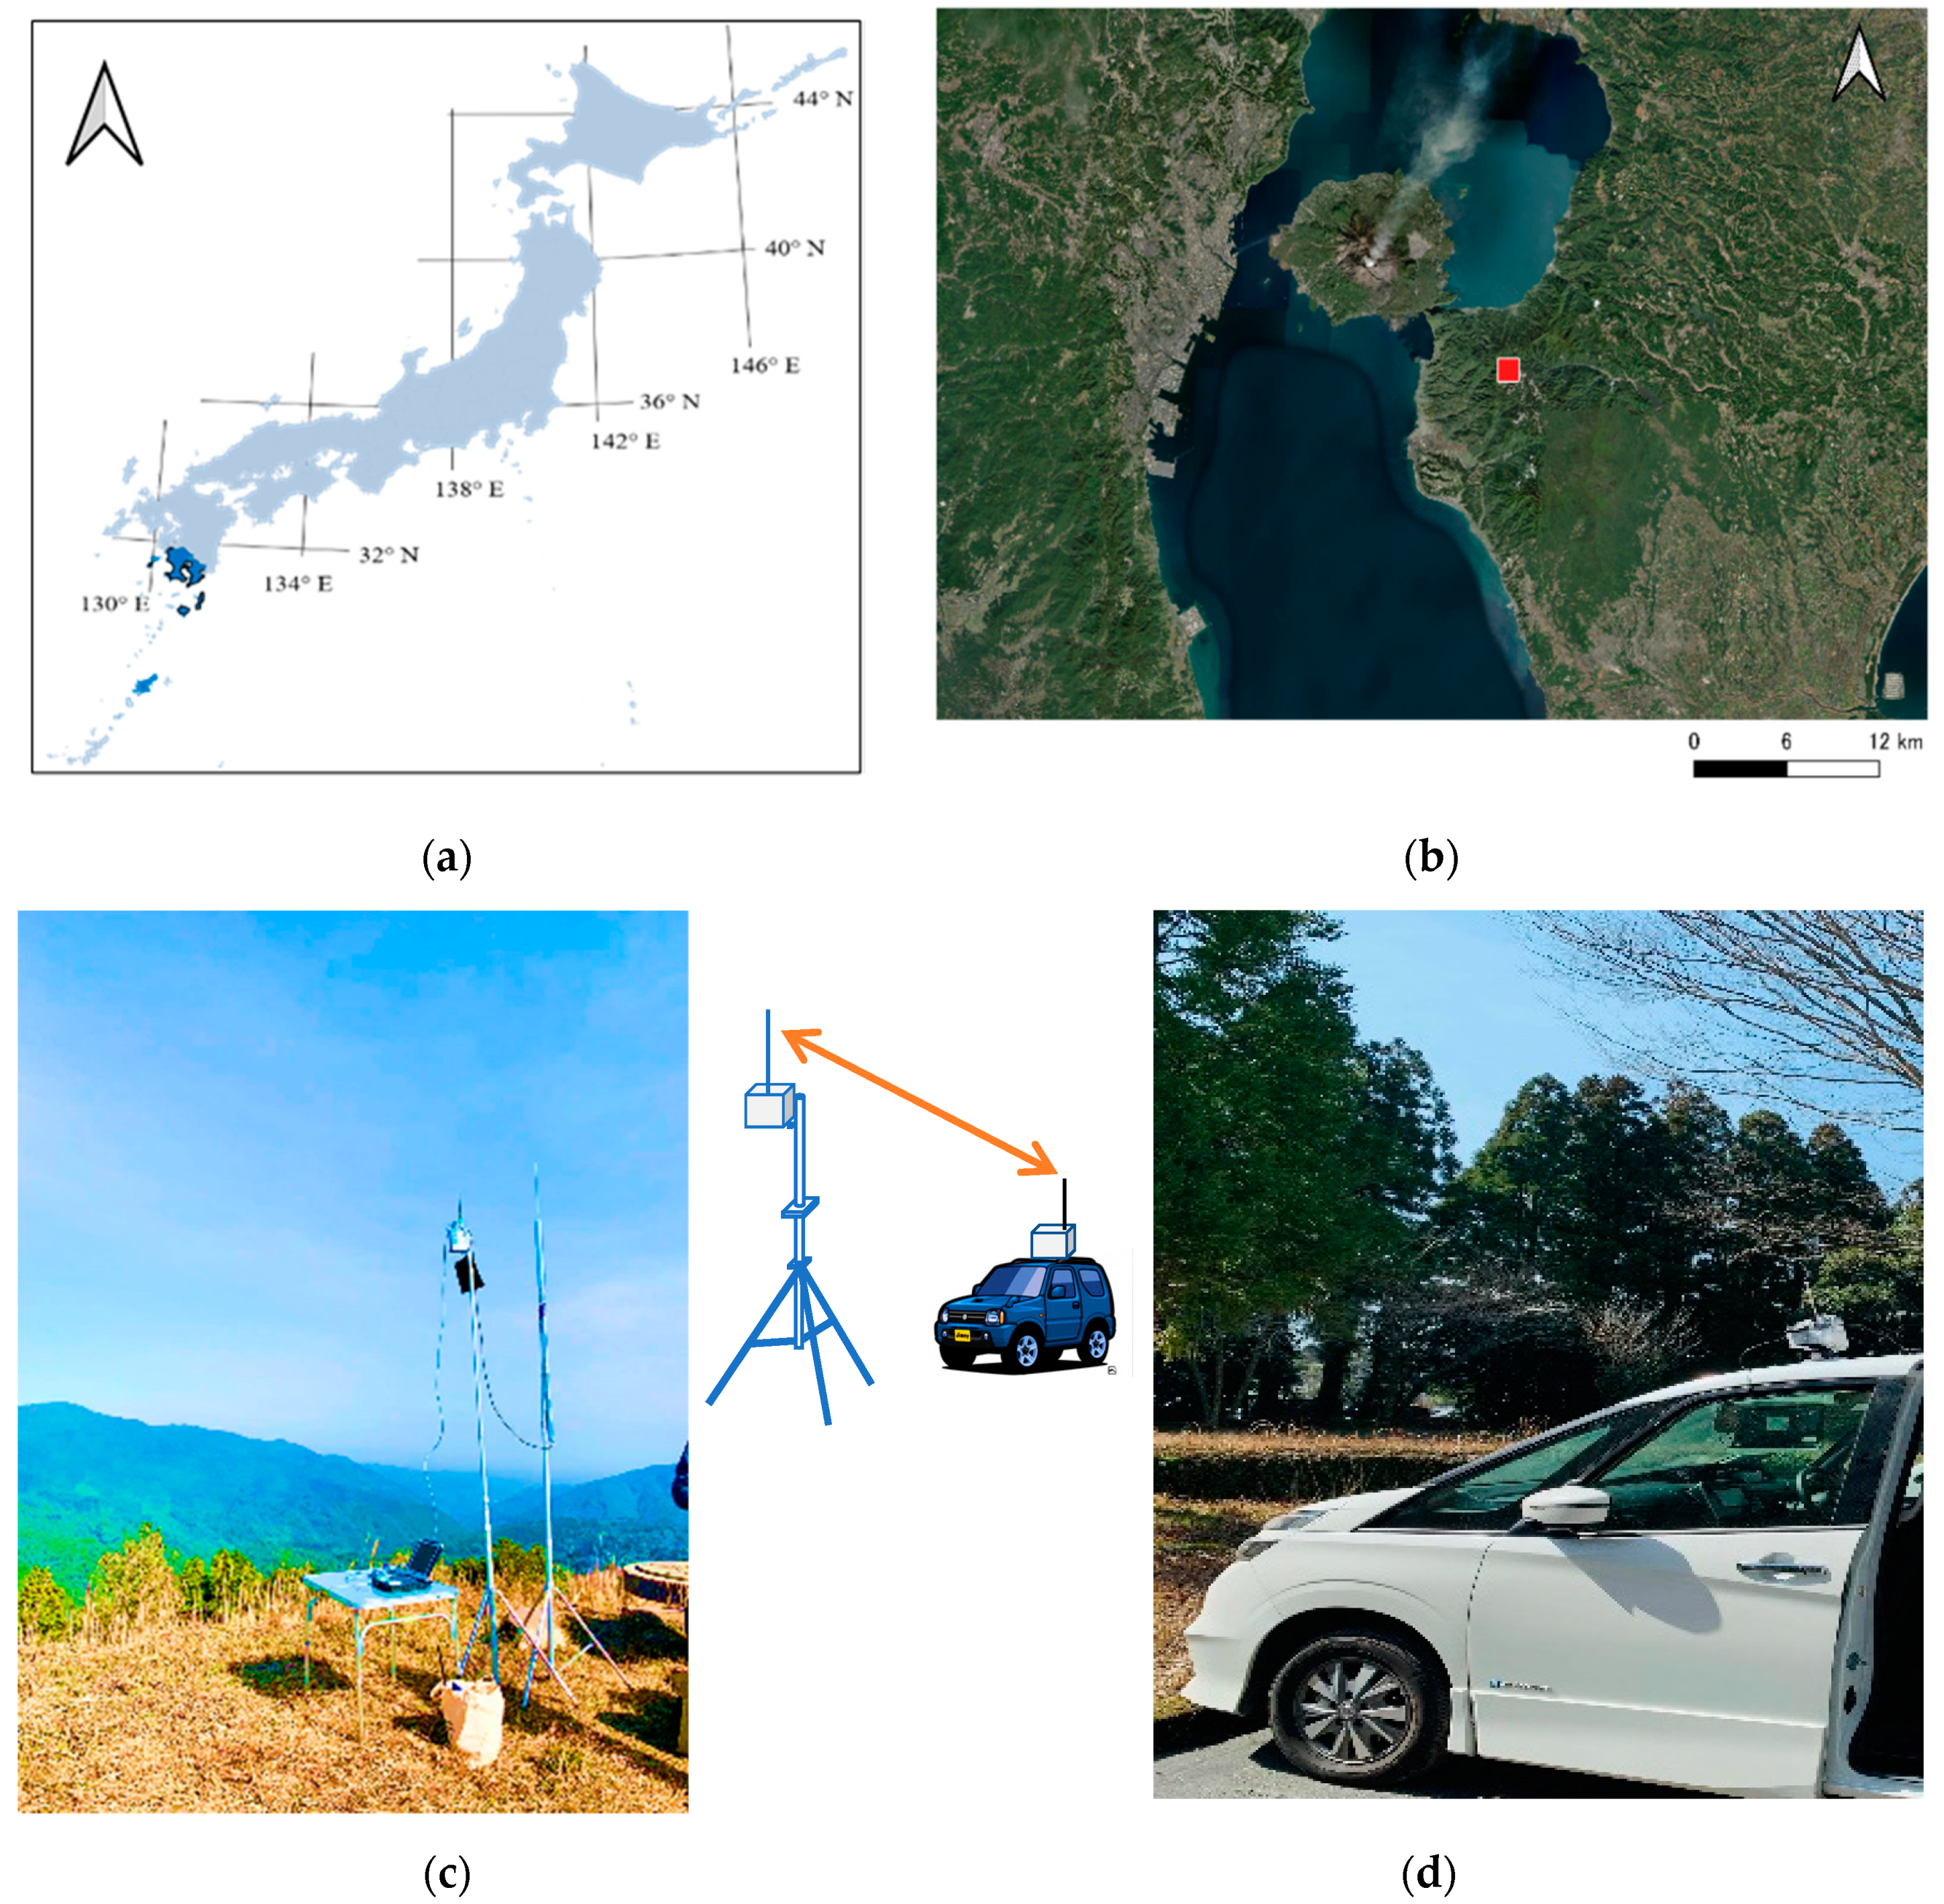
2.5. Experimental Setup

The field experiment was conducted in February 2020 at Takakuma Experimental Forest (31.5° N, 130.7° E) of Kagoshima University, Tarumizu City, Kagoshima Prefecture. The details of the measurement setup are shown in Figure 2. A map of Japan is shown in Figure 2a, where the dark-blue colored area is Kagoshima prefecture; in Figure 2b, the expansion of the dark-blue area is the Takakuma experimental forest area, and the red square is the location of the experimental area in this study. The experiment was carried out by installing a ground station (GS) antenna to the summit of Mt. Takatouge (722 m high), as shown in Figure 2c. The height of the GS is approximately 2.5 m. Figure 2d shows a transmitter antenna mounted to the roof of a vehicle approximately 2 m above ground. The measurements were performed in good weather conditions. Table 1 shows the experimental parameter configuration.

3. Results

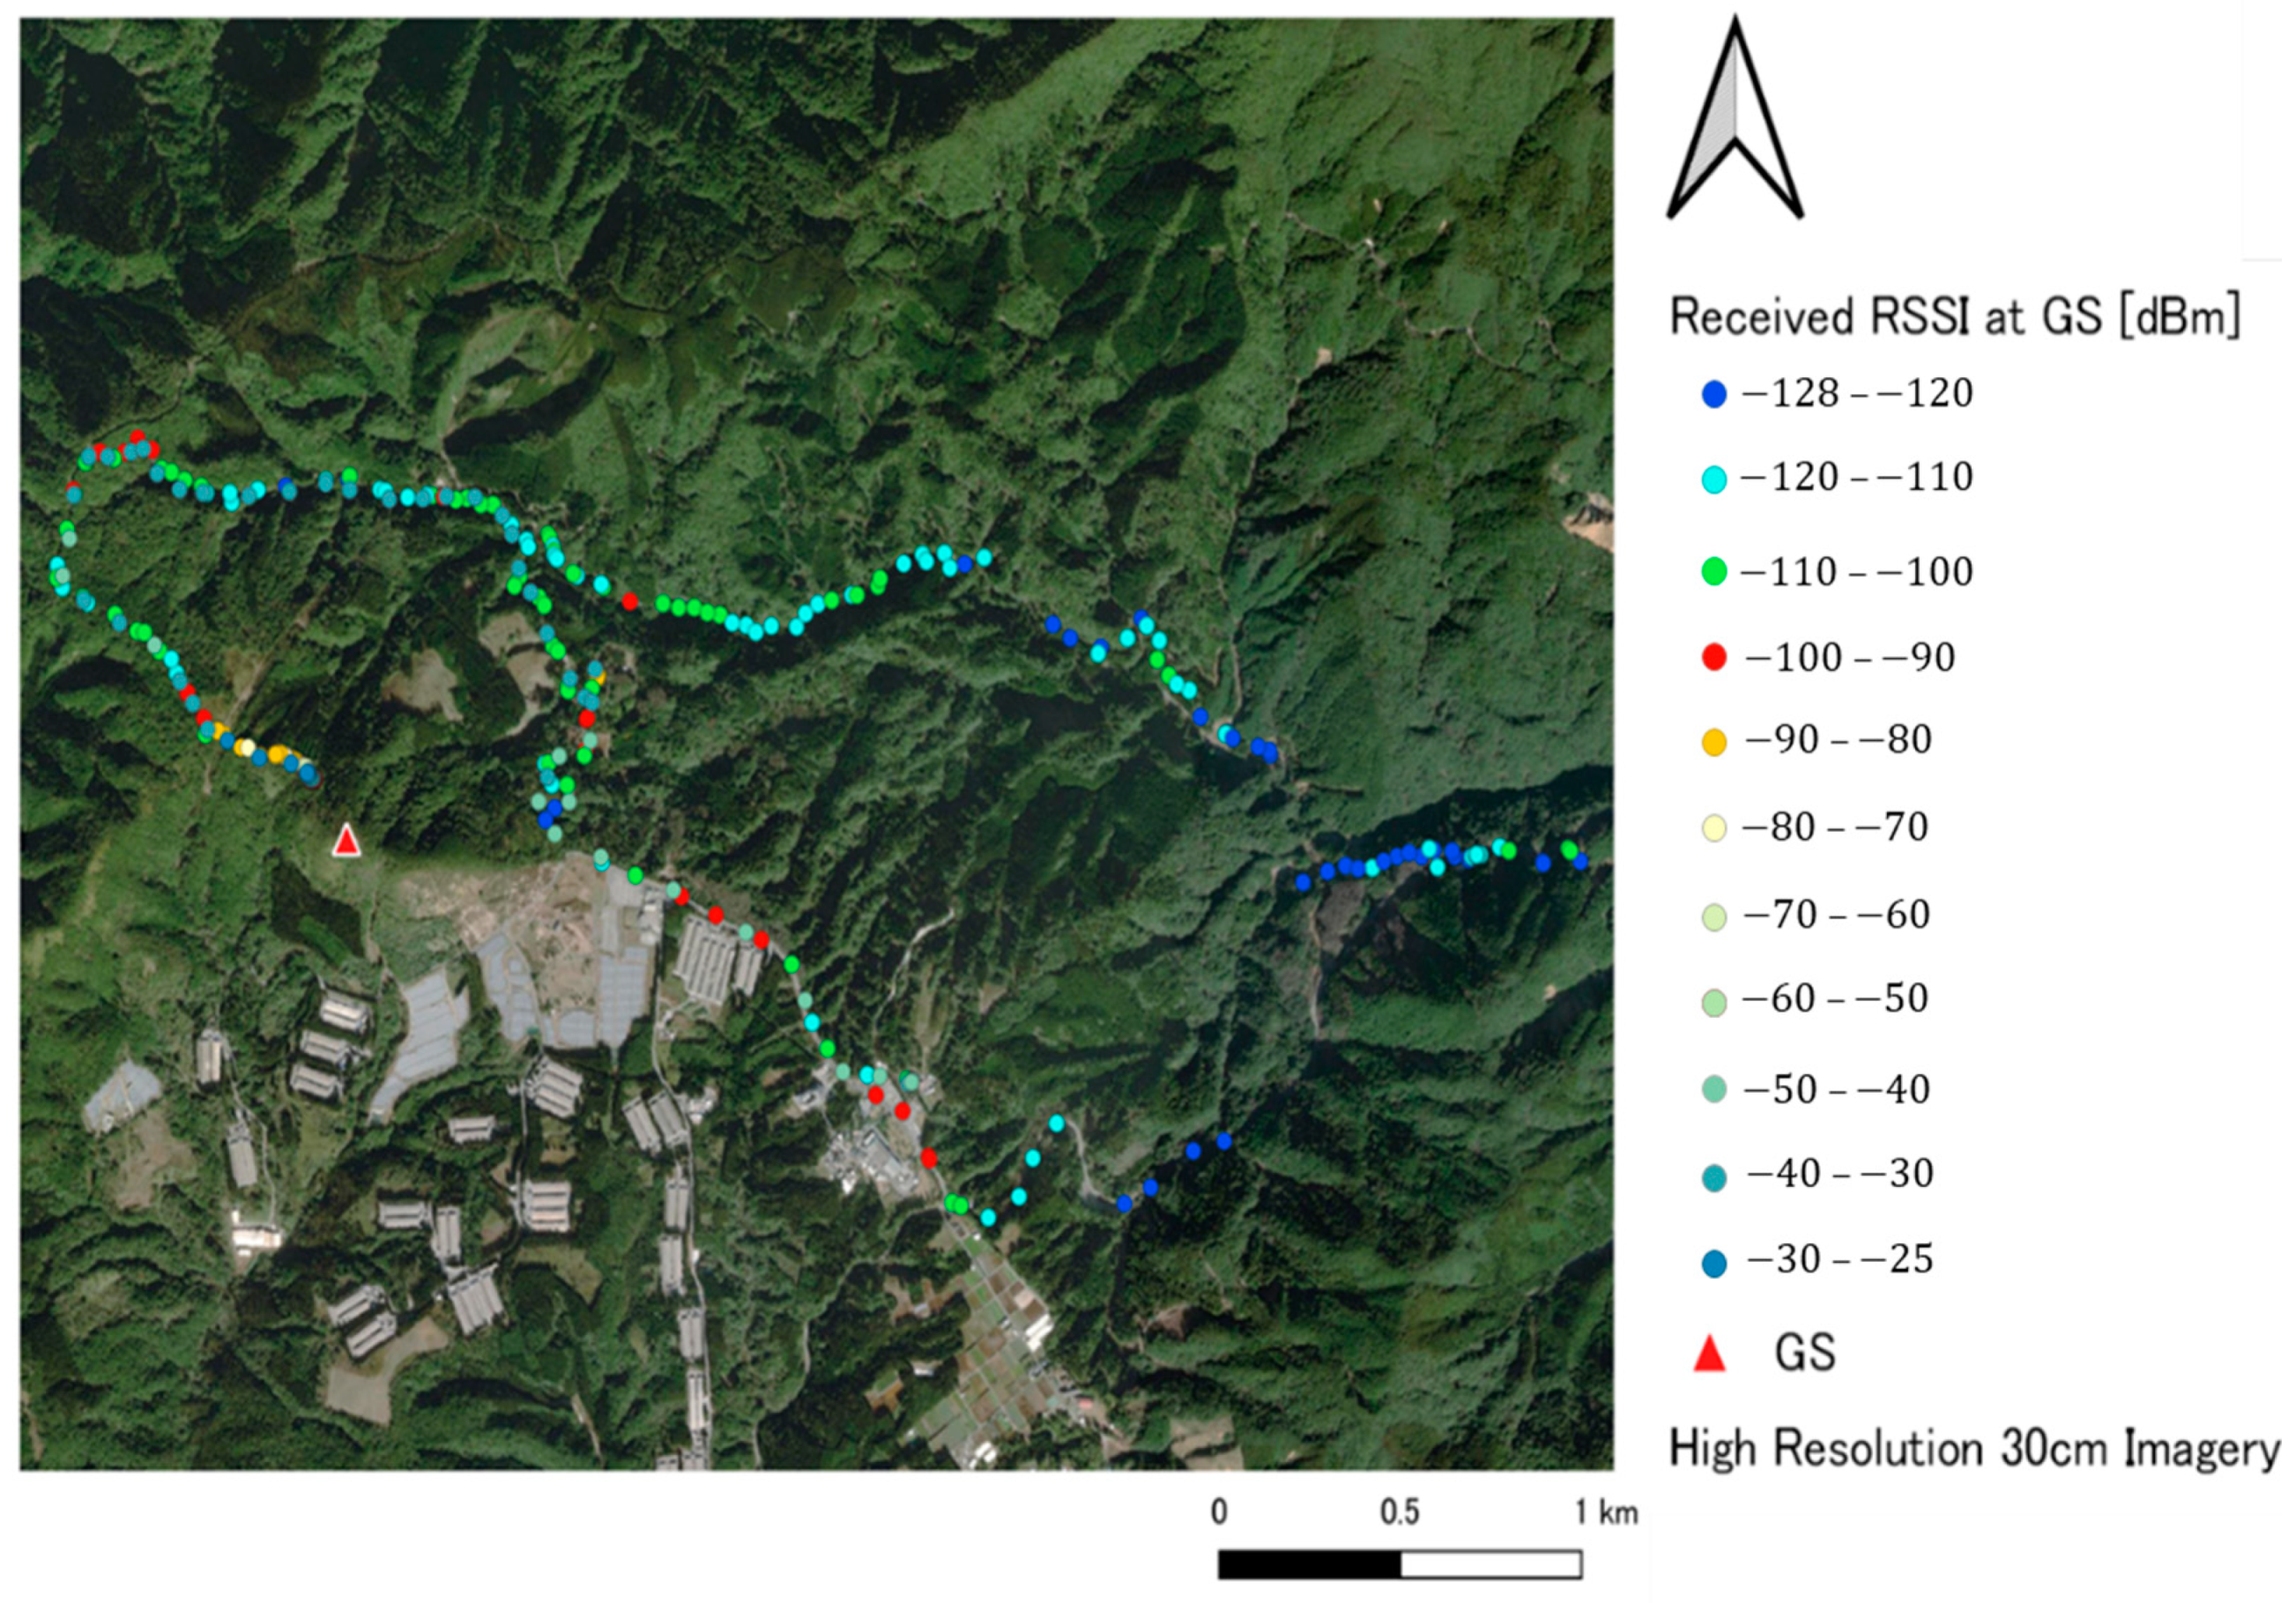
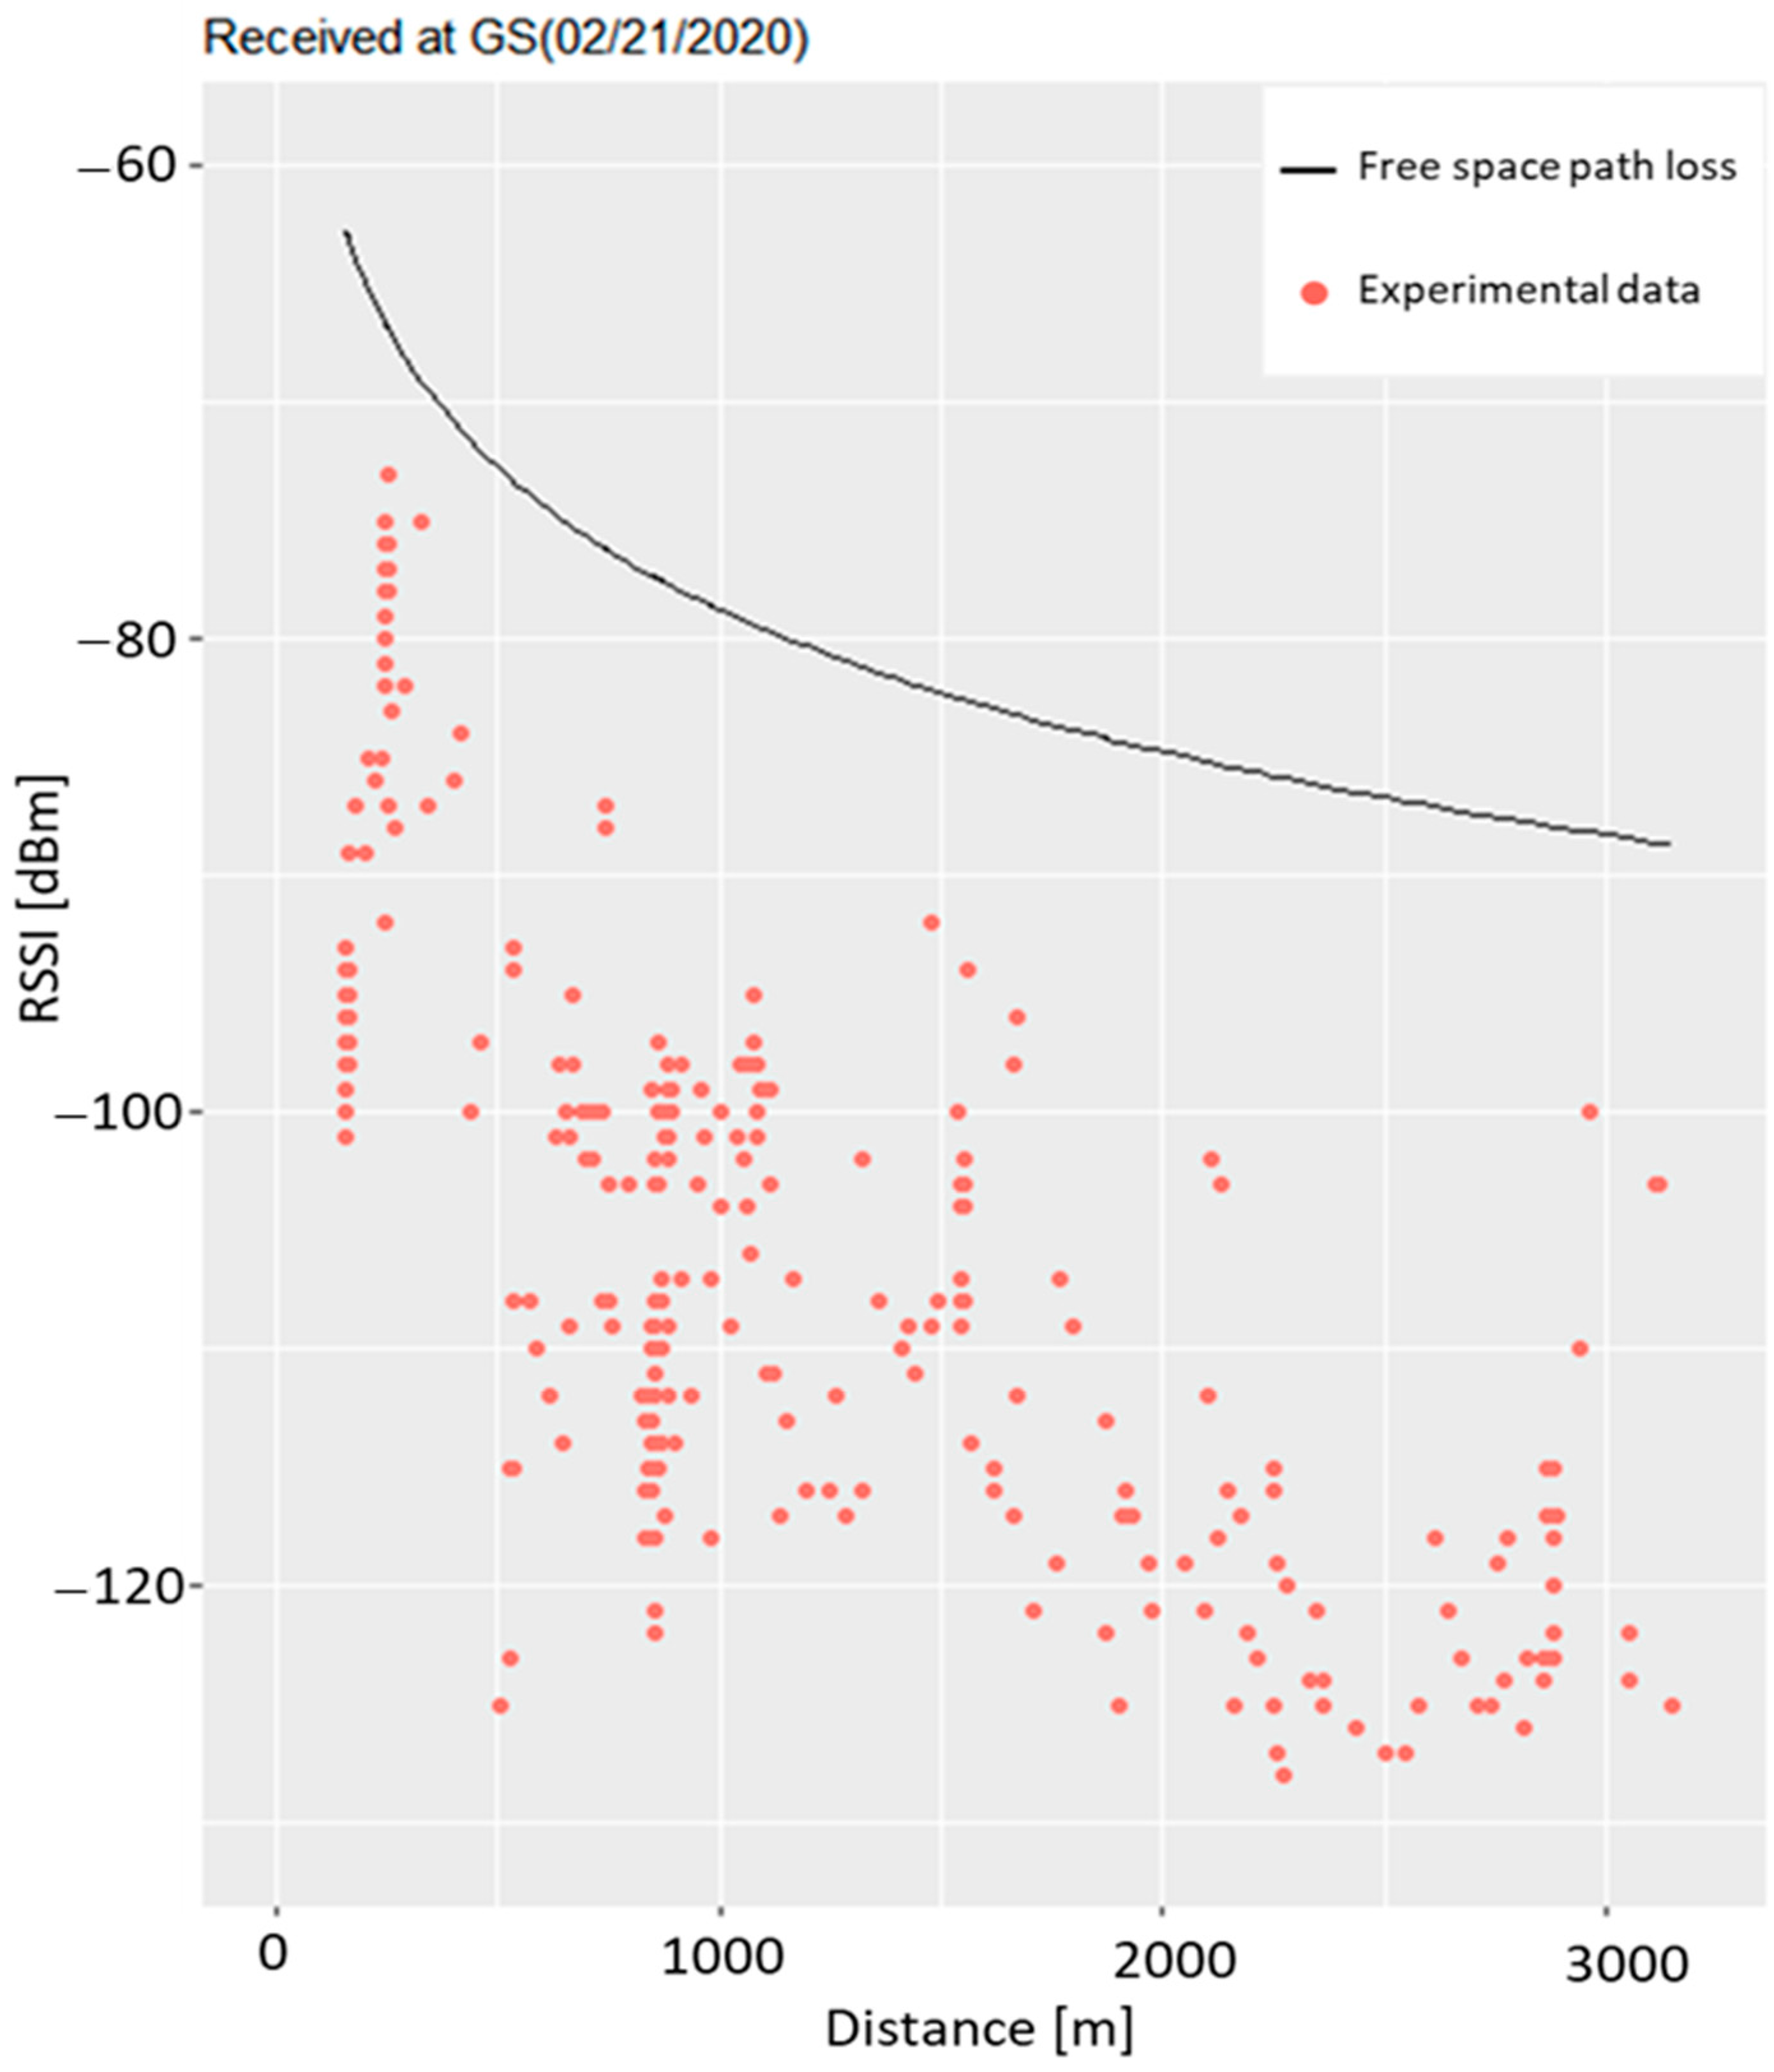
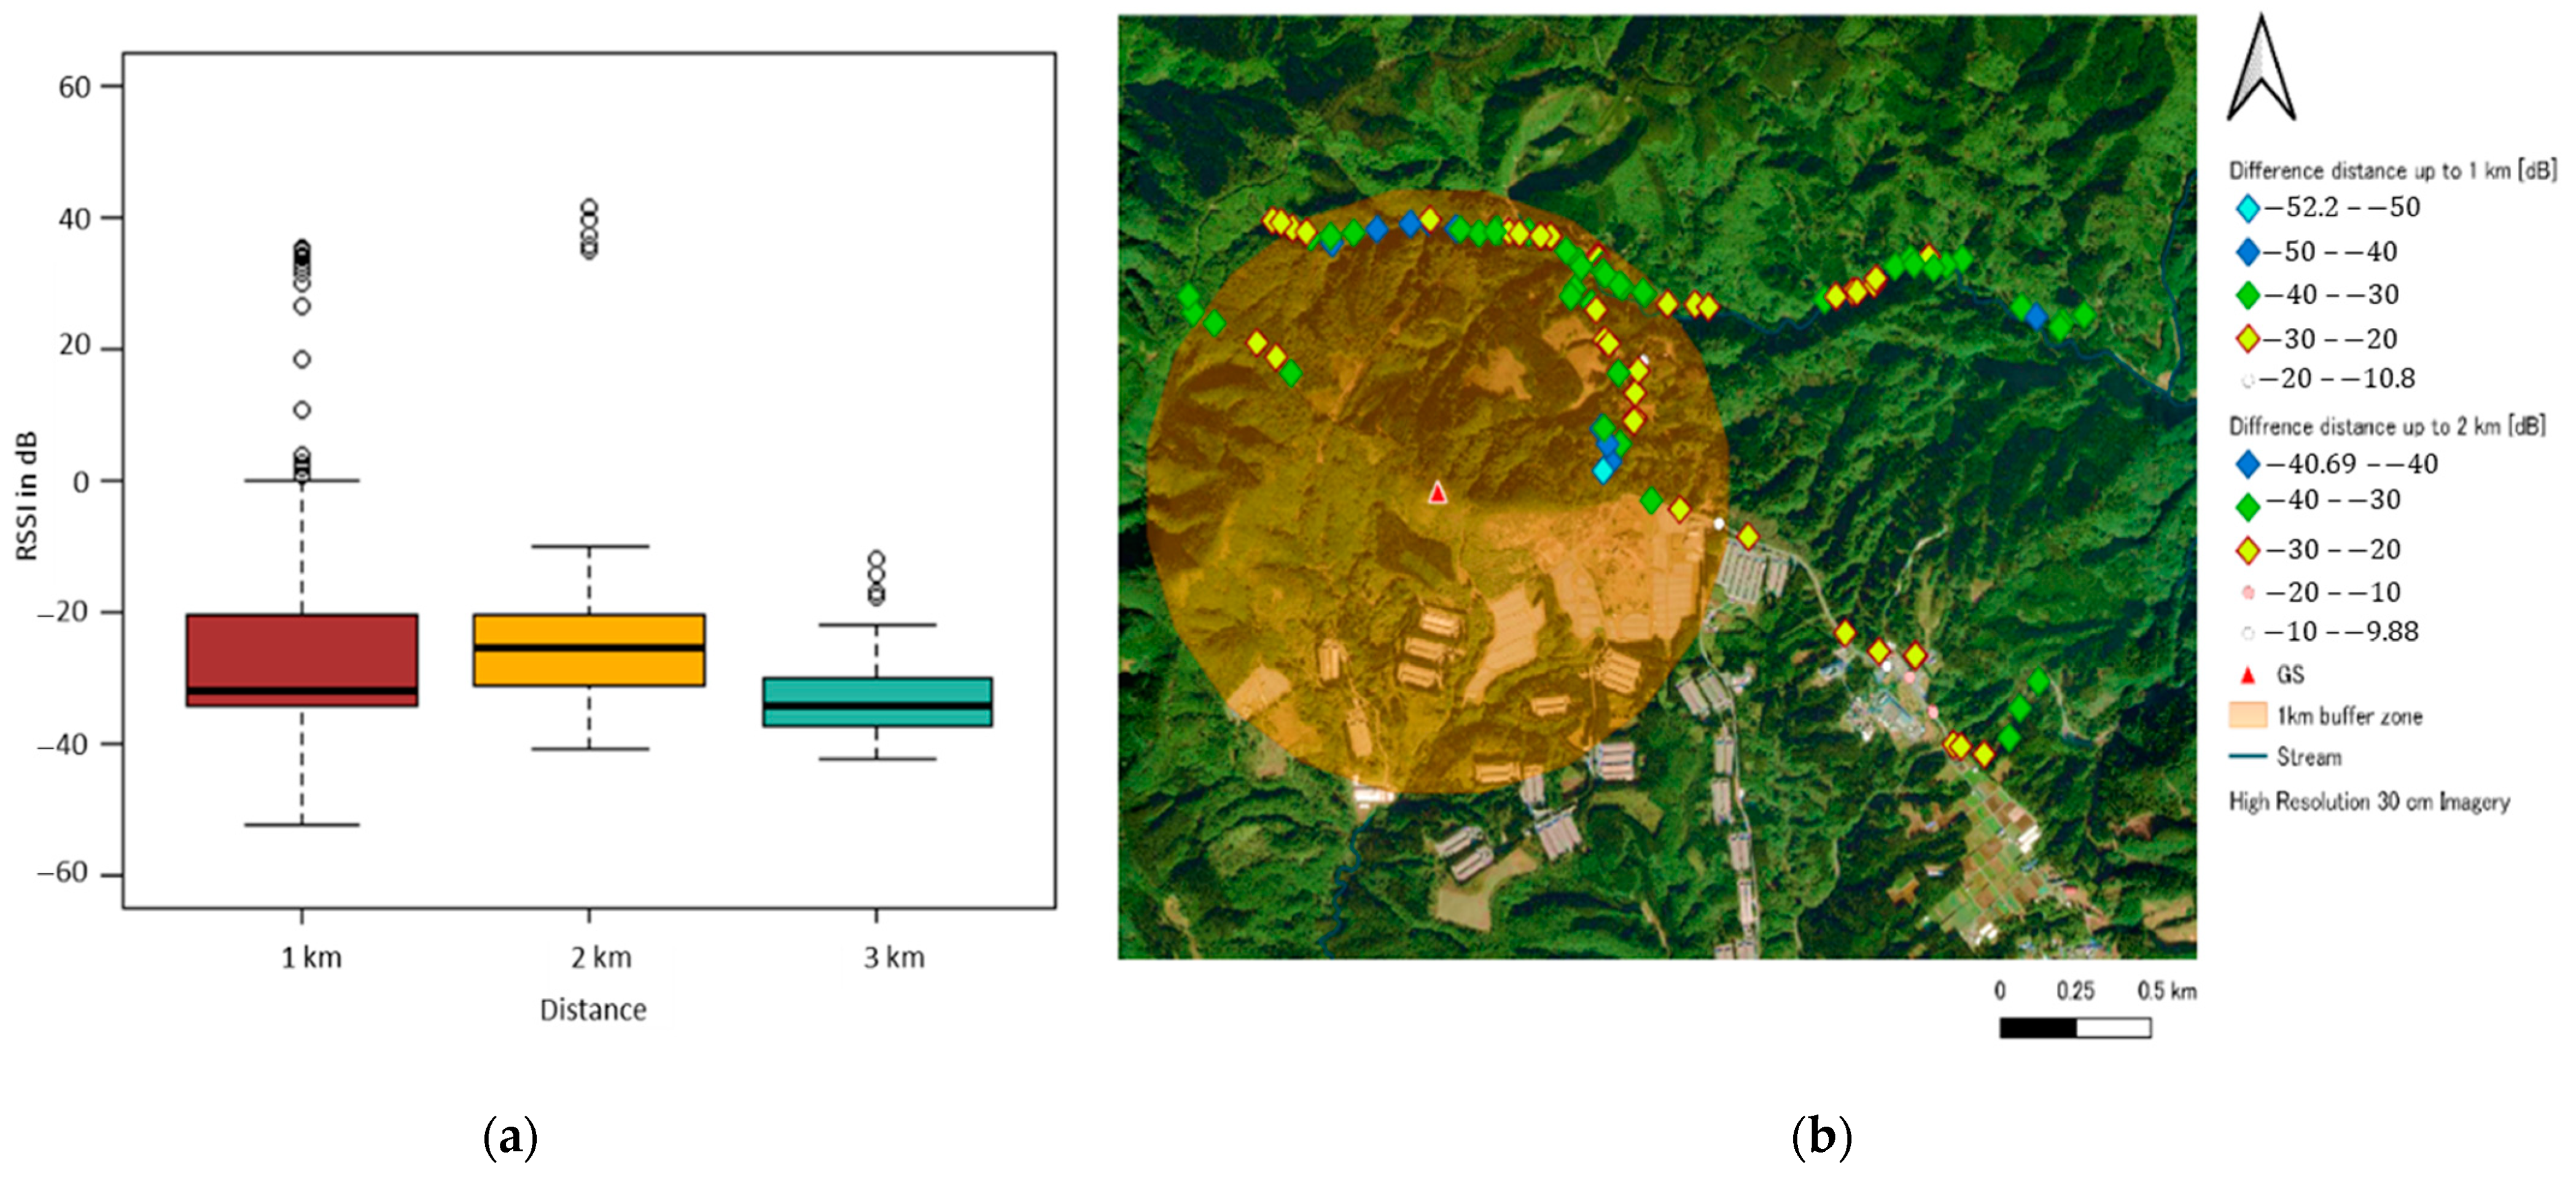
3.1. Propagation Measurement of 920 MHz Band

In our experiment, we collected data from the ground station every time the transmitter car sent data. The RSSI was measured. The propagation environment was surrounded by a mixed forest with hilly areas. RSSI communication was successfully received up to a distance of 3.2 km. For a distance greater than 3.2 km from the GS, where the direct signal path was obstructed by the mountain, there was no signal received. The experimental communication map is shown in Figure 3. The plots indicate the movement trajectories of the transmitter car. The successful RSSI values indicated by the colored dots and the red triangle is the location of the GS and received RSSI ranging between −24 and −128 dBm at the GS, as shown in Figure 3. Communication loss occurred from 1.8 to 2 km because the transmitter car was running behind the hilly mountain, which has a height of 532 m.
The measurement attenuation characteristics at 920 MHz are shown in Figure 4. The solid black line in the figure shows the theoretical value of the free-space path loss model, and the red dots show the measured values of the received power. From Figure 4, the results show that the measured path loss is higher than the theoretical path loss. The RSSI value changes over the distance between the receiver and transmitter and the surrounding environment. For example, the RSSI received from −90 to −120 dBm from a distance of 500 m to 1 km. This is because of the terrain effect, vegetation scattering, diffraction, and absorption of radiation. At a distance of 500 m to 1 km, the transmitter car ran through a forested mountainside area of Mt. Takatouge.
As predicted, the experimental and theoretical values do not perfectly match because of the environmental radio wave propagation effect. Figure 5a shows the difference in signal power between the experimental data and theoretical data as indicated by RSSI. The difference between the theoretical and experimental data was approximately 10 to 52 dB at distances of up to 1 km, 9 to 40 dB at 2 km and 11 to 42 dB at 3 km. Theoretically, signal strength decreases exponentially with distance, but in the experimental results in Figure 5a, the distance of 1 km revealed more signal attenuation occurred than at 2 km. We assume that from 2 to 3.2 km there is a high possibility of distance-dependent path loss and the existence of the hilly area and canopy. The difference plotted map is shown in Figure 5b. The largest difference between the experimental and theoretical values at a distance of up to 1, 2, and 3 km were 52, 40, and 42 dB, respectively. For data transmission distances of up to 1 km, a higher signal attenuation occurred than at 2 km. Until 1 km, there was large signal attenuation because of the terrain effect and the canopy. By visual inspection of the comparison among the different values, there was more signal decrease in the nearby tall deciduous trees and behind the hilly areas. This can be explained by considering the environmental conditions of the scenario. To investigate the reason for the large attenuation values of the measurement data, the SVF and forest canopy height map are examined in the next section.

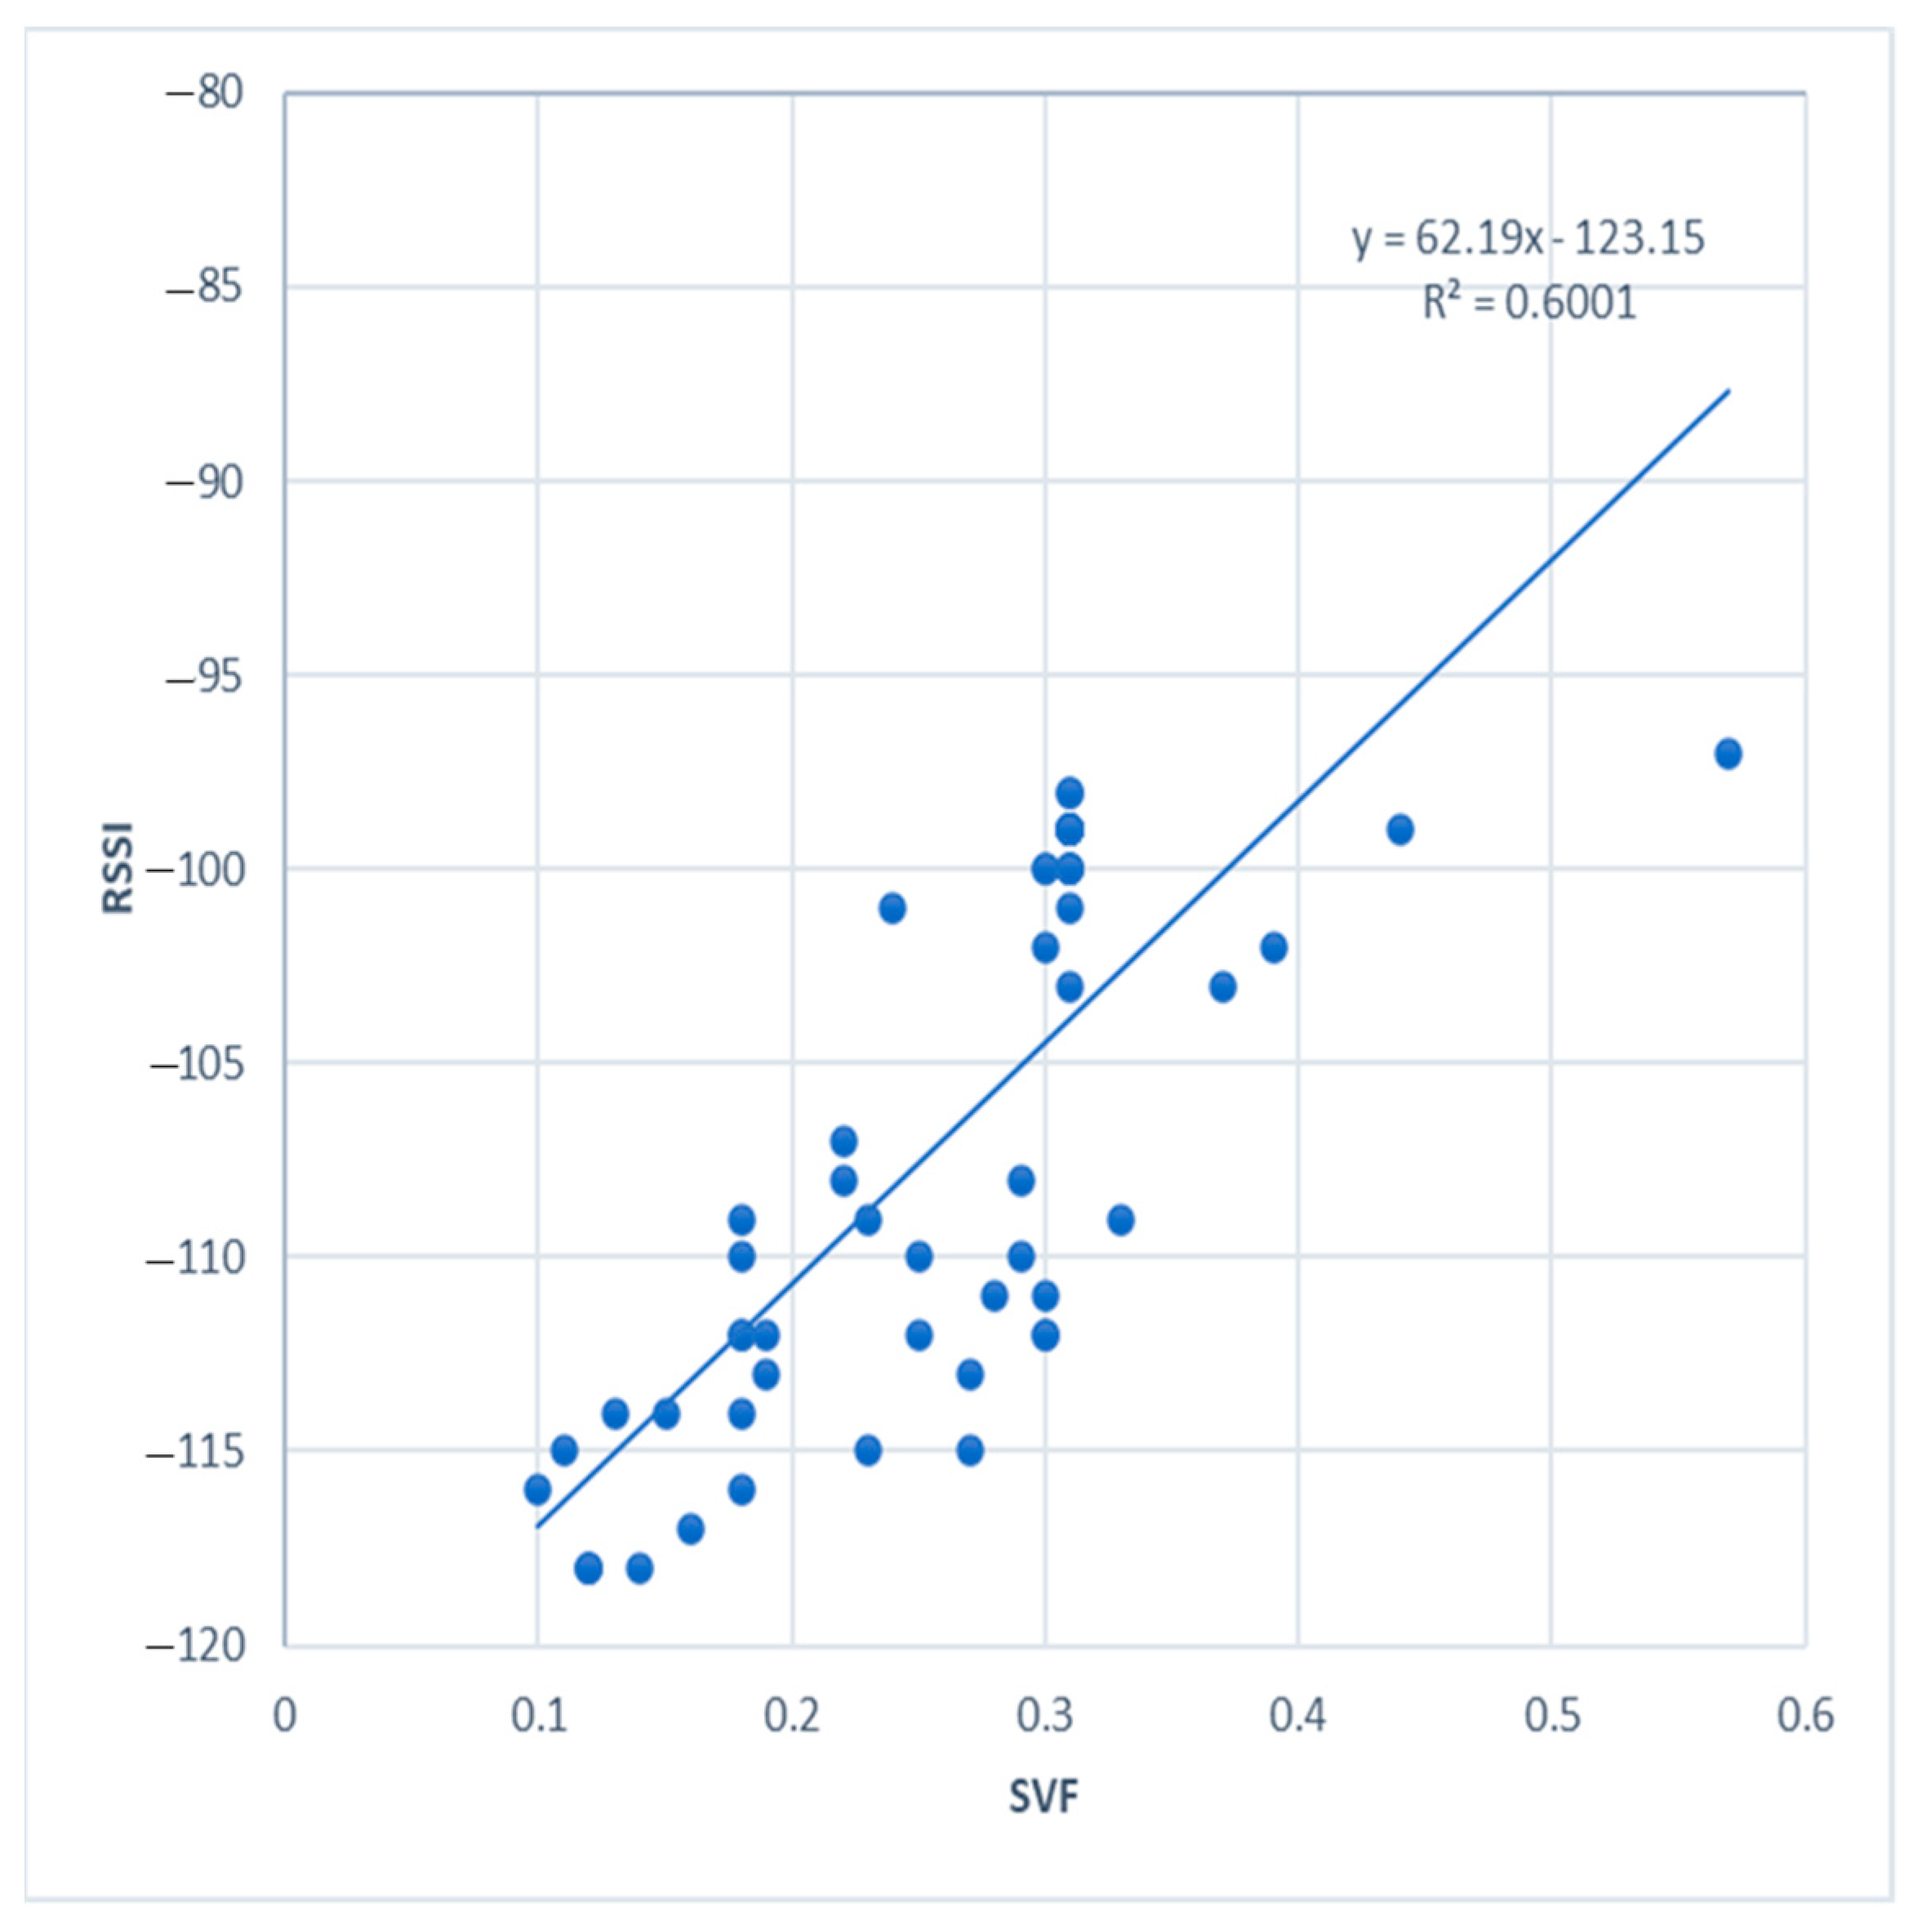
3.2. Correlation Analysis between Sky View Factor Calculation (SVF) and RSSI

To understand the effect of tree canopy openness on radio wave propagation, this study analyzed the correlation between each RSSI and the corresponding SVF distance up to 800 m. For correlation analysis, distances of up to 800 m sites were selected based on the following criteria:
  • A higher signal attenuation was observed compared to the theoretical value.
  • A large number of data was received.
  • The transmitter car was moving through mountainside.
Figure 6 shows that up to distances of 800 m, the RSSI had a significant correlation to the SVF with a coefficient R2 = 0.6. For distances up to 800 m the theoretical value was −77 dBm and the experimental value was −99 to −120 dBm. The received signal near the deciduous trees had a lower SVF. This is because the deciduous trees were irregularly shaped and broad-leaved. However, at a distance up to 800 m, the RSSI and SVF show a positive correlation and, in the case of overall experimental data, it was not dependent on the SVF. This is because trees grow randomly and are different from each other. Therefore, we selected a sample point to examine the forest canopy height in the radio wave propagation path between the GS and the transmitter at a distance up to 800 m.

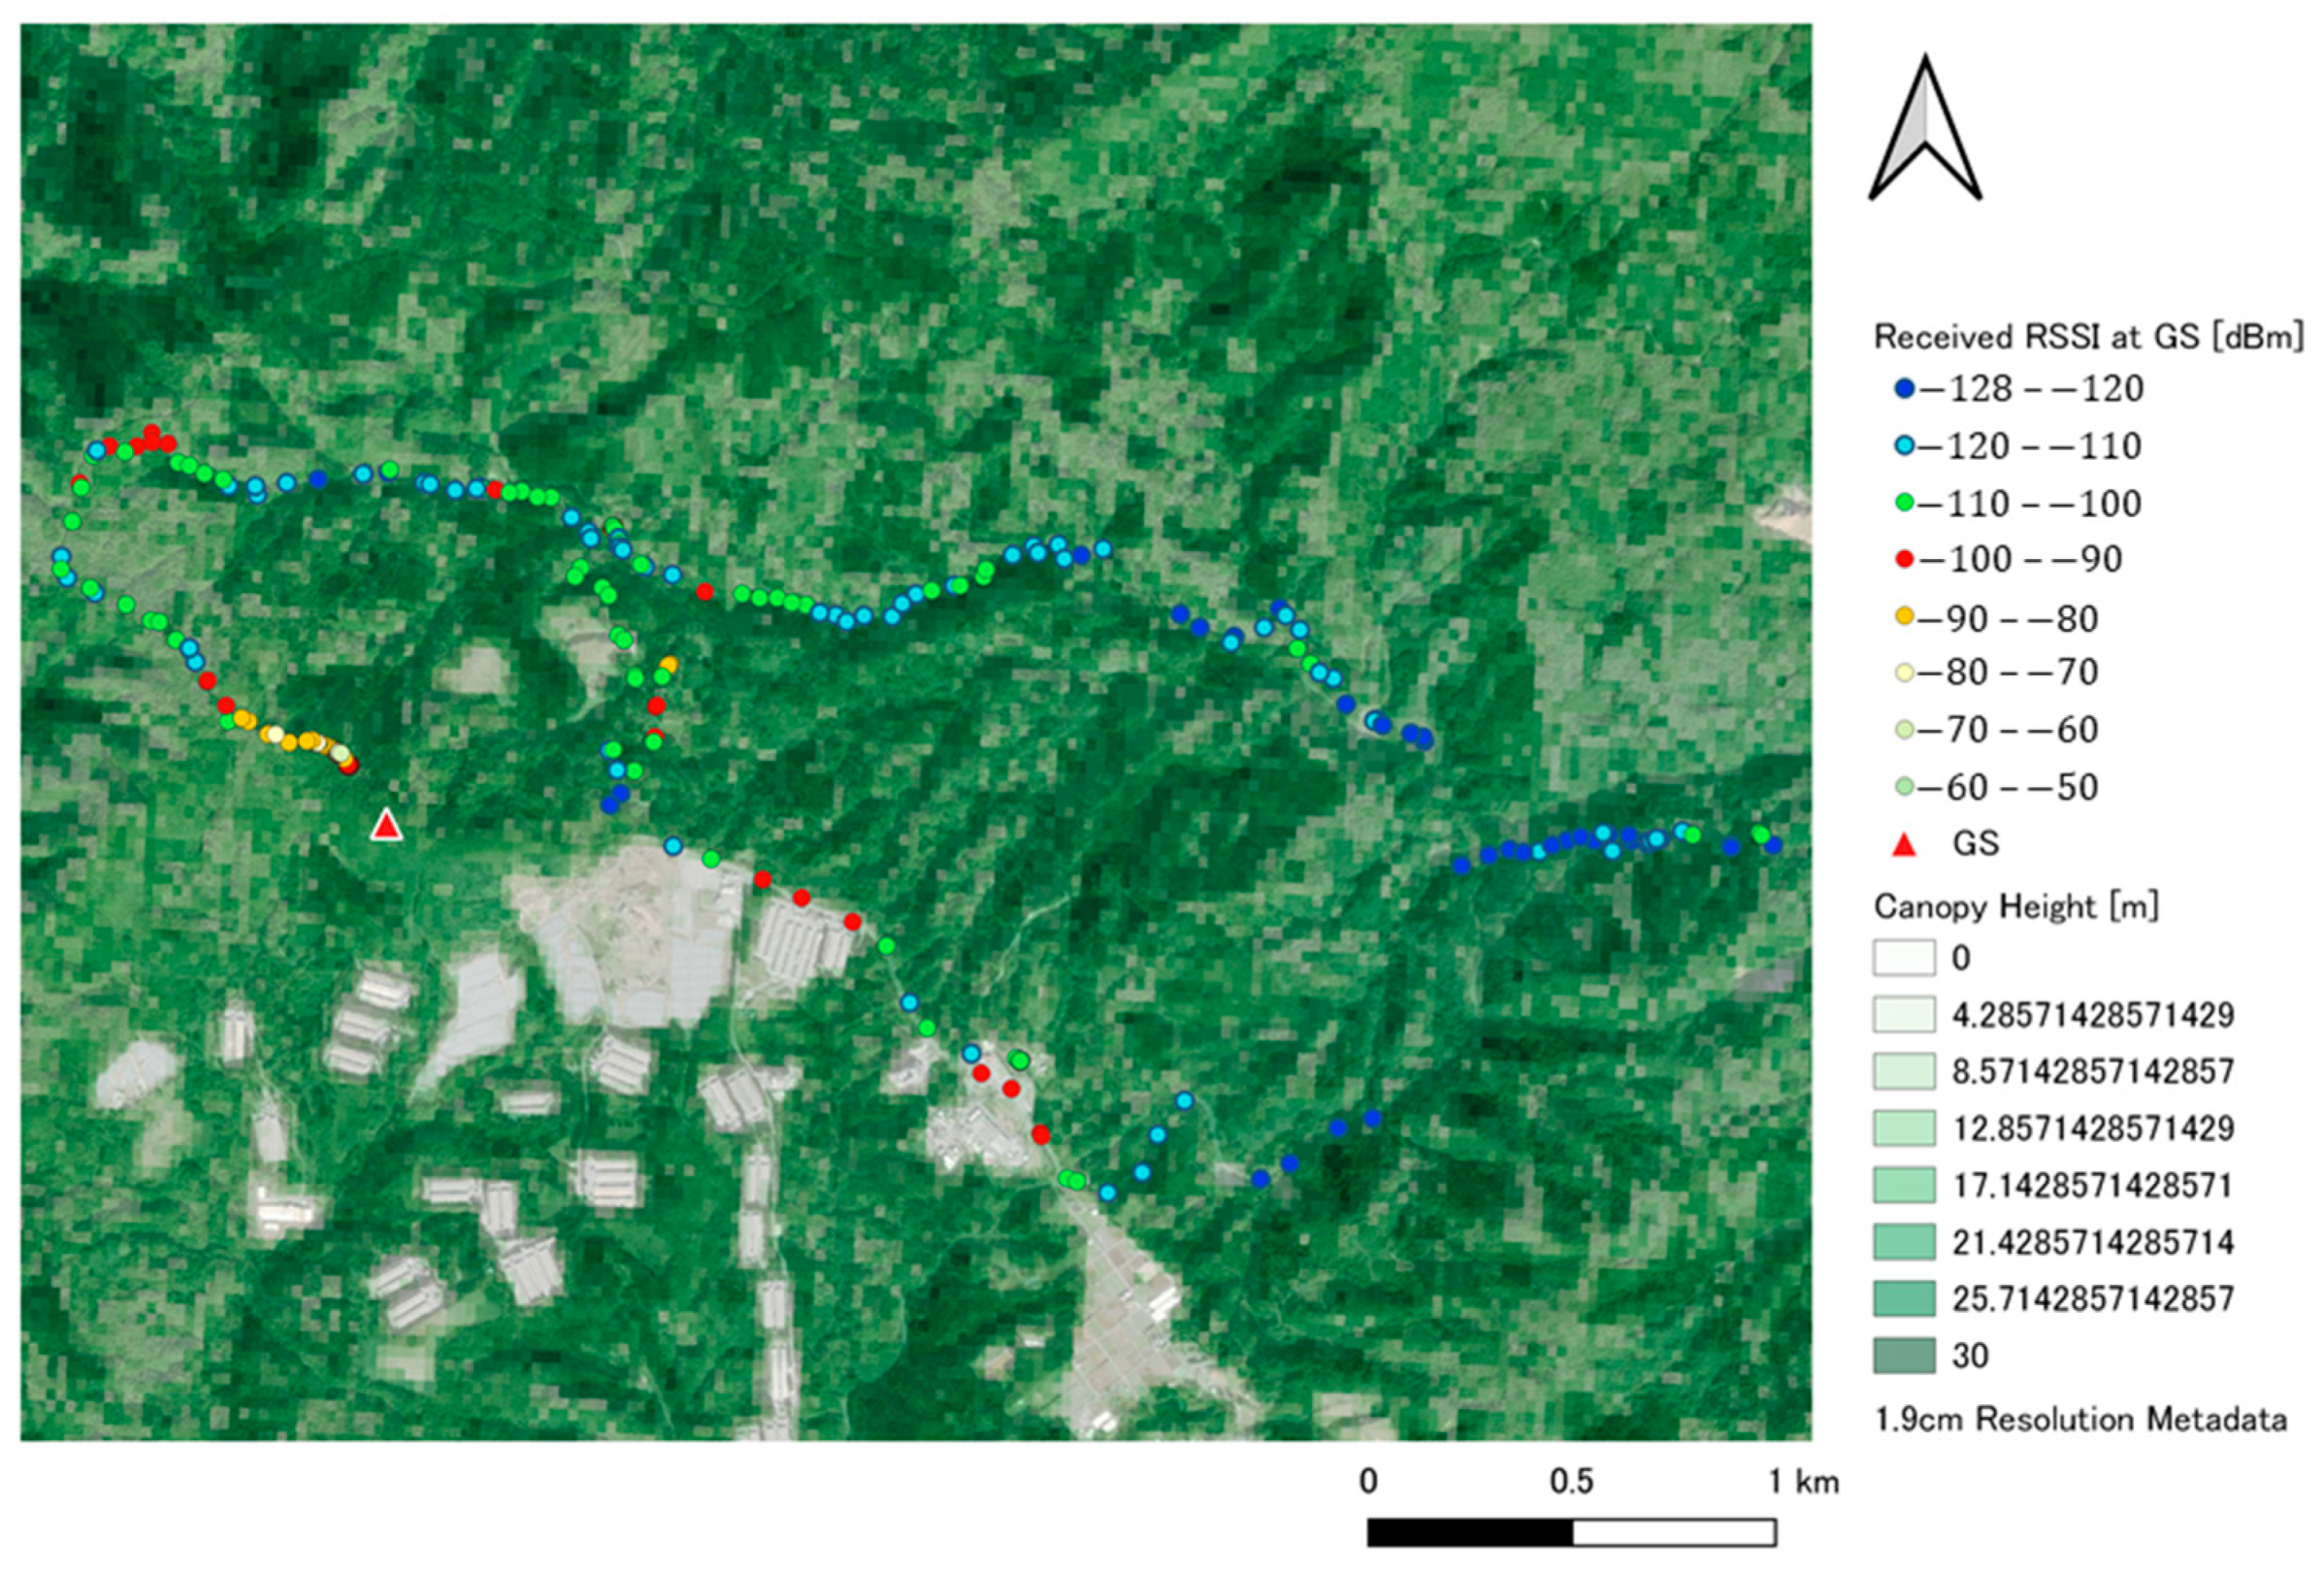
3.3. Forest Canopy Height Map

The forest canopy height map and received RSSI results at the GS are plotted in Figure 7. The forest canopy height ranged from 4.2 to 30 m in this experimental area. Color denotes the height of the canopy. The light-green and dark-green colors indicate low and high canopy heights, respectively. The forest canopy height map spatial resolution was 30 m and covered an area of approximately 1 km2.
To distinguish tree height, the canopy height map color is re-classified in Figure 8a. As shown in Figure 8, a selected sampling point is used to examine the tree height effect between the GS and the transmitter. Among the sampling points, the weakest signal was RSSI = −122. From the GS location to the weakest signal’s location, the topographic profile white arrow is examined in Figure 8a. In Figure 8b, the yellow line represents the terrain profile, and the green line is the canopy height model profile from GS to the sampling point location. In the case of the weakest signal location, as shown in Figure 8, detailed information is the following: elevation = 555 m; elevation angle = 11°; and SVF = 0.36 (Figure 9c). However, at this sampling point, the canopy openness value SVF = 0.36, which was the weakest among the sampling points. The scene of the tree canopy coverage situation photo taken by Garmin is shown in Figure 9. The sampling point profile from the GS to the transmitter car location is shown in Figure 8b. The canopy height at this site ranged from 9 to 25 m. The RSSI decreased to −122. The large attenuation values at this site were because of the canopy height between the GS and the transmitter car. From Figure 8, the weakest RSSI = −121 and −122 were both received near a canopy height of 25 m (pink colored). Signal attenuation occurred near taller, thicker coniferous trees than near deciduous trees. If the radio wave propagation path canopy height is between 23 to 25 m, there is a higher possibility of signal diffraction at the top of the tree and the RSSI decreases from −120 to −127. The signal attenuation tended to increase with tree height up to 23–25 m. The attenuation near trees is believed to decrease as the height increases because of the shadowing effect of the trees.

4. Discussion

In this study, the LoRa 920 MHz frequency band performance was evaluated in a forest environment. Evaluations based on the measured RSSI, canopy openness and tree height were examined. The discussion of the obtained results are as follows: First, the successfully reached communication range is much longer than the cited studies that followed a standard device-to-gateway communication model in a forest environment. However, measurements in the forest had an extremely short range compared to theory. The maximum communication range was 3.2 km for SF12. The quality of a signal greatly depended on the environment. For instance, at distances of up to 1 km the communication quality was greatly reduced. For a distance range within 2 km, the signal appeared to be more stable than at a distance of 1 km. This was because for distances greater than 1 km, the transmitter car was moving out of the forest area. The variations in the RSSI in the signal attenuation were because of the existence of hills and different canopy heights. Second, this is the first study to examine the effect of canopy openness on LoRa signal transmission in the context of operational LoRa performance. Signal attenuation occurred near deciduous trees compared to coniferous trees with lower SVF values. Because deciduous trees have more discrete surfaces, the signal can scatter on branches and leaves. Third, when designing communication links, we should consider the obstacles between the transmitter and the receiver. With these results, there is a higher possibility that signals will be decreased or blocked by obstacles such as trees and hills if they are of a height of 23 m or 532 m, respectively.

5. Conclusions

In the present study, 920 MHz band propagation characteristics in forested areas and tree canopy coverage and heights were investigated for the Takakuma experimental forest in Kagoshima. The aim was to evaluate the performance of the LoRa 920 MHz band (SF 12) in a forested environment. Canopy openness affects the signal quality but does not block the signal completely. According to the results, it can be concluded that the LoRa signal quality greatly depends on the environment and obstacle height, such as the hill and trees between the transmitter and receiver, which are more important than canopy-openness. The results were obtained from real experiments, and we expect that our results could provide information for developing a real IoT application using LoRa technology in a hilly forested environment. Further research is required to clarify the detailed tree density between the transmitter and receiver paths, and based on the results an optimal propagation model for the forested environment is proposed.

Author Contributions

Conceptualization, B.M.; methodology, B.M., R.M. and F.O.; software, B.M.; validation, B.M., T.N., R.M. and F.O.; formal analysis, B.M.; investigation, B.M., R.M., and F.O.; data curation, R.M., F.O., T.K., L.S., F.K., and B.C.; writing—original draft preparation, B.M.; writing—review and editing, B.M., T.N.; supervision, R.M., and T.N.; project administration, R.M., T.N and B.C.; funding acquisition, T.N. All authors have read and agreed to the published version of the manuscript.

Funding

This research was supported by SCOPE project, Ministry of Internal Affairs and Communications of Japan and the APC was funded by Tadachika Nakayama.

Acknowledgments

This paper is based on results obtained from a project commissioned by the Forest-ICT project of Kagoshima University and the Japanese National Institute of Information and Communications Technology (NICT). This experiment was conducted in cooperation with NICT. We would like to acknowledge the part of the project “Research and development of highly reliable wireless transmission technology that contributes to the utilization of next-generation UAVs” the SCOPE project, the Aerospace and Environmental Engineering Education Sky-infra in Mongolia project, and the Mongolian-Japanese Engineering Education Development Project (MJEED). In addition, we would like to thank our colleagues at the lab Wiff Verdugo Juan Paulo for the discussion and consultations.

Conflicts of Interest

The authors declare no conflict of interest.

References

  1. Gilad, D.M. The IoT Rundown for 2020: Stats, Risks and Solutions. 2020. Available online: https://securitytoday.com/Articles/2020/01/13/The-IoT-Rundown-for-2020.aspx?Page=2 (accessed on 11 September 2020).
  2. Frost and Sullivan. White Paper: Growing Convergence of LPWAN and IoT Technologies. 2017. Available online: https://rfdesignuk.com/uploads/9/4/6/0/94609530/murata_lpwan_study.pdf (accessed on 15 September 2020).
  3. The Ministry of Internal Affairs and Communication: Frequency Reorganization Action Plan. Available online: https://www.soumu.go.jp/ (accessed on 20 September 2020).
  4. Meng, Y.S.; Lee, Y.H.; Ng, B.C. Study of Propagation Loss Prediction in Forest Environment. PIER B 2009, 17, 117–133. [Google Scholar] [CrossRef] [Green Version]
  5. Weissberger, M.A. An initial critical summary of models for predicting the attenuation of radio waves by foliage. In ECAC-TR-81-101; Electromagnetic Compatibility Analysis Center: Annapolis, MD, USA, 1981. [Google Scholar]
  6. CCIR. Influences of Terrain Irregularities and Vegetation on Troposphere Propagation; CCIR Report; CCIR: Geneva, Switzerland, 1986; pp. 235–236. [Google Scholar]
  7. COST235: Radio Propagation Effect on Next-Generation Fixed Service Terrestrial Telecommunication Systems; European cooperation in the field of scientific and technical research (COST) final report; Commission of the European Unio: Luxembourg, 1996; ISBN 92-827-8023.3.
  8. Lova, O.; Murphy, A.L.; Ghiro, L.; Molteni, D.; Ossi, F.; Cagnacci, F. LoRa from the City to the Mountains: Exploration of Hardware and Environmental Factors. In Proceedings of the 2nd International Workshop on New Wireless Communication Paradigms for the Internet of Things (MadCom), Uppsala, Sweden, 20–22 February 2017. [Google Scholar]
  9. Khairol, A.A.; Mohd, S.S.; Jivitraa, D.S.; Fakroul, R.H. Impact of Foliage on LoRa 433 MHz Propagation in Tropical Environment. AIP Conf. Proc. 2018. [Google Scholar] [CrossRef]
  10. Pablo, A.V.; Fabian, A.S.; Andres, V.R.; Alcides, A. Evaluation of LoRaWAN Transmission Range for Wireless Sensor Networks in Riparian Forests. In Proceedings of the 22nd International ACM Conference on Modeling, Analysis and Simulation of Wireless and Mobile Systems, Miami Beach, FL, USA, 25–29 November 2019. [Google Scholar] [CrossRef] [Green Version]
  11. Mariana, R.V.; Joao, V.H.L.; Douglas, F.M.; Renata, I.S.P.; Cleonilson, P.S.; Orlando, B. An Evaluation of LoRa Communication Range in Urban and Forest Areas: A Case Study in Brazil and Portugal. In Proceedings of the 10th Annual Information Technology, Electronics and Mobile Communication Conference (IEMCON), Vancouver, BC, Canada, 17–19 October 2019. [Google Scholar] [CrossRef]
  12. Ferreira, A.E.; Ortiz, F.M.; Costa, L.H.; Foubert, B.; Amadou, I.; Mitton, N. A study of the LoRa signal propagation in forest, urban, and suburban environments. Ann. Telecommun. 2020. [Google Scholar] [CrossRef]
  13. Malevich, E.S.; Mikhailav, M.S.; Volkova, A.A.; Kozheinkov, K.Y. Experimental Research of X-Band Radio Wave Propagation in Forest Vegetation. In Proceedings of the 2019 International Youth Conference on Radio Electronics, Electrical and Power Engineering (REEPE), Moscow, Russia, 14–15 March 2019; pp. 1–4. [Google Scholar]
  14. LoRa Documentation. Available online: https://lora.readthedocs.io/en/latest (accessed on 25 September 2020).
  15. Semtech. Available online: https://www.semtech.com/lora (accessed on 25 September 2020).
  16. Juha, P.; Konstantin, M.; Antti, R.; Tuomo, H. On the Coverage of LPWANs: Range Evaluation and Channel Attenuation Model for LoRa Technology. In Proceedings of the 14th International Conference on ITS Telecommunications (ITST), Copenhagen, Denmark, 2–4 December 2015. [Google Scholar] [CrossRef]
  17. Philips, C.; Sicker, D.; Grunwald, D. A survey of wireless path loss prediction and coverage mapping methods. IEEE Commun. Surv. Tutor. 2013, 15, 255–270. [Google Scholar] [CrossRef]
  18. Klemen, Z.; Kristof, O.; Ziga, K. Sky-View Factor as a Relief Visualization Technique. Remote Sens 2011, 3, 398–415. [Google Scholar] [CrossRef] [Green Version]
  19. Chunping, M.; Shuai, Y.; Yuanman, H.; Huiwen, Z. Review of methods used to estimate the sky view factor in urban street canyons. Build. Environ. 2020, 168, 106497. [Google Scholar] [CrossRef]
  20. Tsuyoshi, H.; Tsu-Ping, L.; Yuhwan, S. Sky view factor measurement by using a spherical camera. J. Agric. Meteorol. 2018, 75, 59–66. [Google Scholar] [CrossRef] [Green Version]
  21. NASA GEDI. Available online: https://glad.umd.edu/dataset/gedi (accessed on 26 September 2020).
Figure 1. Flowchart of sky view factor (SVF) calculation.
Electronics 10 00502 g001
Figure 2. Experimental setup: (a) Map of Japan; (b) Experimental area; (c) Ground station located at Mt. Takatouge; (d) Transmitting station mounted on the roof of vehicle.
Electronics 10 00502 g002
Figure 3. Experimental measured data on a map.
Electronics 10 00502 g003
Figure 4. Propagation characteristics of 920 MHz band in distance: Experimental and theoretical data versus distance.
Electronics 10 00502 g004
Figure 5. Comparison between measurement data and theoretical data: (a) difference between distance up to 1, 2, and 3 km; (b) Difference of received signal strength on the map.
Electronics 10 00502 g005
Figure 6. Correlation analysis between received signal strength indicator (RSSI) and Sky View Factor (SVF).
Electronics 10 00502 g006
Figure 7. Forest Canopy height map.
Electronics 10 00502 g007
Figure 8. Sampling sites; (a) sampling points, (b) sample of profile between ground station (GS) to transmitter.
Electronics 10 00502 g008
Figure 9. Location of the weakest signal received sampling point (a) Sample of 1 grid cell of tree height map; (b) Image taken by Garmin; (c) Generated fisheye image.
Electronics 10 00502 g009
Table 1. Experimental configuration parameters.
DescriptionValue
Receiver (Rx) height2.5 m
Transmitter (Tx) power+20 mW
Antenna Gain (dB)0
Spreading Factor (sf)12
Publisher’s Note: MDPI stays neutral with regard to jurisdictional claims in published maps and institutional affiliations.

