
Evaluation Method of Immediate Effect of Local Vibratory Stimulation on Proprioceptive Control Strategy: A Pilot Study


 ,
,
Abstract
1. Introduction
2. Materials and Methods
2.1. Participants
2.2. Device
2.3. Experimental Procedure
2.3.1. Evaluation of RPW before Activation
2.3.2. Activation
2.3.3. Evaluation of RPW after Activation
2.4. Statistical Analysis
3. Results
3.1. Determination of Poor Proprioceptors
3.2. Proprioceptive Control Strategy
4. Discussion
5. Conclusions
Supplementary Materials
Author Contributions
Funding
Institutional Review Board Statement
Informed Consent Statement
Data Availability Statement
Acknowledgments
Conflicts of Interest
References
- Brumagne, S.; Cordo, P.; Verschueren, S. Proprioceptive Weighting Changes in Persons with Low Back Pain and Elderly Persons during Upright Standing. Neurosci. Lett. 2004, 366, 63–66. [Google Scholar] [CrossRef] [PubMed]
- Brumagne, S.; Janssens, L.; Knapen, S.; Claeys, K.; Suuden-Johanson, E. Persons with Recurrent Low Back Pain Exhibit a Rigid Postural Control Strategy. Eur. Spine J. 2008, 17, 1177–1184. [Google Scholar] [CrossRef] [PubMed]
- Brumagne, S.; Lysens, R.; Swinnen, S.; Verschueren, S. Effect of Paraspinal Muscle Vibration on Position Sense of the Lumbosacral Spine. Spine 1999, 24, 1328–1331. [Google Scholar] [CrossRef]
- Janssens, L.; Brumagne, S.; Polspoel, K.; Troosters, T.; McConnell, A. The Effect of Inspiratory Muscles Fatigue on Postural Control in People with and Without Recurrent Low Back Pain. Spine 2010, 35, 1088–1094. [Google Scholar] [CrossRef] [PubMed]
- Johanson, E.; Brumagne, S.; Janssens, L.; Pijnenburg, M.; Claeys, K.; Pääsuke, M. The Effect of Acute Back Muscle Fatigue on Postural Control Strategy in People with and Without Recurrent Low Back Pain. Eur. Spine J. 2011, 20, 2152–2159. [Google Scholar] [CrossRef]
- Henry, S.M.; Hitt, J.R.; Jones, S.L.; Bunn, J.Y. Decreased Limits of Stability in Response to Postural Perturbations in Subjects with Low Back Pain. Clin. Biomech. 2006, 21, 881–892. [Google Scholar] [CrossRef]
- Bloem, B.R.; Allum, J.H.; Carpenter, M.G.; Honegger, F. Is Lower Leg Proprioception Essential for Triggering Human Automatic Postural Responses? Exp. Brain Res. 2000, 130, 375–391. [Google Scholar] [CrossRef]
- Mok, N.W.; Brauer, S.G.; Hodges, P.W. Hip Strategy for Balance Control in Quiet Standing Is Reduced in People with Low Back Pain. Spine 2004, 29, E107–E112. [Google Scholar] [CrossRef]
- Claeys, K.; Brumagne, S.; Dankaerts, W.; Kiers, H.; Janssens, L. Decreased Variability in Postural Control Strategies in Young People with Non-Specific Low Back Pain Is Associated with Altered Proprioceptive Reweighting. Eur. J. Appl. Physiol. 2011, 111, 115–123. [Google Scholar] [CrossRef]
- Ito, T.; Sakai, Y.; Yamazaki, K.; Igarashi, K.; Sato, N.; Yokoyama, K.; Morita, Y. Proprioceptive Change Impairs Balance Control in Older Patients with Low Back Pain. J. Phys. Ther. Sci. 2017, 29, 1788–1792. [Google Scholar] [CrossRef]
- Ito, T.; Sakai, Y.; Morita, Y.; Yamazaki, K.; Igarashi, K.; Nishio, R.; Sato, N. Proprioceptive Weighting Ratio for Balance Control in Static Standing Is Reduced in Elderly Patients with Non-Specific Low Back Pain. Spine 2018, 43, 1704–1709. [Google Scholar] [CrossRef] [PubMed]
- Ito, T.; Sakai, Y.; Ito, Y.; Yamazaki, K.; Morita, Y. Association between Back Muscle Strength and Proprioception or Mechanoreceptor Control Strategy in Postural Balance in Elderly Adults with Lumbar Spondylosis. Healthcare 2020, 8, 58. [Google Scholar] [CrossRef] [PubMed]
- Ito, T.; Sakai, Y.; Nishio, R.; Ito, Y.; Yamazaki, K.; Morita, Y. Relationship Between Postural Stability and Fall Risk in Elderly People with Lumbar Spondylosis During Local Vibratory Stimulation for Proprioception: A Retrospective Study. Somatosens. Mot. Res. 2020, 37, 133–137. [Google Scholar] [CrossRef] [PubMed]
- Brumagne, S.; Janssens, L.; Janssens, E.; Goddyn, L. Altered Postural Control in Anticipation of Postural Instability in Persons with Recurrent Low Back Pain. Gait Posture 2008, 28, 657–662. [Google Scholar] [CrossRef] [PubMed]
- Goossens, N.; Janssens, L.; Pijnenburg, M.; Caeyenberghs, K.; Van Rompuy, C.; Meugens, P.; Sunaert, S.; Brumagne, S. Test–Retest Reliability and Concurrent Validity of an fMRI-Compatible Pneumatic Vibrator to Stimulate Muscle Proprioceptors. Multisens. Res. 2016, 29, 465–492. [Google Scholar] [CrossRef]
- Capicíková, N.; Rocchi, L.; Hlavacka, F.; Chiari, L.; Cappello, A. Human Postural Response to Lower Leg Muscle Vibration of Different Duration. Physiol. Res. 2006, 55 (Suppl. 1), S129–S134. [Google Scholar]
- Barbieri, G.; Gissot, A.S.; Fouque, F.; Casillas, J.M.; Pozzo, T.; Pérennou, D. Does Proprioception Contribute to the Sense of Verticality? Exp. Brain Res. 2008, 185, 545–552. [Google Scholar] [CrossRef]
- Ceyte, H.; Cian, C.; Zory, R.; Barraud, P.A.; Roux, A.; Guerraz, M. Effect of Achilles Tendon Vibration on Postural Orientation. Neurosci. Lett. 2007, 416, 71–75. [Google Scholar] [CrossRef]
- Thompson, C.; Bélanger, M.; Fung, J. Effects of Bilateral Achilles tendon Vibration on Postural Orientation and Balance during Standing. Clin. Neurophysiol. 2007, 118, 2456–2467. [Google Scholar] [CrossRef]
- Roll, J.P.; Vedel, J.P. Kinaesthetic Role of Muscle Afferents in Man, Studied by Tendon Vibration and Microneurography. Exp. Brain Res. 1982, 47, 177–190. [Google Scholar] [CrossRef]
- Pyykkö, I.; Jäntti, P.; Aalto, H. Postural Control in Elderly Subjects. Age Ageing 1990, 19, 215–221. [Google Scholar] [CrossRef] [PubMed]
- Albert, F.; Bergenheim, M.; Ribot-Ciscar, E.; Roll, J.P. The Ia Afferent Feedback of a Given Movement Evokes the Illusion of the Same Movement When Returned to the Subject via Muscle Tendon Vibration. Exp. Brain Res. 2006, 172, 163–174. [Google Scholar] [CrossRef] [PubMed]
- Kuroki, S.; Hagura, N.; Nishida, S.; Haggard, P.; Watanabe, J. Sanshool on the Fingertip Interferes with Vibration Detection in a Rapidly Adapting (RA) Tactile Channel. PLoS ONE 2016, 11, e0165842. [Google Scholar] [CrossRef] [PubMed]
- Wu, G.; Ekedahl, R.; Stark, B.; Carlstedt, T.; Nilsson, B.; Hallin, R.G. Clustering of Pacinian Corpuscle Afferent Fibres in the Human Median Nerve. Exp. Brain Res. 1999, 126, 399–409. [Google Scholar] [CrossRef] [PubMed]
- Brumagne, S.; Cordo, P.; Lysens, R.; Verschueren, S.; Swinnen, S. The Role of Paraspinal Muscle Spindles in Lumbosacral Position Sense in Individuals with and Without Low Back Pain. Spine 2000, 25, 989–994. [Google Scholar] [CrossRef] [PubMed]
- Tjernström, F.; Fransson, P.A.; Hafström, A.; Magnusson, M. Adaptation of Postural Control to Perturbations—A Process That Initiates Long-Term Motor Memory. Gait Posture 2002, 15, 75–82. [Google Scholar] [CrossRef]
- Burke, D.; Hagbarth, K.E.; Löfstedt, L.; Wallin, B.G. The Responses of Human Muscle Spindle Endings to Vibration of Non-Contracting Muscles. J. Physiol. 1976, 261, 673–693. [Google Scholar] [CrossRef]
- Boucher, J.A.; Normand, M.C.; Descarreaux, M. Trunk Isometric Force Production Parameters during Erector Spinae Muscle Vibration at Different Frequencies. J. Neuroeng. Rehabil. 2013, 10, 89. [Google Scholar] [CrossRef]
- Roland, M.; Morris, R. A Study of the Natural History of Back Pain. Part I: Development of a Reliable and Sensitive Measure of Disability in Low-Back Pain. Spine 1983, 8, 141–144. [Google Scholar] [CrossRef]
- Clark, R.A.; Mentiplay, B.F.; Pua, Y.H.; Bower, K.J. Reliability and Validity of the Wii Balance Board for Assessment of Standing Balance: A Systematic Review. Gait Posture 2018, 61, 40–54. [Google Scholar] [CrossRef]
- Young, W.; Ferguson, S.; Brault, S.; Craig, C. Assessing and Training Standing Balance in Older Adults: A Novel Approach Using the “Nintendo Wii” Balance Board. Gait Posture 2011, 33, 303–305. [Google Scholar] [CrossRef] [PubMed]
- Holmes, J.D.; Jenkins, M.E.; Johnson, A.M.; Hunt, M.A.; Clark, R.A. Validity of the Nintendo Wii® Balance Board for the Assessment of Standing Balance in Parkinson’s Disease. Clin. Rehabil. 2013, 27, 361–366. [Google Scholar] [CrossRef] [PubMed]
- Nishio, R.; Ito, Y.; Morita, Y.; Ito, T.; Yamazaki, K.; Sakai, Y. Investigation of the Functional Decline in Proprioceptors for Low Back Pain Using the Sweep Frequency Method. Appl. Sci. 2019, 9, 4988. [Google Scholar] [CrossRef]
- Toosizadeh, N.; Ehsani, H.; Miramonte, M.; Mohler, J. Proprioceptive Impairments in High Fall Risk Older Adults: The Effect of Mechanical Calf Vibration on Postural Balance. Biomed. Eng. Online 2018, 17, 51. [Google Scholar] [CrossRef]


| Variables | NSLBP (n = 6) |
|---|---|
| Age, years | 71.7 ± 7.0 |
| Height, cm | 152.1 ± 10.9 |
| Weight, kg | 53.1 ± 19.8 |
| BMI, kg/m2 | 22.4 ± 6.0 |
| VAS, cm | 5.6 ± 1.9 |
| RDQ (score) | 12.8 ± 5.0 |
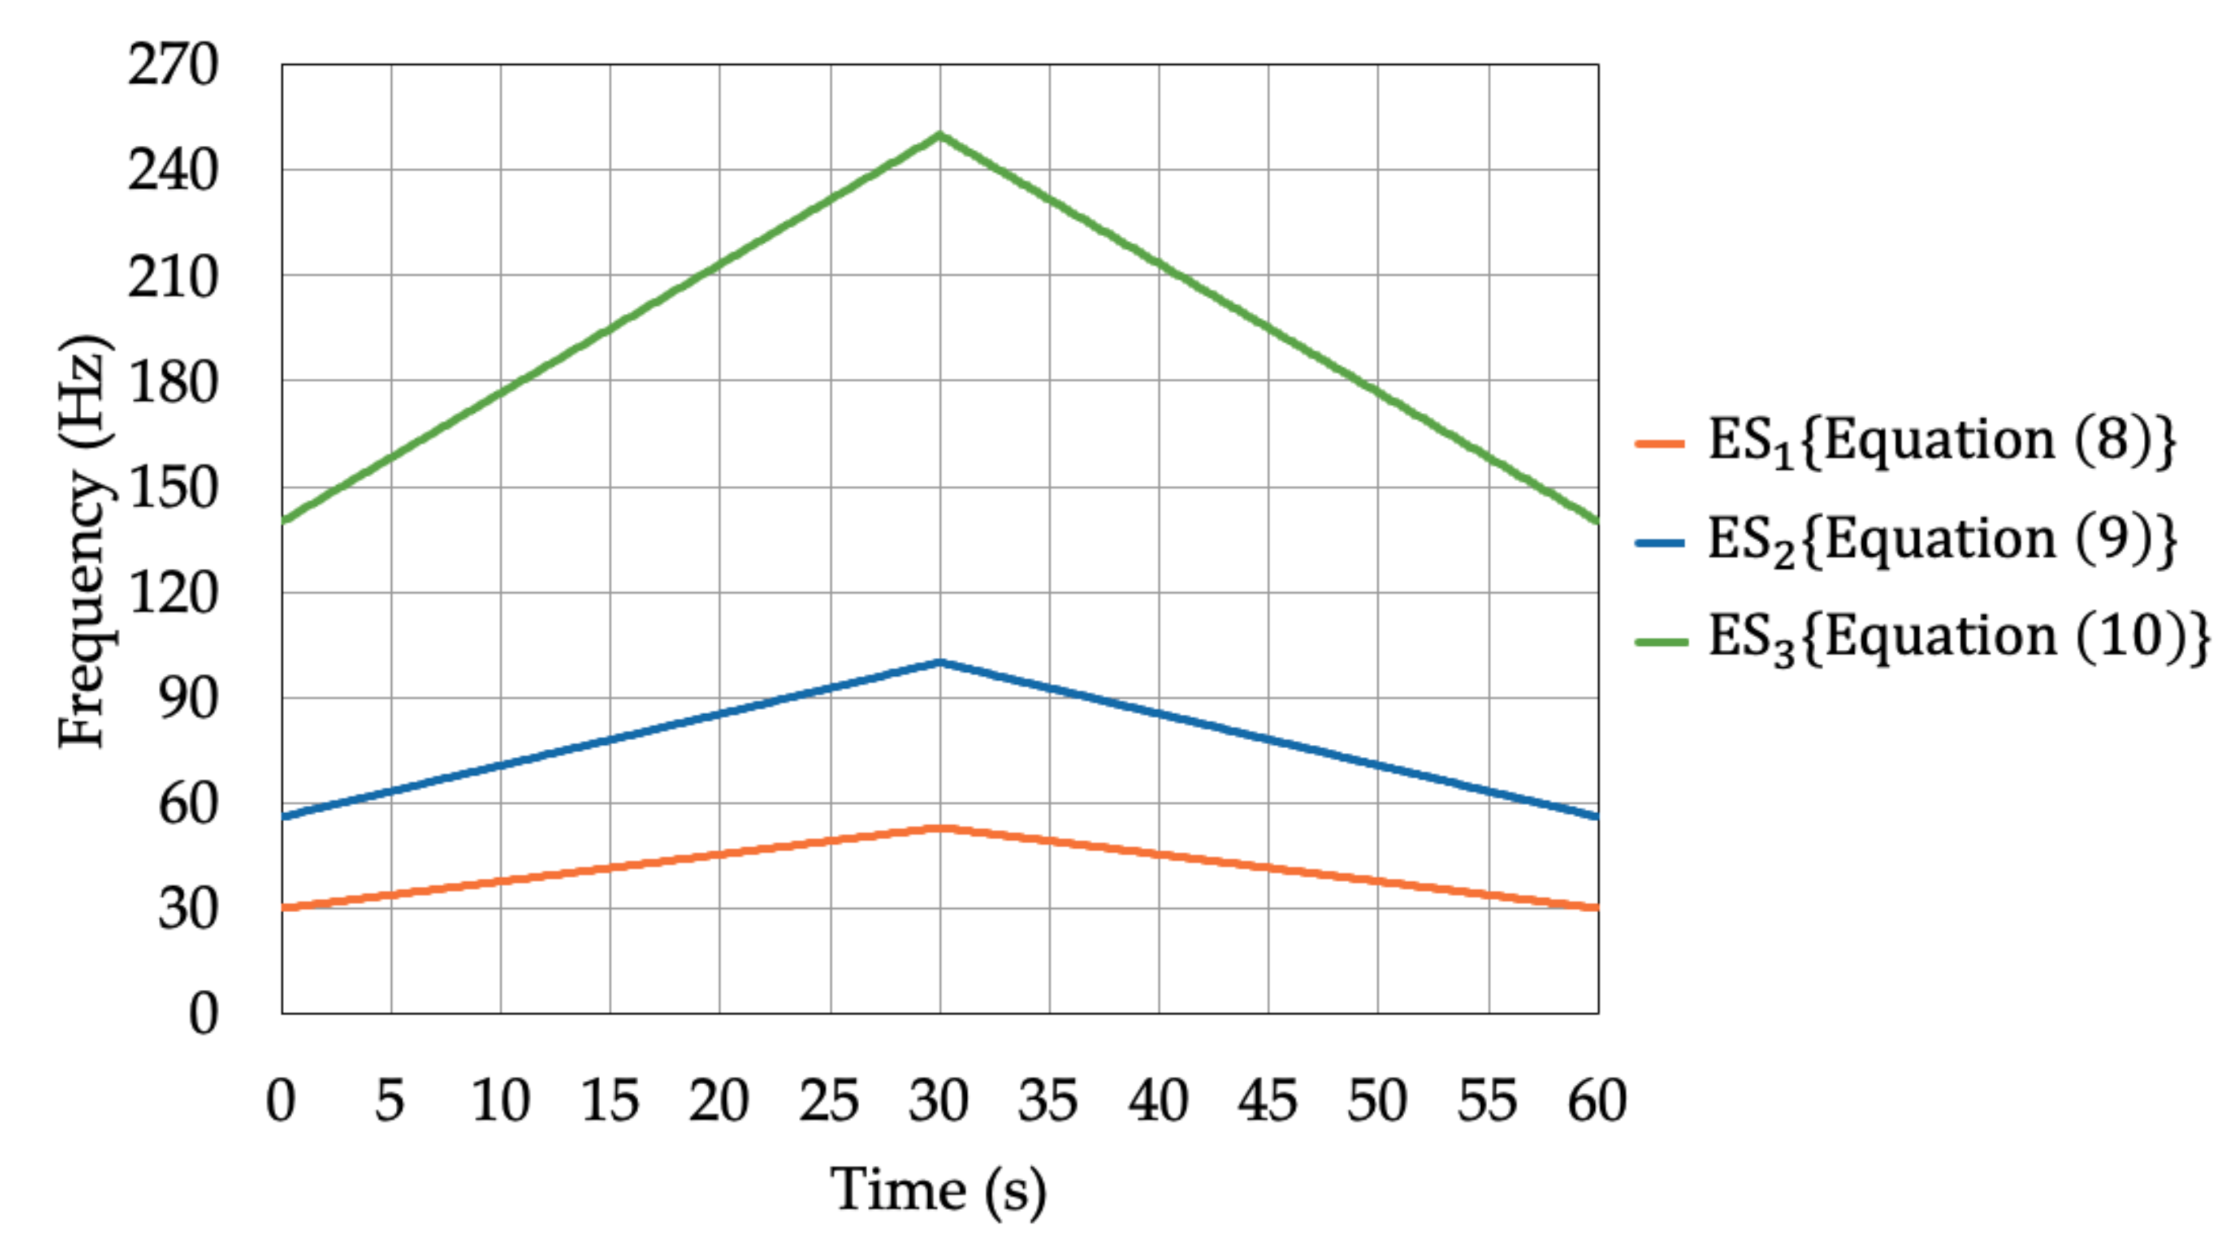
| ESi | Frequency (Hz) | Corresponding Proprioceptors |
|---|---|---|
| ES1 | 30–53 | Muscle spindles (lower frequency) |
| ES2 | 56–100 | Muscle spindles (higher frequency) |
| ES3 | 140–250 | Vater-Pacini corpuscle |
| ESi | Number of Data Series | Frequency Ascend Mode | Frequency Descend Mode | Corresponding Frequency (Hz) |
|---|---|---|---|---|
| ES1 | 1750 | 7250 | 30 | |
| 3250 | 5750 | 53 | ||
| ES2 | 3400 | 5600 | 56 | |
| 4900 | 4100 | 100 | ||
| ES3 | 5780 | 3220 | 140 | |
| 7280 | 1720 | 250 |
| NSLBP | Determined Poor Proprioceptor | |||
|---|---|---|---|---|
| No. 1 | −4.9 | −16.1 | −5.0 | Muscle spindles (higher frequency) of GS |
| No. 2 | +6.7 | +9.5 | −7.1 | Muscle spindles (higher frequency) of LM |
| No. 3 | +0.4 | −0.8 | +12.3 | Vater-Pacini corpuscle of LM |
| No. 4 | +11.2 | +19.6 | −1.1 | Muscle spindles (higher frequency) of LM |
| No. 5 | +4.4 | +1.2 | −7.1 | Vater-Pacini corpuscle of GS |
| No. 6 | −29.2 | +18.3 | +29.7 | Vater-Pacini corpuscle of LM |
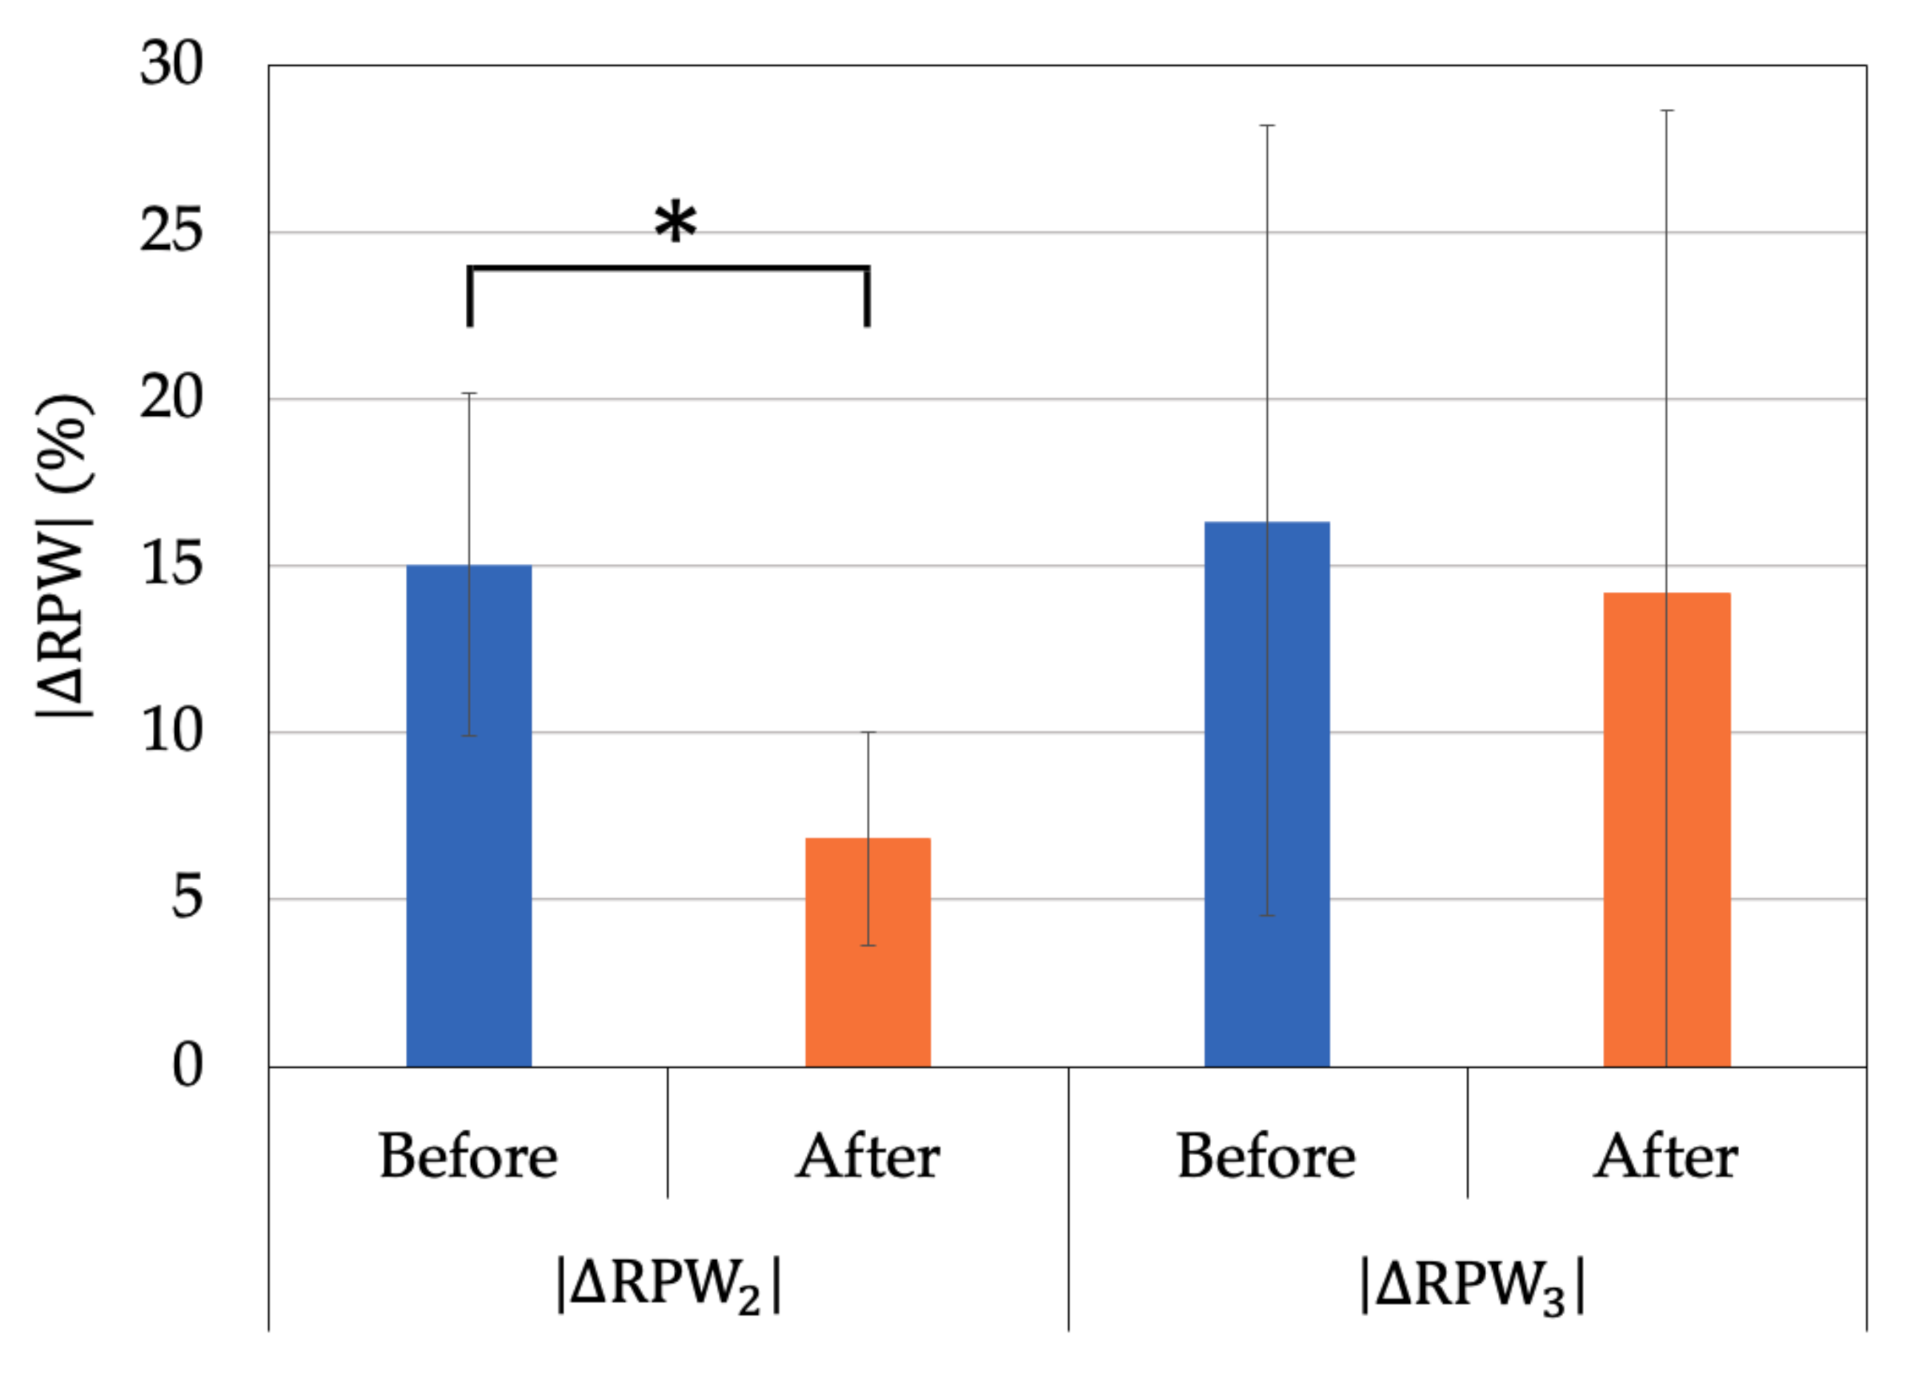
| Variable | NSLBP | Before | After | P |
|---|---|---|---|---|
| No. 1,2,4 | 15.0 ± 5.1 | 6.8 ± 3.2 | 0.05 | |
| No. 3,5,6 | 16.3 ± 11.8 | 14.2 ± 14.4 | 0.607 |
Publisher’s Note: MDPI stays neutral with regard to jurisdictional claims in published maps and institutional affiliations. |
© 2021 by the authors. Licensee MDPI, Basel, Switzerland. This article is an open access article distributed under the terms and conditions of the Creative Commons Attribution (CC BY) license (http://creativecommons.org/licenses/by/4.0/).
Share and Cite
Ito, Y.; Kawai, K.; Morita, Y.; Ito, T.; Yamazaki, K.; Kato, Y.; Sakai, Y. Evaluation Method of Immediate Effect of Local Vibratory Stimulation on Proprioceptive Control Strategy: A Pilot Study. Electronics 2021, 10, 341. https://doi.org/10.3390/electronics10030341
Ito Y, Kawai K, Morita Y, Ito T, Yamazaki K, Kato Y, Sakai Y. Evaluation Method of Immediate Effect of Local Vibratory Stimulation on Proprioceptive Control Strategy: A Pilot Study. Electronics. 2021; 10(3):341. https://doi.org/10.3390/electronics10030341
Chicago/Turabian StyleIto, Yohei, Keitaro Kawai, Yoshifumi Morita, Tadashi Ito, Kazunori Yamazaki, Yoshiji Kato, and Yoshihito Sakai. 2021. "Evaluation Method of Immediate Effect of Local Vibratory Stimulation on Proprioceptive Control Strategy: A Pilot Study" Electronics 10, no. 3: 341. https://doi.org/10.3390/electronics10030341
APA StyleIto, Y., Kawai, K., Morita, Y., Ito, T., Yamazaki, K., Kato, Y., & Sakai, Y. (2021). Evaluation Method of Immediate Effect of Local Vibratory Stimulation on Proprioceptive Control Strategy: A Pilot Study. Electronics, 10(3), 341. https://doi.org/10.3390/electronics10030341