Article

A Multi-Scale Feature Extraction-Based Normalized Attention Neural Network for Image Denoising

1
School of Automation Science and Electrical Engineering, Beihang University, Beijing 100191, China
2
School of Cyber Science and Technology, Beihang University, Beijing 100191, China
*
Author to whom correspondence should be addressed.
Electronics 2021, 10(3), 319; https://doi.org/10.3390/electronics10030319
Submission received: 28 December 2020 / Revised: 24 January 2021 / Accepted: 25 January 2021 / Published: 29 January 2021
(This article belongs to the Section Computer Science & Engineering)

Abstract

:
Due to the rapid development of deep learning and artificial intelligence techniques, denoising via neural networks has drawn great attention due to their flexibility and excellent performances. However, for most convolutional network denoising methods, the convolution kernel is only one layer deep, and features of distinct scales are neglected. Moreover, in the convolution operation, all channels are treated equally; the relationships of channels are not considered. In this paper, we propose a multi-scale feature extraction-based normalized attention neural network (MFENANN) for image denoising. In MFENANN, we define a multi-scale feature extraction block to extract and combine features at distinct scales of the noisy image. In addition, we propose a normalized attention network (NAN) to learn the relationships between channels, which smooths the optimization landscape and speeds up the convergence process for training an attention model. Moreover, we introduce the NAN to convolutional network denoising, in which each channel gets gain; channels can play different roles in the subsequent convolution. To testify the effectiveness of the proposed MFENANN, we used both grayscale and color image sets whose noise levels ranged from 0 to 75 to do the experiments. The experimental results show that compared with some state-of-the-art denoising methods, the restored images of MFENANN have larger peak signal-to-noise ratios (PSNR) and structural similarity index measure (SSIM) values and get better overall appearance.

1. Introduction

Image denoising is a fundamental and classic topic of image processing tasks. Due to the varying environment and sensor noise, the captured image usually contains noise and the transmission and storage process may also cause the image to be degraded by noise [1]. Therefore, image denoising is an important and indispensable part of many high-level vision tasks [2,3,4]. Additive White Gaussian noise (AWGN) is the most representative noise among all kind of noises and we make a common assumption that the images are degraded by AWGN. The model of an image which is degraded by AWGN can be described as: y = x + v , where y is the observed degraded image, x is the noiseless clean image, v is the AWGN with zero mean and standard deviation is σ . The image denoising problem is to restore the noiseless clean image x from the observed image y.
Recently, a large number of methods have been proposed for image denoising [5,6,7,8,9]. A direct way to restore the image is to estimate the noise v, and the noiseless clean image is acquired by y v . However, for a long period, accurately estimating the noise was once a difficult and almost impossible mission. Before the convolutional neural networks become popular, in [10], a deep convolutional neural residue network was proposed to learn the noise, which got superior results to many typical denoising methods. The bilateral filter [11] is a kind of widely used denoising method for its adaptability and good performance, but the performance decreases rapidly at high noise levels. An improvement was the non-local means (NLM) denoising method [12], which is achieved under the assumption that natural scenes tend to repeat themselves in the same and different scales. NLM acquires better performance than the bilateral filter, but a difficulty for NLM is to tune the hyper-parameters which depend on the noise’s standard deviations, so an improper choice of hyper-parameters would cause it to lose edges or leave noise. Ville uses Stein’s unbiased risk estimate to monitor the mean square errors and avoid tuning the hyper-parameters [13]. BM3D [14] reaches the peak of the improved NLM methods, and it is a benchmark for image denoising methods. Transform domain denoising is another kind of popular denoising method [15,16]. It transforms a noisy image to a transform domain and removes noise by tuning the coefficients. Fourier transform denoising (FTD) is a typical transform domain denoising method [17]. It transforms a noisy image to the frequency domain and removes frequencies connected with noise, and recovers the image by inverse Fourier transform. FTD faces a difficulty in determining whether the high frequency information is noise or features. Wavelet domain denoising is a development of the Fourier transform, which maps an image to the wavelet domain; the wavelet coefficients of higher amplitude are information; noise is removed by clipping smaller amplitude coefficients [18,19]. Rajwade in [20] used singular value decomposition for image denoising; noises are considered to relate to smaller singular values, and the noises are removed by dropping smaller singular values. Sparse and redundant representation is another popular transform domain denoising method, which trains a redundant dictionary from the noisy image, and acquires a restored image by optimizing an object function with sparse coefficients priors [9]. Protter [21] generalized the sparse and representation methods to image sequence denoising. Later, sparse and representation methods were combined with non-local means to get better performance [22]. There are also many other denoising methods, such as total variation [23,24] and statistical neighborhood approaches [25]. Most of the above methods are model-based methods that rely on prior knowledge, and they are realized by optimization methods. Three drawbacks for these methods are trying to balance the noise removal and detail-preservation, choosing the prior knowledge and searching for the optimal solution.
An alternative way is the discriminate learning methods, which learn the mapping that maps noisy images to corresponding noiseless clean ones. Burger in [26] proposed a plain neural network for image denoising, which acquires comparable performance to BM3D. ZhangK in [10] proposed a fully convolutional network for image denoising. By learning the residue of an image, it can not only remove AWGN, but also work on other image processing tasks, such as image super-resolution and image deblocking. However, for the above discriminate learning methods, they demand training models for each noise level, which brings great inconvenience. To tackle this problem, Isogawa in [3] proposed a novel activation function with a varying threshold; the noisy images with different noise levels are restored by a unique network. Zhang et al. [27] used the down-sampled sub-images to train the model and adopted the noisy image and noise level map as the input; noisy images under different noise levels can be handled by a single network. Lefkimmiatis in [28] integrates non-local self-similarity into a convolutional neural network (CNN) and gets results competitive with many state-of-the-art methods.
Although the CNN achieves excellent denoising effects, for most CNN based methods, the convolution kernels are of a size of one; the features on distinct scales are neglected. In addition, all the channels of features are treated equally; the relationships of channels are not considered. In this paper, we propose a multi-scale feature extraction-based normalized attention neural network for image denoising. In MFENANN, we define a feature extraction block which extracts and combines features at scales of 1 × 1 , 3 × 3 and 5 × 5 of the noisy image. Moreover, we introduce 1D normalization techniques to NAN, which smooths the optimization landscape in training, and refines the relationship between channels. Furthermore, we introduce the NAN to MFENANN for denoising, in which every channel is augmented by assigning an amount of gain. In this paper, we take the down-sampled images to train the network, which enlarges the receptive field, and reduces the number of calculations in the training. A residual net is used to avoid losing shallow features. Moreover, the network learns the residue of the noisy image, and the noiseless clean image is obtained from the difference between the noisy image and the residue.
In general, the contributions of the paper are summarized as follows: (1) We define a feature extraction block to extract and combine different scale features of the noisy image, which causes the feature maps to contain more detailed information of the original image, and enhances the ability of the network to maintain details. (2) We propose a normalized attention network to learn the relationship between channels, which smooths the optimization landscape and speeds up the convergence process for training an attention model. (3) We introduce NAN to image denoising, in which each channel gets an amount of gain, and channels play different roles in the subsequent convolution, which improves the performance of image denoising.

2. Related Works

2.1. Residual Network

The residual network (ResNet) [29] was proposed by He, in which the underlying mapping of stacked layers is addressed as H ( X ) , and the output of the ResNet block is addressed as F ( X ) , where X is the input. The process to learn the output F ( X ) is called residual learning. The concrete model is defined as:
H ( X ) = F ( W , X ) + X
where F ( · , · ) is the residual mapping to be learned and F ( W , X ) = F ( X ) . ResNet is helpful to avoid a vanishing gradient when the network is deep, and greatly improves recognition accuracy. Later, He in [30] demonstrated the theories of ResNet and improved ResNet. Soon ResNet drew great interest and many variants appeared [31,32]. Huang in [33] proposed DenseNet, in which each layer before another layer is connected to the layer as the input; it is widely used for its flexibility and good performance. Later, ResNet was widely used in computer vision tasks, such as image super-resolution [34] and pedestrian trajectory prediction [35].

2.2. Batch Normalization and SENet

With the rapid development of deep learning, many techniques have been proposed to raise efficiency and improve performance. Rectified linear unit (Relu) [36,37] is a widely used unsaturated activation function, which relieves the vanishing gradient problem and accelerates convergence speed. The convolution [38] greatly reduces the number of calculations for sharing weights. The dropout [39] decreases overfitting for networks. The inception [40] is used to extract different scales’ features and concatenates them for subsequent convolution.
(1) Batch normalization (BN): BN [41] is proposed for increasing the accuracy of classification, which decreases the number of calculations and simplifies the process of parameter adjustment. Santurkar in [42] analyzed the principle of why batch normalization can improve performance. He pointed out that no evidence shows BN stands in relation to interval covariate shift and put forward the idea that BN improves the performance by smoothing the optimization landscape in the training. He also has testified that networks can achieve similar, even better performance by using other normalization techniques. Recently, BN has been widely used in networks for image denoising [3,10,27].
(2) SENet: SENet [43] is an attention network that learns the relationships between channels, in which every channel is augmented with an amount of gain. SENet squeezes every channel to be a point with the average value; after the forward propagation of the two-layer fully connected (FC) network, the outputs are gains, and each channel is augmented by the corresponding gain. Wang in [44] used 1D convolution instead of an FC layer, which improved computational efficiency. Li in [45] proposed a selective kernel network which chooses kernel size for each channel by learning.

3. Proposed MFENANN for Image Denoising

In this section, we detail the MFENANN proposed for image denoising. In MFENANN, we define a simple multi-scale feature extraction block which extracts different scale features from noisy image with convolution kernels of different sizes. Moreover, we propose a normalized attention network to learn the relationship between channels which improves SENet by adding 1D normalization techniques. In addition, we introduce the normalized attention network to CNN denoising, in which, each channel gets an amount of gain, and channels play different roles in subsequent convolution. We also define ResNet blocks for MFENANN, which can effectively integrate shallow and deep features and avoid vanishing gradient problem. In the training phase, we assume the size of batchsize is N, and randomly generate N values in the noise level range as the noise standard deviations. We expand each standard deviation into a tensor with the same length and width as the input image as the noise level map and add noise to the corresponding image in the batch. In the testing phase, if the noise level is known, we expand it into a tensor with the same length and width as the input image as the noise level map.

3.1. Network Architecture

Figure 1 shows the architecture of the proposed MFENANN. We down-sample the noisy image using an interlaced sampling way and concatenate the down-sampled subimages and the noise level map as the input for network. Suppose the size of the noisy image is W × H × C , where W is the width of image, H is the height of image and C is the number of channels. Therefore, the size of input for MFENANN is W 2 × H 2 × ( 4 C + 1 ) for grayscale image, and W 2 × H 2 × ( 4 C + 3 ) for color image. The multi-scale feature extraction block (MFEBlk) is used to extract and combine distinct scale features for the subsequent convolution. The Relu function has the form of m a x ( 0 , · ) . MFEBlk is detailed in Figure 2. ResNetBlock is a defined ResNet block, which is detailed in Figure 3. NAN is the normalized attention block which is detailed in Figure 4. In MFENANN, there are five ResNetBlocks and four NAN blocks, the number of layers is 21. The output of network is residue rather than the clean image. The clean image is obtained as follows:
X ^ = Y r e s i d u e
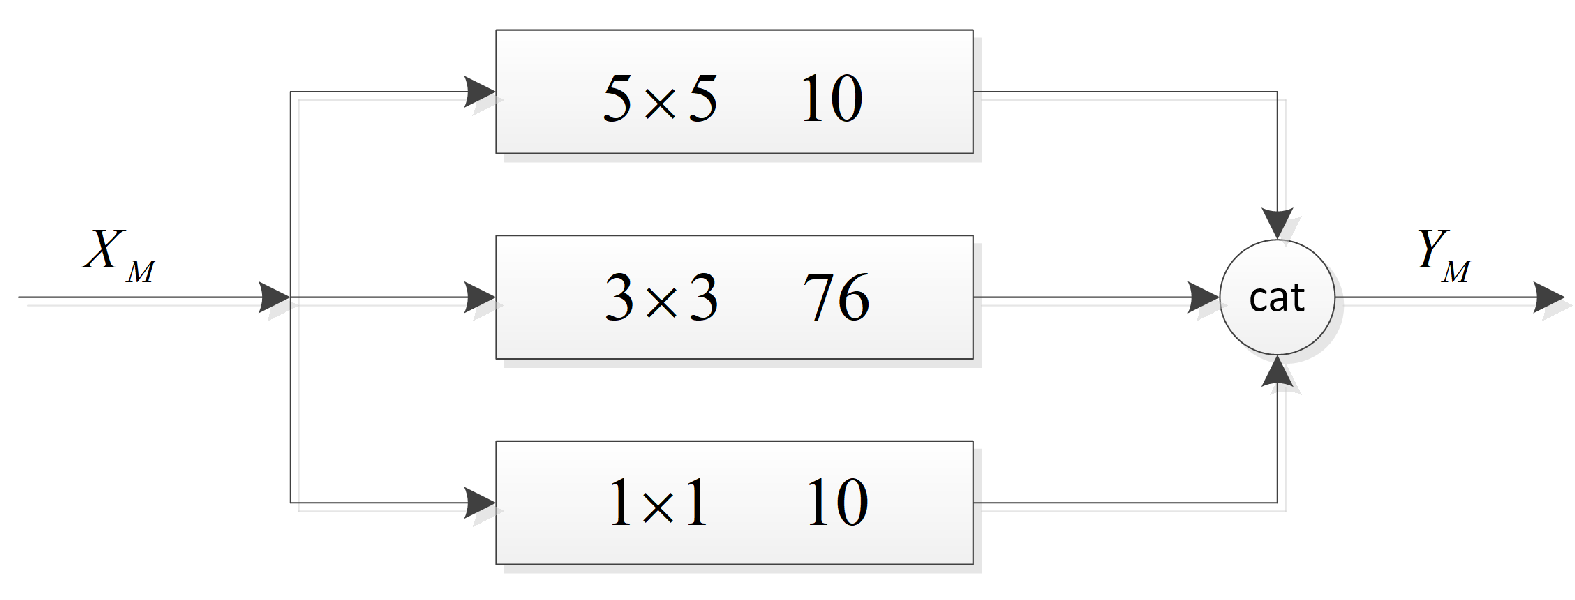
where X ^ is a restored image, Y is the observed noisy image, r e s i d u e is the learned residue. Figure 2 shows the architecture of MFEBlk. X M is an input for MFEBlk, the channels number of X M is 5 for a grayscale image and 15 for a color image. In MFEBlk, we define 3 kinds of convolutions: 5 × 5 convolution, 3 × 3 convolution and 1 × 1 convolution with kernel numbers of 10, 76 and 10 respectively. Zero-padding is used to keep the same channel size. Y M is the concatenated feature maps of different scale convolutions. The mathematical model for the MFEBlk is defined as follows:
Y M = c a t c o n v 5 10 ( X M ) , c o n v 3 76 ( X M ) , c o n v 1 10 ( X M )
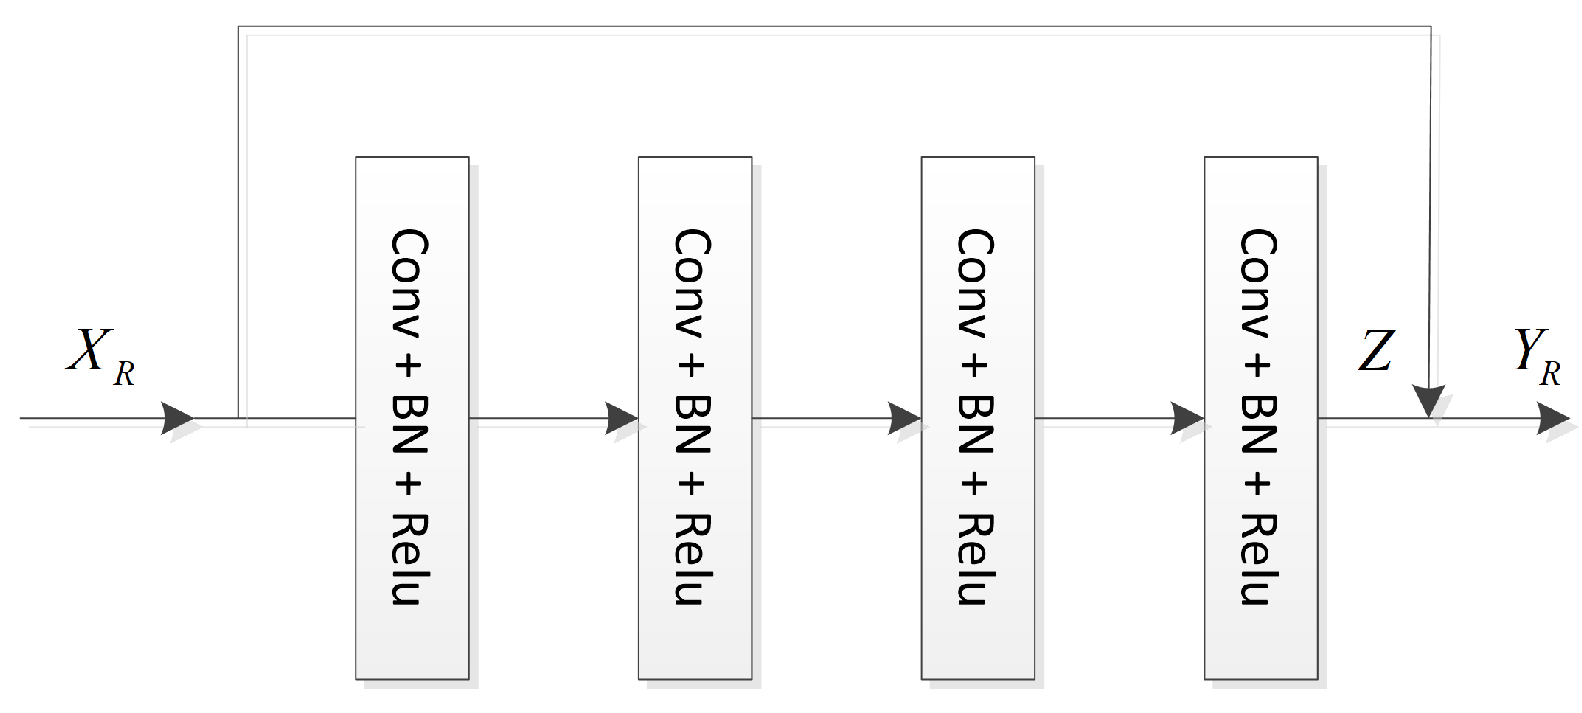
where c o n v 5 10 ( · ) , c o n v 3 76 ( · ) and c o n v 1 10 ( · ) are convolutions with kernel size of 5 × 5 , 3 × 3 and 1 × 1 respectively. The subscripts 10, 76 and 10 are numbers of convolution kernels. By experiments, we find the choice of quantity of kernels is a balance of the computational costs and performance. c a t ( · , · , · ) is a function to concatenate channels of feature maps. Y M is the output which has 96 channels. Figure 3 shows the architecture of ResNetBlock. ResNetBlock has four “Conv+BN+Relu” blocks. Each “Conv+BN+Relu” block includes a 3 × 3 convolution layer, a BN layer and a Relu activation function. Z is the output of the fourth “Conv+BN+Relu” block which has 96 channels. The output Y R is the sum of the input X R and output Z:
Y R = X R + Z
Equation (4) can be reformed as Z = Y R X R , the work to learn Z is the residual learning. Learning the residues reduces the computational cost in the training, and avoids vanishing gradient problem. The NAN Block is applied between two ResNetBlocks, each channel of the output for ResNetBlock can get an amount of gain. The architecture of NAN Block is detailed in the next section.

3.2. NAN

Figure 4 shows the architecture of NAN block. Assuming the input X N has 96 channels, the squeeze operation adopts an average pooling function, which squeeze each channel to be a point. For each channel X N l , the mathematical expression of squeeze operation is described as follows:
x N l = 1 H × W i = 1 H j = 1 W X N l ( i , j )
where X N l ( i , j ) is the amplitude at position ( i , j ) , x N l is the mean value of channel X N l . FC is the fully connected layer which has 96 neurons. 1DBN and Relu layers can avoid vanishing gradient problem and accelerate the convergence. Suppose the value of batchsize is k, thus each training process contains k samples. The 1DBN is described as follows:
x ˜ b n = x b n E ( x b n ) v a r ( x b n )
y b n = γ x ˜ b n + β
where x b n and y b n are input and output vectors of BN block, γ and β are variables which are updated during back propagation. On the last layer, the sigmoid function maps the input to range 0–1. We address the output of sigmoid function as s, and s is a vector of 96 dimensions which can be described as ( s 1 , s 2 , , s n 1 , s n ) , n is 96. For each channel, the scale operation is described as follows:
Y N m = X N m · s m , m = 1 , 2 , , n
where Y N m and X m are the mth channels of Y N and X N , respectively. s m is the mth element of s. From Equation (8), we find every channel in X N is augmented by the corresponding element of s.

3.3. Role of MFEBlk

Inspired by inception [40], we propose a MFEBlk to extract distinct scale features using different size kernels. For image denoising problem, we hope the restored image holds most features, thus in the first layer, we take 5 × 5 , 3 × 3 and 1 × 1 convolution kernels to take distinct scale features from the noisy image. Larger kernel size commonly brings about larger numbers of calculations; therefore, we use less 5 × 5 and more 3 × 3 convolution kernels to balance feature extraction and reduce the number of calculations. The 1 × 1 convolution kernels are used to increase nonlinearity and reduce the amount of parameter and calculation [46,47].

3.4. Complexity Analysis

For MFENANN, the introduction of MFEBlk, skip connections in ResNetBlocks and NANs bring about an increase in network complexity. Considering that the floating-point operations per second (FLOPS) is related to the input image size, we use grayscale image with size of 256 × 256 and color image with size of 768 × 512 to compute the increase of parameters and calculations for introducing MFEBlk, skip connections and NANs. Compared with the plain neural network with the same number of layers, for grayscale image and color image, the amount of model parameters both increase by 0.113 M, and the number of calculations increases by 0.013GFLOPS and 0.099GFLOPS respectively. Thus the introduction of MFEBlk, skip connections and NANs only bring little increase of parameters and calculations. In addition, for a grayscale image with size of 256 × 256 , compared to DnCNN and FFDNet, the number of calculations of MFENANN decreases by 9.06GFLOPS and increases by 19.42GFLOPS, respectively.

4. Experiments

4.1. Dataset Generation and Experimental Settings

For the AWGN removal work, in order to train our proposed network, we take 4744 images in the Waterloo Exploration Database [48], and extract image patches of size of 44 × 44 point-wisely with stride of 30. Approximately, 577 × 1000 image patches are chosen for training the network. For every patch x i , we add an AWGN on it and address the noisy image as y i . The noises added have noise levels ranging from 0 to 75. We apply image sets “BSD68” [49] and “Set12” to testify the performance of the proposed network for grayscale image denoising, and “CBSD68” [49], “Kodak24” [50] and “McMaster” [51] to verify the effectiveness of the network on color image denoising. For MFENANN, The channel numbers of input are 5 and 15 for grayscale and color images respectively.
The experiments are performed on Pytorch 1.1 environment, on a PC with Ubuntu 16.04 operating system, Intel(R) Core(TM)i7-8700 CPU, 16GB RAM and a NVIDIA RTX 2070 GPU. We choose a loss function likes [10]:
L ( Θ ) = 1 2 N i = 1 N R ( y i ; Ψ ; Θ ) ( y i x i ) F 2
where Θ is parameters of the network need to be learned. L ( · ) is the loss function. Ψ is the noise level map. R ( · ; · ; · ) is the output residue. { x i , y i } are clean-noisy image patch pair used for training. The loss function makes residue close to the noise. We use PSNR [52] and SSIM [53] to measure the quality of the restored images. We adopt the Adam [54] optimized methods and adopt the default settings. We train 60 epochs for the MFENANN. The initial learning rate is 1 × 10 3 , and it decays to 1 × 10 5 and 1 × 10 6 at 40 and 50 epochs. The value of batchsize is 128. The training process takes approximately 21 h.

4.2. Comparison Methods

To measure the performance, we compare our algorithm with some state-of-the-art denoising methods, including conventional methods (i.e., BM3D [14] and WNNM [55]), sparse and redundant representation method (i.e., SRR [9]) and discriminative learning methods (i.e., MLP [26], DnCNN [10], FFDNet [27], and BDMGIN [56]). For the SRR denoising methods, there are three ways (i.e., discrete cosine transform, global training and adaptive training) to build a dictionary, and the SRR denoising methods corresponding to these three ways are addressed as SRR-DCT, SRR-G and SRR-A respectively. For DnCNN, two ways are used to train the networks to remove noise with known and unknown noise levels and they are addressed as DnCNN-S and DnCNN-B respectively. DnCNN-S needs to train a network for each noise level; DnCNN-B trains a single network to remove noise with all noise levels. BDMGIN is designed to remove mixed Gaussian-impulse noise. In this section, we set the impulse noise density to be 0 to remove Gaussian noise.

4.3. Ablation Experiment

In order to verify the role of MFEBlk and NAN in MFENANN, we train the networks after removing MFEBlk and NAN respectively. We address the network without MFEBlk as NANN and address the network without NAN as MFEN. We also trained a plain convolutional network with the same number of channels and layers as MFENANN for image denoising and address it as plainNet. Table 1 shows the average PSNR values for restored images in “Set12” of plainNet, NANN, MFEN and MFENANN. NANN and MFEN have larger PSNR values than plainNet, which indicates that NANN and MFEN have better performance. MFENANN has larger PSNR values than NANN and MFEN which shows the combination of MFEBlk and NAN makes the network achieve better denoising performance.

4.4. ResNet vs. DenseNet

Densely connected convolutional networks (DenseNet) are effective to improve the performance of object recognition [33]. In this section, we use the DenseNet in image denoising and increase the number of convolution layers to 31. The settings of DenseNet are the same as [33]. We address the network used DenseNet blocks instead of ResNet blocks in the proposed network as DenseMFENANN. From Table 2, we find DenseMFENANN has higher PSNR values for images “Peppers” and “Starfish” at a noise level of 25 and for image “Peppers” at a noise level of 75. MFENANN has higher PSNR values in other situations and it has higher average PSNR values at all noise levels. This means the ResNet gets better performance than DenseNet used in the proposed network for image denoising. Therefore, in the paper, we use ResNet instead of DenseNet for image denoising.

4.5. Experimental Results and Analysis

We address the networks trained with patch numbers of 577 × 10 3 and 1 × 10 6 as MFENANN-5 and MFENANN-10 respectively. Table 3 shows the average PSNR values for images in “BSD68” restored by MFENANN-5 and MFENANN-10. MFENANN-5 has higher PSNR values at noise levels of 15 and 45. MFENANN-5 and MFENANN-10 have the same value at a noise level of 25. MFENANN-10 has higher PSNR values at noise levels of 35, 55, 65 and 75. In general, the restored images of the two models have similar average PSNR values at noise levels of 15, 25, 35, 45, 55, 65 and 75; increasing training sample numbers does not bring a performance improvement, but it costs more than twice the time. Therefore, in the following experiment, we used patches of number of 577 × 10 3 to train the networks. Table 4 shows the PSNR values of several state-of-the-art methods at noise levels of 15, 25, 35, 50 and 75. When noise level was 15, for image “Barbara”, WNNM achieved the largest PSNR value, followed by BM3D. That is because “Barbara” contains a lot of stripe textures, but the MSE loss function tends to represent smooth and outstanding structural information. MFENANN has the largest PSNR values for other images and achieved the largest average PSNR value among all methods at this noise level. When noise levels were 25, 35, 50 and 75, the PSNR values showed the same law as the noise level of 15; for image “Barbara”, WNNM got the largest PSNR values, followed by BM3D; MFENANN got the largest PSNR values for other images and achieved the largest average PSNR values. For each method except BDMGIN, the PSNR value decreased as the noise level increased. BDMGIN has the smallest average PSNR values for noise levels of 15, 25, 35 and 50. That is because BDMGIN is designed to remove the mixed Gaussian-impulse noise, so is not good at dealing with single Gaussian noise. Compared with other methods, the superiority of MFENANN increases as noise level increases; this is because as the noise level grows, effective information decreases, and the traditional prior-based method could not work well; MFENANN restores images by learning the correlations between noisy-clean image patch pairs. Moreover, MFENANN extracts and integrates different scale features of noisy images and pays attention to correlations of channels, which decreases the influence of increasing noise levels. Table 5 shows the SSIM values of restored images of several state-of-the-art algorithms at noise levels of 15, 25, 35, 50 and 75. When noise level was 15, for image “Barbara”, BM3D got the largest SSIM values, followed by the proposed MFENANN. When noise level was 25, 35, 50 or 75, MFENANN got the largest SSIM values for all images. BDMGIN has the smallest average SSIM values under all noise levels. MFENANN has the largest average SSIM values under all noise levels. These show the superiority of MFENANN. Table 6 shows the average PSNR values of images in “BSD68” for several state-of-the-art methods at noise levels of 15, 25, 35, 50 and 75. In general, discriminative deep learning methods except the BDMGIN (i.e., MLP, DnCNN, FFDNet and MFENANN) got larger PSNR values than traditional denoising methods (i.e., BM3D and WNNM). When noise level was 15, MFENANN got the largest PSNR value, which is numerically close to DnCNN. This is because at such a low noise level, DnCNN trains a specific model for this noise level which offsets the role of the superiority of networks. When noise levels were 25, 35, 50 and 75, MFENANN got the largest PSNR values for all noise levels, which shows the superiority of MFENANN. BDMGIN has the smallest PSNR values for all noise levels.
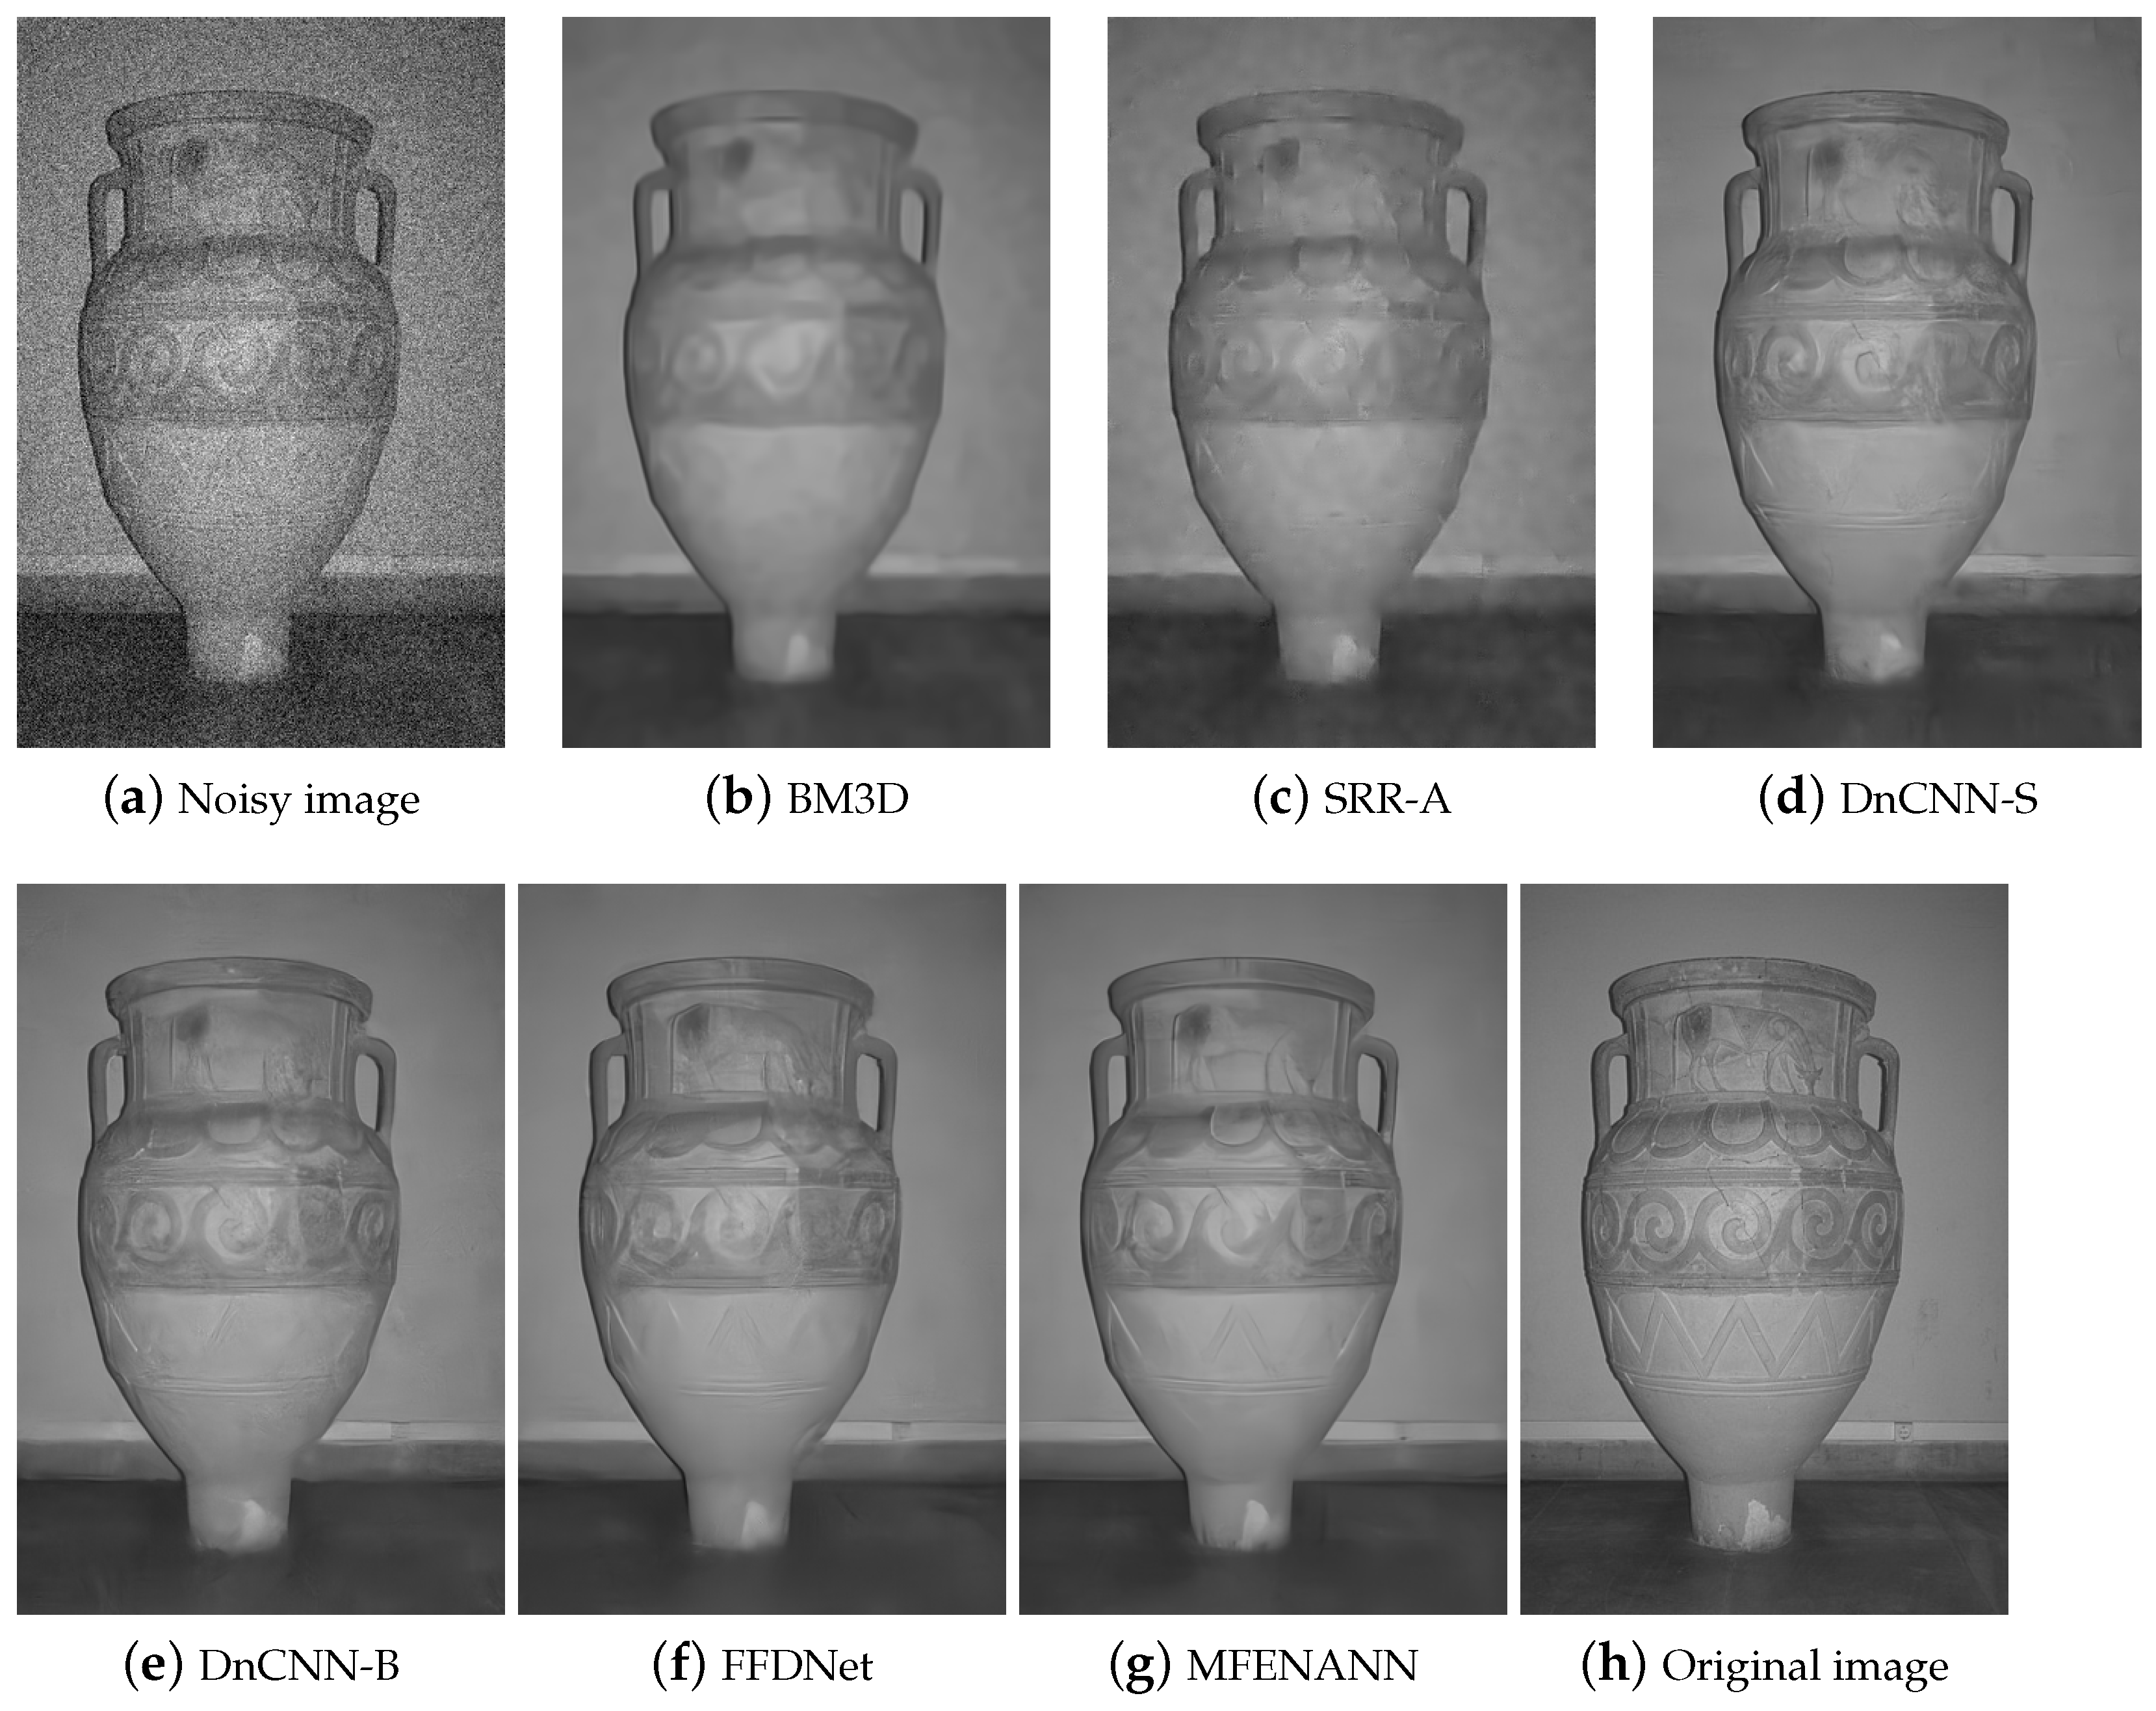
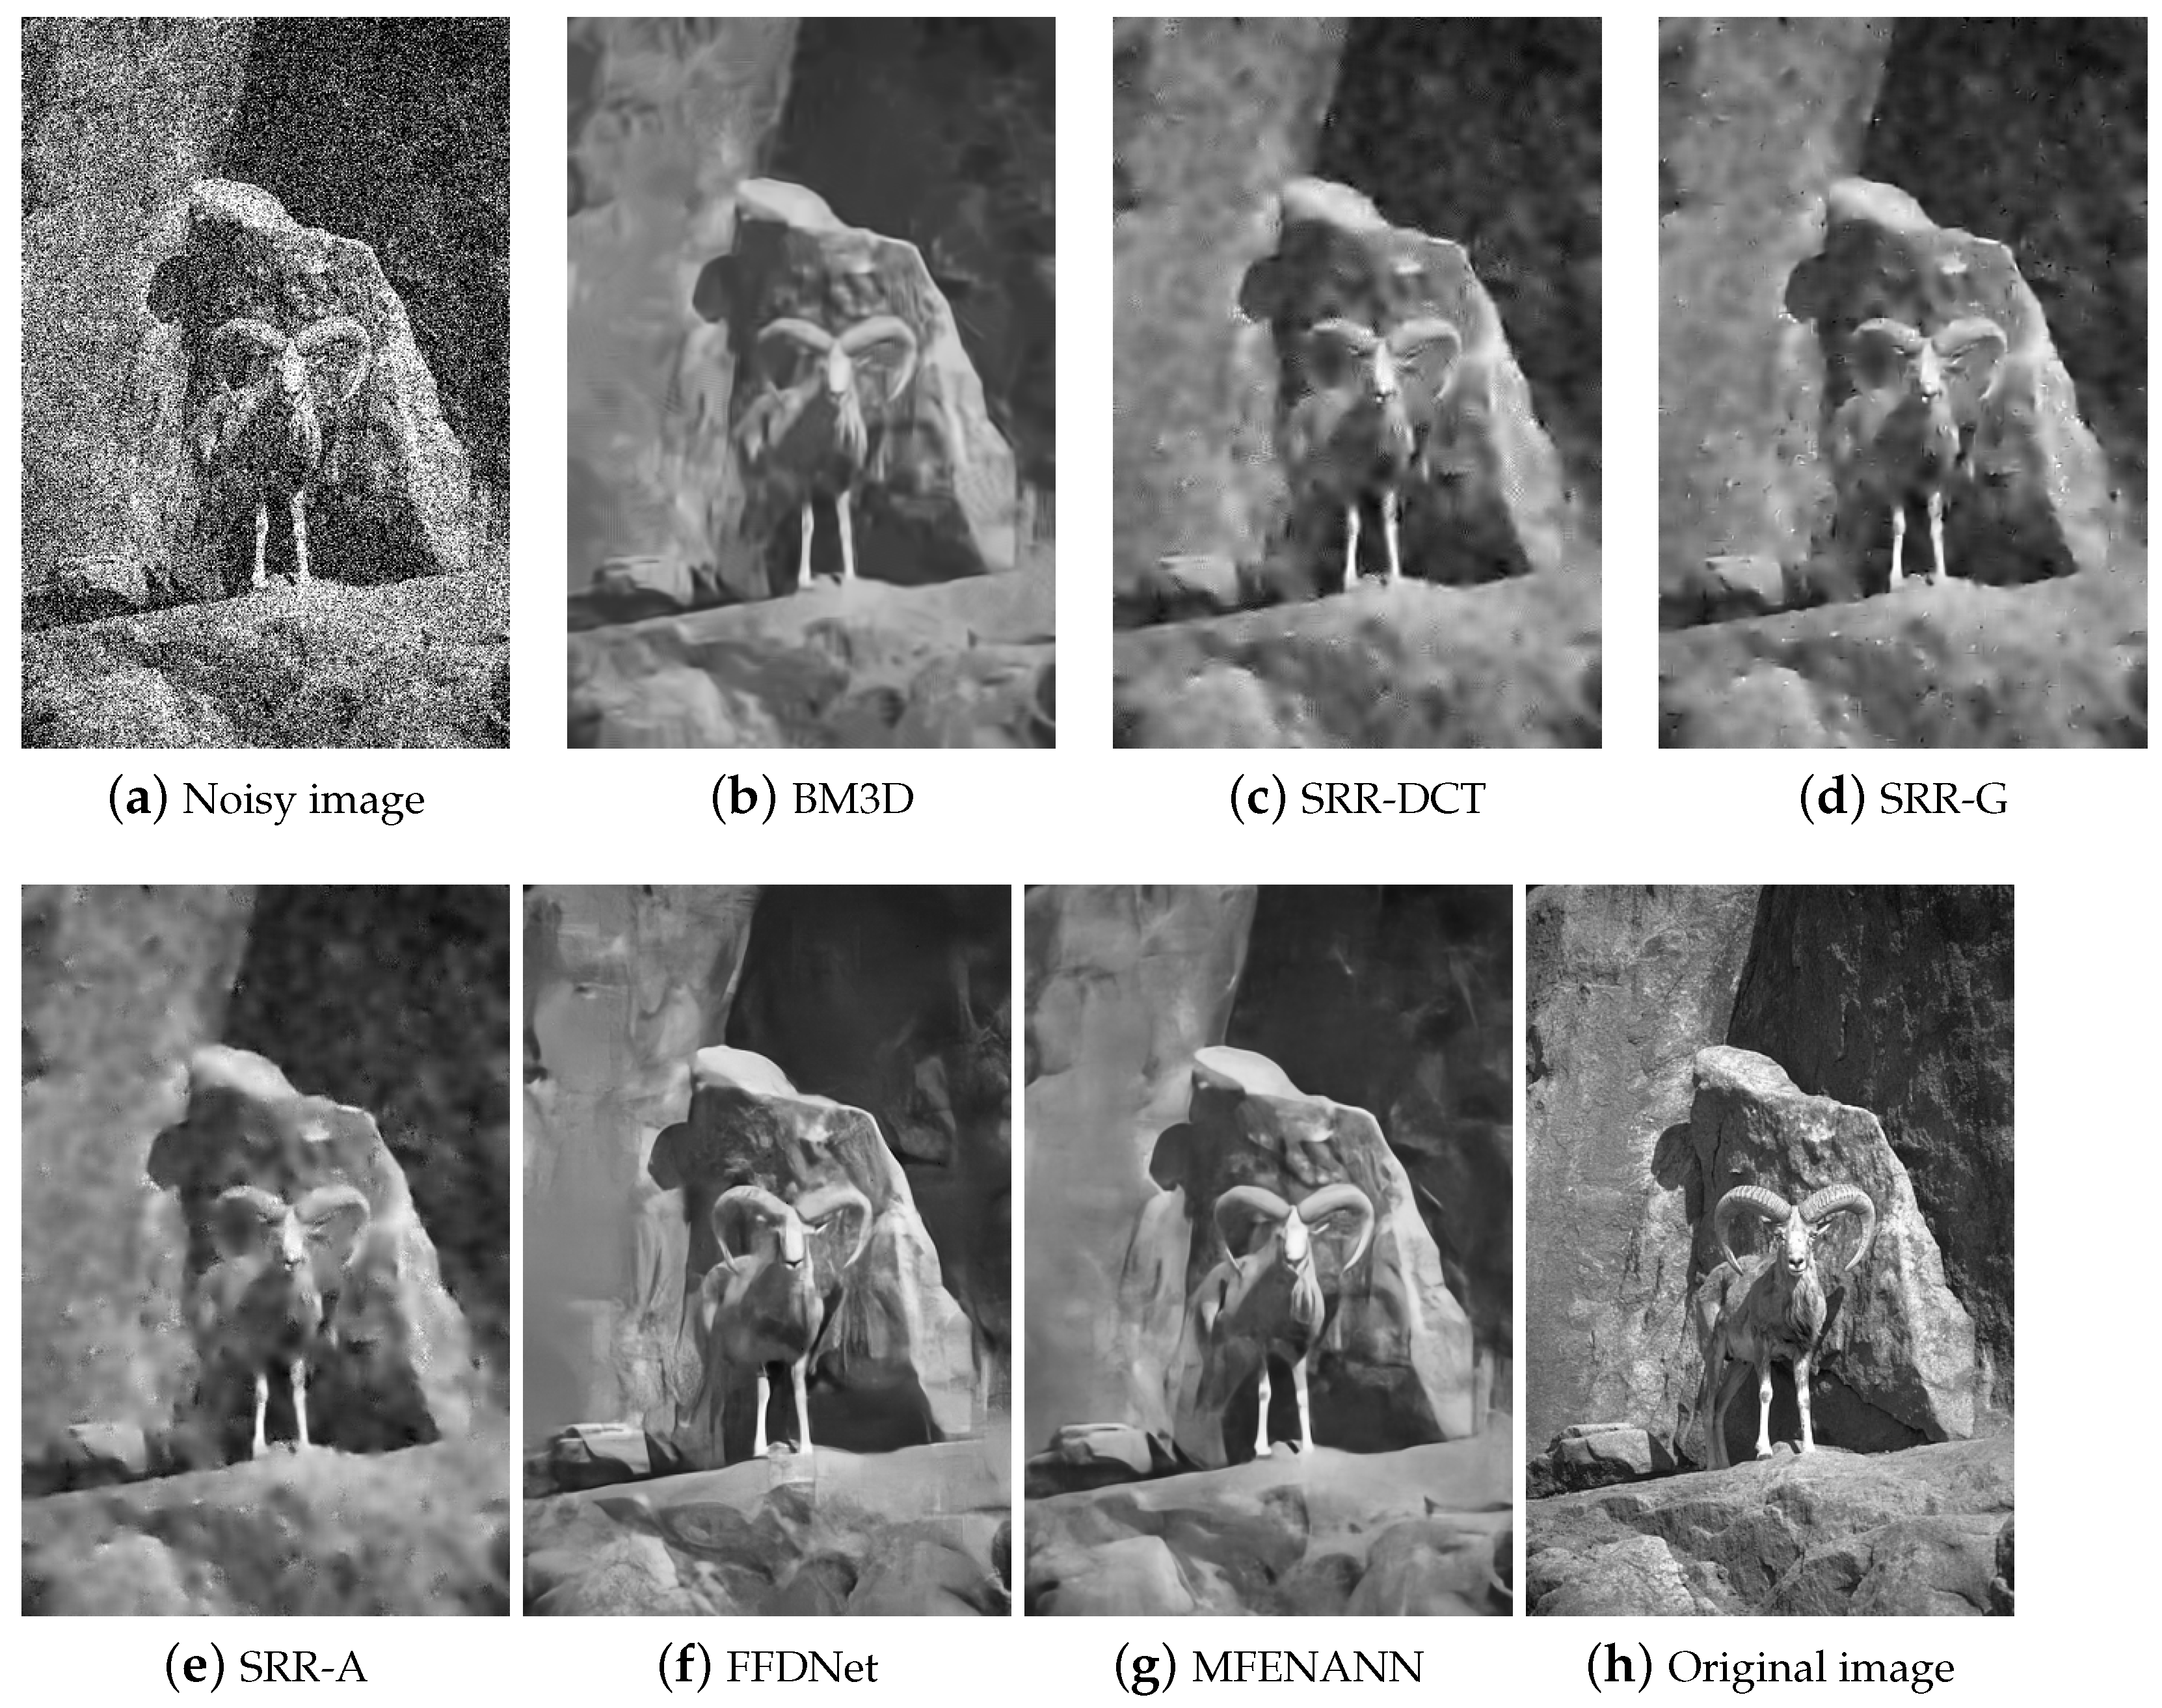
Figure 5 shows the restored images for “test033” in “BSD68” of several state-of-the-art methods at a noise level of 50. At such a high noise level, we found that the noisy image had lost lots of details, which looks very poor visually and could not be used directly for many high-level image processing tasks. BM3D can effectively remove noise, but the restored image is over-smoothed; lots of details are lost. SRR-A introduces too many artificial effects while removing noise. In general, deep learning methods have better overall appearance than BM3D and SRR-A, but DnCNN-S, DnCNN-B and FFDNet also made the restored image over-smoothed and introduced some artificial effects. The restored image of MFENANN has the most details and best overall appearance. In quantity, discriminate learning methods get larger PSNR values than BM3D and SRR-A. MFENANN got the largest PSNR values among all discriminating learning methods. Figure 6 shows the restored images of some state-of-the-art methods for “test045” in “BSD68” at a noise level of 25. We found BM3D causes the image to be heavily over-smoothed, and lots of details were lost. SRR-A also over-smoothed the image and introduced many artifacts. The restored images of DnCNN-S and DnCNN-B have more details than BM3D and SRR-A, but the two methods also caused the loss of many texture features. FFDNet achieved better overall appearance than the previous methods, but it still led to the loss of many details. The restored image of MFENANN has the most details and best overall appearance. Moreover, restored image of MFENANN has the largest PSNR value among all methods. Figure 7 shows the restored images of “test064” in “BSD68” at a noise level of 75. We found that at such a high noise level, the observed image is heavily degraded and many significant details are lost. BM3D can effectively remove noise, but it causes the restored image to be over-smoothed and many significant details are lost. SRR (including SRR-DCT, SRR-G and SRR-A) could not effectively eliminate noise at such a high noise level; they caused too many artifacts. The image restored by FFDNet has better overall appearance than images restored by previous methods, but it was still over-smoothed and lots of details were lost. The image restored by MFENANN has the most details and best overall appearance. In quantity, deep learning methods (i.e., FFDNet and MFENANN) have larger PSNR values than BM3D and SRR. In addition, MFENANN has a larger PSNR value than FFDNet.
In reality, usually the level of noise is unknown. In this paper, instead of estimating the noise level, we traversed the entire noise level range with a stride of 1, computed the PSNR values for all restored images and chose the one that achieved the largest value as the output. For BM3D, FFDNet and MFENANN, we used the above-mentioned settings, and for the blind denoising methods BDMGIN and DnCNN-B, there was no need to enter the noise levels. Table 7 shows the PSNR values of restored images under unknown noise levels of several state-of-the-art methods. At a noise level of 26.2, for image “Barbara”, BM3D has the largest PSNR value, followed by MFENANN. MFENANN has the largest PSNR values for other images and the largest average PSNR value at this noise level. When the noise level is 37.4, the PSNR values of restored images have similar laws as when the noise level is 26.2. BM3D has the largest value for image “Barbara”, and MFENANN has the largest PSNR values for other images. When noise levels were 48.6 and 55.8, MFENANN got the largest PSNR values for all images. MFENANN got the largest average PSNR values under all noise levels. These pieces of evidence indicate that when noise levels are 26.2, 37.4, 48.6 and 55.8, the proposed method of MFENANN gets better performance under unknown noise levels.
Table 8 shows the average PSNR values for color images in image sets “McMaster”, “Kodak24” and “CBSD68”, which were restored by several state-of-the-art methods. For “McMaster”, when noise levels were 15, 25 and 75, CBM3D got larger PSNR values than CDnDNN, which indicates that CBM3D is superior to CDnCNN at these noise levels. FFDNet got larger PSNR values than CBM3D and CDnCNN under all noise levels. MFENANN has the largest average PSNR values among all methods under all noise levels; this shows MFENANN had the best performance for “McMaster”. For “Kodak24”, when the noise level was 75, CBM3D gave a larger PSNR value than CDnCNN, and it has smaller PSNR values at other noise levels. FFDNet has larger PSNR values than CBM3D and CDnCNN. MFENANN has the largest PSNR values among all methods. For “CBSD68”, similarly to “McMaster” and “Kodak24”, MFENANN has the largest PSNR values, which shows MFENANN had the best performance among all methods under all noise levels.
Figure 8 shows the restored images of several state-of-the-art methods for image “kodim05” in “Kodak24” at a noise level of 50. CBM3D causes the restored image to be over-smoothed while removing noise; the image looks a little blurry. The restored image of FFDNet has better overall appearance than CBM3D, but still many details are lost. The restored image of MFENANN has the most detail and the best overall appearance among all methods. In quantity, MFENANN has the largest PSNR values among all methods. These facts show that MFENANN achieved a better performance than CBM3D and FFDNet for image “kodim05” at a noise level of 50.
Table 9 shows the average runtimes of several state-of-the-art methods for images in “Set12” at noise levels of 15, 25, 35, 50 and 75. To be fair, all algorithms ran on the CPU. SRR-A used more time than the other methods; this is because it needs to construct a dictionary adaptively, which needs lots of time. The deep learning methods (i.e., DnCNN-B, FFDNet and MFENANN) used less time than traditional methods. MFENANN used a little more time than DnCNN-B and FFDNet; this is because it contains some improved SENet blocks. In general, the time used by MFENANN is comparable to FFDNet; the extra time consumed can be ignored for image denoising.

5. Conclusions

This paper proposes a novel multi-scale feature extraction-based normalized attention neural network for image denoising. The MFEBlk extracts features of distinct scales from noisy image and integrates them together. The NAN blocks learns the relationship between channels, in which each channel acquires an amount of gain, and channels can play different roles in the subsequent convolution. The residual unit effectively avoids a vanishing gradient and loses shallow features. Experimental results showed that the proposed MFENANN can effectively eliminate noise for noise levels ranging from 0 to 75. Moreover, compared to some state-of-the-art denoising methods, MFENANN has larger PSNR values and better overall appearance.
Applications and future research: The proposed MFENANN can be embedded in imaging equipment and integrated into application software to improve the quality of images. In addition, the noisy image sequence contains different characteristics of the image. Designing a deep neural network to extract features from a noisy image sequence and fuse the features to get a restored high quality image is worthy of further study.

Author Contributions

Y.W. and X.S. proposed the method; Y.W. analyzed the data and drafted the paper; G.G. and N.L. guided students to do the experiments and revised the paper. All authors have read and agreed to the published version of the manuscript.

Funding

This work was supported by the National Key Research and Development Program of China under Grant 2018YFB1702703.

Conflicts of Interest

The authors declare no conflict of interest.

References

  1. Ali, S.; Nasar, M.; Haidi, I. Median Filtering Using First-Order and Second-Order Neighborhood Pixels to Reduce Fixed Value Impulse Noise from Grayscale Digital Images. Electronics 2020, 9, 2034. [Google Scholar]
  2. Liu, M.; Cao, F.; Yang, Z.; Hong, X.; Huang, Y. Hyperspectral Image Denoising and Classification Using Multi-Scale Weighted EMAPs and Extreme Learning Machine. Electronics 2020, 9, 2137. [Google Scholar] [CrossRef]
  3. Isogawa, K.; Ida, T.; Shiodera, T.; Takeguchi, T. Deep Shrinkage Convolutional Neural Network for Adaptive Noise Reduction. IEEE Signal Process. Lett. 2018, 25, 224–228. [Google Scholar] [CrossRef]
  4. Wang, Y.; Wang, J.; Song, X.; Han, L. An Efficient Adaptive Fuzzy Switching Weighted Mean Filter for Salt-and-Pepper Noise Removal. IEEE Signal Process. Lett. 2016, 23, 1582–1586. [Google Scholar] [CrossRef]
  5. Nguyen, M.P.S.; Chun, Y. Bounded Self-Weights Estimation Method for Non-Local Means Image Denoising Using Minimax Estimators. IEEE Trans. Image Process. 2017, 26, 1637–1649. [Google Scholar] [CrossRef] [PubMed]
  6. Wang, Q.; Zhang, X.; Wu, Y.; Tang, L.; Zha, Z. Non-Convex Weighted Lp Minimization based Group Sparse Representation Framework for Image Denoising. IEEE Signal Process. Lett. 2017, 24, 1686–1690. [Google Scholar] [CrossRef]
  7. Song, X.; Wu, L.; Hao, H.; Xu, W. Hyperspectral Image Denoising Based on Spectral Dictionary Learning and Sparse Coding. Electronics 2019, 8, 86. [Google Scholar] [CrossRef] [Green Version]
  8. Wang, H.; Cen, Y.; He, Z.; Zhao, R.; Zhang, F. Reweighted Low-Rank Matrix Analysis With Structural Smoothness for Image Denoising. IEEE Trans. Image Process. 2018, 27, 1777–1792. [Google Scholar] [CrossRef]
  9. Elad, M.; Aharon, M. Image Denoising Via Sparse and Redundant Representations Over Learned Dictionaries. IEEE Trans. Image Process. 2006, 12, 3736–3745. [Google Scholar] [CrossRef]
  10. Zhang, K.; Zuo, W.; Chen, Y.; Meng, D.; Zhang, L. Beyond a Gaussian Denoiser: Residual Learning of Deep CNN for Image Denoising. IEEE Trans. Image Process. 2017, 26, 3142–3155. [Google Scholar] [CrossRef] [Green Version]
  11. Tomasi, C.; Manduchi, R. Bilateral Filtering for Gray and Color Images. In Proceedings of the Sixth International Conference on Computer Vision, Bombay, India, 7 January 1998; pp. 836–846. [Google Scholar]
  12. Buades, A.; Coll, B.; Morel, J.M. A Review of Image Denoising Algorithms, with a New One. Siam J. Multiscale Model. Simul. 2005, 4, 490–530. [Google Scholar] [CrossRef]
  13. Ville, D.V.D.; Kocher, M. SURE-Based Non-Local Means. IEEE Signal Process. Lett. 2009, 16, 973–976. [Google Scholar] [CrossRef] [Green Version]
  14. Dabov, K.; Foi, A.; Katkovnik, V.; Egiazarian, K. Image denoising by sparse 3-D transform-domain collaborative filtering. IEEE Trans. Image Process. 2007, 16, 2080–2095. [Google Scholar] [CrossRef] [PubMed]
  15. Wang, X. Moving window-based double haar wavelet transform for image processing. IEEE Trans. Image Process. 2006, 15, 2771–2779. [Google Scholar] [CrossRef]
  16. Starck, J.; Candes, E.J.; Donoho, D.L. The curvelet transform for image denoising. IEEE Trans. Image Process. 2002, 11, 670–684. [Google Scholar] [CrossRef] [Green Version]
  17. Mustafi, A.; Ghorai, S.K. A novel blind source separation technique using fractional Fourier transform for denoising medical images. Optik 2013, 124, 265–271. [Google Scholar]
  18. Liu, Y.; Du, W.; Jin, J.; Wang, H.; Liang, R. Boost image denoising via noise level estimation in quaternion wavelet domain. AEU Int. J. Electron. Commun. 2016, 70, 584–591. [Google Scholar] [CrossRef]
  19. Jain, P.; Tyagi, V. LAPB: Locally adaptive patch-based wavelet domain edge-preserving image denoising. Inf. Sci. 2015, 294, 164–181. [Google Scholar] [CrossRef]
  20. Rajwade, A.; Rangarajan, A.; Banerjee, A. Image Denoising Using the Higher Order Singular Value Decomposition. IEEE Trans. Pattern Anal. Mach. Intell. 2013, 35, 849–862. [Google Scholar] [CrossRef]
  21. Protter, M.; Elad, M. Image Sequence Denoising via Sparse and Redundant Representations. IEEE Trans. Image Process. 2009, 18, 27–35. [Google Scholar] [CrossRef]
  22. Tang, S.; Yang, J. Image denoising using K-SVD and non-local means. In Proceedings of the IEEE Workshop on Electronics, Computer and Applications, Ottawa, ON, Canada, 8–9 May 2014; pp. 886–889. [Google Scholar]
  23. Rudin, L.; Osher, S. Total variation based image restoration with free local constraints. In Proceedings of the 1st International Conference on Image Processing, Austin, TX, USA, 13–16 November 1994; pp. 31–35. [Google Scholar]
  24. Nasonov, A.; Krylov, A. An Improvement of BM3D Image Denoising and Deblurring Algorithm by Generalized Total Variation. In Proceedings of the 7th European Workshop on Visual Information Processing (EUVIP), Tampere, Finland, 26–28 November 2018; pp. 1–4. [Google Scholar]
  25. Ordentlich, E.; Seroussi, G.; Verdu, S.; Weinberger, M.; Weissman, T. A discrete universal denoiser and its application to binary images. Int. Conf. Image Process. 2003, 1, 117–120. [Google Scholar]
  26. Burger, H.C.; Schuler, C.J.; Harmeling, S. Image denoising: Can plain neural networks compete with BM3D? In Proceedings of the 2012 IEEE Conference on Computer Vision and Pattern Recognition, Providence, RI, USA, 16–21 July 2012; pp. 2392–2399. [Google Scholar]
  27. Zhang, K.; Zuo, W.; Zhang, L. FFDNet: Toward a Fast and Flexible Solution for CNN-Based Image Denoising. IEEE Trans. Image Process. 2018, 27, 4608–4622. [Google Scholar] [CrossRef] [PubMed] [Green Version]
  28. Lefkimmiatis, S. Non-local Color Image Denoising with Convolutional Neural Networks. In Proceedings of the 2017 IEEE Conference on Computer Vision and Pattern Recognition (CVPR), Honolulu, HI, USA, 21–26 July 2017; pp. 5882–5891. [Google Scholar]
  29. He, K.; Zhang, X.; Ren, S.; Sun, J. Deep Residual Learning for Image Recognition. In Proceedings of the 2016 IEEE Conference on Computer Vision and Pattern Recognition (CVPR), Las Vegas, NV, USA, 27–30 June 2016; pp. 770–778. [Google Scholar]
  30. He, K.; Zhang, X.; Ren, S.; Sun, J. Identity Mappings in Deep Residual Networks. In Proceedings of the European Conference on Computer Vision, Amsterdam, Poland, 8–16 October 2016; pp. 630–645. [Google Scholar]
  31. Han, C.; Shi, L. ML CResNet: A novel network to detect and locate myocardial infarction using 12 leads ECG. Comput. Methods Programs Biomed. 2020, 185, 1–10. [Google Scholar] [CrossRef] [PubMed]
  32. Guo, S.; Yang, Z. Multi-Channel-ResNet: An integration framework towards skin lesion analysis. Inform. Med. Unlocked 2018, 12, 67–74. [Google Scholar] [CrossRef]
  33. Huang, G.; Liu, Z.; Maaten, L.; Weinberger, K.Q. Densely Connected Convolutional Networks. In Proceedings of the 2017 IEEE Conference on Computer Vision and Pattern Recognition (CVPR), Honolulu, HI, USA, 21–26 July 2017; pp. 4700–4708. [Google Scholar]
  34. Chen, C.; Qi, F. Single Image Super-Resolution Using Deep CNN with Dense Skip Connections and Inception-ResNet. In Proceedings of the 9th International Conference on Information Technology in Medicine and Education, Hangzhou, China, 19–21 October 2018; pp. 999–1003. [Google Scholar]
  35. Song, X.; Chen, K.; Li, X.; Sun, J.; Hou, B.; Cui, Y.; Zhang, B.; Xiong, G.; Wang, Z. Pedestrian Trajectory Prediction Based on Deep Convolutional LSTM Network. IEEE Trans. Intell. Transp. Syst. 2020. [Google Scholar] [CrossRef]
  36. Nair, V.; Hinton, G.E. Rectified linear units improve restricted boltzmann machines. In Proceedings of the 27th International Conference on International Conference on Machine Learning, Haifa, Israel, 21–24 June 2010; pp. 807–814. [Google Scholar]
  37. Krizhevsky, A.; Sutskever, I.; Hinton, G.E. ImageNet classification with deep convolutional neural networks. In Proceedings of the 25th International Conference on Neural Information Processing Systems, Siem Reap, Cambodia, 13–16 December 2012; Volume 1, pp. 1097–1105. [Google Scholar]
  38. LeCun, Y.; Boser, B.; Denker, J.S.; Henderson, D.; Howard, R.E.; Hubbard, W.; Jackel, L.D. Backpropagation Applied to Handwritten Zip Code Recognition. Neural Comput. 1989, 1, 541–551. [Google Scholar]
  39. Srivastava, N.; Hinton, G.; Krizhevsky, A.; Sutskever, I.; Salakhutdinov, R. Dropout: A Simple Way to Prevent Neural Networks from Overfitting. J. Mach. Learn. Res. 2014, 1, 1929–1958. [Google Scholar]
  40. Szegedy, C.; Liu, W.; Jia, Y.; Sermanet, P.; Reed, S.; Anguelov, D.; Erhan, D.; Vanhoucke, V.; Rabinovich, A. Going deeper with convolution. In Proceedings of the 2015 IEEE Conference on Computer Vision and Pattern Recognition (CVPR), Boston, MA, USA, 7–12 June 2015; pp. 1–9. [Google Scholar]
  41. Ioffe, S.; Szegedy, C. Batch Normalization: Accelerating Deep Network Training by Reducing Internal Covariate Shift. In Proceedings of the International conference on Machine Learning, Lille, France, 6–11 July 2015; pp. 448–456. [Google Scholar]
  42. Santurkar, S.; Tsipras, D.; Ilyas, A.; Dry, A. How Does Batch Normalization Help Optimization? In Proceedings of the 32nd Conference on Neural Information Processing Systems, Montreal, QC, Canada, 3–8 December 2018; pp. 1–11. [Google Scholar]
  43. Hu, J.; Shen, L.; Albanie, S.; Sun, G.; Wu, E. Squeeze-and-Excitation Networks. IEEE Trans. Pattern Anal. Mach. Intell. 2020, 42, 2011–2023. [Google Scholar] [CrossRef] [Green Version]
  44. Wang, Q.; Wu, B.; Zhu, P. ECA-Net: Efficient Channel Attention for Deep Convolutional Neural Networks. In Proceedings of the 2020 IEEE/CVF Conference on Computer Vision and Pattern Recognition (CVPR), Seattle, WA, USA, 13–19 June 2020; pp. 11531–11539. [Google Scholar]
  45. Li, X.; Wang, W.; Hu, X.; Yang, J. Selective Kernel Networks. In Proceedings of the CVPR, Los Angeles, CA, USA, 16–19 June 2019; pp. 510–519. [Google Scholar]
  46. Szegedy, C.; Vanhoucke, V.; Ioffe, S.; Shlens, J.; Wojna, Z. Rethinking the Inception Architecture for Computer Vision. In Proceedings of the IEEE Conference on Computer Vision and Pattern Recognition, Las Vegas, NV, USA, 27–30 June 2016; pp. 2818–2826. [Google Scholar]
  47. Szegedy, C.; Ioffe, S.; Vanhoucke, V.; Alemi, A. Inception-v4, Inception-ResNet and the Impact of Residual Connections on Learning. In Proceedings of the AAAI Conference on Artificial Intelligence, San Francisco, CA, USA, 4–10 February 2017; pp. 4278–4284. [Google Scholar]
  48. Ma, K.; Duanmu, Z.; Wu, Q.; Wang, Z.; Yong, H.; Li, H.; Zhang, L. Waterloo Exploration Database: New Challenges for Image Quality Assessment Models. IEEE Trans. Image Process. 2017, 26, 1004–1016. [Google Scholar] [CrossRef]
  49. Roth, S.; Black, M.J. Fields of Experts: A framework for learning image priors. In Proceedings of the 2005 IEEE Computer Society Conference on Computer Vision and Pattern Recognition (CVPR’05), San Diego, CA, USA, 20–25 June 2005; pp. 860–867. [Google Scholar]
  50. Franzen, R. Kodak Lossless True Color Image Suite. 1999 [Online]. Available online: http://r0k.us/graphics/kodak (accessed on 16 May 2020).
  51. Zhang, L.; Wu, X.; Buades, A.; Li, X. Color demosaicking by local directional interpolation and nonlocal adaptive thresholding. J. Electron. Imaging 2011, 20, 023016. [Google Scholar]
  52. Wang, Z.; Bovik, A.C. Mean squared error: Love it or leave it? IEEE Signal Process. Lett. Magaz. 2009, 26, 98–117. [Google Scholar] [CrossRef]
  53. Wang, Z.; Bovik, A.C.; Sheikh, H.R.; Simoncelli, E.P. Image Quality Assessment: From Error Visibility to Structural Similarity. IEEE Trans. Image Process. 2004, 13, 600–612. [Google Scholar] [CrossRef] [PubMed] [Green Version]
  54. Kingma, D.P.; Ba, J.L. Adam: A Method for Stochastic Optimization. In Proceedings of the International Conference on Learning Representations, San Diego, CA, USA, 7–9 May 2015; pp. 1–41. [Google Scholar]
  55. Gu, S.; Zhang, L.; Zuo, W.; Feng, X. Weighted Nuclear Norm Minimization with Application to Image Denoising. In Proceedings of the 2014 IEEE Conference on Computer Vision and Pattern Recognition, Columbus, OH, USA, 23–28 June 2014; pp. 2862–2869. [Google Scholar]
  56. Abiko, R.; Ikehara, M. Blind Denoising of Mixed Gaussian-impulse Noise by Single CNN. In Proceedings of the IEEE International Conference on Acoustics, Speech and Signal Processing (ICASSP), Brighton, UK, 12–17 May 2019; pp. 1717–1721. [Google Scholar]
Figure 1. The architecture of MFENANN.
Electronics 10 00319 g001
Figure 2. The architecture of MFEBlk.
Electronics 10 00319 g002
Figure 3. The architecture of ResNetBlock.
Electronics 10 00319 g003
Figure 4. The architecture of NAN block.
Electronics 10 00319 g004
Figure 5. Experimental results of several state-of-the-art algorithms for image “test033” in “BSD68” at a noise level of 50. The PSNR values are: (a) noisy image, 14.69 dB; (b) BM3D, 23.64 dB; (c) SRR-A, 23.78 dB; (d) DnCNN-S, 24.81 dB; (e) DnCNN-B, 24.77 dB; (f) FFDNet, 24.86 dB; (g) MFENANN, 24.93 dB.
Electronics 10 00319 g005
Figure 6. Experimental results of several state-of-the-art algorithms for image “test045” in “BSD68” at a noise level of 25. The PSNR values are: (a) noisy image, 20.14dB; (b) BM3D, 31.75 dB; (c) SRR-A, 32.19 dB (d) DnCNN-S, 33.62 dB; (e) DnCNN-B, 33.58 dB; (f) FFDNet, 33.78 dB; (g) MFENANN, 33.95 dB.
Electronics 10 00319 g006
Figure 7. Experimental results of several state-of-the-art algorithms for image “test064” in “BSD68” at a noise level of 75.The PSNR values are: (a) noisy image, 10.63 dB; (b) BM3D, 22.11 dB; (c) SRR-DCT, 22.26 dB; (d) SRR-G, 22.45 dB; (e) SRR-A, 22.42 dB; (f) FFDNet, 23.16 dB; (g) MFENANN, 23.21 dB.
Electronics 10 00319 g007
Figure 8. Experimental results of several state-of-the-art algorithms for image “kodim05” in “Kodak24” at a noise level of 50. The PSNR values are: (a) noisy image, 14.14 dB; (b) CBM3D, 24.29 dB; (c) FFDNet, 26.32 dB (d) MFENANN, 26.61 dB.
Electronics 10 00319 g008
Table 1. Average PSNR (dB) values for images in “Set12” restored by plainNet, NANN, MFEN and MFENANN at noise levels of 15, 25, 35, 50 and 75. The bold numbers are the largest ones at each corresponding noise level.
Methods σ = 15 σ = 25 σ = 35 σ = 50 σ = 75
plainNet32.7530.4128.9927.2825.49
NANN32.8830.5829.0727.4825.66
MFEN32.9030.5929.0527.4825.62
MFENANN32.9530.6329.1427.5525.75
Table 2. The PSNR (dB) values for restored images from “Set12” using DenseMFENANN (DMFENANN) and MFENANN at noise levels of 15, 25, 35, 50 and 75. The bold numbers are the largest from the corresponding noise levels.
ImagesC.manHousePepp.Starf.Mona.Airpl.ParrotLenaBarb.BoatManCoupleAver.
σ = 15
DMFENANN32.4735.2233.3532.1332.8931.7931.9534.6632.4632.4232.4532.5032.86
MFENANN32.6235.3033.4932.2333.1131.8031.9934.7632.6132.4732.4832.6132.95
σ = 25
DMFENANN30.1333.4631.3929.6030.2229.1529.4732.6130.1030.2930.0630.2430.56
MFENANN30.2633.5131.0329.5830.5729.3129.5432.7630.2230.3330.1230.3430.63
σ = 35
DMFENANN28.6832.1529.3427.6828.6927.6628.0831.2628.4528.8328.7128.7229.02
MFENANN28.8132.3029.5727.8528.7927.6828.1331.3628.6028.9028.7628.8929.14
σ = 50
DMFENANN27.2930.7827.7225.9926.9325.8826.5729.6526.6627.3727.3227.2327.45
MFENANN27.3130.8427.7425.9927.0426.0526.7629.8326.9327.4327.3327.3027.55
σ = 75
DMFENANN25.4628.5925.8723.6824.8424.2625.0527.8524.2925.6425.7425.3425.55
MFENANN25.7129.2225.8223.8925.0824.3625.1328.0224.6125.7425.9025.4825.75
Table 3. Average PSNR (dB) values for images in “BSD68” restored by MFENANN which were trained with patch numbers of 577 × 10 3 and 1 × 10 6 . The bold numbers are the largest ones at each corresponding noise level.
Patches Number σ = 15 σ = 25 σ = 35 σ = 45 σ = 55 σ = 65 σ = 75
MFENANN-531.7329.2927.8226.8026.0025.3724.86
MFENANN-1031.7229.2927.8326.7926.0125.4024.89
Table 4. The PSNR (dB) values for restored images of “Set12” using several state-of-the-art algorithms at noise levels of 15, 25, 35, 50 and 75. The bold numbers are the largest from the corresponding noise levels.
ImagesC.manHousePepp.Starf.Mona.Airpl.ParrotLenaBarb.BoatManCoupleAver.
σ = 15
BM3D31.9134.9332.6931.1431.8531.0731.3734.2633.1032.1331.9232.1032.37
WNNM32.1735.1332.9931.8232.7131.3931.6234.2733.6032.2732.1132.1732.70
BDMGIN23.9633.2228.8530.3631.1830.5724.4832.8430.1030.6131.1229.3029.72
DnCNN32.6134.9733.3032.2033.0931.7031.8334.6232.6432.4232.4632.4732.86
FFDNet32.4235.0133.1032.0232.7731.5831.7734.6332.5032.3532.4032.4532.75
MFENANN32.6235.3033.4932.2333.1131.8031.9934.7632.6132.4732.4832.6132.95
σ = 25
BM3D29.4532.8530.1628.5629.2528.4228.9332.0730.7129.9029.6129.7129.97
WNNM29.6433.2230.4229.0329.8428.6929.1532.2431.2430.0329.7629.8230.26
BDMGIN25.3630.4527.8827.2128.2627.8326.4229.9427.2028.2128.2727.7827.90
MLP29.6132.5630.3028.8229.6128.8229.2532.2529.5429.9729.8829.7330.03
DnCNN30.1833.0630.8729.4130.2829.1329.4332.4430.0030.2130.1030.1230.43
FFDNet30.0633.2730.7929.3330.1429.0529.4332.5929.9830.2330.1030.1830.43
MFENANN30.2633.5131.0329.5830.5729.3129.5432.7630.2230.3330.1230.3430.63
σ = 35
BM3D27.9231.3628.5126.8627.5826.8327.4030.5628.9828.4328.2228.1528.40
WNNM28.0831.9228.7527.2728.1327.1027.6930.7329.4828.5428.3328.2428.69
BDMGIN26.3329.4727.3225.6426.6725.8126.3228.8625.8427.2126.9826.9426.95
MLP28.0831.1828.5427.1227.9727.2227.7230.8227.6228.5328.4728.2428.46
DnCNN28.6131.6129.1427.5328.5127.5227.9430.9128.0928.7228.6628.5228.82
FFDNet28.5431.9929.1827.5828.5427.4728.0231.2028.2928.8228.7028.6828.92
MFENANN28.8132.3029.5727.8528.7927.6828.1331.3628.6028.9028.7628.8929.14
σ = 50
BM3D26.1329.6926.6825.0425.8225.1025.9029.0527.2226.7826.8126.4626.72
WNNM26.4530.3326.9525.4426.3225.4226.1429.2527.7926.9726.9426.6427.05
BDMGIN25.8228.4525.9624.2625.3424.6225.4927.8024.6126.1626.1325.9325.88
MLP26.3729.6426.6825.4326.2625.5626.1229.3225.2427.0327.0626.6726.78
DnCNN27.0330.0027.3225.7026.7825.8726.4829.3926.2227.2027.2426.9027.18
FFDNet27.0330.4327.4325.7726.8825.9026.5829.6826.4827.3227.3027.0727.32
MFENANN27.3130.8427.7425.9927.0426.0526.7629.8326.9327.4327.3327.3027.55
σ = 75
BM3D24.3227.5124.7323.2723.9123.4824.1827.2525.1225.1225.3224.7024.91
WNNM24.6028.2424.9623.4924.3123.7424.4327.5425.8125.2925.4224.8625.23
MLP24.6327.7824.8823.5724.4023.8724.5527.6823.3925.4425.5925.0225.07
DnCNN25.0727.8525.1723.6424.7124.0324.7127.5423.6325.4725.6424.9725.20
FFDNet25.2928.4325.3923.8224.9924.1824.9427.9724.2425.6425.7525.2925.49
MFENANN25.7129.2225.8223.8925.0824.3625.1328.0224.6125.7425.9025.4825.75
Table 5. The SSIM values for restored images from “Set12” using several state-of-the-art algorithms at noise levels of 15, 25, 35, 50 and 75. The bold numbers are the largest from the corresponding noise levels.
ImagesC.manHousePepp.Starf.Mona.Airpl.ParrotLenaBarb.BoatManCoupleAver.
σ = 15
BM3D0.8970.8900.9060.8000.9390.8990.8960.9460.9650.9460.9390.9470.914
SRR-A0.8940.8790.8990.8950.9280.8940.8880.9480.9570.9370.9300.9340.915
BDMGIN0.7060.8590.8500.8840.9000.8850.7570.9360.9400.9250.9280.9170.874
DnCNN0.9110.8880.9130.9140.9480.9080.9030.9580.9630.9510.9450.9500.929
DnCNN-B0.9060.8870.9110.9120.9460.9070.9010.9580.9620.9500.9440.9510.928
FFDNet0.9110.8890.9120.9130.9470.9090.9040.9600.9640.9520.9460.9530.930
MFENANN0.9130.8900.9150.9160.9510.9110.9060.9610.9650.9530.9460.9540.932
σ = 25
BM3D0.8510.8590.8680.8500.9010.8550.8540.9250.9410.9050.8930.9090.884
SRR-A0.8350.8460.8560.8350.8880.8450.8400.9130.9170.8800.8720.8810.867
BDMGIN0.6570.7800.7790.7980.8240.8050.7230.8840.8860.8690.8670.8770.812
DnCNN0.8730.8620.8800.8690.9190.8680.8590.9310.9340.9130.9030.9130.894
DnCNN-B0.8660.8610.8790.8670.9140.8700.8530.9310.9350.9130.9030.9160.892
FFDNet0.8730.8610.8850.8650.9230.8720.8640.9390.9400.9170.9070.9210.897
MFENANN0.8770.8640.8890.8710.9250.8760.8660.9410.9420.9180.9060.9240.900
σ = 35
BM3D0.8180.8360.8320.8060.8690.8200.8170.8950.9110.8670.8490.8700.849
SRR-A0.7940.8140.8240.7800.8520.8040.7960.8780.8750.8320.8220.8260.825
BDMGIN0.6580.7530.7570.7460.7990.7500.7300.8650.8550.8360.8240.8430.785
DnCNN-B0.8330.8400.84700.8240.8780.8360.8270.9060.9040.8760.8610.8790.859
FFDNet0.8470.8470.8540.8260.8940.8430.8330.9170.9130.8860.8640.8900.868
MFENANN0.8460.8510.8610.8330.8950.8460.8350.9210.9170.8870.8700.8920.871
σ = 50
BM3D0.7780.8160.7920.7370.8210.7670.7790.8610.8700.8110.8020.8130.804
SRR-A0.7490.7590.7770.7130.8000.7490.7490.8220.8100.7690.7640.7470.767
BDMGIN0.6900.7310.7210.6940.7400.6820.7310.8370.8130.7960.7730.8010.751
DnCNN0.8030.8200.8100.7710.8470.7940.7940.8760.8540.8260.8070.8270.819
DnCNN-B0.8000.8200.8060.7690.8450.7920.7880.8720.8570.8280.8070.8280.818
FFDNet0.8090.8320.8180.7730.8560.8010.7990.8920.8700.8350.8180.8430.829
MFENANN0.8150.8370.8250.7830.8660.8120.8020.8940.8750.8360.8190.8510.835
σ = 75
BM3D0.7330.7620.7280.6600.7660.7120.7380.8130.8040.7370.7290.7290.743
SRR-A0.6540.6820.6890.6010.7240.6590.6850.7430.7120.6780.6830.6490.680
FFDNet0.7680.7870.7670.7040.7950.7480.7580.8460.8010.7680.7560.7650.772
MFENANN0.7770.8110.7800.7120.8130.7540.7640.8520.8060.7730.7590.7770.781
Table 6. Average PSNR (dB) for images in “BSD68” restored by several state-of-the-art methods at noise levels of 15, 25, 35, 50 and 75. The bold numbers are the largest ones at each corresponding noise level.
Methods σ = 15 σ = 25 σ = 35 σ = 50 σ = 75
BM3D31.0728.5727.0825.6224.21
WNNM31.3728.8327.3025.8724.40
MLP28.9627.5026.0324.59
BDMGIN29.3027.0826.0325.1019.10
DnCNN31.7229.2327.6926.2324.64
FFDNet31.6329.1927.7326.2924.79
MFENANN31.7329.2927.8226.3824.87
Table 7. The PSNR (dB) values for restored images from “Set12” using several methods with unknown noise levels. The bold numbers are the largest from the corresponding noise levels.
ImagesC.manHousePepp.Starf.Mona.Airpl.ParrotLenaBarb.BoatManCoupleAver.
σ = 26.2
BM3D28.8732.7829.8928.0829.0628.1328.4631.8730.4129.5229.3129.3729.65
BDMGIN25.3030.3127.8026.9227.9527.5626.5729.7126.9728.0228.0027.5527.72
CnDNN-B29.7932.9130.5828.9130.0428.9929.0832.2029.4929.9129.7929.8130.13
FFDNet29.7833.1230.7228.9329.8528.8229.1432.3429.8430.0429.8629.9830.20
MFENANN29.8433.3230.8729.2730.0629.1229.2532.5129.9330.1229.9630.0330.36
σ = 37.4
BM3D26.9831.2227.9626.2027.3826.3426.5330.1928.5927.9727.8727.5627.90
BDMGIN26.4629.4427.2025.3426.4625.7626.2228.7325.7926.9326.9326.7426.83
CnDNN-B28.3031.1628.6327.1528.2627.1927.6730.6327.6428.3928.2828.1528.45
FFDNet28.3931.8829.0227.2328.1927.1927.7030.9528.1728.5428.4228.4228.68
MFENANN28.4532.1929.1827.4828.2627.3427.7631.0628.2828.6028.4428.5128.80
σ = 48.6
BM3D25.1629.9126.3124.5225.7124.8424.9328.9526.8926.5126.7326.1926.39
BDMGIN26.1028.8326.1924.4325.4824.8525.5628.0424.7626.3126.3226.0326.08
CnDNN-B27.1330.0127.6025.8126.9625.8626.5829.3726.4127.2627.3226.9827.27
FFDNet27.2730.8027.7225.6827.0026.1626.6229.8526.8727.4427.3327.2727.50
MFENANN27.5231.0327.8726.0327.0426.2526.7829.9727.0527.4627.4127.4227.65
σ = 55.8
BM3D24.2828.8625.5223.6824.7824.0124.1428.1626.2125.7626.1125.4925.58
BDMGIN25.0327.0125.1323.0724.0723.4024.6826.6123.6625.2825.2925.0824.86
CnDNN-B26.5929.2426.4324.8526.1125.1525.8728.5725.4626.5826.5926.2126.47
FFDNet26.6630.0227.0825.2126.3325.5026.2029.2026.1226.8326.8726.6726.89
MFENANN26.7530.5027.1125.3026.5025.6526.2529.2626.3726.8726.9326.8027.02
Table 8. Average PSNR (dB) values for images in image sets “McMaster”, “Kodak24” and “CBSD68” which were restored by several state-of-the-art methods at noise levels of 15, 25, 35, 50 and 75. The bold numbers are the largest ones at each corresponding noise level.
ImagesetsMethods σ = 15 σ = 25 σ = 35 σ = 50 σ = 75
McMasterCBM3D34.0631.6629.9228.5126.79
CDnCNN33.4431.5130.1428.6125.10
FFDNet34.6632.3530.8129.1827.33
MFENANN34.8832.6231.1229.5127.67
Kodak24CBM3D34.2831.6829.9028.4626.82
CDnCNN34.4832.0330.4628.8525.04
FFDNet34.6332.1330.5728.9827.27
MFENANN34.7832.3130.7729.1927.50
CBSD68CBM3D33.5230.7128.8927.3825.74
CDnCNN33.8931.2329.5827.9224.47
FFDNet33.8731.2129.5827.9626.24
MFENANN34.0131.3629.7428.1326.44
Table 9. The average runtimes (s) of several state-of-the-art methods for images in “Set12” at noise levels of 15, 25, 35, 50 and 75. The bold numbers are the largest ones at each corresponding noise level.
Methods σ = 15 σ = 25 σ = 35 σ = 50 σ = 75
BM3D1.040.931.011.51.47
SRR-A15760372113
DnCNN-B0.220.220.210.210.21
FFDNet0.370.390.350.380.37
MFENANN0.480.480.490.470.49
Publisher’s Note: MDPI stays neutral with regard to jurisdictional claims in published maps and institutional affiliations.