1. Introduction
The key issues that concern and are studied by all military powers in the world today are: how to make use of the power of EW, how to better organize the operations of EW, and how to improve its effectiveness and role [
1]. However, because many factors affect the effectiveness of EW, each factor plays a different role in the application of EW, and the relationship between each factor and the effectiveness of EW is complex. To obtain objective and reliable effectiveness evaluation results, a large amount of observation data must be obtained and evaluated according to certain criteria [
2,
3,
4,
5,
6,
7]. However, the small number of data samples and many uncertain influencing factors caused by non-cooperation of the EW system has lead to EW being a poor information system [
8,
9].
Poor information systems, also known as grey systems, are characterized by partially known and partially unknown parameters, structure, and characteristics of the system [
10]. Grey system theory is a powerful tool to study the poor information system [
11,
12], and has achieved good application results in solving some problems of electronic equipment systems [
13,
14,
15,
16]. For the EW system, its status itself has strong randomness, fuzziness, incompleteness, imprecision, inconsistency, instability and differences, resulting in the factors affecting the effectiveness of EW not being fully understood, while they behave the combination of qualitative and quantitative information [
17,
18]. As a result, a distinct grey feature between the status can be observed. Grey correlation analysis considers the uncertain correlation among things, quantitatively analyses the degree of correlation among various factors, and finally obtains the degree of correlation between system effectiveness and related indicators, to make a judgment on its position in the system. Grey theory can comprehensively evaluate multi-target and multi-factor complex EW systems under the circumstance of insufficient information of EW, and provide richer evaluation information than other methods [
19,
20]. However, the application of Grey correlation in effectiveness evaluation is mostly based on the idea of ideal projection. In particular, using positive ideal evaluation matrix and negative ideal evaluation matrix as reference [
21], it is easy to ignore the impact of the excellence of local indicators. Besides, the values of positive ideal evaluation matrix or negative ideal evaluation matrix are often too extreme in decision-making, and decision-makers tend to set a more rational expectation. Besides, EW effectiveness evaluation involves a large amount of feature information including both self-characteristics and target attributes. It is difficult to build a model that considers all factors based on the relationship between features.
The uncertainty of the EW system also directly results in the uncertainty of decision-making in the process of equipment use. The multi-attribute decision-making method takes full account of various factors that affect system effectiveness and has been widely adopted in system effectiveness evaluation and optimization decision-making. To this end, the multi-attribute decision is an important research aspect of decision theory [
22]. To date, many research results have been achieved [
23,
24], and have been successfully applied in a number of fields such as engineering, management, and military. EW includes non-cooperative conflict confrontation among multiple unit systems and levels. EW systems and detection and communication systems are counterparts. For the EW task unit, the main concern is whether the EW system is effective for the detection and communication system, and the detection and communication system, as the target unit of the EW system, are more concerned about whether the detection or communication tasks can be effectively completed. Both of them can be understood as follows. Both the task unit and the target unit of EW need to know the status of both sides in a specific situation to take corresponding measures [
25,
26]. However, considering that there are many uncertainties in the system status of the two hostile parties, it is difficult to quantify the system status completely, which is the crux of the problem of EW effectiveness evaluation. The key to quantifying the status is the index. There are many indexes to evaluate the effectiveness of EW. It is an important task to select and quantify the system status reasonably in a large number of attribute characteristic indexes to determine the appropriate status of EW. In this way, the EW effectiveness evaluation problem can be abstracted into a multiple attribution decision-making (MADM) problem. In [
27], the authors combine the characteristics of air defense countermeasure with the methods of radar interference, analyses the factors that affect the radar interference effect, and put forward a model for evaluating the radar interference effect based on MADM according to the theory and method of MADM.
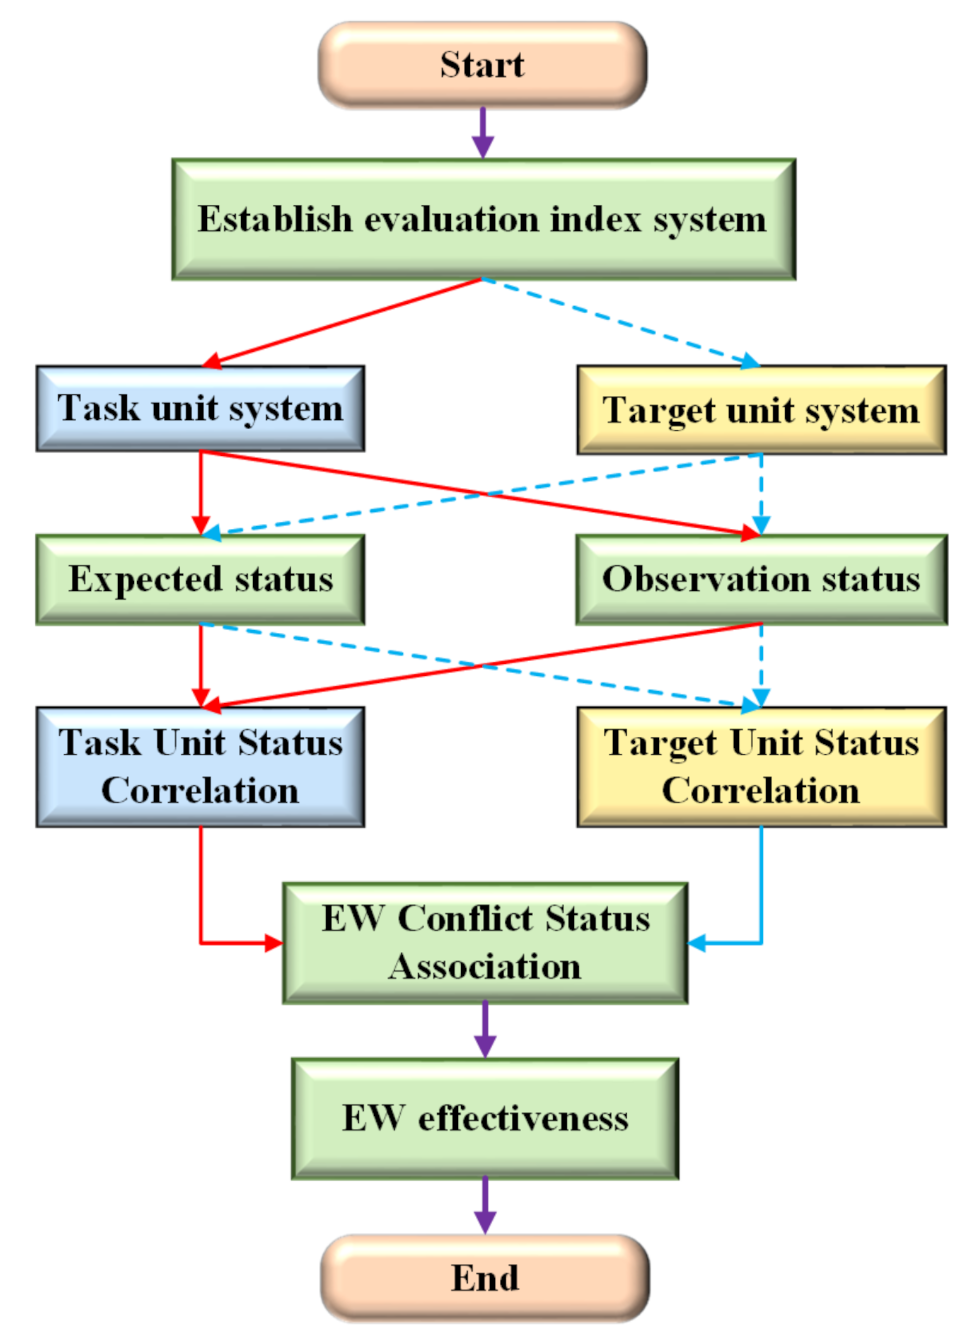
This paper deals with the problem of an imperfect evaluation index system and immature evaluation methods in the current EW effectiveness evaluation research. An analysis model to enhance the EW effectiveness evaluation index system through invoking conflict theory, correlation theory, multi-attribute status decision analysis, and grey theory is developed. More precisely, we first partition status into observation status and expected status, then model EW system effectiveness from the perspective of status conflict, and analyze the measurement method of the status attribute. We further propose a new EW effectiveness evaluation model fully reflecting the interaction between systems in the system. Therein we also analyze the application effect of the model from the two aspects of discrimination and robustness. Finally, we provide an example to examine the performance of the proposed model. The results show that the established model provides a new insight to overcome the shortcomings of single-angle system evaluation, improve the effectiveness of local indexes under the condition of meeting, and solve the high dependence of traditional EW effectiveness evaluation on target data.
The rest of the paper is arranged as follows. The first section is focused on the elaborate description of how to determine the index system of the EW. The second section considers the establishment of the EW status model, including the formulation of MADM mathematical problems, data acquisition and preprocessing of conflict status index, and EW status description. The third section analyzes the issues related to EW effectiveness from the perspective of conflict approximation. The last section shows an example of status conflict evaluation for EW effectiveness. The specific research ideas are shown in
Figure 1.
2. Determination of EW Conflict Status Effectiveness Evaluation Index System
Because of the complexity of the EW system, especially the systematic application of the EW system in recent years, many factors have an impact on the effectiveness of the EW system. It is often impossible to describe the EW system effectively by several indexes, but a series of indexes are needed to describe it. To ensure the scientificity of the evaluation results, a reasonable evaluation index system needs to be established. This section focuses on describing the index system of EW effectiveness evaluation around the conditionality and resource constraints of EW system effectiveness.
To evaluate the effectiveness of the EW system, it is necessary to first determine the index system of the EW system. The evaluation index system is an important part of the evaluation system. It refers to a set of indexes that can fully reflect the overall objectives and characteristics of the evaluated objects, and have internal links and complementary roles. EW effectiveness is not a real and directly measurable feature, so it is generally necessary to select the index that best reflects the change of target’s working ability according to the target’s function, and use the comprehensive processing of these indexes to get EW effectiveness. The construction of the index system depends not only on the performance and capability of the EW task unit itself, but also on the change of the status of the task unit and the target unit [
28,
29]. Therefore, the selection of the index must fully reflect the interaction between the EW task system and the target system. To this end, this section is focused on the elaborate description of how to determine the index system of the EW.
Before further proceeding, we first recall the idea of establishing the traditional EW effectiveness evaluation index system. In more detail, EW effectiveness first is divided into single effectiveness, system effectiveness, or operational effectiveness [
30], and then the specific indexes of these three parts are determined. However, the consistency of EW validity conditions inevitably leads to the poor independence of these three effectiveness indicators.
Actually, EW effectiveness evaluation is the process of quantitative calculation and qualitative analysis of task unit effectiveness and its impact [
31]. The purpose of the evaluation is to make decisions. The process is manifested by describing the status of the systems on both sides and determining the degree of threat and impact. The application value is to solve how to determine the best status of the EW system with limited resources and limited conditions.
As a result, this paper will establish the effectiveness evaluation index system relying on the two common perspectives of EW task unit system and target unit system condition restriction and resource restriction. The proposed index can not only characterize the main functions of EW equipment, but also reflect the sensitivity of its performance parameters, and significantly affect the operational process. It can truly exhibit the relationship and difference between different equipment and different operational effectiveness.
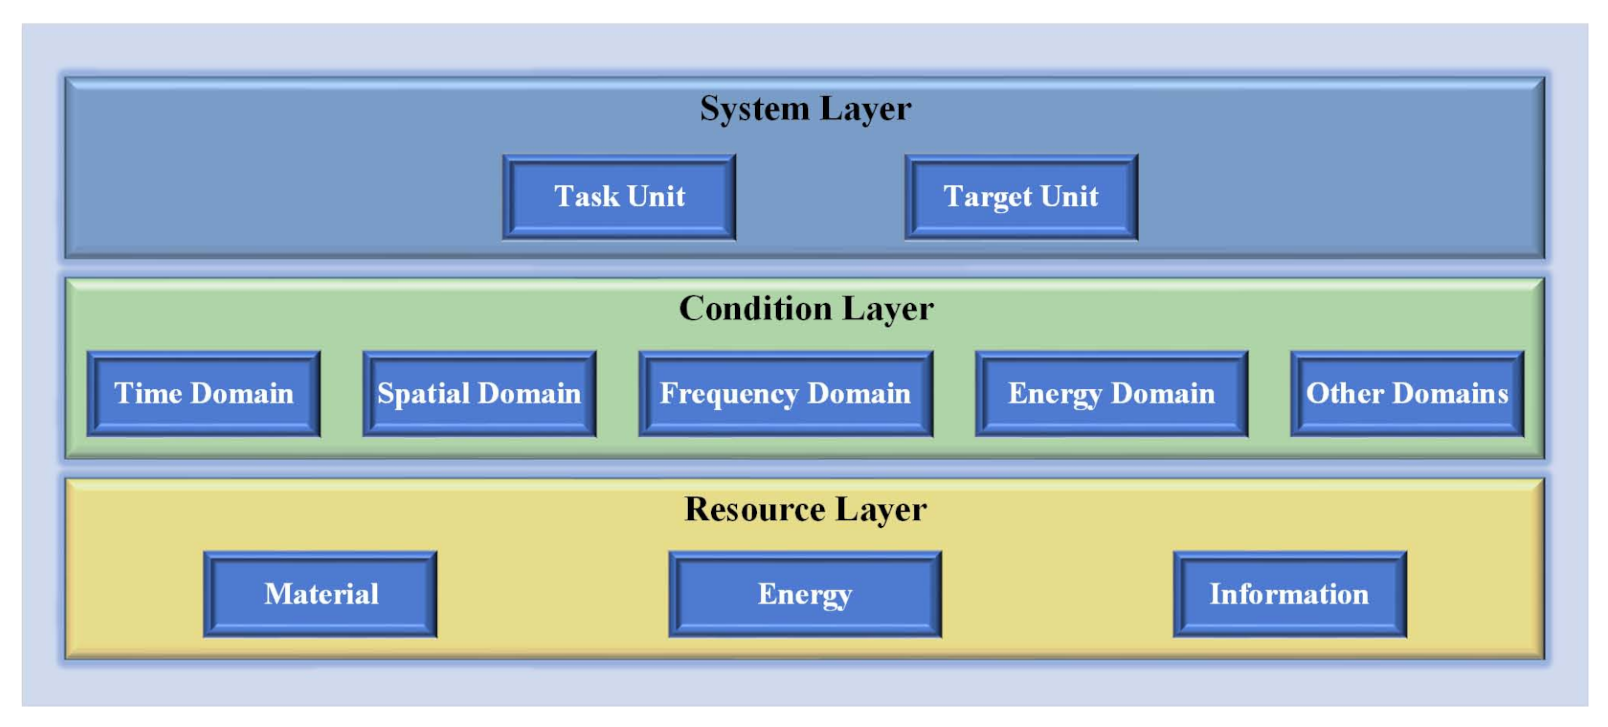
Now, we are going to first focus on analyzing the restrictions of EW conditions. It mainly takes into account the strong constraints of effective EW use, which are reflected in the time domain, spatial domain, frequency domain, energy domain, and other conditions’ domains. More specifically, the time domain denotes the time consumed for reconnaissance, interference, and resource management (information processing), platform motion adjustment, etc. The spatial domain means the maximum coverage of antenna beams in space and the directional coverage of interference beams at any time during reconnaissance and interference, etc. Frequency domain index primarily includes the coverage of target unit frequency and instantaneous coverage in the process of receiving/radiating signals by electronic reconnaissance system, electronic interference system, and electronic attack system. Finally, the energy domain shows the energy or power requirements for signal transmission and processing during reconnaissance and interference, etc.
Of course, all of the above conditional domains are essentially attributed to the resource limitations of EW, which are mainly reflected in material, energy, and information, defined as follows, respectively:
The material stands for all platform systems related to EW. In particular, the status changes of cooperative and non-cooperative platforms will directly affect the application of the EW operation system.
Energy denotes the material transformation for the non-cooperative transmission (electronic interference) and perception (electronic reconnaissance) of electromagnetic information in the environment and the destruction of repression (electronic attack). The injection of non-cooperative energy will increase the environmental awareness of the EW mission unit and reduce or deprive the target unit of its environmental awareness.
Information is the required data that was processed for the needs of decision-making in EW. In particular, the injection of non-cooperative intentional information will affect the response of the EW task unit to the target unit, increasing the uncertainty of the target unit’s perception of external information.
Overall, the description of multiple condition domains by material layer, energy layer, and information layer covers the whole index system of EW. EW effectiveness is the quantitative and qualitative description of the coupling degree between the actual situation and the given task of a task unit. The degree of coupling depends on the material, energy, or information conflict interaction between the task unit and the target unit in a specific battlefield environment. The effectiveness depends on the capability accessibility and task completion.
Based on the above analysis, the EW effectiveness evaluation index framework is established, as shown in
Figure 2.
Each conditional domain is split into the material, energy, and information resources. Further, material, energy, and information indexes are decomposed into multiple next-level evaluation indexes as needed. Due to the functional differences and resource requirements of each limitation, and because the evaluation objectives are different, the differences between them can have a significant impact on the evaluation results. Tasks are usually combined in weight to indicate their relative importance. Compared with the traditional construction ideas of the index system, such a division on the one hand improves the independence between the indexes. On the other hand, it makes the evaluation easier to focus on issues at the essential level.
3. EW Status Model
After the index system is established, the status of the EW system can be described by the index system. The process of describing the status with the index system is the process of building the EW status model. This section is focused on the establishment of the EW status model, including the formulation of MADM mathematical problems, data acquisition, and preprocessing of conflict status index and EW status description.
3.1. MADM Mathematical Problems under the Condition of EW Status Conflict
This subsection mainly establishes the EW status conflict system model. On this basis, the conflict problem is transformed into the MADM mathematical problem to be described.
EW is a set of measures and actions that actively affect the electromagnetic environment of the battlefield by various means. All the involved unit systems constitute a closed and broad EW system. The basic elements of the system are the EW task unit system and the EW target unit system [
32]. In the system, the task unit system imports materials, energy and information resources from the outside world, and outputs materials, energy and information resources to the outside world, which affects the status of the target unit entity. The status is restricted by conditions and tasks, and the mechanism of action of different means is also different.
According to the physical characteristics of the EW application, the functional processing architecture of the task unit and target unit interacts in multiple common condition domains. The purpose of the interaction behavior is to try to reduce the other party’s effectiveness, thus forming a conflicted relationship in the field of matter, energy, and information. For the convenience of quantitative research, the conflict relationships are viewed as conflicts between different statuses of the system. Changes in conflicting relationships are seen as changes in statuses, and different decisions change the status of the system in different directions. Therefore, the conflict between the task unit system and the target unit system is transformed into a status change problem for analysis. First, we define the EW Status Conflict System
S as [
33]:
where
,
denotes the various unit systems in the system, and
represents the status conflict relationship between the EW task unit system
and target unit systems
. Task system mainly refers to all kinds of systems used in the implementation of EW tasks, such as reconnaissance aircraft and jammer. Target system mainly refers to the target party of EW operations, such as radar, communication radio, etc.
To a certain extent, the physical meaning of the EW system can be made clearer by selecting indicators and collecting data from the status perspective. Letting
, the system
status set is
, where
X represents the
j status that system
may be in, and
X is essentially a set of decision schemes. Setting
, the status attribute set
indicates that different systems may have different working modes and conditions, and the utilization of resources will affect the criteria adopted in the evaluation of EW. Matrix
, where
is the values of the status
of the system
measured by the index
. In particular,
is the original description of the status of the EW task unit system, and provides the basic information of the effectiveness evaluation. The row
j vector of
A is the conflict effect of the target unit on index
on status
; the column
k vector of
A is the conflict effect of different EW task unit statuses on target unit status on indicator
. Generally, the system attributes contain both qualitative and quantitative indexes. In the process of acquiring system status attribute data, because of the non-cooperation of EW, the data can only be measured directly in part, and the remaining part needs to be determined by judgment. This makes the status attribute have some uncertainty, which is expressed in Grey scale. Assume that the Grey scale set of indicators is
, where
denotes the Grey scale of
. Denote the index weight set by
, where
is the status attribute weight to be determined satisfying
. Finally, the five tuples
constitute a complete MADM mathematical problem in the status conflict system
[
23,
34].
It is worth mentioning that the ultimate goal of EW effectiveness evaluation is to obtain the correlative ordering result of the EW task unit system status to target unit system status, to provide the basis for status change.
3.2. Data Acquisition and Preprocessing of the Conflict Status Index
This subsection mainly introduces how to obtain the index data in the conflict system, and gives a non-dimensional data processing method, so that the status indicators of different units or magnitudes can be compared and weighted [
35].
3.2.1. Data Acquisition for Conflict Status Index
For the status of the EW system, the data of the status conflict index can be obtained as follows:
Actual observation: Use various channels or electronic reconnaissance equipment to monitor the value and obtain the measurement data directly.
Analytical calculation: By establishing the mathematical model of the EW status index and substituting the observed data, the status index data can be obtained.
Simulation analysis: By establishing the status simulation model of the EW task unit, substituting observation data, and introducing random variables, repeated experiments are carried out to obtain status index data.
Qualitative analysis: Qualitative comparison is exploited to obtain index data that cannot be directly measured, modeled, or simulated.
3.2.2. Normalization of Evaluation Indexes
After obtaining various status index data, the system status attribute dimensions may involve more data, which is not conducive to calculation and analysis. To facilitate status comparison and analysis, unit limitations of data need to be removed and dimensionless standardization processed. In multi-attribute decision-making problems, attribute types are usually divided into benefit, cost, fixed, and interval. Practice proves that the EW system indexes are more commonly of the benefit (such as interference duration, frequency coverage) and cost (such as system response time, interference accuracy, radiation power) types. Considering the uniformity of reference standards between statuses, this paper selects the range transformation method (standard 0–1 transformation) to standardize the evaluation indicators [
36]. The specific process is as follows:
is the worst status index matrix, which constitutes the infimum of the status, where is the lower bound value of the index of . When the value is below , the function of the EW system unit is no longer available.
is the ideal status index matrix, which constitutes the supremum of the status is the upper bound value of . When the value approaches , the system approaches the ideal task status.
For the determination of the worst status and ideal status , there are different methods under different requirements for EW evaluation. When evaluating effectiveness at the technical level, it can be determined based on the boundary value of the selected index parameters; when evaluating it at the equipment level, it can be determined based on the performance range of the normal operation of the equipment index; and when evaluating at the application level, it needs to be determined based on the task scenario. Some cases can be obtained by measurement, while others need to be set based on empirical values or actual conditions.
is the standardization value of
. As to benefit indexes:
For example, in the course of Aviation EW operation, to effectively shield one’s own aircraft, it is necessary to ensure that the shielded aircraft is within the interference beam range. In order not to affect the maneuverability of the mission aircraft, the wider the interference beam, the better. At this time, the interference beam of the jammer is a benefit index.
The cost indexes are computed as:
For example, there is often a conflict between the power supply and jamming power of the jammer, which is a key problem in equipment development. In actual operations, it is often desirable to use less jamming power as needed. So jamming power is a typical cost index.
After dimensionless processing of all data in matrix
A, a decision matrix
B for EW effectiveness evaluation can be obtained:
B is the normalized status matrix for EW effectiveness evaluation.
3.3. EW Status Description
This subsection mainly describes the static status model based on the acquisition of the status index data, and analyzes the incentive control problems of the conflict status, which provides the basis for the status approximation analysis and correlation.
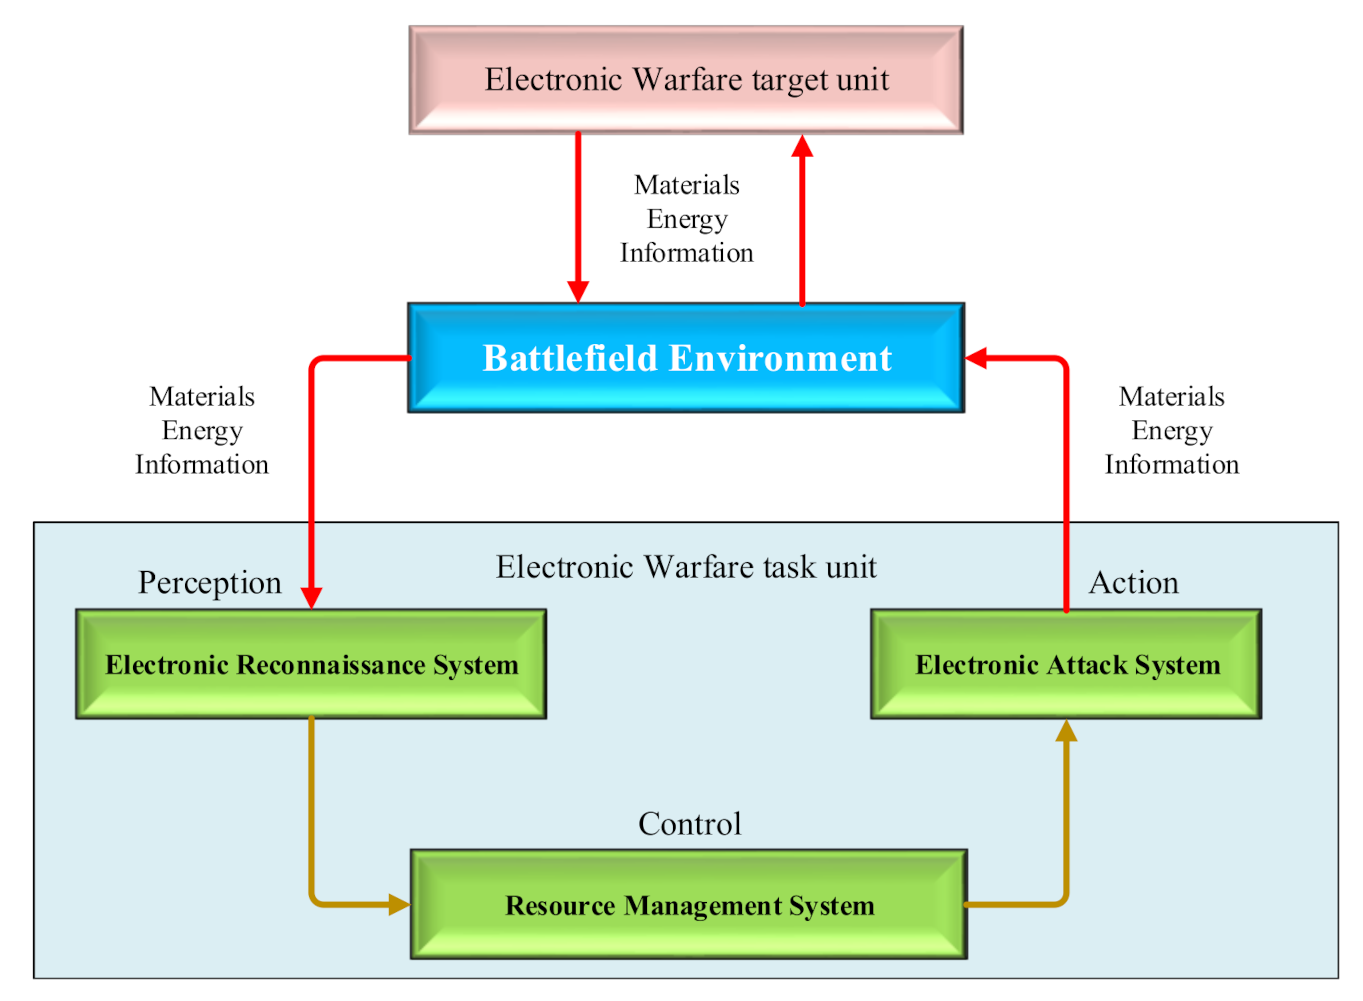
The EW task unit system and the target unit system form a closed-loop feedback system, as shown in
Figure 3. For the ever-changing electromagnetic environment, the task unit system controls its adaptive resource allocation within the system to achieve accurate output by perceiving the appearance and change of external substances, energy, and information.
There are many uncertain factors in the transfer or flow of materials, energy, and information throughout the EW task unit system, which conflict with the cooperative transfer or flow of the target unit on status attribute V. To represent conflicts at a given time, we use a static status model.
3.3.1. Static Status Model
In the status conflict system,
can be expressed as a set of resource attributes
,
and
class indexes. Status
can be expanded to represent as
:
Weight represents the set of , and , where the attribute weight satisfies .
Letting, , , , is attribute weight sets, where is the status attribute weight to be determined satisfying . , is attribute weight sets, where denotes the status attribute weight to be determined fulfilling . , is attribute weight sets, where is the status attribute weight to be determined, and .
Based on the previous discussion, the status matrix
is written as
:
The weight matrix
is given by:
Assume that
denote the Grey scale of attribute indexes
,
and
, respectively, where
is the grey set of attribute index
,
is the grey set of attribute index
, and
is the grey set of attribute index
. Then the grey matrix is:
The status
is computed as:
which stands for the grey sequence of status attributes.
is the Hadamard products of
and
. At this time, the corresponding
of
is the static conflict status grey matrix sequence about the material, energy and information of resource attributes.
3.3.2. Conflict Status Control
Status control aims to seek the excitation control for , and transfer or flow. In the process of system conflict, changes following the change of under certain external excitation conditions. By introducing the excitation operator , the observed values of , and will change correspondingly under the combined action of forward excitation and reverse control, thus changing the status of the whole system. are used to represent the incentive control of material, energy and information respectively, which are the manifestations of the status change incentive factor . The transmission or flow of material, energy, and information are mainly affected by the incentive control.
Set
as the control variable of attribute index
,
and
respectively, where
is the set of control variables for attribute indicator
,
.
is the set of control variables for attribute indicator
,
.
is the set of control variables for attribute indicator
,
. System control matrix
U is:
The status of the system can be expressed as:
In the formula, represents the Grey sequence of dynamic status, correspondence is the dynamic conflict status grey matrix sequence of materials, energy, and information about resource attributes.
4. Conflict Status Approximation Analysis Model for the EW System
Whether it is a task unit system or a target unit system, there are two statuses at any time: the observed status and the expected status. Both statuses are described based on the same index system. The EW effectiveness should be able to reflect the proximity and correlation between the observed and expected status of the task unit system and the target unit system. Therefore, this section analyzes the issues related to EW effectiveness from the perspective of conflict approximation. Specifically, the degree of correlation between the observed state and the expected state of the cell system is analyzed first. The relationship between the state associations of the two cell systems is then analyzed.
4.1. Basic Ideas of Status Approximation Analysis for EW
The resolution of EW conflict status is based on the system model. Conflict models are used in theory, device experimentation, or practice to understand the status of the EW system. An effective evaluation method is to consider the degree of status correlation under conflict and interaction.
Based on the previous analysis, is a time-varying sequence of statuses. The correlation between the pre-sequence and post-sequence Status of has great theoretical value in the study of EW effectiveness evaluation.
Considering that the possible status of the system is infinite, but the expected status of the task is limited, the expected status can be determined by system performance, tasks, etc. In the course of the application of EW, the best performance of the system can be achieved by choosing appropriate strategies to adjust the control status change to approximate the expected status.
Therefore, the status of the EW task unit is divided into two statuses, expected status
and observed status
. According to reference [
37],
is the system status under the condition that the system meets the requirements and targets;
is the system status under the current operational conditions. For example, in the process of shielding jamming, to achieve effective jamming, the power of the jamming signal emitted by the task unit needs to reach 100 W. However, due to various constraints such as the power supply of the jammer, the power of the current radiated signal can only reach 85 W. At this time, the power requirement of 100 W is what we call the expected status value, and that of 85 W is the observed status value.
According to
, task unit and target unit belong to the direct confrontation status. Set
and
to the expected status of
and
,
and
to the dynamic observation status of
and
respectively, and
p() is a monotonically increasing polynomial function. Then there are:
The above formula indicates that the index parameters between the task unit and the target unit are inversely proportional during the conflict process. Taking the frequency coverage of effective jamming target as an example, in the course of jamming implementation, keeping the frequency coverage of the jammer unchanged, increasing the working bandwidth of the radar frequency; thus, the radar operational effectiveness may be improved, and the jammer effectiveness may be reduced.
The first-order partial derivatives of
and
with respect to time
t will stabilize when
, and the ratio of them will converge to the constant [
32]. This relationship is described as follows:
The physical meaning of partial derivation represents the direction and intensity of status changes between task units and target units over time. The statuses that converge to a constant are their expected statuses. By analyzing the relationship , the degree to which approaches due to the change of , the status approximation can be obtained under the constraints of the EW system resources and conditions.
Compared with the traditional ideal status [
38], the expected status is more achievable and is even beneficial in addressing the effectiveness optimization problem when multiple statuses satisfy the expected status. Hence, the evaluation based on the expected status is more valuable. Because of the strong antagonism of electronic warfare and the randomness of the changing process of the status of both sides of the conflict, [
39] analyses the transition process of the conflict statuses by establishing conditional status space. Considering that selection analysis based on multiple static statuses is the basis of dynamic status optimization, this paper focuses on sorting the selection of static conflict statuses.
4.2. EW Status Conflict Grey Correlation Matrix
Grey correlation analysis is a method to analyze and determine the degree of influence or contribution of factors to the main behavior of the system by using Grey correlation degree. The basic idea is to distinguish the degree of correlation among multiple factors in the system by comparing the similarity of the curve shapes of the system statistical series [
40,
41]. In this respect, this subsection uses the Grey correlation to analyze the relationship between the observed status and the expected status.
4.2.1. Establish Status Matrix Sequence
In the EW conflict status system, the grey system described by the matrix sequence is used to analyze each status. Previously,
A is the set of status matrix sequences,
is the grey sequence of system expected status matrix, and
is the grey sequence of observation status matrix, then we have:
Since the selection of the index system is attributed to the description of the characteristic attributes from the perspective of material, energy and information, any , in the formula is a matrix.
4.2.2. Normalization of Indexes
The supremum status matrix is constructed as:
The infimum status matrix is defined as:
Based on the supremum status matrix and the infimum status matrix, the
-th index data of the
-th resource of the status matrix is normalized. The expected status matrix sequence after normalization is defined as follows:
The observation status matrix sequence is written as:
4.2.3. Calculation of Status Correlation Matrix
Letting
,
. The Grey correlation difference sequence items are defined as:
and
where
and
are the maximum distance environment parameters and the minimum distance environment parameters, respectively. Its physical meaning is to reflect the influence of the entire EW system on the degree of correlation of individual status parameters.
Define the Grey correlation coefficient of the status matrix according to
and
:
where
is the resolution factor determining whether the matrix Grey correlation has a better discriminatory
. In general, the value of
is set to 0.5.
4.2.4. Weight Setting
Assume that the weight coefficients associated with the sequence number
y,
and
in
satisfy, respectively:
4.2.5. Grey Correlation
Focusing on the Grey correlation coefficient based on the weight factor gives the Grey correlation degree of the observed status matrix series relative to the expected status matrix series, which is represented by the normalized approximation validity factor
:
where
represents the similarity of the correlation between the expected status and the observed status, but does not reflect the resistance of EW.
4.3. EW Status Correlation
To accurately measure the EW effectiveness, the effectiveness of the target unit and the status of the unit status need to be considered. It is a function of both sides approximating the validity factor. According to the characteristics of the EW mission, the better the task unit system approaches the expected status, the better the target unit system is away from the expected status, and the theoretical value range is
. Considering the influence of external environment, the boundary status is not advisable and the range of values should be
, and there is a reverse relationship between them. The analysis shows that the effectiveness brought by system material, energy, and information resources has the trend feature of a
S-shape curve in essence, which is based on the consideration of the physical meaning of electronic reconnaissance equipment index parameters. Normalization using a non-linear derivable
S-shaped function highlights the saturation characteristics of the index parameters. On the one hand, the index parameters of electronic reconnaissance equipment have their physical or technological limitations; on the other hand, the effectiveness brought by the improvement of the index performance between the electronic reconnaissance task unit and the target unit also tends to have a
S-shaped curve in nature, that is, the improvement of one side’s effectiveness is bound to be the decrease of the other side’s effectiveness. So, if the Grey correlation of the actual status matrix sequence of the target unit with the expected status matrix sequence is
, the relationship between
and
is represented by a Logistic curve [
42]:
where
,
and
are the constants of relationship adjustment, which are set according to the actual situation.
denotes the correlation between
and
, and its physical meaning is to denote the degree of interaction status correlation, that is, whether the effectiveness is due to the other party. This establishes a measure of EW effectiveness from the perspective of conflict.
As can be seen from the above formula, increasing
to maximize the distance between
is the key to improving
. The ECM-ECCM antagonism matrix is used to express the antagonism relationship between the two sides and measure the effectiveness of EW [
43,
44].
EW System
Status Effectiveness
is computed as:
where
is the probability that status
k of the target cell system approaches the expected status. Obviously,
In this case, , whose physical meaning is the performance of the task unit in a certain status. The performance corresponding to each status is calculated and weighted based on the probability or weight to sort multiple static statuses.
4.4. Effectiveness Evaluation Steps for Multi-Domain Conflicts Approaching Expected Status
Based on the above analysis, the EW effectiveness evaluation algorithm steps based on the validity association distance of multi-domain status conflicts are as follows:
- (1)
Establish the system conditional feature attribute set, quantify the status according to the status description, and construct the original conflict status matrix;
- (2)
Construct the expected status matrix according to the task requirements and the actual capabilities of the system;
- (3)
Obtain standardized status matrices by dimensionless processing of the supremum and infimum status matrices based on the requirements;
- (4)
Calculate the status correlation coefficients according to the standardized status matrix, and construct the status correlation matrix;
- (5)
Determine the index weight, and construct the weighted correlation matrix based on the index weight set;
- (6)
Calculate the correlation between the actual status and the expected status of the EW mission unit and the target unit, respectively;
- (7)
Construct an antagonistic matrix of approximation validity factors;
- (8)
Calculate the effectiveness of the task unit in the possible status according to the probability distribution of the target unit status;
- (9)
Evaluate the operational effectiveness of the EW.
5. Simulation Example and Discussion
5.1. Experimental Simulation
Reconnaissance is the foundation of EW. Only effective reconnaissance can ensure the effectiveness of interference and anti-radiation attack. Electronic reconnaissance aircraft can mount a variety of different reconnaissance equipment according to different tasks, and quickly return the collected reconnaissance information to the ground or other air operations platforms. Electronic reconnaissance aircraft need to complete many reconnaissance tasks such as battlefield situation awareness, electronic reconnaissance, and data information transmission under a complex electromagnetic environment. Airplanes also need to be able to defend themselves against threats from the air and the ground. Suppose there are three types of electronic reconnaissance aircraft that need to be evaluated for their reconnaissance effectiveness. This subsection evaluates the effectiveness of the EW system based on the conflict status Grey relational model. Some parameters and conclusions of the article [
13,
38,
45] are evaluated according to the reconnaissance parameters of the three EW systems.
We divide the reconnaissance index values into two feature attribute domains, each corresponding to three indicators, and the normalized observation status matrix is shown in
Table 1, where
and
are the benefit indexes and the rest are cost indexes.
Usually, there are many indexes for EW system effectiveness evaluation, and the internal correlation is complex, so it is not easy to unify and quantify them. To eliminate the impact of the dimensions and values on the evaluation results, the data of each index value needs to be normalized and all index data mapped to the same interval. Thus,
Table 1,
Table 2,
Table 3 and
Table 4 in this paper are normalized index values.
Traditional Grey correlation analysis is mostly based on fully unsatisfied values. This paper divides the indexes into three types, fully unsatisfied: no indicators’ data have reached the expected status; partly Satisfied: some indicators’ data have reached the expected status; completely satisfied: all indicators’ data have reached the expected status. The effectiveness evaluation under three index statuses directly affects the rationality of decision-making.
We construct the expected status matrix according to the system task requirements and actual capabilities and normalize it based on the reference matrix to get the normalized expected status matrix, see
Table 2:
For the traditional ideal status, decision-making is difficult or even impossible to achieve. For the expected status, it is a reasonable consideration based on the full understanding of the reconnaissance equipment’s own capabilities, which is achievable. For example, we always hope that the frequency of the reconnaissance receiver can completely cover the working frequency of the reconnaissance target. However, it may only cover a part of it due to its own antenna limitation or working system. In the evaluation process, as long as we set the expected value to a reasonable coverage range, it is more conducive to grasp the actual effectiveness of the equipment, rather than set the expected value to complete coverage.
According to the calculation (see
Appendix A for calculation process), we set the target unit status selection probability equal weight, that is, all
, to obtain the effectiveness of three types of electronic reconnaissance equipment:
Of course, in the actual analysis process, the probability of target unit status selection may have an empirical tendency. This requires a combination of considerations and settings based on the actual situation. The assumption of the same probability here is to make the analysis more generally.
Using the weighted analysis method, the effectiveness of the three statuses is , and that of the ideal Grey correlation projection is , which is consistent with the order of . It can be seen that this method can truly reflect the expected performance of the task unit and has strong robustness after fully considering the target status.
For the above simulation examples, the status normalized data is not completely satisfied (see
Table 2). For partially and completely satisfied status normalized data see
Table 3 and
Table 4.
According to and , it is known that by adjusting and optimizing local parameters, the effectiveness can change greatly, which is the ultimate purpose of effectiveness evaluation.
5.2. Association Discrimination Analysis
Because there is no uniform dimension and contradiction between the operational effectiveness evaluation indexes of the EW system, there is generally no so-called optimal solution for the actual evaluation problem, only the satisfactory solution that the evaluator thinks satisfied with all the target values can be obtained. The evaluator evaluates and judges all the EW systems through various evaluation models and algorithms, which requires that the EW evaluation models have sufficient differentiation to identify and rank the operational effectiveness of the EW systems. To ensure universality, we define the association discrimination [
45]:
The greater the distinction, the better the model and algorithm can evaluate the effectiveness of the status. The discrimination between the three methods is shown in
Figure 4 and
Table 5.
The analysis shows that the result of conflict status association analysis and evaluation method has good discrimination whether it is fully or partially satisfied or fully satisfied. In particular, when the index is partially satisfied (the most probable situation in the process of using EW), the result discrimination effect is very good. For the fully unsatisfied situations, the variance of the results obtained by the three methods is respectively calculated. The conflict status association method is 0.0036, the ideal grey correlation projection method is 0.0096, and the weighted sum method is 0.0005. Changing the expected status matrix, when the variance of the conflict status association method is identical to the variance of the weighted sum method, the mean discrimination value is 7.3778%, which is 1.9483 times the weighted sum. When the variance of the conflict status association method is the same as that of the ideal grey correlation projection method, the mean discrimination value is 27.6259%, which is 1.0499 times that of the ideal grey correlation projection method. The conflict status association method has slightly better discrimination than the ideal grey correlation projection. The variances of the association discrimination of the three methods are calculated respectively. The ideal grey correlation projection method is 0.0547, the conflict status association method is 0.0205, and the weighted sum method is 0.0226. The smaller the variance, the better the stability. Therefore, the conflict status association method is the smallest and has the best stability. In summary, the conflict status association analysis evaluation method is significantly better than the weighted sum method, and the discrimination degree is more stable than the ideal grey correlation projection method. Conflict status association analysis and evaluation process fully consider the status of both sides of the conflict in EW, effectively reflects the change and impact of the conflict status between the task unit and the target unit in the course of the application of EW, and the evaluation results are more credible than the single evaluation. It is worth mentioning that this method also has a good distinguishing effect when the task conditions are satisfied by every status (i.e., the expected status is achieved).
5.3. Error Analysis of Observations
EW effectiveness analysis based on conflict status depends on the acquisition of observation status and expected status. Especially in the observation status, the acquisition of observation values takes place under certain conditions. Due to the external environment, the observer’s technical level, and the data acquisition instrument itself, it is unavoidable to cause the generation of observation errors. Specifically to the EW system, frequency alignment and azimuth alignment are necessary conditions for the jammer to achieve effective interference. Whether the jammer can achieve frequency alignment and azimuth alignment largely depends on the frequency and direction finding performance of the reconnaissance aircraft. Therefore, in the presence of errors in frequency and direction detection of radar reconnaissance aircraft, only from the power and gain of the jammer, the effectiveness evaluation of the EW system can not fully reflect the overall capabilities of the system [
46]. Therefore, it is necessary to treat the EW system as a whole, to fully consider all possible observation errors, and analyze its impact on the effectiveness of the EW system.
To facilitate comparison, we kept the expected status matrix and other simulation conditions unchanged under completely unsatisfactory conditions, added random errors to the normalized observation status index, and analyzed the effect of observation errors on the results. The results are shown in
Table 6.
It can be seen from the above table that when the error range is 10‰ (No. 1, 2, 3), since the minimum distance between the observed value and the expected value is 0.01, the index satisfaction status is completely unsatisfied. The simulation results are consistent with and have good discrimination. When the error range is from 10‰ to 25‰ (No. 4, 5, 6), the index status may be in a completely unsatisfied status or partially satisfied. The result is consistent with that of , and also has good discrimination. When the error range is 50‰ (No.7), the index status may be in a completely unsatisfied status or partially satisfied. The result is inconsistent with , and , but the discrimination is still good. Since the normalized maximum observed value is 0.95 and the error range cannot exceed 50‰, no analysis is performed in this paper. The analysis shows that the relationship between the satisfaction status of indicators and the expected status has a great impact on the results. When setting the indicators, it is necessary to set them reasonably according to the actual needs, or to clarify the status of the system, so that the evaluation results have more guiding significance. Besides, the method proposed in this paper is less affected by the error in the result discrimination, even when the status is uncertain.
6. Conclusions
As the role of EW becomes more and more important in future wars, the need for evaluating the effectiveness of EW is increasingly urgent. However, due to the confidentiality of the frequency, power, signal style of the target unit in the actual application, it is difficult to ensure the guidance for the actual operational decision-making by relying solely on the results of the EW effectiveness evaluation given by training. Starting from the non-cooperative nature of EW, this paper presents an analytical model based on conflict status association through status analysis. The specific work is summarized as follows:
- (1)
Based on the analysis of conditional and resource constraints, the system framework of EW effectiveness evaluation index with task unit and target unit as system layer, time domain, airspace, frequency domain, energy domain, and other domains as a conditional layer, and material, energy, and information as resource layer is established.
- (2)
Based on establishing the status conflict model of EW, the conflict problem of EW is transformed into a MADM problem. The status data processing is introduced, and the conflict status of EW is analyzed based on the resource conflict relationship.
- (3)
The idea of effectiveness evaluation based on the correlation analysis of status approximation degree is presented. The grey correlation method is used to analyze the approximation degree of observation status and expected status. The approximation degree of the task unit and target unit is correlated by the ECM-ECCM matrix.
- (4)
The effectiveness of EW is evaluated by associating the approximation degree of task units with target units. The reliability, discrimination, and error resistance of the method are analyzed with a specific example.
Based on all the above work, the problem of EW effectiveness evaluation from a single point of view in the past is avoided, and the high dependence of traditional effectiveness evaluation theory on target data is solved. Considering that there may be a loss in the acquisition of status observations and the impact of status uncertainty on the evaluation results when there are large observation errors, related studies such as status value preprocessing and status recognition adjustment will be carried out in future work. Besides, in a follow-up study, we will further improve the case scenario, strengthen the verification and perfection of the method from the aspects of electronic reconnaissance, electronic interference, and anti-radiation attack, and set up a hardware platform environment to analyze the feasibility of this method in order to enhance the theoretical and practical aspects of the method.


